metabolic regulation of cellular plasticity in the pancreas · metabolic regulation of cellular...
TRANSCRIPT

Metabolic Regulation
Current Biology 23, 1242–1250, July 8, 2013 ª2013 Elsevier Ltd All rights reserved http://dx.doi.org/10.1016/j.cub.2013.05.037
Report
of Cellular Plasticity in the Pancreas
Nikolay Ninov,1,2,* Daniel Hesselson,1,3,4 Philipp Gut,1
Amy Zhou,1 Kevin Fidelin,1,5 and Didier Y.R. Stainier1,2,*1Department of Biochemistry and Biophysics, Programs inDevelopmental and Stem Cell Biology, Genetics and HumanGenetics, the Diabetes Center, Institute for RegenerationMedicine and Liver Center, University of California,San Francisco, 1550 4th Street, San Francisco, CA 94158, USA2Department of Developmental Genetics, Max Planck Institutefor Heart and Lung Research, Ludwigstrasse 43, 61231Bad Nauheim, Germany3Diabetes and Obesity Program, Garvan Institute of MedicalResearch, Sydney, New South Wales 2010, Australia4St. Vincent’s Clinical School, University of New South Wales,Sydney, New South Wales 2052, Australia5Centre de Recherche de l’Institut du Cerveau et de la Moelleepiniere, Universite Pierre et Marie Curie, 75651 Paris, France
Summary
Obese individuals exhibit an increase in pancreatic b cell
mass; conversely, scarce nutrition during pregnancy hasbeen linked to b cell insufficiency in the offspring [reviewed
in 1, 2]. These phenomena are thought to bemediatedmainlythrough effects on b cell proliferation, given that a nutrient-
sensitive b cell progenitor population in the pancreas hasnot been identified. Here, we employed the fluorescent ubiq-
uitination-based cell-cycle indicator system to investigate b
cell replication in real time and found that high nutrient con-
centrations induce rapid b cell proliferation. Importantly, wefound that high nutrient concentrations also stimulate b cell
differentiation from progenitors in the intrapancreatic duct(IPD). Furthermore, using a new zebrafish line where b cells
are constitutively ablated, we show that b cell loss and highnutrient intake synergistically activate these progenitors. At
the cellular level, this activation process causes ductal cellreorganization as it stimulates their proliferation and differ-
entiation. Notably, we link the nutrient-dependent activationof these progenitors to a downregulation of Notch signaling
specifically within the IPD. Furthermore, we show that thenutrient sensor mechanistic target of rapamycin (mTOR) is
required for endocrine differentiation from the IPD underphysiological conditions as well as in the diabetic state.
Thus, this study reveals critical insights into how cellsmodulate their plasticity in response to metabolic cues and
identifies nutrient-sensitive progenitors in the maturepancreas.
Results and Discussion
b Cell Mass Increases in Response to Increased FeedingThere is a tight correlation between nutrient intake and b cellmass in nondiabetic obese individuals (reviewed in [1, 3])and experimental models of overnutrition [4, 5]. Whether nutri-tional cues impinge on the renewal and differentiation of b cell
*Correspondence: [email protected] (N.N.), didier.stainier@
mpi-bn.mpg.de (D.Y.R.S.)
progenitors remains to be investigated. In mice, b cell progen-itors are found in the embryonic pancreatic ducts [6–8]. Anal-ogously, in zebrafish, b cells arise from epithelial cells liningthe intrapancreatic duct (IPD) [9, 10]. A unique advantage ofthe zebrafish model is the ability to visualize these ductal pro-genitors in vivo [9, 11]. To explore the nutritional control of bcell progenitors, we analyzed b cell mass dynamics duringtwo major metabolic transitions. First, by 5 days postfertiliza-tion (dpf) (Figure 1A), larvae deplete nutrients stored in theyolk and transition into a feeding state. Second, between 15–16 dpf, larvae are switched to a high-calorie diet and growrapidly until late juvenile stages (45 dpf) (Figure 1B) [12]. Tocharacterize b cell mass responses during these transitions,we examined Tg(TP1:H2BmCherry);Tg(ins:GFP) animals.Tg(TP1:H2BmCherry) drives H2BmCherry expression inNotch-responsive cells (NRCs) in the IPD [9]. Given thatH2BmCherry has a long half-life, this transgenic combinationallows the in vivo monitoring of NRCs to b cell differentiation(Figure 1C). This differentiation forms secondary islets (SIs)along the IPD [9, 11]. Intriguingly, we observed a dramatic in-crease in SI number and principal islet (PI) size after switchingto a high-calorie diet at 15 dpf (Figures 1D–1G). The new SIswere vascularized, and individual b cells appeared to establishcontact with blood vessels (Figures S1A and S1B available on-line), suggesting that they contribute to the functional b cellmass.
b Cells Transition from Quiescence to Proliferation in
Response to NutrientsThis rapid b cell mass increase after switching to a high-caloriediet suggests that increased nutrient intake stimulates b cellproliferation and/or differentiation. To determine the role ofproliferation, we developed transgenics using the fluorescentubiquitination-based cell-cycle indicator (FUCCI) system forreal-time quantification of proliferation [13, 14]. We placed(zFucci-G1) and (zFucci-S/G2/M) under the insulin promoterfor b-cell-specific expression (Figure S1C). At 4.5 dpf, Tg(ins:z-Fucci-G1) expression labeled the majority of b cells in the PI,whereas Tg(ins:zFucci-S/G2/M) expression labeled rare cells(Figures 1H and S1C). To assess this system’s dynamics, weperformed live imaging at 4.5 dpf. Tg(ins:zFucci-S/G2/M) la-beling disappeared shortly after mitosis (Figure 1H), indicatingprecise labeling of proliferating b cells. To validate this systemfurther, we performed 5-ethynyl-20-deoxyuridine (EdU) ana-lyses at 30 dpf. Strikingly, the vast majority of Tg(ins:zFucci-S/G2/M) single-positive cells (90% 6 12%, n = 9 animals)were also EdU+, whereas a minor fraction of Tg(ins:zFucci-S/G2/M);Tg(ins:zFucci-G1) double-positive cells had incorpo-rated low levels of EdU (Figures S1D–S1F). These double-pos-itive cells are most likely in a very early stage of S phase. Forprecision, we only scored Tg(ins:zFucci-S/G2/M) single-posi-tive cells as proliferating b cells. Notably, after the switch toa high-calorie diet at 15 dpf, b cell proliferation increasedthroughout the day, peaking 10–12 hr after the first feeding(Figures 1I–1J). Furthermore, b cells in SIs also exhibitedhigh proliferation (Figure S1G). To test whether this b cell pro-liferation was stimulated by nutrients, we deprived animals offood for 28 hr. Fasting dramatically reduced the number ofproliferating b cells (2.5 6 2.2 cells per PI, n = 14 islets)

Figure 1. b Cells Transition from Quiescence to Proliferation in Response to Nutrients
(A and B) Wild-type (WT) animals imaged at 5 (A) and 21 (B) dpf showing the dramatic growth that takes place in the feeding animal.
(C–E) Tg(TP1:H2BmCherry);Tg(ins:GFP) larvae were examined with confocal imaging. Tg(TP1:H2BmCherry) drives the expression of H2BmCherry in NRCs
in the IPD, and Tg(ins:GFP) labels b cells. Arrows point to the principal islet (PI). Arrowheads point to secondary islets (SI).
(C and C’) The larva was imaged live at 5 (C) and at 7 (C’) dpf. At 7 dpf, two new b cells (arrowheads) had formed posterior to the PI. These cells derived from
NRCs, given that they were also Tg(Tp1bglob:H2BmCherry)+. The insets show single planes with separated channels. At 7 dpf, 0.45 (60.6, n = 21 larvae) b
cells containing SIs per larva were present posterior to the PI.
(D) At 15 dpf, the number b cells containing SIs per larva was 1.2 (61.3, n = 22 larvae).
(E) At 30 dpf, there was a dramatic increase in the number of b cells, which clustered in multiple SIs (11.86 5.7 SIs per animal, n = 6 animals). The pancreas is
outlined by a dashed line.
(F) Quantification of the PI’s area at 5.5, 16.5 and 27.5 dpf, showing a dramatic increase in its size between 16.5 and 27.5 dpf (n = 6 animals at 5.5 and 16.5 dpf;
5 animals at 27.5 dpf).
(G) Quantification of the number of Tg(ins:GFP)+ SIs at 7, 15, and 30 dpf showing a dramatic increase between 15–30 dpf (n = 22 animals at 7 and 15 dpf; 6
animals at 30 dpf).
(H) Live imaging of a Tg(ins:zFucci-G1);Tg(ins:zFucci-S/G2/M) larva at 4.5 dpf. A projection of the stack is shown. At t = 0 min, two Tg(ins:zFucci-S/G2/M)+ b
cells (arrowheads) were present in the PI. Both cells (1 and 2) divided during the course of the imaging, resulting in the downregulation and the subsequent
loss of Tg(ins:zFucci-S/G2/M) expression in their daughter cells (1a and 1b and 2a and 2b, respectively).
(I–L) Tg(ins:zFucci-G1);Tg(ins:zFucci-S/G2/M) animals were used to examine the effects of nutrients on b cell proliferation; the images show single confocal
planes through the PI.
(I–J) Animals from the same clutch were fixed at 1.5 (I) or 10 hr (J) after feeding (AF) starting at 27 dpf. Several b cells (12.26 4.3 b cells, n = 9 animals) were
proliferating 1.5 hr AF.
(J) The number of proliferating b cells increased at 10 hr AF (39 6 23 b cells, n = 11 animals, ***p < 0.005).
(K) The animals were fed regularly and examined at 28.5 dpf (12 hr AF). Numerous b cells in the PI were proliferating (21.4 6 4 b cells, n = 7 animals).
(L) Animals from the same clutch as in (K) were deprived of food for 28 hr and examined at 28.5 dpf. The number of proliferating b cells in the PI was dramat-
ically reduced (2.5 6 2.2 b cells, n = 14 animals, ****p < 0.0001).
(M) Quantification of the average number of proliferating b cells in the PI for the experiments shown in (I)–(L).
(A), (B), and (H) are lateral views, anterior to the left and dorsal to the top; (C) and (D) are lateral views, anterior to the top and dorsal to the left; and (E) and
(I)–(L) are dorsal views, anterior to the top. Error bars represent SEM, and scale bars represent 20 mm.
See also Figure S1.
Metabolic Control of Plasticity in the Pancreas1243

Current Biology Vol 23 No 131244
(Figures 1L and 1M) in comparison to the number of controls(21.4 6 4 cells, n = 7 islets) (Figures 1K and 1M). The effectsof fasting were reversible, given that b cells re-entered thecell cycle upon refeeding (data not shown). This nutrient-driven b cell proliferation was also observed at earlier timepoints after switching to a high-calorie diet (Figures S1H andS1I). Thus, b cell mass expansion is dynamically regulated bynutritional intake.
Nutrients Enhance b Cell Differentiation from the IPD
Proliferation alone does not explain the increase in the numberof SIs, and, thus, nutrients may also induce b cell differ-entiation. First, we analyzed whether b cells in an SI originatefrom the differentiation of a single, rare IPD cell followed byclonal expansionorwhether theyderive frommultiple IPDcells.This question is important because, inmice, IPDcells appear tolose progenitor potential around birth [6–8]. A tamoxifen-inducible Cre recombinase was placed under the control ofthe Notch-responsive element (TP1) Tg(TP1:CreERT2). Usingthe ubiquitous reporter Tg(ubi:Switch) [15] and 2F11 immuno-fluorescence, which marks IPD cells [16], we observed that4-hydroxytamoxifen (4-OHT) treatment at 14 dpf mosaicallylabeled IPD cells by 17 dpf (Figures 2A, S2A, and S2B).Next, we used Tg(TP1:CreERT2) in combination with theTg(insulin:Switch) reporter [17]. In this combination, b cellsthat originate from IPD cells containing Tg(TP1:CreERT2)activity exhibit H2BGFP expression instead of mCherryexpression. In a single-progenitor scenario and under limiting4-OHT treatments, each SI would be composed of H2BGFP+
or mCherry+ cells. In a multiple-progenitor scenario, SIs wouldbe mosaic, containing both H2BGFP+ andmCherry+ cells (Fig-ure 2B). Thus, we treated larvae with 4-OHT at 16 dpf andanalyzed pancreata at 35–40 dpf. The lineage-traced cellscontributed to mosaic SIs (Figure 2C), containing up to threediscrete H2BGFP+ cells per SI (Figure 2D), which indicatedthat multiple IPD cells contribute to an individual SI. We didnot detect H2BGFP+ cells in the SIs 2 days after the 4-OHTpulse (Figure S2C), indicating that H2BGFP+ cells originatedfrom neogenesis rather than from pre-existing b cells that hadretained CreERT2 activity. Moreover, adding 4-OHT beforeSIs form (2.5 dpf) also led to mosaic SI labeling at 32 dpf (Fig-ure S2D), supporting the multiclonality of b cells in SIs, whichwas consistent with the polyclonality of mouse [18–20] andhuman [21] islets. Within the PI, we observed groups ofH2BGFP+cells (863.4cellspergroup,n=7groups) (Figure2E),suggesting that individual NRCs differentiated into b cells andthenunderwent several amplification rounds.WealsodetectedH2BGFP+ cells in proximity to SIs (Figure 2F). Subsequentanalyses using Tg(TP1:H2BmCherry);Tg(ins:GFP) revealednewly differentiated b cells approaching an SI via directedmigration (Figure 2G). To directly test the involvement ofnutrients in b cell differentiation, we compared the number ofSIs in animals that were switched to a high-calorie diet versussiblings maintained on a low-calorie diet between 15–20 dpf(Figures 2H and 2I). The restricted diet significantly reducedthe formation of new SIs (Figure 2J), indicating that highnutrient levels induce b cell differentiation.
IPD Cells Exhibit a Strong Regenerative Response to bCellAblation under Feeding
Whether IPD cells can increase their endocrine differentiationrate after a selective b cell loss remains unknown, as doesthe metabolic control of such a response. To address thesequestions, we employed a transgenic system in which b cells
express the cell-lethal diphtheria toxin a (DTA) chain [22] underthe control of the insulin promoter, leading to complete abla-tion without a bystander effect (D.H., unpublished data). Con-ditional b cell ablation is achieved by Tg(ins:Cre)-mediatedexcision of the blue fluorescent protein (BFP) cassette fromthe floxed ins:loxp:BFPloxp:DTA transgene. In the absenceof b cells, the PI core was occupied by a cells (Figures S3Aand S3B).We examined b-cell-ablated animals under fasting meta-
bolism (5–6 dpf) [23] and during feeding (15–21 dpf). At 5 dpf,they were viable and exhibited a slight body-length reductionin comparison to WT animals (WT = 3.7 6 0.11 mm; b-cell-ab-lated animals = 3.5 6 0.09 mm, n = 12 animals per group, p <0.0001). To monitor IPD endocrine lineage differentiation, weused Tg(TP1:H2BmCherry) in combination with the pan-endo-crine marker Tg(neuroD:GFP). Quantification of the number ofTg(neuroD:GFP)+ SIs revealed no differences in endocrine dif-ferentiation in b-cell-ablated animals by 6.5 dpf (Figures 3A,3B, and 3E).Under external nutrition (16.5 dpf), b-cell-ablated animals
feed actively, as indicated by the presence of food in their in-testinal tract (Figure S3C), and exhibit similar lethality (1 outof 20) to that of controls (2 out of 20). However, they exhibit asignificant growth retardation (Figures S3C andS3D), suggest-ing that insulin stimulates growth in zebrafish as it does in hu-mans [24, 25]. In addition, b-cell-ablated animals exhibitedhigher free glucose levels (9.85 6 2.2 pmol/mg, n = 6 animals)in comparison to their unablated siblings (3.646 0.31 pmol/mg,n = 3 animals, p < 0.001). Strikingly, by 15.5 and 16.5 dpf, b-cell-ablated animals presented excessive numbers of ectopicTg(neuroD:GFP)+ cells in the pancreatic tail (Figures 3C, 3D,3F, and S3E–S3G). A majority of Tg(neuroD:GFP)+ cells alsoexhibited Tg(TP1:H2BmCherry) expression, indicating differ-entiation from pancreatic NRCs (Figure S3G). By 21 dpf, theectopic Tg(neuroD:GFP)+ cells gave rise to hormone-produc-ing endocrine cells, including glucagon+ cells (Figures S3Hand S3I). In addition, at 16.5 dpf, we observed discrete b cellsthat had clearly differentiated from NRCs (Figures 3H andS3G). This enhanced endocrine differentiation was accompa-nied by cell clustering and reduced branching of the IPD (Fig-ure 3H) as well as a loss of duct cell markers, including 2F11immunofluorescence (Figures 3G and 3H). Using EdU analysisat 20.5 dpf, we also found an increase in NRC replication from8.8% (62.86%, n = 9 animals) in wild-type (WT) animals to22.9% (65.45%, n = 9 animals) in b-cell-ablated animals exhib-iting IPD clustering (Figures S3J–S3L). To test whether feedingat earlier stages could stimulate endocrine differentiation, wecounted SIs after feeding from 5–6.5 dpf. This short feedingdid not significantly increase the number of SIs in b-cell-abla-ted animals (1.4 6 1.13 SIs, n = 13 animals) in comparison toWT animals (1.28 6 1.05 SIs, n = 21 animals) (p > 0.5). Thus,only under sustained feeding does the lack of b cells triggera strong regenerative response in b cell progenitors, stimu-lating their proliferation and endocrine lineage differentiation.
IPD Cells Lose Notch Signaling in the Absence of b Cells
The IPD phenotypes in b-cell-ablated animals, including endo-crine cell differentiation and increased proliferation, resemblethose of animals with impaired Notch signaling during earlylarval stages [9]. Therefore, we examined Notch signalinglevels using the previously validated Tg(TP1:H2BmCher-ry);Tg(TP1:VenusPEST) transgenic system [9]. Cells withactive Notch signaling are double positive for H2BmCherryand VenusPEST, whereas cells that recently lost Notch

Figure 2. Nutrients Regulate b Cell Differentiation
(A) Tg(TP1:CreERT2);Tg(ubi3C:loxp-GFP-loxp:mCherry) larvae were treated with 4-OHT at 14 dpf for 16 hr, fixed at 17 dpf, and stained for 2F11 to mark IPD
cells. 4-OHT treatment resulted in the mosaic labeling of individual IPD cells (mCherry+;GFP2 cells) (arrowheads).
(B) Experimental setup for the lineage tracing of b cells from IPD cells. Tg(insulin:loxP:mCherry-STOP:loxP:H2BGFP)+ b cells that originated from IPD cells
with Tg(TP1:CreERT2) activity exhibit H2BGFPexpression instead ofmCherry expression. In a single-progenitor scenario (1), each SI would be composed of
H2BGFP+ or mCherry+ cells, whereas, in a multiple-progenitor scenario (2), SIs would be mosaic, containing both H2BGFP+ and mCherry+ cells.
(C–F) Tg(TP1:CreERT2);Tg(insulin:loxP:mCherry-STOP:loxP:H2BGFP) larvae treated with limiting concentrations of 4-OHT at 16 dpf for 16 hr and analyzed
at 40 dpf.
(C) A mosaic SI composed of H2BGFP+ (arrowheads) and mCherry+ b cells.
(D) Three individual H2BGFP+ b cells (arrowheads) located in the periphery of a SI, suggesting that they originated from three different IPD cells.
(E) A PI showing two peripheral H2BGFP+ groups of b cells (arrowheads), indicating several cell cycles after differentiation.
(F) A single H2BGFP+ b cell (arrowhead) in proximity to an SI. Of 20 animals treatedwith 4-OHT, 15 contained lineage-traced cells, whereas no lineage-traced
cells were observed in vehicle-treated controls (n = 7 animals, 80 SIs and 7 PIs).
(G) Tg(TP1:H2BmCherry);Tg(ins:GFP) animals were examined at 30 dpf. A projection of several planes shows an SI (arrow). The white arrowhead points to a
single b cell in the periphery of the SI. The yellow arrowhead points to a single b cell outside the SI, extending a long cellular process toward it. Both of these b
cells exhibit higher levels of Tg(TP1:H2BmCherry) fluorescence in comparison to the rest of the b cells in the SI, suggesting that they recently differentiated
and did not undergo proliferation.
(H and I) Tg(ins:Kaede) animals were maintained on a low-calorie diet until 20 dpf (H) or switched to a high-calorie diet (I) from 15 to 20 dpf (see Experimental
Procedures). Although there is only a single Tg(ins:Kaede)+ SI (arrowhead) posterior to the PI (arrow) in (H), multiple SIs (arrowheads) formed in (I).
(J) Quantification of the number of SIs posterior to the PI (n = 17 animals for each group). The high-calorie diet induced the formation of more SIs in com-
parison to the low-calorie diet (****p < 0.0001). Error bars represent SEM, and scale bars represent 20 mm.
See also Figure S2.
Metabolic Control of Plasticity in the Pancreas1245
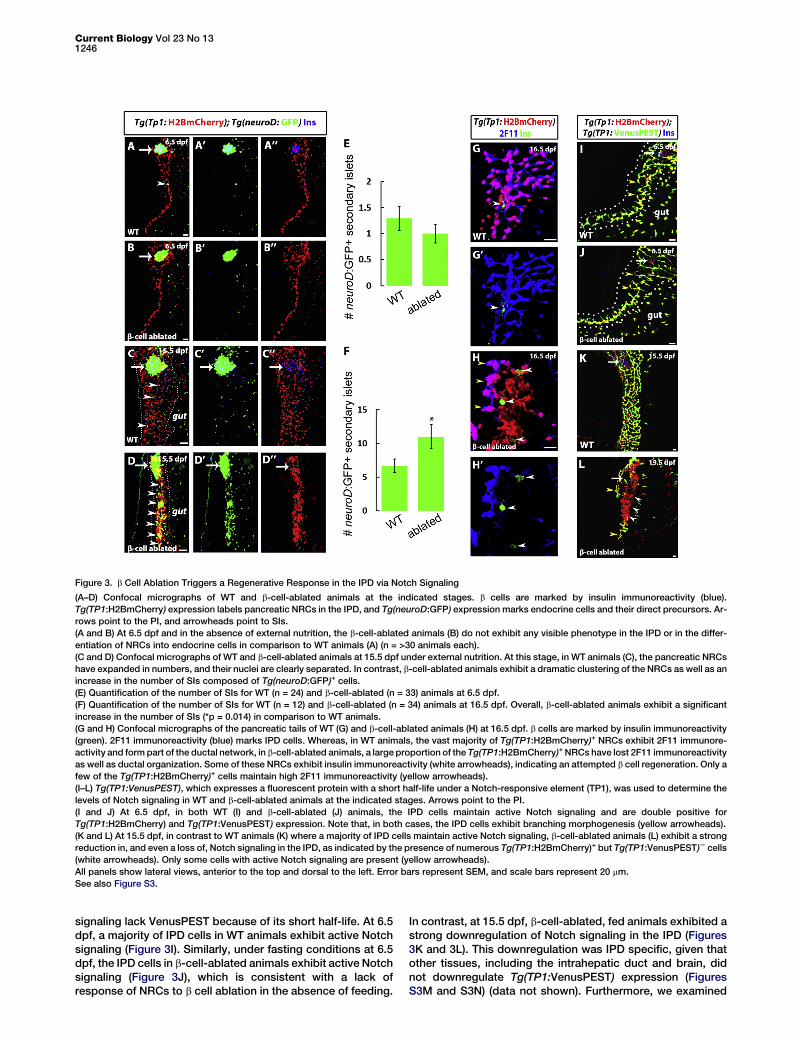
Figure 3. b Cell Ablation Triggers a Regenerative Response in the IPD via Notch Signaling
(A–D) Confocal micrographs of WT and b-cell-ablated animals at the indicated stages. b cells are marked by insulin immunoreactivity (blue).
Tg(TP1:H2BmCherry) expression labels pancreatic NRCs in the IPD, and Tg(neuroD:GFP) expression marks endocrine cells and their direct precursors. Ar-
rows point to the PI, and arrowheads point to SIs.
(A and B) At 6.5 dpf and in the absence of external nutrition, the b-cell-ablated animals (B) do not exhibit any visible phenotype in the IPD or in the differ-
entiation of NRCs into endocrine cells in comparison to WT animals (A) (n = >30 animals each).
(C and D) Confocal micrographs of WT and b-cell-ablated animals at 15.5 dpf under external nutrition. At this stage, in WT animals (C), the pancreatic NRCs
have expanded in numbers, and their nuclei are clearly separated. In contrast, b-cell-ablated animals exhibit a dramatic clustering of the NRCs as well as an
increase in the number of SIs composed of Tg(neuroD:GFP)+ cells.
(E) Quantification of the number of SIs for WT (n = 24) and b-cell-ablated (n = 33) animals at 6.5 dpf.
(F) Quantification of the number of SIs for WT (n = 12) and b-cell-ablated (n = 34) animals at 16.5 dpf. Overall, b-cell-ablated animals exhibit a significant
increase in the number of SIs (*p = 0.014) in comparison to WT animals.
(G and H) Confocal micrographs of the pancreatic tails of WT (G) and b-cell-ablated animals (H) at 16.5 dpf. b cells are marked by insulin immunoreactivity
(green). 2F11 immunoreactivity (blue) marks IPD cells. Whereas, in WT animals, the vast majority of Tg(TP1:H2BmCherry)+ NRCs exhibit 2F11 immunore-
activity and form part of the ductal network, in b-cell-ablated animals, a large proportion of the Tg(TP1:H2BmCherry)+ NRCs have lost 2F11 immunoreactivity
as well as ductal organization. Some of these NRCs exhibit insulin immunoreactivity (white arrowheads), indicating an attempted b cell regeneration. Only a
few of the Tg(TP1:H2BmCherry)+ cells maintain high 2F11 immunoreactivity (yellow arrowheads).
(I–L) Tg(TP1:VenusPEST), which expresses a fluorescent protein with a short half-life under a Notch-responsive element (TP1), was used to determine the
levels of Notch signaling in WT and b-cell-ablated animals at the indicated stages. Arrows point to the PI.
(I and J) At 6.5 dpf, in both WT (I) and b-cell-ablated (J) animals, the IPD cells maintain active Notch signaling and are double positive for
Tg(TP1:H2BmCherry) and Tg(TP1:VenusPEST) expression. Note that, in both cases, the IPD cells exhibit branching morphogenesis (yellow arrowheads).
(K and L) At 15.5 dpf, in contrast to WT animals (K) where a majority of IPD cells maintain active Notch signaling, b-cell-ablated animals (L) exhibit a strong
reduction in, and even a loss of, Notch signaling in the IPD, as indicated by the presence of numerous Tg(TP1:H2BmCherry)+ but Tg(TP1:VenusPEST)2 cells
(white arrowheads). Only some cells with active Notch signaling are present (yellow arrowheads).
All panels show lateral views, anterior to the top and dorsal to the left. Error bars represent SEM, and scale bars represent 20 mm.
See also Figure S3.
Current Biology Vol 23 No 131246
signaling lack VenusPEST because of its short half-life. At 6.5dpf, a majority of IPD cells in WT animals exhibit active Notchsignaling (Figure 3I). Similarly, under fasting conditions at 6.5dpf, the IPD cells in b-cell-ablated animals exhibit active Notchsignaling (Figure 3J), which is consistent with a lack ofresponse of NRCs to b cell ablation in the absence of feeding.
In contrast, at 15.5 dpf, b-cell-ablated, fed animals exhibited astrong downregulation of Notch signaling in the IPD (Figures3K and 3L). This downregulation was IPD specific, given thatother tissues, including the intrahepatic duct and brain, didnot downregulate Tg(TP1:VenusPEST) expression (FiguresS3M and S3N) (data not shown). Furthermore, we examined

Figure 4. High Nutrient Intake and TOR Signaling Are Required for the Activation of the Regenerative Response of IPD Cells
(A–D) WT (A) and b-cell-ablated (B–D) animals at 16.5 dpf. The phenotypes of b-cell-ablated animals fall into several classes based on the degree of IPD
disorganization and the extent of endocrine differentiation.
(B)Nophenotype; lackof IPDcell clustering andno increase in ectopicTg(neuroD:GFP)+ cells posterior to thePI in comparison toWTanimals (quantified in F).
(C) Moderate phenotype; only some Tg(TP1:H2BmCherry)+ cells exhibit clustering (outlined by the white/inner dashed line in C’), whereas the rest (outlined
by the yellow/outer dashed line in C’) appear unaffected. In these animals, the number of Tg(neuroD:GFP)+ cells posterior to the PI is significantly increased
in comparison to WT animals (quantified in F).(legend continued on next page)
Metabolic Control of Plasticity in the Pancreas1247

Current Biology Vol 23 No 131248
the direct effects of Notch signaling downregulation on the IPDduring feeding stages. Treating WT animals with the g-secre-tase inhibitor (GSI) LY411575 [26] from 15–18 dpf increasedthe b cell number along the IPD (Figures S3O–S3Q), showingthat, after Notch signaling downregulation, some IPD cellscan differentiate into mature endocrine cells even at theselate stages. GSI treatment also caused the clustering ofNRCs, as observed in b-cell-ablated animals (Figures S3Rand S3S). Altogether, these data suggest that, in b-cell-ablatedanimals, nutrient intake triggers Notch signaling downregula-tion in the IPD, leading to progenitor activation. Interestingly,Notch signaling levels were reduced in the IPD of WT animalsswitched to a high-calorie diet in comparison to those thatwere maintained on a low-calorie diet between 15–20 dpf(data not shown), indicating that nutrients also modulateNotch signaling under physiological conditions.
Nutrients and TOR Signaling Are Required for theRegenerative Response of the IPD
We classified the phenotypes of b-cell-ablated animals on thebasis of the severity of IPD disorganization and the extent ofendocrine differentiation (Figures 4A–4F). At 16.5 dpf, 10 outof 34 b-cell-ablated animals (29%) exhibited excessive clus-tering of the IPD while also having the highest numbers ofectopic endocrine cells (Figures 4D–4F), whereas, at 21.5dpf, 10 out of 18 animals (56%) exhibited this severe pheno-type, suggesting increased penetrance under sustained b
cell demand. At 16.5 dpf, we detected rare and weakly insu-lin+ cells in the PI; however, their numbers did not correlatewith the severity of the IPD phenotype. More intriguingly, ani-mals exhibiting the most severe phenotypes were slightly butsignificantly larger (5.37 6 0.4 mm, n = 10 animals) in compar-ison to the rest of the b cell-ablated animals (4.736 0.5mm, n =21 animals) (p < 0.01). Assuming that growth reflects nutrientintake, these data suggest that higher nutrition in some ani-mals exacerbated the effects of b cell loss. In agreement, die-tary restriction, achieved by a 24 hr feeding-fasting regimenfrom 6–16 dpf, suppressed the IPD phenotypes of b-cell-abla-ted animals (Figures 4G–4I).
Next, we aimed to identify pathways linking b cell deficiencyand nutrient-dependent endocrine differentiation. First, we
(D) Strong phenotype; complete clustering of the pancreatic NRCs and drama
(E) Distribution of phenotypic classes (no phenotype, 17 animals; moderate ph
(F) Quantification of the number of Tg(neuroD:GFP)+ cells posterior to the PI fo
(G and H) b-cell-ablated animals reared under a normal feeding regimen (G) or
(I) Distribution of phenotypic classes for control (n = 22) versus dietary restrictio
notypes.
(J and K) b-cell-ablated animals treated with DMSO (J) or 50 nM rapamycin (K
NRCs as well as numerous Tg(neuroD:GFP)+ cells in the pancreatic tail, wher
endocrine differentiation.
(L) Distribution of phenotypic classes for animals treated with DMSO (n = 31) ve
notypes observed in b-cell-ablated animals.
(M and N) Tg(TP1:H2BmCherry); Tg(TP1:VenusPEST) b-cell-ablated animals tr
treated animals, three exhibited a loss of Tg(TP1:VenusPEST) expression in
expression was maintained (n = 15 animals).
(O and P)WT animals treated with DMSO (O) or 50 nM rapamycin (P) (6–16 dpf).
its pancreatic tail, whereas the rapamycin-treated one exhibits two SIs (arrow
(Q) Quantification of the number of SIs posterior to the PI for DMSO- and rapa
reduced the formation of new SIs (***p < 0.001). Error bars in (F) = SD, error ba
(R) Under physiological conditions, high nutrient intake induces b cell proliferat
the differentiated b cells are ablated, the combination of b cell deficiency and n
IPD cells undergo differentiation toward the endocrine lineages as well as an
nutrient dependent, given that it requires high nutrient intake and can be supp
All panels show lateral views, anterior to the top, dorsal to the left. (M and N) s
stacks. Scale bars represent 20 mm.
See also Figure S4.
tested whether increased glucose could stimulate endocrinedifferentiation. WT larvae were incubated in D-glucose from3.5–7 dpf, a treatment that increases glucose levels duringlarval stages [27]. D-glucose treatments increased NRC differ-entiation into endocrine cells, doubling the number of SIs (Fig-ures S4A, S4B, and S4E). L-glucose, which cannot be utilizedas a nutrient, had no effect on endocrine differentiation (n =28 animals). In addition, glucocorticoid treatment, which in-creases glucose levels [23], mildly increased SI numbers (Fig-ures S4C–S4E). These data further reveal progenitor sensitivityto nutritional cues, including glucose. Also, we analyzed therole of mTOR, a key intracellular sensor that couples nutrientabundance with cell growth and division across all eukaryotes[28]. To assess its role, we treated b-cell-ablated animals from8–16 dpf with a low, but effective, dose of the mTOR inhibitorrapamycin (50 nM) [29]. Significantly, this treatment stronglysuppressed the b cell ablation phenotypes (Figures 4J–4L).Furthermore, it inhibited the loss of Notch signaling (Figures4M and 4N), indicating that the activation of IPD cell plasticityin response to nutrient catabolism requires mTOR activity. Toanalyze mTOR’s role in endocrine differentiation under physi-ological conditions, we counted SIs inWT animals treated withrapamycin or DMSO. Rapamycin treatment significantlyreduced the number of newly differentiated SIs, revealing thesensitivity of endocrine progenitors to mTOR activity (Figures4O–4Q). In addition, PI size was reduced by 26% (2,962 6364 mm2) in comparison to controls (3,985 6 730 mm2, n = 10animals per group, p < 0.01), consistent with mTOR’s role inendocrine cell growth and proliferation [30, 31]. Importantly,phosphorylated RPS6 (p-RPS6) immunoreactivity, a readoutofmTORactivity, was high in the pancreata of fed animals (Fig-ures S4F and S4H) but low after fasting (Figures S4G and S4I),confirming that pancreatic mTOR signaling is responsive tonutrients.
TOR Is Required for Expanding the Progenitor Pool in the
IPDTo further assess pancreatic progenitor sensitivity to mTORactivity, we examined their development in a zebrafishmTORmutant (mtorxu015Gt), which develops relatively normallyuntil 7 dpf but exhibits lethality by 10 dpf [32]. In WT animals,
tic increase in Tg(neuroD:GFP)+ cells (quantified in F).
enotype, 7 animals; and strong phenotype, 10 animals).
r each phenotypic class (ns, not significant; *p < 0.05, ****p < 0.0001).
a 24 hr feeding-fasting regimen (H) (6–16 dpf).
n (n = 15). The restricted diet suppressed the strong and moderate IPD phe-
) (8–16 dpf). The DMSO-treated animals exhibit clustering of the pancreatic
eas, in rapamycin-treated animals, the NRCs did not undergo clustering or
rsus rapamycin (n = 16). Rapamycin treatment strongly suppressed the phe-
eated with DMSO (M) or 50 nM rapamycin (N) (6–16 dpf). Of the ten DMSO-
the IPD, whereas, in the rapamycin-treated animals, Tg(TP1:VenusPEST)
The DMSO-treated animal exhibits five Tg(neuroD:GFP)+ SIs (arrowheads) in
heads).
mycin-treated WT animals (n = 28 for DMSO; 27 for rapamycin). Rapamycin
rs in (Q) = SEM.
ion as well as a progressive differentiation of new b cells from the IPD. When
utrient intake leads to the downregulation of Notch signaling in the IPD. The
increase in proliferation and loss of ductal characteristics. This process is
ressed by a dietary restriction or TOR signaling downregulation.
how single planes through the IPD, and all other panels show projections of

Metabolic Control of Plasticity in the Pancreas1249
the pancreatic NRCs proliferate between 2.5–5 dpf andexpand posteriorly to form the branched IPD (Figure S4J). Incontrast, mtorxu015Gt homozygous mutants display a strongdefect in NRC expansion, leading to a reduced pool of NRCsand IPD branching defects by 5 dpf (Figure S4K). These datareveal a critical requirement for mTOR in establishing theendocrine progenitor pool during development.
Concluding Remarks
Whereas the effects of glucose on b cell proliferation have pre-viously been described [33–36], we now identify nutrient-sen-sitive endocrine progenitors in the IPD. Furthermore, we showthat b cell deficiency and nutrients cooperate to enhance IPDplasticity and differentiation (Figure 4R). It is likely that, inobesity, impaired b cell function and higher nutrition synergis-tically regulate progenitor differentiation as well [37]. Indeed,mature pancreatic cell types in mice (including duct cells[38], acinar cells [39], and a cells [40]) exhibit enhanced plas-ticity after pancreatic injury. We also show that the enhance-ment of duct cell plasticity in response to b cell loss requiresthe nutrient sensor mTOR and that Notch signaling, a criticalregulator of endocrine differentiation in the embryo [41], is un-der metabolic control in the mature pancreas. Notably, Notchsignaling in human exocrine cells prevents their reprogram-ming [42]. Furthermore, Notch1 was implicated as a tumorsuppressor in a mouse model of pancreatic ductal adenocar-cinoma [43], and increased duct cell replication has beenreported in type 2 diabetics and obese patients [44], observa-tions consistent with our data in zebrafish. It will be importantto identify the metabolic effectors of duct cell plasticity, giventhat they could provide pharmacological means to enhance bcell differentiation.
Supplemental Information
Supplemental Information contains Supplemental Experimental Procedures
and four figures and can be foundwith this article online at http://dx.doi.org/
10.1016/j.cub.2013.05.037.
Acknowledgments
We thank A. Ayala and M. Alva for expert assistance with the fish, O. Stone
and A. Villasenor for critical reading of the manuscript, and all members of
the Stainier group and A. Schlegel for helpful discussions. We acknowledge
the generosity of C. Mosimann for providing Tg(ubi:Switch) and technical
advice, A. Miyawaki and A. Sakaue-Sawano for providing complementary
DNAs encoding (zFucci-S/G2/M) and (zFucci-G1), and X. Xu for
mtorxu015Gt. This work was supported by postdoctoral fellowships from
the Canadian Diabetes Association (N.N.), the Larry L. Hillblom Foundation
(D.H.), and the Juvenile Diabetes Research Foundation (D.H.) as well as
grants from the National Institutes of Health (R01 DK075032 and U01
DK089541) and the Packard Foundation (D.Y.R.S.). Zebrafish studies were
carried out in a designated facility under an International Animal Care and
Use Committee license.
Received: December 4, 2012
Revised: March 21, 2013
Accepted: May 21, 2013
Published: June 20, 2013
References
1. Bouwens, L., and Rooman, I. (2005). Regulation of pancreatic beta-cell
mass. Physiol. Rev. 85, 1255–1270.
2. Le Clair, C., Abbi, T., Sandhu, H., and Tappia, P.S. (2009). Impact of
maternal undernutrition on diabetes and cardiovascular disease risk
in adult offspring. Can. J. Physiol. Pharmacol. 87, 161–179.
3. Kloppel, G., Lohr, M., Habich, K., Oberholzer, M., and Heitz, P.U. (1985).
Islet pathology and the pathogenesis of type 1 and type 2 diabetes mel-
litus revisited. Surv. Synth. Pathol. Res. 4, 110–125.
4. Ahren, J., Ahren, B., and Wierup, N. (2010). Increased b-cell volume in
mice fed a high-fat diet: a dynamic study over 12 months. Islets 2,
353–356.
5. Maddison, L.A., and Chen, W. (2012). Nutrient excess stimulates b-cell
neogenesis in zebrafish. Diabetes 61, 2517–2524.
6. Kopinke, D., Brailsford, M., Shea, J.E., Leavitt, R., Scaife, C.L., and
Murtaugh, L.C. (2011). Lineage tracing reveals the dynamic contribution
of Hes1+ cells to the developing and adult pancreas. Development 138,
431–441.
7. Kopp, J.L., Dubois, C.L., Schaffer, A.E., Hao, E., Shih, H.P., Seymour,
P.A., Ma, J., and Sander, M. (2011). Sox9+ ductal cells are multipotent
progenitors throughout development but do not produce new endo-
crine cells in the normal or injured adult pancreas. Development 138,
653–665.
8. Solar, M., Cardalda, C., Houbracken, I., Martın, M., Maestro, M.A., De
Medts, N., Xu, X., Grau, V., Heimberg, H., Bouwens, L., and Ferrer, J.
(2009). Pancreatic exocrine duct cells give rise to insulin-producing
beta cells during embryogenesis but not after birth. Dev. Cell 17,
849–860.
9. Ninov, N., Borius, M., and Stainier, D.Y. (2012). Different levels of Notch
signaling regulate quiescence, renewal and differentiation in pancreatic
endocrine progenitors. Development 139, 1557–1567.
10. Wang, Y., Rovira, M., Yusuff, S., and Parsons, M.J. (2011). Genetic
inducible fate mapping in larval zebrafish reveals origins of adult insu-
lin-producing b-cells. Development 138, 609–617.
11. Parsons, M.J., Pisharath, H., Yusuff, S., Moore, J.C., Siekmann, A.F.,
Lawson, N., and Leach, S.D. (2009). Notch-responsive cells initiate the
secondary transition in larval zebrafish pancreas. Mech. Dev. 126,
898–912.
12. Eaton, R.C., and Farley, R.D. (1974). Growth and Reduction of
Depensation of Zebrafish, Brachydanio-Rerio, Reared in Laboratory.
Copeia, 204–209.
13. Sugiyama, M., Sakaue-Sawano, A., Iimura, T., Fukami, K., Kitaguchi, T.,
Kawakami, K., Okamoto, H., Higashijima, S., and Miyawaki, A. (2009).
Illuminating cell-cycle progression in the developing zebrafish embryo.
Proc. Natl. Acad. Sci. USA 106, 20812–20817.
14. Sakaue-Sawano, A., Kurokawa, H., Morimura, T., Hanyu, A., Hama, H.,
Osawa, H., Kashiwagi, S., Fukami, K., Miyata, T., Miyoshi, H., et al.
(2008). Visualizing spatiotemporal dynamics of multicellular cell-cycle
progression. Cell 132, 487–498.
15. Mosimann, C., Kaufman, C.K., Li, P., Pugach, E.K., Tamplin, O.J., and
Zon, L.I. (2011). Ubiquitous transgene expression and Cre-based
recombination driven by the ubiquitin promoter in zebrafish.
Development 138, 169–177.
16. Dong, P.D., Munson, C.A., Norton, W., Crosnier, C., Pan, X., Gong, Z.,
Neumann, C.J., and Stainier, D.Y. (2007). Fgf10 regulates hepato-
pancreatic ductal system patterning and differentiation. Nat. Genet.
39, 397–402.
17. Hesselson, D., Anderson, R.M., and Stainier, D.Y. (2011). Suppression of
Ptf1a activity induces acinar-to-endocrine conversion. Curr. Biol. 21,
712–717.
18. Desgraz, R., and Herrera, P.L. (2009). Pancreatic neurogenin
3-expressing cells are unipotent islet precursors. Development 136,
3567–3574.
19. Deltour, L., Leduque, P., Paldi, A., Ripoche, M.A., Dubois, P., and Jami,
J. (1991). Polyclonal origin of pancreatic islets in aggregation mouse
chimaeras. Development 112, 1115–1121.
20. Swenson, E.S., Xanthopoulos, J., Nottoli, T., McGrath, J., Theise, N.D.,
and Krause, D.S. (2009). Chimeric mice reveal clonal development of
pancreatic acini, but not islets. Biochem. Biophys. Res. Commun.
379, 526–531.
21. Scharfmann, R., Xiao, X., Heimberg, H., Mallet, J., and Ravassard, P.
(2008). Beta cells within single human islets originate from multiple pro-
genitors. PLoS ONE 3, e3559.
22. Herrera, P.L., Huarte, J., Zufferey, R., Nichols, A., Mermillod, B.,
Philippe, J., Muniesa, P., Sanvito, F., Orci, L., and Vassalli, J.D.
(1994). Ablation of islet endocrine cells by targeted expression of hor-
mone-promoter-driven toxigenes. Proc. Natl. Acad. Sci. USA 91,
12999–13003.
23. Gut, P., Baeza-Raja, B., Andersson, O., Hasenkamp, L., Hsiao, J.,
Hesselson, D., Akassoglou, K., Verdin, E., Hirschey, M.D., and

Current Biology Vol 23 No 131250
Stainier, D.Y. (2013). Whole-organism screening for gluconeogenesis
identifies activators of fasting metabolism. Nat. Chem. Biol. 9, 97–104.
24. Garin, I., Edghill, E.L., Akerman, I., Rubio-Cabezas, O., Rica, I., Locke,
J.M., Maestro, M.A., Alshaikh, A., Bundak, R., del Castillo, G., et al.;
Neonatal Diabetes International Group. (2010). Recessive mutations in
the INS gene result in neonatal diabetes through reduced insulin biosyn-
thesis. Proc. Natl. Acad. Sci. USA 107, 3105–3110.
25. Wertheimer, E., Lu, S.P., Backeljauw, P.F., Davenport, M.L., and Taylor,
S.I. (1993). Homozygous deletion of the human insulin receptor gene re-
sults in leprechaunism. Nat. Genet. 5, 71–73.
26. Fauq, A.H., Simpson, K., Maharvi, G.M., Golde, T., and Das, P. (2007). A
multigram chemical synthesis of the gamma-secretase inhibitor
LY411575 and its diastereoisomers. Bioorg. Med. Chem. Lett. 17,
6392–6395.
27. Powers, J.W., Mazilu, J.K., Lin, S., and McCabe, E.R. (2010). The effects
of hyperglycemia on adrenal cortex function and steroidogenesis in the
zebrafish. Mol. Genet. Metab. 101, 421–422.
28. Zoncu, R., Efeyan, A., and Sabatini, D.M. (2011). mTOR: from growth
signal integration to cancer, diabetes and ageing. Nat. Rev. Mol. Cell
Biol. 12, 21–35.
29. Goldsmith, M.I., Iovine, M.K., O’Reilly-Pol, T., and Johnson, S.L. (2006).
A developmental transition in growth control during zebrafish caudal fin
development. Dev. Biol. 296, 450–457.
30. Rachdi, L., Balcazar, N., Osorio-Duque, F., Elghazi, L., Weiss, A., Gould,
A., Chang-Chen, K.J., Gambello, M.J., and Bernal-Mizrachi, E. (2008).
Disruption of Tsc2 in pancreatic beta cells induces beta cell mass
expansion and improved glucose tolerance in a TORC1-dependent
manner. Proc. Natl. Acad. Sci. USA 105, 9250–9255.
31. Balcazar, N., Sathyamurthy, A., Elghazi, L., Gould, A., Weiss, A.,
Shiojima, I., Walsh, K., and Bernal-Mizrachi, E. (2009). mTORC1 activa-
tion regulates beta-cell mass and proliferation by modulation of cyclin
D2 synthesis and stability. J. Biol. Chem. 284, 7832–7842.
32. Ding, Y., Sun, X., Huang, W., Hoage, T., Redfield, M., Kushwaha, S.,
Sivasubbu, S., Lin, X., Ekker, S., and Xu, X. (2011). Haploinsufficiency
of target of rapamycin attenuates cardiomyopathies in adult zebrafish.
Circ. Res. 109, 658–669.
33. Porat, S., Weinberg-Corem, N., Tornovsky-Babaey, S., Schyr-Ben-
Haroush, R., Hija, A., Stolovich-Rain, M., Dadon, D., Granot, Z., Ben-
Hur, V., White, P., et al. (2011). Control of pancreatic b cell regeneration
by glucose metabolism. Cell Metab. 13, 440–449.
34. Salpeter, S.J., Klein, A.M., Huangfu, D., Grimsby, J., and Dor, Y. (2010).
Glucose and aging control the quiescence period that follows pancre-
atic beta cell replication. Development 137, 3205–3213.
35. Salpeter, S.J., Klochendler, A., Weinberg-Corem, N., Porat, S., Granot,
Z., Shapiro, A.M., Magnuson, M.A., Eden, A., Grimsby, J., Glaser, B.,
and Dor, Y. (2011). Glucose regulates cyclin D2 expression in quiescent
and replicating pancreatic b-cells through glycolysis and calcium chan-
nels. Endocrinology 152, 2589–2598.
36. Dadon, D., Tornovsky-Babaey, S., Furth-Lavi, J., Ben-Zvi, D., Ziv, O.,
Schyr-Ben-Haroush, R., Stolovich-Rain, M., Hija, A., Porat, S., Granot,
Z., et al. (2012). Glucose metabolism: key endogenous regulator of
b-cell replication and survival. Diabetes Obes. Metab. 14(Suppl 3 ),
101–108.
37. Bonner-Weir, S., Toschi, E., Inada, A., Reitz, P., Fonseca, S.Y., Aye, T.,
and Sharma, A. (2004). The pancreatic ductal epithelium serves
as a potential pool of progenitor cells. Pediatr. Diabetes 5(Suppl 2 ),
16–22.
38. Xu, X., D’Hoker, J., Stange, G., Bonne, S., De Leu, N., Xiao, X., Van de
Casteele, M., Mellitzer, G., Ling, Z., Pipeleers, D., et al. (2008). Beta cells
can be generated from endogenous progenitors in injured adult mouse
pancreas. Cell 132, 197–207.
39. Pan, F.C., Bankaitis, E.D., Boyer, D., Xu, X., Van de Casteele, M.,
Magnuson, M.A., Heimberg, H., and Wright, C.V. (2013).
Spatiotemporal patterns of multipotentiality in Ptf1a-expressing cells
during pancreas organogenesis and injury-induced facultative restora-
tion. Development 140, 751–764.
40. Thorel, F., Nepote, V., Avril, I., Kohno, K., Desgraz, R., Chera, S., and
Herrera, P.L. (2010). Conversion of adult pancreatic alpha-cells to
beta-cells after extreme beta-cell loss. Nature 464, 1149–1154.
41. Apelqvist, A., Li, H., Sommer, L., Beatus, P., Anderson, D.J., Honjo,
T., Hrabe de Angelis, M., Lendahl, U., and Edlund, H. (1999).
Notch signalling controls pancreatic cell differentiation. Nature 400,
877–881.
42. Swales, N., Martens, G.A., Bonne, S., Heremans, Y., Borup, R., Van de
Casteele, M., Ling, Z., Pipeleers, D., Ravassard, P., Nielsen, F., et al.
(2012). Plasticity of adult human pancreatic duct cells by neuroge-
nin3-mediated reprogramming. PLoS ONE 7, e37055.
43. Hanlon, L., Avila, J.L., Demarest, R.M., Troutman, S., Allen, M., Ratti, F.,
Rustgi, A.K., Stanger, B.Z., Radtke, F., Adsay, V., et al. (2010). Notch1
functions as a tumor suppressor in amodel of K-ras-induced pancreatic
ductal adenocarcinoma. Cancer Res. 70, 4280–4286.
44. Butler, A.E., Galasso, R., Matveyenko, A., Rizza, R.A., Dry, S., and
Butler, P.C. (2010). Pancreatic duct replication is increased with obesity
and type 2 diabetes in humans. Diabetologia 53, 21–26.