riskometer - hdfcfund.com€¦ · undertaken a series of policy measures. india calling india’s...
TRANSCRIPT
This product is suitable for investors who are seeking*:• Capital appreciation along with current income over long term.• Investment predominantly in equity and equity related
instruments with balance exposure to debt and money marketinstruments.
* Investors should consult their financial advisers if in doubt aboutwhether the product is suitable for them. September 2016
Riskometer
The growth of equity with the foundation of debt.

Table of Contents
• India Calling
• Balanced Funds – A Mix of Equity & A Dash of Debt
• Portfolio Positioning
• Mid Cap to Large Cap – The Shift
• Equity Play
• Debt Play
• Consistent Dividends
• Fund Suitability
• Product Features
• Asset Allocation
• Disclaimer & Risk Factors2

3.9 3.73.1
5.4 5.7
7.77.2 7.6
1951-60 1961-70 1971-80 1981-90 1991-00 2001-10 2011-15 2016-20E
Real GDP growth (average % change)
• India one of the better placed economies amongst largeeconomies of the world.
• Lower commodity prices, lower CPI inflation and fiscaldeficit amongst others have led to investors taking apositive view on India.
• With a focus on rejuvenating growth, the government hasundertaken a series of policy measures.
India Calling
India’s Growth is Accelerating
Real GDP Growth (IMF Forecasts) 2017 estimates
World Average 3.4%
United States 2.2%
United Kingdom 1.1%
Japan 0.6%
China 6.6%
Emerging Markets & Developing Economies Average
4.6%
India 7.6%
Improving Macros 2014-15 2015-16 2016-17E
GDP Growth (%) 7.2 7.6 7.6
CPI Inflation 6.0 4.9 5.0
Fiscal Deficit (% Of GDP) 4.1 3.9 3.5
CAD^(% of GDP) 1.4 0.8 1.0
FDI (% of GDP) 1.5 1.8 2.2
Interest Rates (%)^ 7.8 7.5 6.5
3Source: Bloomberg, HDFC AMC Research, Reserve Bank of India for 1951 to 2010 using 2004-05 base prices. Forecast of 2016-2020 from IMF September 2016 World Economic Outlook. Real Gross Domestic Product (real GDP) is a macroeconomic measure of the value of economic output adjusted for price changes (i.e., inflation or deflation).

Equity Markets Outlook
• Nearly flat markets for 8 years, Market cap to GDP near all time lows
Positives
• Profit growth to accelerate driven by low base of Cement / Commodity companies and corporate banks; acceleration of GDP growth, low wage inflation, improving capacity utilization, lower interest rates etc. to aid profitability
Negatives
• Uncertain Global situation in general and emerging markets / China in particular
69
88
149
56
99
96
6171
64
8176 70
63
56
14.1
17.825.7
18.5
18.9
12.914.8
15.4 16.3
20.8
18.1
15
0
5
10
15
20
25
30
0
20
40
60
80
100
120
140
160
India Market Cap To GDP Ratio - Calender Year 2005 - 15 (%)
Mcap to GDP Ratio P/E
4
FY 14 FY 15 FY 16 FY 17E FY 18E
Sensex EPS 1331 1318 1314 1503 1806
Growth (%) -1% 0% 14% 20%
Source: Bloomberg, Kotak Institutional Equities. E - Estimates
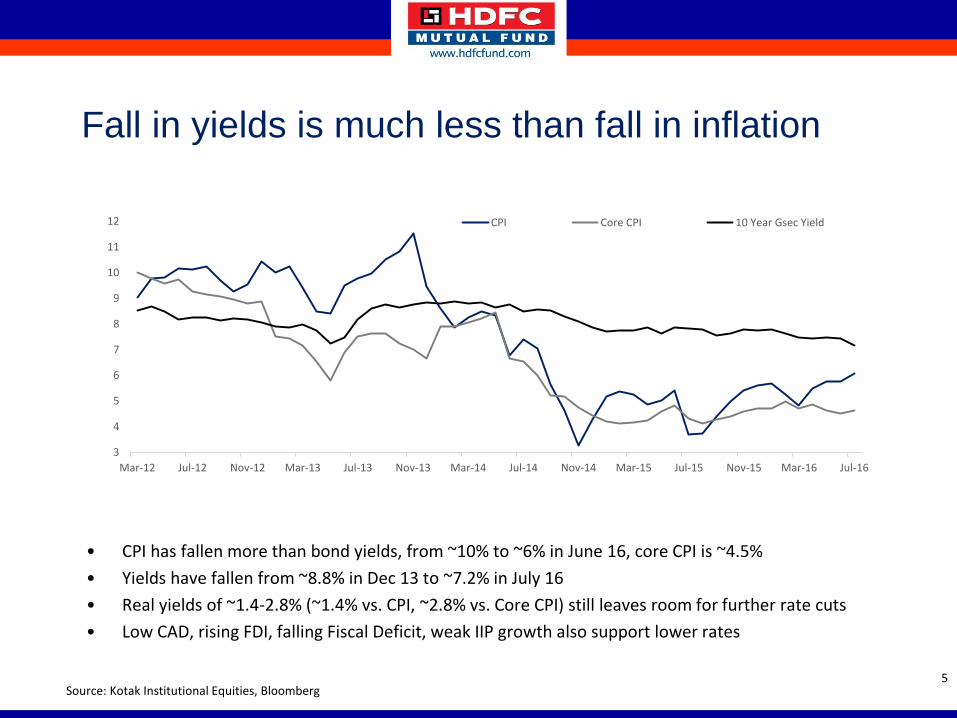
Fall in yields is much less than fall in inflation
• CPI has fallen more than bond yields, from ~10% to ~6% in June 16, core CPI is ~4.5%
• Yields have fallen from ~8.8% in Dec 13 to ~7.2% in July 16
• Real yields of ~1.4-2.8% (~1.4% vs. CPI, ~2.8% vs. Core CPI) still leaves room for further rate cuts
• Low CAD, rising FDI, falling Fiscal Deficit, weak IIP growth also support lower rates
5Source: Kotak Institutional Equities, Bloomberg
3
4
5
6
7
8
9
10
11
12
Mar-12 Jul-12 Nov-12 Mar-13 Jul-13 Nov-13 Mar-14 Jul-14 Nov-14 Mar-15 Jul-15 Nov-15 Mar-16 Jul-16
CPI Core CPI 10 Year Gsec Yield
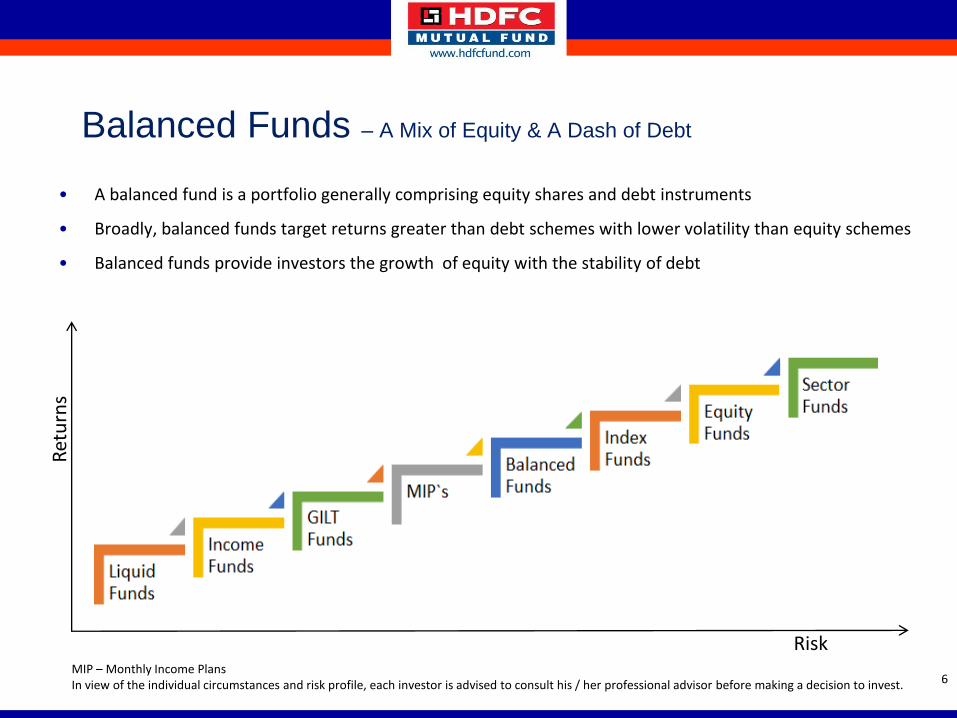
Balanced Funds – A Mix of Equity & A Dash of Debt
6
Ret
urn
s
Risk
• A balanced fund is a portfolio generally comprising equity shares and debt instruments
• Broadly, balanced funds target returns greater than debt schemes with lower volatility than equity schemes
• Balanced funds provide investors the growth of equity with the stability of debt
MIP – Monthly Income PlansIn view of the individual circumstances and risk profile, each investor is advised to consult his / her professional advisor before making a decision to invest.

Portfolio Positioning
• Steady Reduction In Exposure To Midcaps In CY15-16 and CY 16-17
• Midcaps have outperformed large caps by highest margins in CY14 & CY15 in last 10 years
Large cap stocks are comparatively cheaper as
compared to midcaps
Source: Bloomberg, CY- Calendar Year, The current investment strategy is subject to change depending on the market conditions. All calculations are illustrative. The scheme`s benchmark is the CRISIL Balanced Fund Index
Given the convergence in P/E multiples between midcaps vs. large caps and a predominantly large cap portfolio, HDFC Balanced Fund is well positioned in the current market environment
7
(% Return) CY 05 CY 06 CY 07 CY 08 CY 09 CY 10 CY 11 CY 12 CY 13 CY 14 CY15
Nifty 50 36.3 39.8 54.8 -51.8 75.8 17.9 -24.6 27.7 6.8 31.4 -4.1
Nifty Midcap 100 35.0 29.0 76.9 -59.4 99.0 19.2 -31.0 39.2 -5.1 55.9 6.5
Outperformance -1.3 -10.8 22.1 -7.6 23.2 1.3 -6.4 11.5 -11.9 24.5 10.6
Shift to large cap stocks
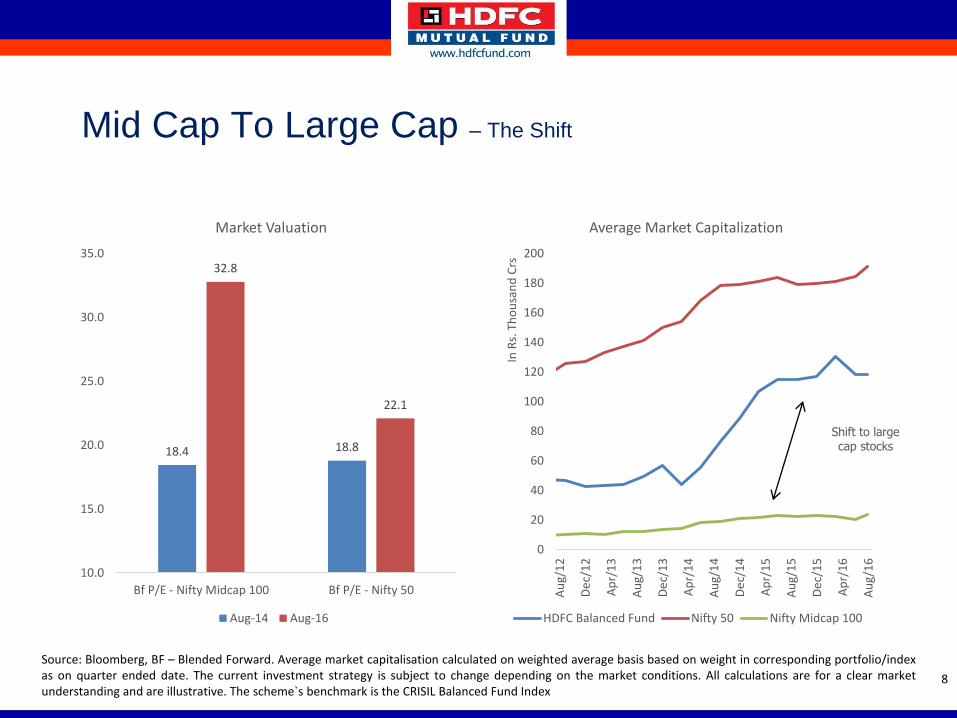
Mid Cap To Large Cap – The Shift
8
Source: Bloomberg, BF – Blended Forward. Average market capitalisation calculated on weighted average basis based on weight in corresponding portfolio/indexas on quarter ended date. The current investment strategy is subject to change depending on the market conditions. All calculations are for a clear marketunderstanding and are illustrative. The scheme`s benchmark is the CRISIL Balanced Fund Index
18.4 18.8
32.8
22.1
10.0
15.0
20.0
25.0
30.0
35.0
Bf P/E - Nifty Midcap 100 Bf P/E - Nifty 50
Market Valuation
Aug-14 Aug-16
0
20
40
60
80
100
120
140
160
180
200
Au
g/1
2
De
c/1
2
Ap
r/1
3
Au
g/1
3
De
c/1
3
Ap
r/1
4
Au
g/1
4
De
c/1
4
Ap
r/1
5
Au
g/1
5
De
c/1
5
Ap
r/1
6
Au
g/1
6
In R
s. T
ho
usa
nd
Crs
Average Market Capitalization
HDFC Balanced Fund Nifty 50 Nifty Midcap 100

Equity Play• The fund has a balanced mix between
consumption and investment themes.
• Lately, the allocation to economicallysensitive investment themes has increased.
• Lower Interest Rates & strong earningsgrowth may provide impetus to equitymarkets.
• Next leg of market growth to be led byearnings growth. Earnings are expected toremain strong over a 3 year horizon.
• Improving growth prospects and marginoutlook for companies are having a positiveimpact on Indian markets.
9
The current investment strategy is subject to change depending on the market conditions. Stocks/sectors referred above are not recommended by HDFCMutual Fund/AMC. The Fund may or may not have any present or future positions in these sectors. For complete portfolio details referwww.hdfcfund.com. Portfolio details provided as on 31st August 2014 and 31st August 2016 as a percentage of total equity exposure of the fund as ongiven dates.
15.9
1.2
6.3
0.0
3.9
7.8
2.6
1.6
2.9
9.1
18.0
15.1
2.7
2.8
2.9
3.7
4.0
4.7
5.2
5.8
5.8
18.4
Others
Consumer Non Durables
Industrial Products
Power
Auto Ancillaries
Pharmaceuticals
Auto
Petroleum Products
Construction Project
Software
Banks
2014
2016

Debt Play
• The fund has increased its duration by addinglong term G-Secs.
• Portfolio positioned to take advantage of fallinginterest rates and upswing in growthmomentum
• Re balancing of portfolio to favor G-Sec in lightof attractiveness of yields on a risk adjustedbasis
10
The current investment strategy is subject to change depending on the market conditions. For complete portfolio details refer www.hdfcfund.com.Portfolio details provided as on 31st Aug 2014 and 31st Aug 2016. Portfolio holdings are as a percentage of total portfolio holdings. HDFC MutualFund/AMC is not guaranteeing/offering/communicating any indicative yields or guaranteed returns on investments made in the scheme(s)
2014 2016
Average Maturity (In Yrs.)
7.53 11.77
Modified Duration (In Yrs.)
4.42 6.45
Yield To Maturity 8.81% 7.61%
4.9
9.5
16.4
2.4
6.1
20.5
Cash & Cash Equivalents
Credit Exposure
G-Sec
Portfolio Holdings
2014 2016

Consistent dividends
• The scheme has an uninterrupted^ dividend record since financial year 2005-06.
• With effect from Sep’15, a quarterly frequency for dividend distribution in the existingDividend Options of the Regular and Direct Plan of HDFC Balanced Fund has been fixed.
The dividends announced since September 2015 is as under
^ Past performance may or may not be sustained in the future.All dividends are on face value of Rs. 10 per Unit. After payment of the dividend, the per Unit NAV falls to the extent of the payout and statutory levy, if any. Thereis no assurance or guarantee to unit holders as to rate/quantum of dividend distribution nor that the dividends will be paid regularly. Please log on towww.hdfcfund.com for Record Date-wise listing of dividends declared. 11
MonthSeptember
28, 2015
December
28, 2015
March 28,
2016
June 27,
2016
NAV/Unit (Record Date) 27.109 27.261 25.73 26.82
Dividend/Unit (Rs.) 0.5 0.5 0.6 0.5
Financial Year 2005 2006 2007 2008 2009 2010 2011 2012 2013 2014 2015
Dividend per unit (Rs) (A) 4.00 2.00 2.50 2.50 1.50 2.25 2.25 2.25 1.25 1.25 2.00
NAV (Record Date) (B) 18.761 18.272 20.588 22.744 12.326 20.455 20.785 20.353 19.322 20.682 29.333
Dividend Yield (%) (A/B) 21.3% 10.9% 12.1% 11.0% 12.2% 11.0% 10.8% 11.1% 6.5% 6.0% 6.8%

Fund Suitability
• Looking for a unique proposition of spreading the investment into two broad divisions – equitiesand debt.
• Looking for tax efficiency in asset allocation. Currently, the scheme has been investing in therange of 65% – 72% of its corpus in equity. (Scheme having an equity corpus of 65% and above isconsidered as an equity-oriented fund for taxation purpose)
• Looking for exposure to debt which creates the risk buffer that the investors desire
• Looking for a well diversified portfolio across asset classes:
– Benefit from the growth of equities and
– The stability of debt markets
12
HDFC Mutual Fund/AMC is not guaranteeing returns on investments made in this scheme. The current investment strategy is subject to change depending on themarket conditions. Due to the individual nature of financial needs please consult your financial advisor before investing.
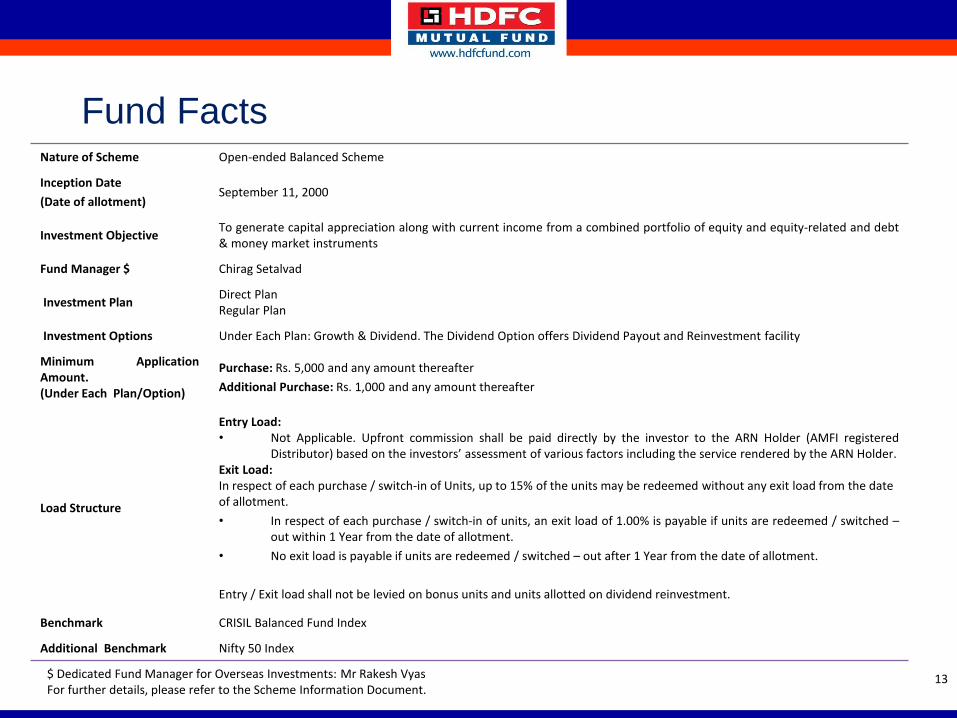
Nature of Scheme Open-ended Balanced Scheme
Inception Date
(Date of allotment)September 11, 2000
Investment ObjectiveTo generate capital appreciation along with current income from a combined portfolio of equity and equity-related and debt& money market instruments
Fund Manager $ Chirag Setalvad
Investment PlanDirect PlanRegular Plan
Investment Options Under Each Plan: Growth & Dividend. The Dividend Option offers Dividend Payout and Reinvestment facility
Minimum ApplicationAmount.(Under Each Plan/Option)
Purchase: Rs. 5,000 and any amount thereafter
Additional Purchase: Rs. 1,000 and any amount thereafter
Load Structure
Entry Load:• Not Applicable. Upfront commission shall be paid directly by the investor to the ARN Holder (AMFI registered
Distributor) based on the investors’ assessment of various factors including the service rendered by the ARN Holder.Exit Load:In respect of each purchase / switch-in of Units, up to 15% of the units may be redeemed without any exit load from the date of allotment.
• In respect of each purchase / switch-in of units, an exit load of 1.00% is payable if units are redeemed / switched –out within 1 Year from the date of allotment.
• No exit load is payable if units are redeemed / switched – out after 1 Year from the date of allotment.
Entry / Exit load shall not be levied on bonus units and units allotted on dividend reinvestment.
Benchmark CRISIL Balanced Fund Index
Additional Benchmark Nifty 50 Index
Fund Facts
$ Dedicated Fund Manager for Overseas Investments: Mr Rakesh VyasFor further details, please refer to the Scheme Information Document.
13

Asset Allocation Pattern
Types of Instruments
Normal Allocation
(% of Net Assets)
Normal Deviation
(% of Normal Allocation)
Risk Profile
Equities & Equity related instruments 60 20 Medium to High
Debt Securities (including securitized debt) and Money Market instruments
40 30 Low to medium
The scheme may seek investment opportunity in the ADR / GDR / Foreign Equity and Debt Securities subject to SEBI (Mutual Funds)Regulations, 1996. Maximum exposure to investment in Foreign Securities will be restricted to 40% of the net assets. The scheme mayuse derivatives mainly for the purpose of hedging and portfolio balancing (max 20% of net assets) based on the opportunities availablesubject to SEBI (Mutual Funds) Regulations, 1996. The scheme will not invest in Foreign securitized debt.
Under normal circumstances, the asset allocation of the Scheme’s portfolio will be as follows:
14
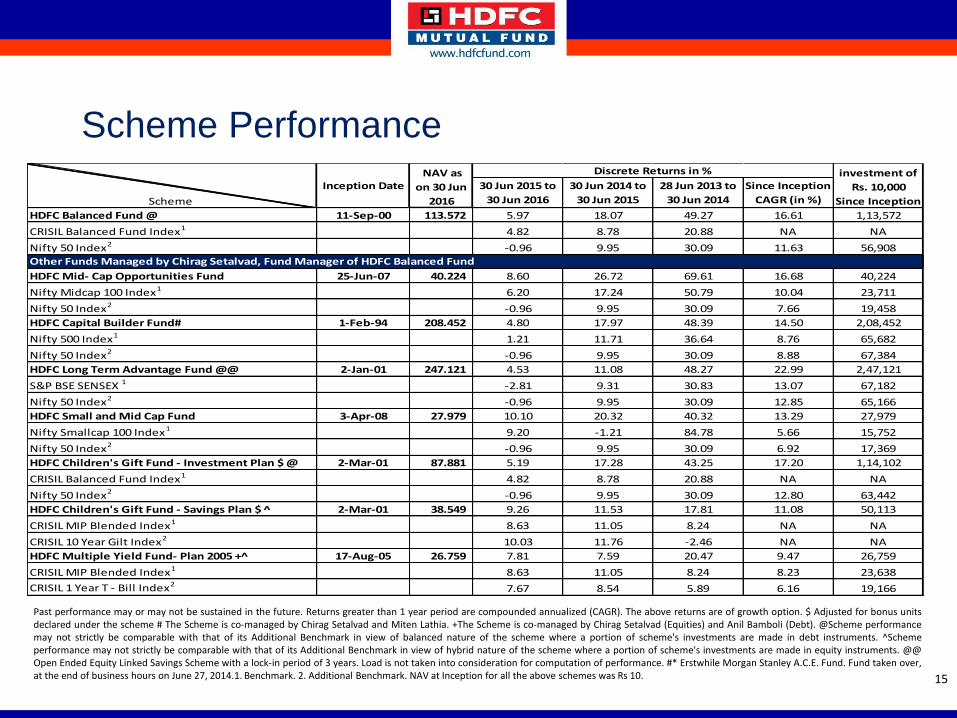
Scheme Performance
Past performance may or may not be sustained in the future. Returns greater than 1 year period are compounded annualized (CAGR). The above returns are of growth option. $ Adjusted for bonus unitsdeclared under the scheme # The Scheme is co-managed by Chirag Setalvad and Miten Lathia. +The Scheme is co-managed by Chirag Setalvad (Equities) and Anil Bamboli (Debt). @Scheme performancemay not strictly be comparable with that of its Additional Benchmark in view of balanced nature of the scheme where a portion of scheme's investments are made in debt instruments. ^Schemeperformance may not strictly be comparable with that of its Additional Benchmark in view of hybrid nature of the scheme where a portion of scheme's investments are made in equity instruments. @@Open Ended Equity Linked Savings Scheme with a lock-in period of 3 years. Load is not taken into consideration for computation of performance. #* Erstwhile Morgan Stanley A.C.E. Fund. Fund taken over,at the end of business hours on June 27, 2014.1. Benchmark. 2. Additional Benchmark. NAV at Inception for all the above schemes was Rs 10. 15
30 Jun 2015 to
30 Jun 2016
30 Jun 2014 to
30 Jun 2015
28 Jun 2013 to
30 Jun 2014
Since Inception
CAGR (in %)
HDFC Balanced Fund @ 11-Sep-00 113.572 5.97 18.07 49.27 16.61 1,13,572
CRISIL Balanced Fund Index1 4.82 8.78 20.88 NA NA
Nifty 50 Index2 -0.96 9.95 30.09 11.63 56,908
HDFC Mid- Cap Opportunities Fund 25-Jun-07 40.224 8.60 26.72 69.61 16.68 40,224
Nifty Midcap 100 Index1 6.20 17.24 50.79 10.04 23,711
Nifty 50 Index2 -0.96 9.95 30.09 7.66 19,458
HDFC Capital Builder Fund# 1-Feb-94 208.452 4.80 17.97 48.39 14.50 2,08,452
Nifty 500 Index1 1.21 11.71 36.64 8.76 65,682
Nifty 50 Index2 -0.96 9.95 30.09 8.88 67,384
HDFC Long Term Advantage Fund @@ 2-Jan-01 247.121 4.53 11.08 48.27 22.99 2,47,121
S&P BSE SENSEX 1 -2.81 9.31 30.83 13.07 67,182
Nifty 50 Index2 -0.96 9.95 30.09 12.85 65,166
HDFC Small and Mid Cap Fund 3-Apr-08 27.979 10.10 20.32 40.32 13.29 27,979
Nifty Smallcap 100 Index1 9.20 -1.21 84.78 5.66 15,752
Nifty 50 Index2 -0.96 9.95 30.09 6.92 17,369
HDFC Children's Gift Fund - Investment Plan $ @ 2-Mar-01 87.881 5.19 17.28 43.25 17.20 1,14,102
CRISIL Balanced Fund Index1 4.82 8.78 20.88 NA NA
Nifty 50 Index2 -0.96 9.95 30.09 12.80 63,442
HDFC Children's Gift Fund - Savings Plan $ ^ 2-Mar-01 38.549 9.26 11.53 17.81 11.08 50,113
CRISIL MIP Blended Index1 8.63 11.05 8.24 NA NA
CRISIL 10 Year Gilt Index2 10.03 11.76 -2.46 NA NA
HDFC Multiple Yield Fund- Plan 2005 +^ 17-Aug-05 26.759 7.81 7.59 20.47 9.47 26,759
CRISIL MIP Blended Index1 8.63 11.05 8.24 8.23 23,638
CRISIL 1 Year T - Bill Index27.67 8.54 5.89 6.16 19,166
Scheme
NAV as
on 30 Jun
2016
Value of
investment of
Rs. 10,000
Since Inception
Other Funds Managed by Chirag Setalvad, Fund Manager of HDFC Balanced Fund
Discrete Returns in %
Inception Date

Disclaimer & Risk Factors
This presentation dated 12th September 2016 has been prepared by HDFC Asset Management Company Limited(HDFC AMC) based on internal data, publicly available information and other sources believed to be reliable. Anycalculations made are approximations, meant as guidelines only, which you must confirm before relying onthem. The information contained in this document is for general purposes only. The document is given insummary form and does not purport to be complete. The document does not have regard to specific investmentobjectives, financial situation and the particular needs of any specific person who may receive this document.The information/ data herein alone are not sufficient and should not be used for the development orimplementation of an investment strategy. The statements contained herein are based on our current views andinvolve known and unknown risks and uncertainties that could cause actual results, performance or events todiffer materially from those expressed or implied in such statements. Past performance may or may not besustained in future. Neither HDFC AMC and HDFC Mutual Fund nor any person connected with them, accepts anyliability arising from the use of this document. The recipient(s) before acting on any information herein shouldmake his/her/their own investigation and seek appropriate professional advice and shall alone be fullyresponsible / liable for any decision taken on the basis of information contained herein.
Mutual fund investments are subject to market risks, read all scheme related documents carefully.
16

Thank You