content.icicidirect.comcontent.icicidirect.com/mfsidpdf/tata mutual fund.pdf · tata mutual fund 5...
TRANSCRIPT

THEMATIC FUNDS
2www.tatamutualfund.com TATA MUTUAL FUND
INDEX
MARKET OUTLOOKEquity
Debt
7
8
EQUITYTata Large Cap Fund (Erstwhile known as Tata Pure Equity Fund; renamed w.e.f February 29, 2016)
Tata Equity Opportunities Fund
Tata Ethical Fund
Tata Equity P/E Fund
Tata Mid Cap Growth Fund
Tata Dividend Yield Fund
Tata India Tax Savings Fund (Erstwhile known as Tata Long Term Equity Fund; renamed w.e.f December 21, 2015)
9
10
11
12
13
14
15
16
16
17
17
18
19
HYBRID
22
23
24
25
26
27
Tata Balanced Fund
Tata Regular Savings Equity Fund
20
21
DEBTTata Dynamic Bond Fund
Tata Medium Term Fund (Erstwhile known as Tata Income Plus Fund; renamed w.e.f March 17, 2017)
Tata Long Term Debt Fund (Erstwhile known as Tata Income Fund; renamed w.e.f December 1, 2016)
Tata Short Term Bond Fund
Tata Corporate Bond Fund (Erstwhile known as Tata Treasury Manager Fund; renamed w.e.f March 17, 2017)
Tata Ultra Short Term Fund (Erstwhile known as Tata Floater Fund; renamed w.e.f March 17, 2017)
LIQUID28
29
Tata Money Market Fund
Tata Liquid Fund
GILT
30
31
Tata Gilt Securities Fund
Tata Gilt Mid Term Fund
SOLUTIONS
32
33
34
35
36 - 48
49 - 52
53
Tata Retirement Savings Fund - Progressive
Tata Retirement Savings Fund - Moderate
Tata Retirement Savings Fund - Conservative
Tata Young Citizens’ Fund
SCHEMES PERFORMANCE
DIVIDEND / BONUS HISTORY
HOW TO READ FACT SHEET
Tata Banking & Financial Services Fund
Tata Digital India Fund
Tata India Consumer Fund
Tata India Pharma & Healthcare Fund
Tata Resources & Energy Fund
Tata Infrastructure Fund
3www.tatamutualfund.com TATA MUTUAL FUND
RISKOMETER
Name of the Schemes Investment Objective: Regular Fixed Income for Short Term. Riskometer
Name of the Schemes Investment Objective: Regular Fixed Income for Short Term. Riskometer
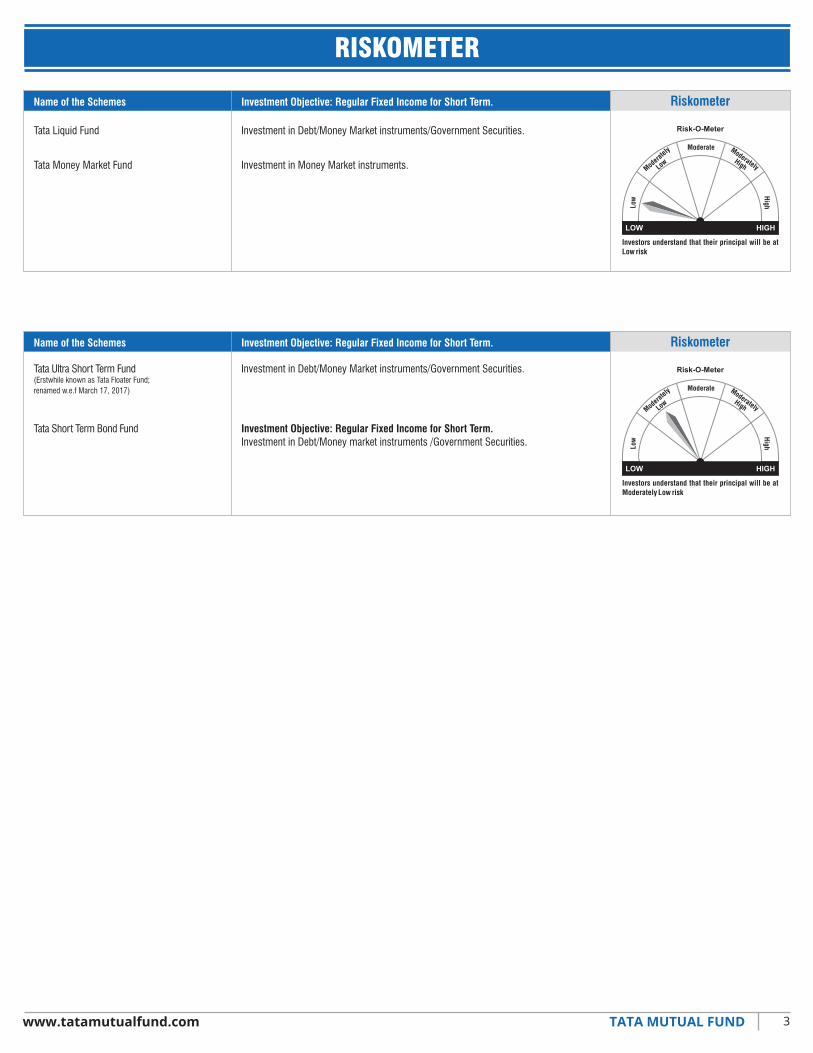
Tata Liquid Fund
Tata Money Market Fund
Investment in Debt/Money Market instruments/Government Securities.
Investment in Money Market instruments.
Tata Ultra Short Term Fund
Tata Short Term Bond Fund
Investment in Debt/Money Market instruments/Government Securities.
Investment Objective: Regular Fixed Income for Short Term.Investment in Debt/Money market instruments /Government Securities.
(Erstwhile known as Tata Floater Fund;renamed w.e.f March 17, 2017)

4www.tatamutualfund.com TATA MUTUAL FUND
RISKOMETER
Name of the Schemes Investment Objective: Regular Fixed Income for Short Term.
Name of the Schemes Investment Objective: Generate Income and/or Capital Appreciation for a Fixed Term
Riskometer
Tata Dynamic Bond Fund
Tata Gilt Mid Term Fund
Tata Gilt Securities Fund
Tata Long Term Debt Fund
Tata Medium Term Fund(Erstwhile known as Tata Income Plus Fund;renamed w.e.f March 17, 2017)
Investment Objective: Short Term to Medium Capital Appreciation & Regular Income.
Investment in Debt/Money Market instruments/Government securities.
Investment Objective: Medium Term Capital Appreciation.
Investment predominantly in Government Securities (upto 15 years maturity).
Investment Objective: Long Term Capital Appreciation & Regular Income.
Investment predominantly in Government Securities.
Investment Objective: Long Term Capital Appreciation & Regular Income.
Investment in Debt/Money Market instruments/Government Securities.
Investment Objective: Long Term Capital Appreciation & Regular Income.
Investment in Debt/Money Market instruments/Government Securities.
Investment in Corporate Debt Securities.
The investment objective of a scheme is to generate income and / or capital appreciation
by investing in wide range of Fixed Income Instruments having maturity in line with the
maturity of the scheme. The maturity of all investments shall be equal to or less than the
maturity of the scheme.
Tata Fixed Maturity Plan - Series 47 - Scheme H
(Erstwhile known as Tata Income Fund; renamed w.e.f December 1, 2016)
Tata Corporate Bond Fund(Erstwhile known as Tata Treasury Manager Fund; renamed w.e.f March 17, 2017)

5www.tatamutualfund.com TATA MUTUAL FUND
RISKOMETER
Name of the Schemes Investment Objective: Long Term Capital Appreciation Riskometer
Tata Balanced Fund
Tata Dividend Yield Fund
Tata Equity Opportunities Fund
Tata Equity P/E Fund
Tata Ethical Fund
Tata Mid Cap Growth Fund
Tata Large Cap Fund
Tata Retirement Savings Fund
- Moderate Plan
Tata Regular Savings Equity Fund
Tata Retirement Savings Fund
- Progresive Plan
Investment predominantly in equity & equity related instruments and some portion
(between 25% to 35%) in fixed income instruments.
Investment (minimum 70%) in equity & equity related instruments/stocks having dividendyield higher than dividend yield of stocks of BSE SENSEX.
Investment in equity and equity related instruments of well researched value and growthoriented companies across all market capitalization.
Investment (minimum 70%) in equity & equity related instruments of companies whoserolling P/E is lower than rolling P/E of BSE Sensex.
Investment in equity and equity related instruments of Shariah Principles compliantcompanies and in other instruments allowed under Shariah principles.
Investment predominantly in equity & equity related instruments of growth oriented midcap companies.
Investment predominantly in equity & equity securities related securities of large capcompanies.
A predominantly equity oriented savings scheme which provides tool for retirementplanning to individual investors.
Predominantly investing in equity and equity related instruments, equity arbitrageopportunities and debt and money market instruments.
A predominantly equity oriented savings scheme which provides tool for retirement
planning to individual investors.
An equity linked savings scheme (ELSS) Investing predominantly in Equity & Equity
related instruments.
Investment Objective: Long Term Capital Appreciation & Current Income.Investment in equity & equity related instruments and in fixed income instruments.
Investment Objective: Long Term Capital Appreciation & Current Income.A predominantly debt oriented savings scheme which provides tool for retirementplanning to individual investors.
Tata India Tax Savings Fund(Erstwhile known as Tata Long Term EquityFund; renamed w.e.f December 21, 2015)
Tata Young Citizens Fund
Tata Retirement Savings Fund
- Conservative Plan
(Erstwhile known as Tata Pure Equity Fund; renamed w.e.f February 29, 2016)
6www.tatamutualfund.com TATA MUTUAL FUND
RISKOMETER
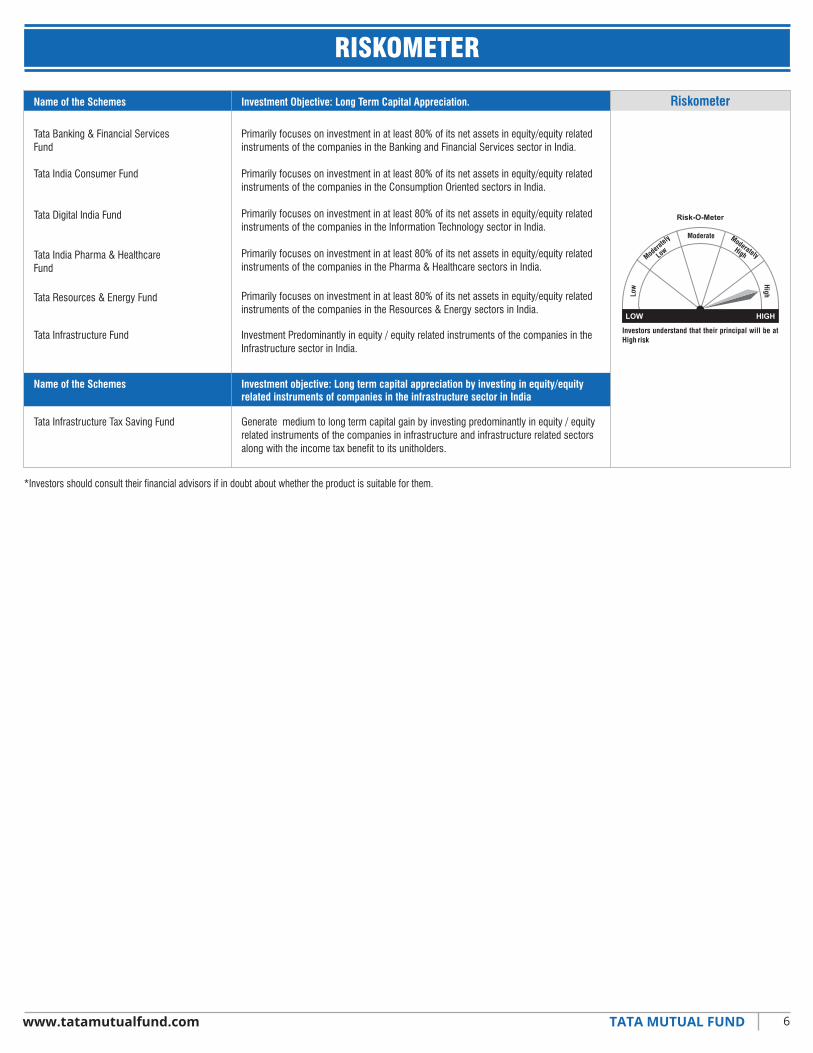
*Investors should consult their financial advisors if in doubt about whether the product is suitable for them.
Tata Banking & Financial ServicesFund
Tata India Consumer Fund
Tata Digital India Fund
Primarily focuses on investment in at least 80% of its net assets in equity/equity relatedinstruments of the companies in the Banking and Financial Services sector in India.
Primarily focuses on investment in at least 80% of its net assets in equity/equity relatedinstruments of the companies in the Consumption Oriented sectors in India.
Primarily focuses on investment in at least 80% of its net assets in equity/equity relatedinstruments of the companies in the Information Technology sector in India.
Tata India Pharma & HealthcareFund
Primarily focuses on investment in at least 80% of its net assets in equity/equity relatedinstruments of the companies in the Pharma & Healthcare sectors in India.
Tata Resources & Energy Fund Primarily focuses on investment in at least 80% of its net assets in equity/equity relatedinstruments of the companies in the Resources & Energy sectors in India.
Tata Infrastructure Fund Investment Predominantly in equity / equity related instruments of the companies in theInfrastructure sector in India.
Generate medium to long term capital gain by investing predominantly in equity / equityrelated instruments of the companies in infrastructure and infrastructure related sectorsalong with the income tax benefit to its unitholders.
Name of the Schemes Investment Objective: Long Term Capital Appreciation.
Name of the Schemes Investment objective: Long term capital appreciation by investing in equity/equityrelated instruments of companies in the infrastructure sector in India
Riskometer
Tata Infrastructure Tax Saving Fund

The Macro picture
March-18 February 18
WPICPIIndex of Industrial ProductionRepo rateMarginal Standing Facility Rate
2.5%4.3%
7.1% (for February 2018)6.0% (as on March 31, 2018)
6.25% (as on March 31, 2018)
2.5%4.4%
7.5% (for January 2018)6.0% (as on Feb 28, 2018)
6.25% (as on Feb 28, 2018)
Source: RBI, MOSPI
7www.tatamutualfund.com TATA MUTUAL FUND
MARKET OUTLOOKEquity market
Disclaimer: The views expressed are in no way trying to predict the markets or to time them. The views expressed are for information purpose only and do not construe to be any investment, legal or taxation advice. Please consult your Financial/Investment Adviser before investing. The views expressed may not reflect in the scheme portfolios of Tata Mutual Fund. This note has been prepared using information believed to be accurate at the time of its use.
The Indian equity markets ended higher in the month of April 2018, as both Sensex and Nifty were up by 6.6% and 6.2% respectively. The broader market; the BSE Midcap & the BSE 200 both performed in line with the Sensex with a performance of 6.6% respectively. In terms of sectors; Auto, FMCG, Healthcare, IT, Metals and Realty were the major outperformers whilst Banking, Consumer Durable, Capital Goods, Oil & Gas and Power were the major underperformers. FIIs were net sellers in April, with net outflows to the tune of ~USD 846mn. Consequently, the net FII flows CYTD have been ~USD 1.4 bn. Net equity investments in April 2018 by domestic MFs in the market were ~USD 1.72 bn.
Growth: Index of Industrial Production (IIP) grew 7.1% YoY in February 2018 versus 7.4% in January 2018 driven by manufacturing sector (8.7% YoY) coupled with a higher off-take of capital goods and consumer durables.
The mining sector de-grew marginally. Capital goods saw strong growth at 20% YoY along with infrastructure and construction segment.
Inflation: India’s Wholesale Price Inflation (WPI) Index remained broadly unchanged at 2.5% YoY in March 2018 with primary articles inflation and manufactured products inflation coming in marginally lower and fuel and power inflation higher than the February numbers.
Consumer Price Inflation (CPI) index eased marginally to 4.3% YoY in March 2018 from 4.4% YoY in February 2018 on sequential contraction in retail food prices.
Monetary Policy: In the minutes of the Monetary Policy meeting held in April the Reserve Bank of India (RBI) came out with a hawkish tone highlighting upside risks to inflation – this view was echoed by all the members. As per RBI, inflation upside risks could stem from higher oil prices, government’s stance on minimum support price policy, fiscal slippage and monsoon. The members seemed more comfortable with the recovery in growth and noted recovery getting broad based with signs of pick up in capex and capacity utilization.
Other macro developments: Trade deficit in March widened to ~USD 14bn higher than the monthly average of ~USD 13bn in FY18. Key observations are; non-oil exports growth has slowed to ~2% (vs. 10-11% growth in December 2017) owing to high base and some moderation in global trade; weakness persists in exports of labour - intensive sectors (gems/jewelry, fabrics, etc.) which contracted for the ninth straight month and FY18 trade deficit was USD 157bn, 44% higher YoY.
Market Outlook: Equity markets expanded in the month of April after consolidating in March driven by supportive trends across sectors in the ongoing earnings season.
In the near term, the market will keenly watch the outcome of the Karnataka State elections and impact of a weakening rupee.
Going forward it is expected that consumption would remain one of the key growth drivers. Urban consumption has been strong so far, driven by moderate inflation and interest rates. Rural consumption (driven by increasing food prices and revival in sectors such as construction) is also expected to see a gradual uptick, resulting in a broad based consumption growth.
Risk of significant FII outflows on account of a major global risk off event remains a concern. Crude oil prices and monthly GST collections would be key monitorables going forward.
In terms of our portfolio positioning, we continue to remain overweight on direct and indirect beneficiaries of government push on sectors like roads, railways and housing. We continue to remain overweight on private sector banks on account of their ability to gain market share and maintain relatively higher growth rates. We are also diversifying exposure to consumption plays across multiple themes.
Long-term structural drivers like demographic advantage, low household debt, limited penetration across different consumer categories, increased potential for financial savings and urbanization makes India a compelling equity story from medium to long term perspective.
We believe investors would be well advised to invest with medium to long term perspective and systematically increase exposure to Indian equity markets.
Index NameAs on Return in %
30-Apr-18 28-Mar-18 28-Apr-17 1 Month 1 Year
10739351601701218402
472425834286522238019543113061415413568142771443022382430
101143296915963169944433
24057271982226218477102901315812101133221461421262230
93042991814798153734083
227822532515475178669412
150199619
113031445523301924
6.26.66.68.36.67.45.30.55.89.97.6
12.17.2
-1.35.39.0
15.417.515.019.715.713.413.144.6
9.420.1-5.841.126.3-0.2-3.926.3
Nifty 50 IndexS&P BSE SensexS&P BSE MID CAPS&P BSE SMALL CAPS&P BSE 200S&P BSE AUTOS&P BSE BankexS&P BSE Consumer DurableS&P BSE Capital GoodS&P BSE FMCGS&P BSE Health CareS&P BSE ITS&P BSE METALS&P BSE Oil & GasS&P BSE Power IndexS&P BSE Realty
8www.tatamutualfund.com TATA MUTUAL FUND
MARKET OUTLOOK
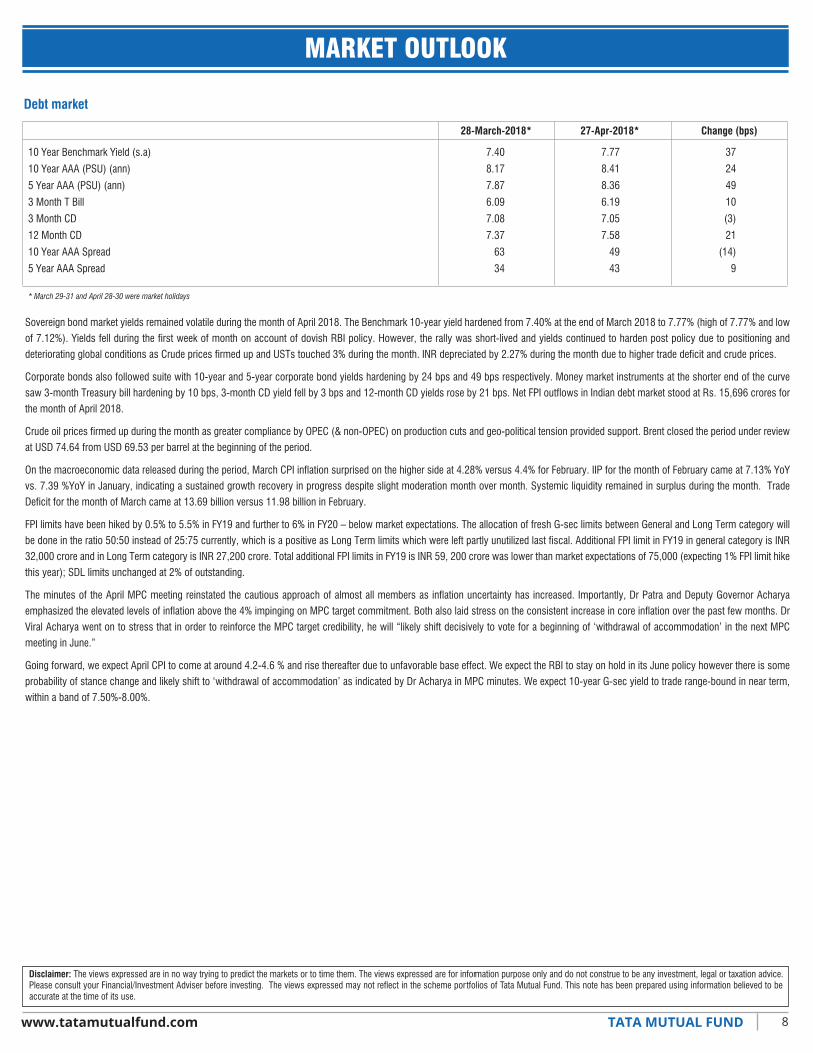
Debt market
Disclaimer: The views expressed are in no way trying to predict the markets or to time them. The views expressed are for information purpose only and do not construe to be any investment, legal or taxation advice. Please consult your Financial/Investment Adviser before investing. The views expressed may not reflect in the scheme portfolios of Tata Mutual Fund. This note has been prepared using information believed to be accurate at the time of its use.
Sovereign bond market yields remained volatile during the month of April 2018. The Benchmark 10-year yield hardened from 7.40% at the end of March 2018 to 7.77% (high of 7.77% and low
of 7.12%). Yields fell during the first week of month on account of dovish RBI policy. However, the rally was short-lived and yields continued to harden post policy due to positioning and
deteriorating global conditions as Crude prices firmed up and USTs touched 3% during the month. INR depreciated by 2.27% during the month due to higher trade deficit and crude prices.
Corporate bonds also followed suite with 10-year and 5-year corporate bond yields hardening by 24 bps and 49 bps respectively. Money market instruments at the shorter end of the curve
saw 3-month Treasury bill hardening by 10 bps, 3-month CD yield fell by 3 bps and 12-month CD yields rose by 21 bps. Net FPI outflows in Indian debt market stood at Rs. 15,696 crores for
the month of April 2018.
Crude oil prices firmed up during the month as greater compliance by OPEC (& non-OPEC) on production cuts and geo-political tension provided support. Brent closed the period under review
at USD 74.64 from USD 69.53 per barrel at the beginning of the period.
On the macroeconomic data released during the period, March CPI inflation surprised on the higher side at 4.28% versus 4.4% for February. IIP for the month of February came at 7.13% YoY
vs. 7.39 %YoY in January, indicating a sustained growth recovery in progress despite slight moderation month over month. Systemic liquidity remained in surplus during the month. Trade
Deficit for the month of March came at 13.69 billion versus 11.98 billion in February.
FPI limits have been hiked by 0.5% to 5.5% in FY19 and further to 6% in FY20 – below market expectations. The allocation of fresh G-sec limits between General and Long Term category will
be done in the ratio 50:50 instead of 25:75 currently, which is a positive as Long Term limits which were left partly unutilized last fiscal. Additional FPI limit in FY19 in general category is INR
32,000 crore and in Long Term category is INR 27,200 crore. Total additional FPI limits in FY19 is INR 59, 200 crore was lower than market expectations of 75,000 (expecting 1% FPI limit hike
this year); SDL limits unchanged at 2% of outstanding.
The minutes of the April MPC meeting reinstated the cautious approach of almost all members as inflation uncertainty has increased. Importantly, Dr Patra and Deputy Governor Acharya
emphasized the elevated levels of inflation above the 4% impinging on MPC target commitment. Both also laid stress on the consistent increase in core inflation over the past few months. Dr
Viral Acharya went on to stress that in order to reinforce the MPC target credibility, he will “likely shift decisively to vote for a beginning of ‘withdrawal of accommodation’ in the next MPC
meeting in June.”
Going forward, we expect April CPI to come at around 4.2-4.6 % and rise thereafter due to unfavorable base effect. We expect the RBI to stay on hold in its June policy however there is some
probability of stance change and likely shift to ‘withdrawal of accommodation’ as indicated by Dr Acharya in MPC minutes. We expect 10-year G-sec yield to trade range-bound in near term,
within a band of 7.50%-8.00%.
28-March-2018* 27-Apr-2018* Change (bps)
10 Year Benchmark Yield (s.a)
10 Year AAA (PSU) (ann)
5 Year AAA (PSU) (ann)
3 Month T Bill
3 Month CD
12 Month CD
10 Year AAA Spread
5 Year AAA Spread
* March 29-31 and April 28-30 were market holidays
7.40
8.17
7.87
6.09
7.08
7.37
63
34
7.77
8.41
8.36
6.19
7.05
7.58
49
43
37
24
49
10
(3)
21
(14)
9

Market Capitalisation wise Exposure
9www.tatamutualfund.com TATA MUTUAL FUND
As on 30th April 2018
INVESTMENT STYLE
INVESTMENT OBJECTIVE
DATE OF ALLOTMENT
May 7, 1998
FUND MANAGER
NAV
FUND SIZE
Rs.799.42 (Rs. in Cr.)
MONTHLY AVERAGE AUM
Rs.785.18 (Rs. in Cr.)
TURN OVER
Portfolio Turnover (Total)Portfolio Turnover (Equity component only)
20.28%20.28%
EXPENSE RATIO**
DirectRegular
1.052.66
VOLATILITY MEASURES^ FUND BENCHMARK
Std. Dev (Annualised)Sharpe RatioPortfolio BetaR SquaredTreynorJenson
13.760.111.001.000.45
NA
13.470.090.930.910.39
-0.06
MINIMUM INVESTMENT /MULTIPLES FOR NEW INVESTMENT
Rs. 5,000/- and in multiples of Re. 1/- thereafter.
ADDITIONAL INVESTMENT/MULTIPLES FOR EXISTING INVESTORS
Rs. 1,000/- and multiples of Re. 1/- thereafter.
LOAD STRUCTURE
Entry Load : Not Applicable
Exit Load :
PORTFOLIO
Company name No. of Shares
Market ValueRs. Lakhs
% of Assets
99.58
3.751.88
1.54
11.155.673.032.922.121.90
2.421.34
2.88
5.012.191.63
1.871.67
1.67
1.02
2.211.28
34000442000
352000
458500159475020000094700046864080000
4700098000
164350
1422500116000414000
7850071000
411554
1020000
134700091500
79610.35
2999.751503.68
1232.53
8915.994536.272420.702332.461696.711518.56
1931.681069.23
2301.89
4003.631750.501305.34
1496.251338.10
1337.55
811.92
1769.961025.76
SIP - If you had invested INR 10000 every month1 Year 3 Year 5 Year 7 Year 10 Year Since Inception
Total Amount Invested (Rs.)
Total Value as on Apr 30, 2018 (Rs.)
Returns
Total Value of B: S&P BSE Sensex TRI
B: S&P BSE Sensex TRI
(Inception date :07-May-1998) (First Installment date : 01-Jun-1998)
1,20,000
1,24,761
7.50%
1,30,133
16.15%
3,60,000
4,30,116
11.94%
4,51,311
15.29%
6,00,000
8,26,694
12.80%
8,38,606
13.38%
8,40,000
13,50,148
13.33%
13,56,018
13.46%
12,00,000
23,74,094
13.09%
23,33,072
12.77%
23,90,000
2,14,11,904
18.96%
1,23,29,822
14.50%
Company name
Industrial ProductsCummins India Ltd.Media & EntertainmentZee Entertainment Enterprises Ltd.D.B.Corp Ltd.Petroleum ProductsReliance Industries Ltd.PowerPower Grid Corporation Of India Ltd.RetailingFuture Retail Ltd.SoftwareInfosys Ltd.HCL Technologies Ltd.Tata Elxsi Ltd.Textile ProductsRaymond Ltd.TransportationContainer Corporation Of India Ltd.Interglobe Aviation Ltd.
187131
242000365000
452000
1170000
448000
290000323350213000
198000
11600065000
1440.63
1420.181096.83
4353.21
2429.51
2708.38
3478.263399.702634.28
2198.89
1514.55909.81
1.80
1.781.37
5.45
3.04
3.39
4.354.253.30
2.75
1.891.14
Other Equities^RepoPortfolio TotalNet Current LiabilitiesNet Assets
4727.66660.66
80271.01-328.61
79942.40
5.910.83
100.41-0.41
100.00
Top 10 Holdings Equity Industry Allocation
NAV Movement
Primarily invests in equity and equity related instruments of large market cap companies.
To provide income distribution and / or medium to long term capital gains while at all times emphasising the importance of capital appreciation.
Gopal Agrawal (Managing Since 27-Jun-17 and overall experience of 21 years)
BENCHMARK
S&P BSE Sensex TRI
Direct - GrowthDirect - DividendReg - GrowthReg - Dividend
::::
225.436251.2123
210.842745.9914
^Risk-free rate based on the FBIL Overnight MIBOR rate of 6% as on Apr 27, 2018
For calculation methodology please refer to Pg 48
Please refer to our Tata Mutual Fund website for fundamental changes, wherever applicable
1% if redeemed on or before expiry of 365 days from the date of allotment.
Equity & Equity Related TotalAutoMaruti Suzuki India Ltd.Tata Motors Ltd.Auto AncillariesMotherson Sumi Systems Ltd.BanksHDFC Bank Ltd.ICICI Bank Ltd.Kotak Mahindra Bank Ltd.State Bank Of IndiaYes Bank Ltd.Indusind Bank Ltd.CementUltratech Cement Ltd.Grasim Industries Ltd.Construction ProjectLarsen & Toubro Ltd.Consumer Non DurablesITC Ltd.Hindustan Unilever Ltd.Eveready Industries India Ltd.FinanceBajaj Finance Ltd.Housing Development Finance Ltd.GasGail ( India ) Ltd.Healthcare ServicesMax India Ltd.Industrial Capital GoodsBharat Electronics Ltd.Siemens Ltd.
Issuer NameHDFC Bank Ltd.ICICI Bank Ltd.Reliance Industries Ltd.ITC Ltd.Infosys Ltd.HCL Technologies Ltd.Maruti Suzuki India Ltd.Future Retail Ltd.Tata Elxsi India Ltd.Power Grid Corporation Of India Ltd.Total
% to NAV11.155.675.455.014.354.253.753.393.303.04
49.36
Large CapMid CapSmall Cap
^ Exposure less than 1% has been clubbed under Other Equities
No. of Shares
Market ValueRs. Lakhs
% of Assets
Past performance may or may not be sustained in the future. Returns greater than 1 year period are compounded annualized. Dividends are assumed to be reinvested and bonus is adjusted. Load is not taken in to consideration. For SIP returns, monthly investment of equal amounts invested on the 1st day of every month has been considered. For scheme performance refer pages 36 - 48.*B: BenchmarkSource: MFI Explorer
86.36%13.64%0.00%
Market Capitalisation includes only domestic listed Equity exposure in BSE. Large Cap Companies are top 125 stocks by market capitalisation on S&P BSE 500 Index and Mid Cap stocks are those between 126 to 499 stocks by market capitalisation and 500 & above being classified as Small cap. For calculation purpose, the previous month market capitalisation data have been used. All the figures has been rebased to 100 (Based on internal calculation).
**Note: The rates specified are the actual weighted average expenses charged for the month of Apr 2018. The above ratio includes the Service tax on Investment Management Fees. The above ratio excludes, proportionate charge (out of maximum 30 bps on daily average net assets allowed) in respect sales beyond T-30 cities assets, wherever applicable.
Tata Large Cap Fund (Erstwhile known as Tata Pure Equity Fund; renamed w.e.f February 29, 2016)(An Open-Ended Equity Scheme)
26.80%12.05%
9.36%7.16%
5.45%3.75%3.55%3.50%3.39%3.24%3.04%3.03%2.88%2.75%2.39%
1.80%1.67%1.59%1.45%
0.74%
0.00% 5.00% 10.00% 15.00% 20.00% 25.00% 30.00%
BanksSoftware
Consumer Non DurablesAuto
Petroleum ProductsCementFinance
Industrial Capital GoodsRetailing
Media & EntertainmentPower
TransportationConstruction Project
Textile ProductsAuto Ancillaries
Industrial ProductsGas
PharmaceuticalsHealthcare Services
Non - Ferrous Metals
80
94
108
122
136
150
Apr-15 Apr-16 Apr-17 Apr-18
Tata Large Cap Fund - Reg - GrowthS&P BSE Sensex TRI

Past performance may or may not be sustained in the future. Returns greater than 1 year period are compounded annualized. Dividends are assumed to be reinvested and bonus is adjusted. Load is not taken in to consideration. For SIP returns, monthly investment of equal amounts invested on the 1st day of every month has been considered.For scheme performance refer pages 36 - 48.*B: Benchmark, AB: Additional BenchmarkSource: MFI Explorer
Please refer to our Tata Mutual Fund website for fundamental changes, wherever applicable
VOLATILITY MEASURES^ FUND BENCHMARK
Std. Dev (Annualised)Sharpe RatioPortfolio BetaR SquaredTreynorJenson
14.140.161.001.000.64
NA
14.780.121.010.930.50
-0.13
10www.tatamutualfund.com TATA MUTUAL FUND
As on 30th April 2018
INVESTMENT STYLE
INVESTMENT OBJECTIVE
DATE OF ALLOTMENT
February 25,1993
FUND MANAGER
NAV
Direct - GrowthDirect - DividendReg - GrowthReg - Dividend
::::
213.331442.6428
200.609733.2211
FUND SIZE
Rs.1297.88 (Rs. in Cr.)
TURN OVER
Portfolio Turnover (Total)Portfolio Turnover (Equity component only)
57.94%57.94%
MINIMUM INVESTMENT/ MULTIPLES FOR NEW INVESTMENT
Rs. 5,000/- and in multiples of Re. 1/- thereafter.
ADDITIONAL INVESTMENT/ MULTIPLES FOR EXISTING INVESTORS
Rs. 1,000/- and multiples of Re. 1/- thereafter.
LOAD STRUCTURE
Entry Load : Not Applicable
Exit Load :
PORTFOLIO
Company name No. of Shares
Market ValueRs. Lakhs
% of Assets
127359.87
3529.12
3248.91
1669.38
8945.16
6599.24
5231.62
5167.81
1600.95
3082.46
3048.25
2509.81
1399.61
1646.19
3269.37
1475.87
3672.63
3667.22
3140.46
2187.20
2164.73
4249.90
2678.40
1440.18
2759.41
1602.45
98.13
2.72
2.50
1.29
6.89
5.08
4.03
3.98
1.23
2.38
2.35
1.93
1.08
1.27
2.52
1.14
2.83
2.83
2.42
1.69
1.67
3.27
2.06
1.11
2.13
1.23
40000
955000
250000
460000
2320000
1445000
426968
650000
75000
100000
14900
170000
131202
1010000
527473
2750000
261832
822865
400000
270000
1510000
900000
120000
464000
900000
Company name No. of Shares
Market ValueRs. Lakhs
% of Assets
Other Equities^RepoPortfolio TotalNet Current LiabilitiesNet Assets
5427.193045.72
130405.59-617.10
129788.49
4.182.36
100.49-0.49
100.00
SIP - If you had invested INR 10000 every month1 Year 3 Year 5 Year 7 Year 10 Year Since Inception
Total Amount Invested (Rs.)
Total Value as on Apr 30, 2018 (Rs.)
Returns
Total Value of B: S&P BSE 500 TRI
B: S&P BSE 500 TRI
Total Value of AB: S&P BSE Sensex TRI
AB: S&P BSE Sensex TRI
(Inception date :25-Feb-1993) (First Installment date : 01-Mar-1993)
3,60,000
4,39,847
13.49%
4,65,625
17.49%
4,51,311
15.29%
1,20,000
1,26,508
10.29%
1,29,086
14.45%
1,30,133
16.15%
6,00,000
8,87,121
15.66%
9,07,301
16.58%
8,38,606
13.38%
8,40,000
14,97,949
16.25%
14,80,674
15.92%
13,56,018
13.46%
12,00,000
26,58,255
15.21%
25,68,107
14.56%
23,33,072
12.77%
30,20,000
3,80,38,936
17.46%
2,56,38,854
14.92%
1,91,34,798
13.02%
Rupesh Patel (Managing Since 7-Jun-13 and overall experience of 17 years)
Primarily focuses on investing in equity and equity related instruments of well researched value and growth oriented companies across all market capitalization.
To provide income distribution and / or medium to long term capital gains while at all times emphasizing the importance of capital appreciation.
^Risk-free rate based on the FBIL Overnight MIBOR rate of 6% as on Apr 27, 2018
1% if redeemed on or before expiry of 365 days from the date of allotment.
For calculation methodology please refer to Pg 48
Equity & Equity Related Total
Auto
Maruti Suzuki India Ltd.
Tata Motors Ltd.
TVS Motor Company Ltd.
Banks
HDFC Bank Ltd.
ICICI Bank Ltd.
Yes Bank Ltd.
Kotak Mahindra Bank Ltd.
State Bank Of India
Cement
Ultratech Cement Ltd.
Dalmia Bharat Ltd.
Shree Cement Ltd.
The Ramco Cements Ltd.
Commercial Services
Security And Intelligence Services (India) Ltd.
Construction
KNR Constructions Ltd.
Brigade Enterprises Ltd.
Construction Project
NCC Ltd.
Larsen & Toubro Ltd.
Sadbhav Engineering Ltd.
Consumer Durables
Havells India Ltd.
Bata India Ltd.
Consumer Non Durables
ITC Ltd.
Tata Global Beverages Ltd.
Asian Paints (India) Ltd.
Ferrous Metals
Tata Steel Ltd.
Gas
Gujarat State Petronet Ltd.
^ Exposure less than 1% has been clubbed under Other Equities
Top 10 Holdings Equity Industry Allocation
Market Capitalisation wise Exposure NAV Movement
Issuer NameHDFC Bank Ltd.ICICI Bank Ltd.Yes Bank Ltd.Kotak Mahindra BankITC Ltd.Interglobe Aviation Ltd.Larsen & Toubro Ltd.NCC Ltd.Maruti Suzuki India Ltd.KNR ConstructionTotal
% to NAV6.895.084.033.983.273.192.832.832.722.52
37.34
Large CapMid CapSmall Cap
Oil
Oil & Natural Gas Co.
Finance
ICICI Prudential Life Insurance Company Ltd.
Housing Development Finance Ltd.
Muthoot Finance Ltd.
Mahindra And Mahindra Financial Services Ltd.
Equitas Holdings Ltd.
LIC Housing Finance Ltd.
Petroleum Products
Reliance Industries Ltd.
Indian Oil Corporation Ltd.
Hindustan Petroleum Corporation Ltd.
Pharmaceuticals
Divi Laboratories Ltd.
Sun Pharmaceutical Industries Ltd.
Piramal Enterprises Ltd. (Ccd 18Mths)
Dishman Carbogen Amcis Ltd.
Laurus Labs Ltd.
Power
Power Grid Corporation Of India Ltd.
Retailing
Future Retail Ltd.
Software
Infosys Ltd.
HCL Technologies Ltd.
Transportation
Interglobe Aviation Ltd.
790000
550000
110000
410000
300000
900000
240000
270000
1310000
690000
200000
416000
1670
462662
254000
1000000
500000
200000
200000
296210
1425.95
2348.23
2073.12
1852.59
1583.25
1392.30
1311.12
2600.37
2126.13
2102.09
2393.50
2197.10
1770.20
1722.26
1301.24
2076.50
3022.75
2398.80
2102.80
4146.05
1.10
1.81
1.60
1.43
1.22
1.07
1.01
2.00
1.64
1.62
1.84
1.69
1.36
1.33
1.00
1.60
2.33
1.85
1.62
3.19
Market Capitalisation includes only domestic listed Equity exposure in BSE. Large Cap Companies are top 125 stocks by market capitalisation on S&P BSE 500 Index and Mid Cap stocks are those between 126 to 499 stocks by market capitalisation and 500 & above being classified as Small cap. For calculation purpose, the previous month market capitalisation data have been used. All the figures has been rebased to 100 (Based on internal calculation).
76.23%16.81%6.95%
MONTHLY AVERAGE AUM
Rs.1265.13 (Rs. in Cr.)
EXPENSE RATIO**
DirectRegular
0.882.50
BENCHMARK
S&P BSE 500 TRI
**Note: The rates specified are the actual weighted average expenses charged for the month of Apr 2018. The above ratio includes the Service tax on Investment Management Fees. The above ratio excludes, proportionate charge (out of maximum 30 bps on daily average net assets allowed) in respect sales beyond T-30 cities assets, wherever applicable.
Tata Equity Opportunities Fund(An Open-Ended Equity Scheme)
21.22%8.97%
8.66%8.07%
7.23%7.18%
6.45%5.26%
3.66%3.47%3.35%3.19%
2.33%2.17%
1.60%1.27%1.23%1.10%0.96%0.75%
0.01%
0.00% 5.00% 10.00% 15.00% 20.00% 25.00%
BanksFinanceCement
Construction ProjectPharmaceuticals
AutoConsumer Non Durables
Petroleum ProductsConstruction
SoftwareConsumer Durables
TransportationRetailing
Ferrous MetalsPower
Commercial ServicesGasOil
Auto AncillariesNon - Ferrous Metals
Media & Entertainment
80
96
112
128
144
160
Apr-15 Apr-16 Apr-17 Apr-18
Tata Equity Opportunities Fund - Reg - GrowthS&P BSE 500 TRI

Please refer to our Tata Mutual Fund website for fundamental changes, wherever applicable
VOLATILITY MEASURES^ FUND BENCHMARK
Std. Dev (Annualised)Sharpe RatioPortfolio BetaR SquaredTreynorJenson
12.970.211.001.000.79
NA
12.010.100.860.870.41
-0.32
11www.tatamutualfund.com TATA MUTUAL FUND
As on 30th April 2018
INVESTMENT STYLE
INVESTMENT OBJECTIVE
DATE OF ALLOTMENT
May 24,1996
FUND MANAGER
NAV
Direct - GrowthDirect - DividendReg - GrowthReg - Dividend
::::
173.1488101.0836165.2514
73.5461
FUND SIZE
Rs.517.86 (Rs. in Cr.)
TURN OVER
Portfolio Turnover (Total)Portfolio Turnover (Equity component only)
51.21%51.21%
MINIMUM INVESTMENT/MULTIPLES FOR NEW INVESTMENT
Rs. 5,000/- and in multiples of Re. 1/- thereafter.
ADDITIONAL INVESTMENT/MULTIPLES FOR EXISTING INVESTORS
Rs. 1,000/- and multiples of Re. 1/- thereafter.
LOAD STRUCTURE
Entry Load : Not Applicable
Exit Load :
PORTFOLIO
Company name
48448.68
3820.271168.65
1617.53588.90559.17532.98525.23
1685.081150.00
534.07
965.40747.88
1146.501030.10864.40797.53546.80
3651.902257.771249.921224.15658.44
931.66680.10
93.56
7.382.26
3.121.141.081.031.01
3.252.22
1.03
1.861.44
2.211.991.671.541.06
7.054.362.412.361.27
1.801.31
4330031300
20000200000
70061849
150000
41000460000
70000
150000560000
14300010500013200050400
100000
24200041000
420000102000
7000
286666300000
Company name No. of Shares
Market ValueRs. Lakhs
% of Assets
No. of Shares
Market ValueRs. Lakhs
% of Assets
8169678000
39000016127113218616000
298000
170000502000
505000330000
15100093750
220000
225000
200000
549000
933.58874.42
1456.261126.401017.63864.00744.70
1243.811105.66
981.97535.59
916.04704.39
1330.01
1510.99
994.20
813.62
1.801.69
2.812.181.971.671.44
2.402.14
1.901.03
1.771.36
2.57
2.92
1.92
1.57
Other Equities^Portfolio TotalCash / Net Current AssetNet Assets
4.5693.566.44
100.00
2360.9848448.683337.57
51786.25
SIP - If you had invested INR 10000 every month1 Year 3 Year 5 Year 7 Year 10 Year Since Inception
Total Amount Invested (Rs.)
Total Value as on Apr 30, 2018 (Rs.)
Returns
Total Value of B: Nifty 500 Shariah TRI
B: Nifty 500 Shariah TRI
Total Value of AB: Nifty 50 TRI
AB: Nifty 50 TRI
(Inception date :24-May-1996) (First Installment date : 01-Sep-1996)
1,20,000
1,30,515
16.78%
1,28,631
13.71%
1,28,627
13.71%
3,60,000
4,36,949
13.03%
4,71,100
18.32%
4,49,584
15.02%
6,00,000
8,64,171
14.59%
9,39,870
18.02%
8,42,764
13.58%
8,40,000
14,65,703
15.64%
15,77,635
17.70%
13,59,145
13.52%
12,00,000
27,47,354
15.82%
27,64,390
15.93%
23,29,851
12.74%
26,00,000
2,86,63,972
18.81%
76,73,142
9.03%
1,56,54,224
14.40%
An equity scheme which invests primarily in equities of Shariah compliant companies and other instrument if allowed under Shariah principles.
To provide medium to long- term capital gains by investing in Shariah compliant equity and equity related instruments of well-researched value and growth - oriented companies.
^Risk-free rate based on the FBIL Overnight MIBOR rate of 6% as on Apr 27, 2018
Pradeep Gokhale (Managing Since 2-Jan-12 and overall experience of 26 years)
For calculation methodology please refer to Pg 48
1% of the applicable NAV, if redeemed on or before 365 days from the date of allotment. (w.e.f. 6th April, 2015)
Equity & Equity Related TotalAutoMaruti Suzuki India Ltd.Hero Motocorp Ltd.Auto AncillariesWabco India Ltd.Apollo Tyres Ltd.MRF Ltd.Amara Raja Batteries Ltd.Motherson Sumi Systems Ltd.CementUltratech Cement Ltd.Ambuja Cements Ltd.ChemicalsTata Chemicals Ltd.Construction ProjectVoltas Ltd.NCC Ltd.Consumer DurablesBata India Ltd.Titan Company Ltd.Bajaj Electricals Ltd.Whirlpool Of India Ltd.Havells India Ltd.Consumer Non DurablesHindustan Unilever Ltd.Britannia Industries Ltd.Tata Global Beverages Ltd.Asian Paints (India) Ltd.Nestle India Ltd.GasGail ( India ) Ltd.Petronet Lng Ltd.
Top 10 Holdings Equity Industry Allocation
Market Capitalisation wise Exposure NAV Movement
Issuer NameMaruti Suzuki India Ltd.Hindustan Unilever Ltd.Britannia Industries Ltd.Ultratech Cement Ltd.Wabco India Ltd.Tech Mahindra Ltd.Carborundum Universal Ltd.Future Retail Ltd.Tata Global Beverages Ltd.UPL Ltd.Total
% to NAV7.387.054.363.253.122.922.812.572.412.40
38.27
Large CapMid CapSmall Cap
Industrial Capital GoodsThermax Ltd.Siemens Ltd.Industrial ProductsCarborundum Universal Ltd.Finolex Cables Ltd.Cummins India Ltd.Schaeffler Ltd.Mahindra Cie Automotive Ltd.PesticidesUPL Ltd.Rallis India Ltd.Petroleum ProductsCastrol India Ltd.Indian Oil Corporation Ltd.PharmaceuticalsCipla Ltd.Ipca Laboratories Ltd.RetailingFuture Retail Ltd.SoftwareTech Mahindra Ltd.Textile ProductsMayur Uniquoters Ltd.TransportationGujarat Pipavav Port Ltd.
^ Exposure less than 1% has been clubbed under Other Equities
56.24%40.85%2.91%
Market Capitalisation includes only domestic listed Equity exposure in BSE. Large Cap Companies are top 125 stocks by market capitalisation on S&P BSE 500 Index and Mid Cap stocks are those between 126 to 499 stocks by market capitalisation and 500 & above being classified as Small cap. For calculation purpose, the previous month market capitalisation data have been used. All the figures has been rebased to 100 (Based on internal calculation).
Past performance may or may not be sustained in the future. Returns greater than 1 year period are compounded annualized. Dividends are assumed to be reinvested and bonus is adjusted. Load is not taken in to consideration. For SIP returns, monthly investment of equal amounts invested on the 1st day of every month has been considered.For scheme performance refer pages 36 - 48.*B: Benchmark, AB: Additional BenchmarkSource: MFI Explorer
BENCHMARK
Nifty 500 Shariah TRI
MONTHLY AVERAGE AUM
Rs.502.69 (Rs. in Cr.)
EXPENSE RATIO**
DirectRegular
1.742.76
**Note: The rates specified are the actual weighted average expenses charged for the month of Apr 2018. The above ratio includes the Service tax on Investment Management Fees. The above ratio excludes, proportionate charge (out of maximum 30 bps on daily average net assets allowed) in respect sales beyond T-30 cities assets, wherever applicable.
Tata Ethical Fund(An Open-Ended Equity Scheme)
17.46%10.55%
9.63%8.47%
7.38%6.39%
4.54%4.41%4.35%
3.31%3.13%3.11%2.93%
2.57%1.92%
1.57%1.03%
0.80%
0.00% 5.00% 10.00% 15.00% 20.00%
Consumer Non DurablesIndustrial Products
AutoConsumer Durables
Auto AncillariesCement
PesticidesIndustrial Capital Goods
SoftwareConstruction Project
PharmaceuticalsGas
Petroleum ProductsRetailing
Textile ProductsTransportation
ChemicalsConstruction
90
106
122
138
154
170
Apr-15 Apr-16 Apr-17 Apr-18
Tata Ethical Fund - Reg - GrowthNifty 500 Shariah TRI

Please refer to our Tata Mutual Fund website for fundamental changes, wherever applicable
VOLATILITY MEASURES^ FUND BENCHMARK
12www.tatamutualfund.com TATA MUTUAL FUND
As on 30th April 2018
INVESTMENT STYLE
INVESTMENT OBJECTIVE
DATE OF ALLOTMENT
June 29, 2004
FUND MANAGER
NAV
Direct - GrowthDirect - Dividend (Trigger Option A 5%)Direct - Dividend (Trigger Option B 10%)Reg - GrowthReg - Dividend (Trigger Option A 5%)Reg - Dividend (Trigger Option B 10%)
149.023064.286963.5421
143.716363.011960.5630
FUND SIZE
Rs.3519.81 (Rs. in Cr.)
TURN OVER
Portfolio Turnover (Total)Portfolio Turnover (Equity component only)
70.90%70.90%
MINIMUM INVESTMENT/ MULTIPLES FOR NEW INVESTMENT
Rs. 5,000/- and in multiples of Re. 1/- thereafter.
ADDITIONAL INVESTMENT/MULTIPLES FOR EXISTING INVESTORS
Rs. 1,000/- and multiples of Re. 1/- thereafter.
LOAD STRUCTURE
Entry Load : Not Applicable
Exit Load :
PORTFOLIO
Company name No. of Shares
Market ValueRs. Lakhs
% of Assets
329352.76
14227.0512217.108436.296011.264208.483606.12
5327.70
28964.007082.08
13092.603980.143546.10
8621.34
10504.503919.52
4527.153783.153726.64
31662.126890.715399.80
6150.38
93.57
4.043.472.401.711.201.02
1.51
8.232.01
3.721.131.01
2.45
2.981.11
1.291.071.06
9.001.961.53
1.75
4826001400000513000016100047700
1060000
2150000
80000003850000
1200000175918355000
1130000
750000609000
300000900000146200
168000015250003800000
1892426
Company name
5300000
1101468
2110000
24400002700000925000
6682000
934620
1250000905000
465000
322588
6964.20
7693.20
12382.54
23499.644382.103590.39
13875.17
5650.25
8394.387312.40
5164.06
4515.26
1.98
2.19
3.52
6.681.251.02
3.94
1.61
2.382.08
1.47
1.28
Other Equities^RepoPortfolio TotalNet Current LiabilitiesNet Assets
30044.9423175.28
352528.04-547.37
351980.67
8.546.68
100.25-0.25
100.00
SIP - If you had invested INR 10000 every month1 Year 3 Year 5 Year 7 Year 10 Year Since Inception
Total Amount Invested (Rs.)
Total Value as on Apr 30, 2018 (Rs.)
Returns
Total Value of B: S&P BSE Sensex TRI
B: S&P BSE Sensex TRI
(Inception date :29-Jun-2004) (First Installment date : 01-Jul-2004)
1,20,000
1,29,758
15.54%
1,30,133
16.15%
3,60,000
5,03,686
23.13%
4,51,311
15.29%
6,00,000
10,90,184
24.16%
8,38,606
13.38%
8,40,000
18,49,023
22.17%
13,56,018
13.46%
12,00,000
33,83,493
19.69%
23,33,072
12.77%
16,60,000
67,85,445
18.59%
43,24,617
12.88%
Primarily invests at least 70% of the net assets in equity shares whose rolling P/E ratio on past four quarter earnings for individual companies is less than rolling P/E of the S&P BSE SENSEX stocks.
To provide reasonable and regular income and/ or possible capital appreciation to its Unitholder.
Std. Dev (Annualised)Sharpe RatioPortfolio BetaR SquaredTreynorJensonPE
13.760.111.001.000.45
NA23.83
16.370.210.990.701.000.55
24.42
^Risk-free rate based on the FBIL Overnight MIBOR rate of 6% as on Apr 27, 2018
For calculation methodology please refer to Pg 48
1% if redeemed on or before 18 months from the date of allotment (w.e.f 5th April, 2018)
Equity & Equity Related TotalAutoBajaj Auto Ltd.Mahindra & Mahindra Ltd.Ashok Leyland Ltd.Hero Motocorp Ltd.Maruti Suzuki India Ltd.Tata Motors Ltd.Auto AncillariesExide Industries Ltd.BanksYes Bank Ltd.City Union Bank Ltd.CementGrasim Industries Ltd.Hil Ltd.J K Cement Ltd.ChemicalsTata Chemicals Ltd.Construction ProjectLarsen & Toubro Ltd.Voltas Ltd.Consumer Non DurablesHindustan Unilever Ltd.Radico Khaitan Ltd.Jubilant Foodworks Ltd.FinanceHousing Development Finance Ltd.Muthoot Finance Ltd.JM Financial Ltd.GasGail ( India ) Ltd.
Top 10 Holdings Equity Industry Allocation
Market Capitalisation wise Exposure NAV Movement
Issuer NameHDFC Ltd.Yes Bank Ltd.Reliance Industries Ltd.Bajaj Auto Ltd.Power Grid Corporation Of India Ltd.Grasim Industries Ltd.Zee Entertainment Enterprises Ltd.Mahindra & Mahindra Ltd.Larsen & Toubro Ltd.Tata Chemicals Ltd.Total
% to NAV9.008.236.684.043.943.723.523.472.982.45
48.03
Large CapMid CapSmall Cap
Industrial Capital GoodsBharat Electronics Ltd.Industrial ProductsFinolex Cables Ltd.Media & EntertainmentZee Entertainment Enterprises Ltd.Petroleum ProductsReliance Industries Ltd.Indian Oil Corporation Ltd.Bharat Petroleum Corporation Ltd.PowerPower Grid Corporation Of India Ltd.RetailingFuture Retail Ltd.SoftwareTech Mahindra Ltd.Persistent Systems Ltd.Textile ProductsRaymond Ltd.TransportationInterglobe Aviation Ltd.
^ Exposure less than 1% has been clubbed under Other Equities
No. of Shares
Market ValueRs. Lakhs
% of Assets
72.91%25.36%1.73%
Market Capitalisation includes only domestic listed Equity exposure in BSE. Large Cap Companies are top 125 stocks by market capitalisation on S&P BSE 500 Index and Mid Cap stocks are those between 126 to 499 stocks by market capitalisation and 500 & above being classified as Small cap. For calculation purpose, the previous month market capitalisation data have been used. All the figures has been rebased to 100 (Based on internal calculation).
Past performance may or may not be sustained in the future. Returns greater than 1 year period are compounded annualized. Dividends are assumed to be reinvested and bonus is adjusted. Load is not taken in to consideration. For SIP returns, monthly investment of equal amounts invested on the 1st day of every month has been considered.For scheme performance refer pages 36-48.*B: BenchmarkSource: MFI Explorer
BENCHMARK
S&P BSE Sensex TRI
MONTHLY AVERAGE AUM
Rs.3216.75 (Rs. in Cr.)
EXPENSE RATIO**
DirectRegular 1.26
2.15
::::::
Sonam Udasi (Managing Since 1-Apr-16 and overall experience of 20 years)
**Note: The rates specified are the actual weighted average expenses charged for the month of Apr 2018. The above ratio includes the Service tax on Investment Management Fees. The above ratio excludes, proportionate charge (out of maximum 30 bps on daily average net assets allowed) in respect sales beyond T-30 cities assets, wherever applicable.
Tata Equity P/E Fund(An open ended equity scheme following a value investment strategy)
80
98
116
134
152
170
Apr-15 Apr-16 Apr-17 Apr-18
Tata Equity P/E Fund - Reg - GrowthS&P BSE Sensex TRI
14.65%13.84%
10.24%8.94%
5.86%4.46%4.44%4.31%4.10%3.94%
3.31%2.92%2.75%2.45%
1.98%1.61%1.47%1.28%
0.71%0.19%0.13%
0.00% 5.00% 10.00% 15.00% 20.00%
FinanceAuto
BanksPetroleum Products
CementSoftware
Media & EntertainmentConsumer Non Durables
Construction ProjectPower
Auto AncillariesIndustrial Products
GasChemicals
Industrial Capital GoodsRetail ing
Textile ProductsTransportation
FertilisersPaper
Hotels, Resorts And Other Recreational…

Please refer to our Tata Mutual Fund website for fundamental changes, wherever applicable
VOLATILITY MEASURES^ FUND BENCHMARK
13www.tatamutualfund.com TATA MUTUAL FUND
As on 30th April 2018
INVESTMENT STYLE
INVESTMENT OBJECTIVE
DATE OF ALLOTMENT
July 1, 1994
FUND MANAGER
NAV
Direct - GrowthDirect - DividendReg - GrowthReg - Dividend
::::
148.048652.4589
142.155642.8920
FUND SIZE
Rs.692.48 (Rs. in Cr.)
TURN OVER
Portfolio Turnover (Total)Portfolio Turnover (Equity component only)
43.25%43.25%
MINIMUM INVESTMENT/MULTIPLES FOR NEW INVESTMENT
Rs. 5,000/- and in multiples of Re. 1/- thereafter.
ADDITIONAL INVESTMENT/MULTIPLES FOR EXISTING INVESTORS
Rs. 1,000/- and multiples of Re. 1/- thereafter.
LOAD STRUCTURE
Entry Load : Not Applicable
Exit Load :
PORTFOLIO
Company name No. of Shares
Market ValueRs. Lakhs
% of Assets
66635.70
1292.631153.51
736.13
2335.221416.42
1684.441636.911169.09
998.90707.73
1292.221252.371029.71
748.85
2492.491422.561122.66
886.28
1894.341869.70
994.13
1442.071093.60
928.03801.75
1221.731056.48
785.40
894.66732.50
96.23
1.871.671.06
3.372.05
2.432.361.691.441.02
1.871.811.491.08
3.602.051.621.28
2.742.701.44
2.081.581.341.16
1.761.53
1.13
1.291.06
150000465500250000
645000770000
1000053700
142000100000294763
167495118500115000100000
7700001360000
401236157800
4963541400000
750000
180000200000
75900100000
20000355000
400000
1980001250000
Company name
174000165000
680000400000
875000
5050008500020000
900000
209300
20000100000360000
720000
162024794
4500003300000
270000
74000
300000
140000
706.70704.47
1210.74906.80
1293.69
1262.001227.951080.00
725.40
738.10
936.15868.90792.90
1168.56
1262.00841.64
2720.481966.80
950.40
915.20
1272.45
1959.58
1.021.02
1.751.31
1.87
1.821.771.56
1.05
1.07
1.351.251.15
1.69
1.821.22
3.932.841.37
1.32
1.84
2.83
Other Equities^RepoPortfolio TotalNet Current LiabilitiesNet Assets
4032.283000.70
69636.40-388.27
69248.13
5.824.35
100.58-0.58
100.00
An equity scheme with focus towards mid cap stocks.
To provide income distribution and / or medium to long term capital gains. Investments would be focused towards mid-cap stocks.
Rupesh Patel (Managing Since 27-Jun-17 and overall experience of 17 years ) & Danesh Mistry (Assistant fund manager) (Managing Since 1-Apr-16 and overall experience of 14 years)
Std. Dev (Annualised)Sharpe RatioPortfolio BetaR SquaredTreynorJenson
16.510.211.001.000.98
NA
17.370.121.000.890.62
-0.36
^Risk-free rate based on the FBIL Overnight MIBOR rate of 6% as on Apr 27, 2018
For calculation methodology please refer to Pg 48
1% if redeemed on or before expiryof 365 days from the date ofallotment (w.e.f. 6th April, 2015)
Top 10 Holdings Equity Industry Allocation
NAV Movement
Issuer NameFuture Retail Ltd.KNR ConstructionYes Bank Ltd.Future Consumer Ltd.Interglobe Aviation Ltd.Sadbhav Engineering Ltd.NCC Ltd.Shree Cement Ltd.Dalmia Bharat Ltd.Blue Star Ltd.Total
% to NAV3.933.603.372.842.832.742.702.432.362.08
28.88
Equity & Equity Related TotalAuto AncillariesAmara Raja Batteries Ltd.Exide Industries Ltd.Apollo Tyres Ltd.BanksYes Bank Ltd.City Union Bank Ltd.CementShree Cement Ltd.Dalmia Bharat Ltd.The Ramco Cements Ltd.J K Cement Ltd.NCL Industries Ltd.ChemicalsNavin Fluorine International Ltd.Solar Industries India Ltd.Vinati Organics Ltd.Gujarat Alkalies & Chemicals Ltd.ConstructionKNR Constructions Ltd.NBCC India Ltd.Brigade Enterprises Ltd.Somany Ceramics Ltd.Construction ProjectSadbhav Engineering Ltd.NCC Ltd.Sadbhav Infrastructure Project Ltd.Consumer DurablesBlue Star Ltd.Havells India Ltd.IFB Industries Ltd.Bata India Ltd.Consumer Non DurablesGlaxo Smithkline Con Healthcar Ltd.Tata Global Beverages Ltd.FertilisersChambal Fertiliser & Chemicals Ltd.FinanceMuthoot Finance Ltd.IDFC Ltd.
Satin Creditcare Network Ltd.ICICI Prudential Life Insurance Company Ltd.GasGujarat State Petronet Ltd.Petronet Lng Ltd.Hotels, Resorts And Other Recreational ActivitiesIndian Hotels Co. Ltd.Industrial ProductsMahindra Cie Automotive Ltd.AIA Engineering Ltd.Schaeffler Ltd.Non - Ferrous MetalsNational Aluminium Co. Ltd.PaperTamilnadu Newsprint & Papers Ltd.PesticidesBayer Cropscience Ltd.Pi Industries Ltd.Rallis India Ltd.Petroleum ProductsIndian Oil Corporation Ltd.PharmaceuticalsEris Lifesciences Ltd.Piramal Enterprises Ltd. (Ccd 18Mths)RetailingFuture Retail Ltd.Future Consumer Ltd.Trent Ltd.SoftwareTata Elxsi Ltd.Textile ProductsArvind Ltd.TransportationInterglobe Aviation Ltd.
^ Exposure less than 1% has been clubbed under Other Equities
No. of Shares
Market ValueRs. Lakhs
% of Assets
SIP - If you had invested INR 10000 every month
1 Year 3 Year 5 Year 7 Year 10 Year Since Inception
Total Amount Invested (Rs.)
Total Value as on Apr 30, 2018 (Rs.)
Returns
Total Value of B: Nifty Midcap 100 TRI
B: Nifty Midcap 100 TRI
Total Value of AB: Nifty 50 TRI
AB: Nifty 50 TRI
(Inception date :01-Jul-1994) (First Installment date : 01-Jul-1994)
1,20,000
1,25,601
8.84%
1,28,820
14.02%
1,28,627
13.71%
3,60,000
4,54,027
15.71%
4,86,937
20.69%
4,49,584
15.02%
6,00,000
10,21,490
21.45%
10,46,615
22.46%
8,42,764
13.58%
8,40,000
18,22,510
21.76%
17,47,396
20.58%
13,59,145
13.52%
12,00,000
34,27,450
19.92%
31,46,939
18.34%
23,29,851
12.74%
28,60,000
2,10,87,548
17.62%
2,21,91,707
18.04%
1,36,64,601
14.02%
Past performance may or may not be sustained in the future. Returns greater than 1 year period are compounded annualized. Dividends are assumed to be reinvested and bonus is adjusted. Load is not taken in to consideration. For SIP returns, monthly investment of equal amounts invested on the 1st day of every month has been considered.For scheme performace refer pages 36-48*B: Benchmark, AB: Additional BenchmarkSource: MFI Explorer
BENCHMARK
Nifty Midcap 100 TRI
MONTHLY AVERAGE AUM
Rs.681.36 (Rs. in Cr.)
EXPENSE RATIO**
DirectRegular 1.90
2.67
**Note: The rates specified are the actual weighted average expenses charged for the month of Apr 2018. The above ratio includes the Service tax on Investment Management Fees. The above ratio excludes, proportionate charge (out of maximum 30 bps on daily average net assets allowed) in respect sales beyond T-30 cities assets, wherever applicable.
Tata Mid Cap Growth Fund(An Open-Ended Equity Scheme)
80
100
120
140
160
180
Apr-15 Apr-16 Apr-17 Apr-18
Tata Mid Cap Growth Fund - Reg - DividendNifty Midcap 100 TRI
8.95%8.55%
8.14%6.87%
6.24%6.16%
5.90%5.42%
4.60%4.46%4.39%
4.24%3.75%
3.06%2.84%2.83%
2.63%1.87%
1.32%1.13%1.07%1.05%
0.76%0.00% 5.00% 10.00%
CementConstruction
Re tailingConstruction Project
ChemicalsConsumer DurablesIndustrial Products
BanksAuto Ancillaries
PharmaceuticalsFinance
Consumer Non DurablesPestic ides
GasText ile Products
TransportationPetroleum Products
Hotels, Resorts And Other Recreational ActivitiesSoftware
FertilisersPaper
Non - Ferrous MetalsIndustrial Capital Goods

Please refer to our Tata Mutual Fund website for fundamental changes, wherever applicable
VOLATILITY MEASURES^ FUND BENCHMARK
14www.tatamutualfund.com TATA MUTUAL FUND
As on 30th April 2018
INVESTMENT STYLE
INVESTMENT OBJECTIVE
DATE OF ALLOTMENT
November 22, 2004
FUND MANAGER
NAV
Direct - GrowthDirect - DividendReg - GrowthReg - Dividend
82.438834.053679.572631.8658
FUND SIZE
Rs.313.93 (Rs. in Cr.)
TURN OVER
Portfolio Turnover (Total)Portfolio Turnover (Equity component only)
14.14%14.14%
MINIMUM INVESTMENT/MULTIPLES FOR NEW INVESTMENT
Rs. 5,000/- and in multiples of Re. 1/- thereafter.
ADDITIONAL INVESTMENT/MULTIPLES FOR EXISTING INVESTORS
Rs. 1,000/- and multiples of Re. 1/- thereafter.
LOAD STRUCTURE
Entry Load : Not Applicable
Exit Load :
PORTFOLIO
Company name
31050.04
1341.34
1920.291439.32635.83
716.22374.34
1509.051134.24
314.16
2358.461255.23835.92
1720.42983.48880.08
1319.33
98.91
4.27
6.124.582.03
2.281.19
4.813.61
1.00
7.514.002.66
5.483.132.80
4.20
45500
98750506000583333
187665237000
100000403000
160000
1930000294000185000
26000046500
114319
150000
Company nameNo. of Shares
Market ValueRs. Lakhs
% of Assets
250000
225000
350000
100000
850000260000
19200012000012000091805
60000
709.63
406.13
1066.28
636.25
1765.03642.20
2018.691439.281396.14
948.94
839.82
2.26
1.29
3.40
2.03
5.622.05
6.434.584.453.02
2.68
Other Equities^RepoPortfolio TotalNet Current LiabilitiesNet Assets
443.94444.98
31495.02-102.34
31392.68
1.411.42
100.33-0.33
100.00
SIP - If you had invested INR 10000 every month
1 Year 3 Year 5 Year 7 Year 10 Year Since Inception
Total Amount Invested (Rs.)
Total Value as on Apr 30, 2018 (Rs.)
Returns
Total Value of B: Nifty 500 TRI
B: Nifty 500 TRI
Total Value of AB: Nifty 50 TRI
AB: Nifty 50 TRI
(Inception date :22-Nov-2004) (First Installment date : 01-Dec-2004)
1,20,000
1,27,109
11.26%
1,28,894
14.14%
1,28,627
13.71%
3,60,000
4,43,044
13.99%
4,64,518
17.32%
4,49,584
15.02%
6,00,000
8,85,769
15.60%
9,04,748
16.46%
8,42,764
13.58%
8,40,000
14,51,474
15.36%
14,76,564
15.84%
13,59,145
13.52%
12,00,000
27,48,471
15.83%
25,43,234
14.38%
23,29,851
12.74%
16,10,000
48,29,742
15.17%
42,19,708
13.39%
39,47,656
12.50%
Primarily focuses on investing in high dividend yield stocks. Minimum 70% of the net assets shall be invested in stocks having dividend yield higher than dividend yield of S&P BSE SENSEX stocks.
To provide income distribution and / or medium to long term capital gains by investing predominantly in high dividend yield stocks.
Std. Dev (Annualised)Sharpe RatioPortfolio BetaR SquaredTreynorJensonDividend Yield
14.140.161.001.000.63
NA1.12*
13.740.120.920.900.52
-0.101.92
^Risk-free rate based on the FBIL Overnight MIBOR rate of 6% as on Apr 27, 2018For calculation methodology please refer to Pg 48
1% if redeemed on or before expiry of 365 days from the date of allotment.
Equity & Equity Related TotalAutoBajaj Auto Ltd.BanksHDFC Bank Ltd.ICICI Bank Ltd.Karur Vysa Bank Ltd.Construction ProjectSadbhav Engineering Ltd.Engineers India Ltd.Consumer Non DurablesHindustan Unilever Ltd.ITC Ltd.FertilisersChambal Fertiliser & Chemicals Ltd.FinanceManappuram Finance Ltd.ICICI Prudential Life Insurance Company Ltd.Muthoot Finance Ltd.Industrial ProductsFinolex Industries Ltd.Swaraj Engines Ltd.Cummins India Ltd.Media & EntertainmentSun Tv Network Ltd.
Minerals/miningCoal India Ltd.OilOil & Natural Gas Co.Petroleum ProductsHindustan Petroleum Corporation Ltd.PharmaceuticalsStrides Shasun Ltd.PowerPower Grid Corporation Of India Ltd.Torrent Power Ltd.SoftwareHCL Technologies Ltd.Infosys Ltd.Niit Technologies Ltd.Mphasis Ltd.TransportationInterglobe Aviation Ltd.
V
Top 10 Holdings Equity Industry Allocation
Market Capitalisation wise Exposure NAV Movement
Issuer NameManappuram Finance Ltd.HCL Technologies Ltd.HDFC Bank Ltd.Power Grid Corporation Of India Ltd.Finolex Industries Ltd.Hindustan Unilever Ltd.ICICI Bank Ltd.Infosys Ltd.Niit Technologies Ltd.Bajaj Auto Ltd.Total
% to NAV7.516.436.125.625.484.814.584.584.454.27
53.85
Large CapMid CapSmall Cap
No. of Shares
Market ValueRs. Lakhs
% of Assets
59.48%33.25%7.26%
Market Capitalisation includes only domestic listed Equity exposure in BSE. Large Cap Companies are top 125 stocks by market capitalisation on S&P BSE 500 Index and Mid Cap stocks are those between 126 to 499 stocks by market capitalisation and 500 & above being classified as Small cap. For calculation purpose, the previous month market capitalisation data have been used. All the figures has been rebased to 100 (Based on internal calculation).
Past performance may or may not be sustained in the future. Returns greater than 1 year period are compounded annualized. Dividends are assumed to be reinvested and bonus is adjusted. Load is not taken in to consideration. For SIP returns, monthly investment of equal amounts invested on the 1st day of every month has been considered.For scheme performance refer pages 36-48.*B: Benchmark, AB: Additional BenchmarkSource: MFI Explorer
BENCHMARK
Nifty 500 TRI
MONTHLY AVERAGE AUM
Rs.305.53 (Rs. in Cr.)
EXPENSE RATIO**
DirectRegular 2.26
2.87
::::
Rupesh Patel (Managing Since 7-Jun-13 and overall experience of 17 years)
* For S&P BSE Sensex
**Note: The rates specified are the actual weighted average expenses charged for the month of Apr 2018. The above ratio includes the Service tax on Investment Management Fees. The above ratio excludes, proportionate charge (out of maximum 30 bps on daily average net assets allowed) in respect sales beyond T-30 cities assets, wherever applicable.
Tata Dividend Yield Fund(An Open-Ended Equity Scheme)
^ Exposure less than 1% has been clubbed under Other Equities
18.93%15.15%
12.73%11.42%
8.42%7.67%
4.27%4.20%
3.47%3.40%
2.68%2.26%2.03%
1.29%1.00%
0.00% 5.00% 10.00% 15.00% 20.00%
SoftwareFinance
BanksIndustrial Products
Consumer Non DurablesPower
AutoMedia & Entertainment
Construction ProjectPetroleum Products
TransportationMinerals/miningPharmaceuticals
OilFertilisers
80
96
112
128
144
160
Apr-15 Apr-16 Apr-17 Apr-18
Tata Dividend Yield Fund - Reg - GrowthNifty 500 TRI

Please refer to our Tata Mutual Fund website for fundamental changes, wherever applicable
VOLATILITY MEASURES^ FUND BENCHMARK
13.760.111.001.000.45
NA
Std. Dev (Annualised)Sharpe RatioPortfolio BetaR SquaredTreynorJenson
15.490.200.950.710.920.44
15www.tatamutualfund.com TATA MUTUAL FUND
As on 30th April 2018
INVESTMENT STYLE
INVESTMENT OBJECTIVE
DATE OF ALLOTMENT
March 31,1996
FUND MANAGER
NAV
Direct- DividendReg - DividendDirect- GrowthReg- Growth
::::
FUND SIZE
Rs.1398.27 (Rs. in Cr.)
TURN OVER
Portfolio Turnover (Total)Portfolio Turnover (Equity component only)
21.90%21.90%
MINIMUM INVESTMENT/MULTIPLES FOR NEW INVESTMENT
Rs. 500/- and in multiples of Rs. 500/- thereafter.
ADDITIONAL INVESTMENT/MULTIPLES FOR EXISTING INVESTORS
Rs. 500/- and multiples of Rs. 500/- thereafter.
LOAD STRUCTURE
Entry Load : Not Applicable
Exit Load :
PORTFOLIO
Company name No. of Shares
Market ValueRs. Lakhs
% of Assets
No. of Shares
Market ValueRs. Lakhs
% of Assets
130139.68
2755.62
1997.05
6777.966514.415248.102894.37
1615.57
2152.61
2423.042270.35
2241.881459.99
2195.312163.461740.96
2138.54
5842.422638.751816.60
1774.20
1499.40
4815.501797.441655.46
93.07
1.97
1.43
4.854.663.752.07
1.16
1.54
1.731.62
1.601.04
1.571.551.25
1.53
4.181.891.30
1.27
1.07
3.441.291.18
810000
2500
560000335000
1845000799440
53000
665000
1730001700000
410000182100
78000023000
585000
359600
310000500000
3100000
1200000
600000
500000590000
1020000
Company name
215000232176
200000450000
4000000400000
200000
210000
2573.011808.42
2986.302720.482384.001408.00
2102.80
2939.37
1.841.29
2.141.951.711.01
1.50
2.10
Other Equities^RepoPortfolio TotalCash / Net Current AssetNet Assets
42788.319585.51
139725.19101.62
139826.81
30.606.90
99.970.03
100.00
An equity linked tax savings scheme (ELSS) that aims to provide medium to long term capital gains along with income tax benefit under Section 80C of the Income Tax Act.
To provide medium to long term capital gains along with income tax relief to its Unitholders, while at all times emphasising the importance of capital appreciation.
Rupesh Patel (Managing Since 1-Apr-15 and overall experience of 17 years)
97.654068.111118.792217.9874
^Risk-free rate based on the FBIL Overnight MIBOR rate of 6% as on Apr 27, 2018
For calculation methodology please refer to Pg 48
Nil (Compulsory lock-in period for 3years)
Equity & Equity Related TotalAutoTata Motors Ltd.Auto AncillariesMRF Ltd.BanksKotak Mahindra Bank Ltd.HDFC Bank Ltd.ICICI Bank Ltd.Yes Bank Ltd.CementDalmia Bharat Ltd.ConstructionKNR Constructions Ltd.Construction ProjectLarsen & Toubro Ltd.NCC Ltd.Consumer DurablesHavells India Ltd.Bata India Ltd.Consumer Non DurablesITC Ltd.Nestle India Ltd.Tata Global Beverages Ltd.Ferrous MetalsTata Steel Ltd.FinanceHousing Development Finance Ltd.Mahindra And Mahindra Financial Services Ltd.IDFC Ltd.Hotels, Resorts And Other Recreational ActivitiesIndian Hotels Co. Ltd.Industrial ProductsMahindra Cie Automotive Ltd.Petroleum ProductsReliance Industries Ltd.Hindustan Petroleum Corporation Ltd.Indian Oil Corporation Ltd.
PharmaceuticalsDivi Laboratories Ltd.Eris Lifesciences Ltd.RetailingAvenue Supermarts Ltd.Future Retail Ltd.Future Consumer Ltd.Trent Ltd.SoftwareHCL Technologies Ltd.TransportationInterglobe Aviation Ltd.
Top 10 Holdings Equity Industry Allocation
Market Capitalisation wise Exposure NAV Movement
Issuer NameKotak Mahindra BankHDFC Bank Ltd.HDFC Ltd.ICICI Bank Ltd.Reliance Industries Ltd.Avenue Supermarts Ltd.Interglobe Aviation Ltd.Yes Bank Ltd.Tata Motors Ltd.Future Retail Ltd.Total
% to NAV4.854.664.183.753.442.142.102.071.971.95
31.11
Large CapMid CapSmall Cap
63.39%28.74%7.87%
Market Capitalisation includes only domestic listed Equity exposure in BSE. Large Cap Companies are top 125 stocks by market capitalisation on S&P BSE 500 Index and Mid Cap stocks are those between 126 to 499 stocks by market capitalisation and 500 & above being classified as Small cap. For calculation purpose, the previous month market capitalisation data have been used. All the figures has been rebased to 100 (Based on internal calculation).
SIP - If you had invested INR 10000 every month1 Year 3 Year 5 Year 7 Year 10 Year Since Inception
Total Amount Invested (Rs.)Total Value as on Apr 30, 2018 (Rs.)ReturnsTotal Value of B: S&P BSE Sensex TRIB: S&P BSE Sensex TRI(Inception date :31-Mar-1996) (First Installment date : 01-Jul-1996)
1,20,0001,27,680
12.18%1,30,133
16.15%
3,60,0004,71,075
18.32%4,51,311
15.29%
6,00,0009,89,282
20.13%8,38,606
13.38%
8,40,00016,83,803
19.53%13,56,018
13.46%
12,00,00030,60,859
17.83%23,33,072
12.77%
26,20,0003,68,25,450
20.40%1,49,17,906
13.88%
Past performance may or may not be sustained in the future. Returns greater than 1 year period are compounded annualized. Dividends are assumed to be reinvested and bonus is adjusted. Load is not taken in to consideration. For SIP returns, monthly investment of equal amounts invested on the 1st day of every month has been considered.For scheme performance refer pages 36-48.*B: BenchmarkSource: MFI Explorer
^ Exposure less than 1% has been clubbed under Other Equities
BENCHMARK
S&P BSE Sensex TRI
MONTHLY AVERAGE AUM
Rs.1348.66 (Rs. in Cr.)
EXPENSE RATIO**
DirectRegular
1.222.09
**Note: The rates specified are the actual weighted average expenses charged for the month of Apr 2018. The above ratio includes the Service tax on Investment Management Fees. The above ratio excludes, proportionate charge (out of maximum 30 bps on daily average net assets allowed) in respect sales beyond T-30 cities assets, wherever applicable.
Tata India Tax Savings Fund (Erstwhile known as Tata Long Term Equity Fund; renamed w.e.f December 21, 2015)(An open ended equity linked savings scheme with a statutory lock in of 3 years and tax benefit)
16.97%12.49%
6.79%6.02%5.91%
4.66%4.36%
4.12%4.12%4.05%3.87%
3.22%2.58%
2.15%2.11%2.09%
1.50%1.45%1.27%
0.93%0.72%0.70%0.57%0.38%
0.00% 5.00% 10.00% 15.00% 20.00%
BanksFinance
RetailingPharmaceuticals
Petroleum ProductsCement
Consumer Non DurablesConstruction Project
Industrial ProductsConsumer Durables
AutoConstruction
TransportationAuto AncillariesFerrous Metals
ChemicalsSoftware
PowerHotels, Resorts And Other…
Healthcare ServicesOil
FertilisersPaper
Gas
80
98
116
134
152
170
Apr-15 Apr-16 Apr-17 Apr-18
Tata India Tax Savings Fund - Reg - DividendS&P BSE Sensex TRI

16www.tatamutualfund.com TATA MUTUAL FUND
As on 30th April 2018INVESTMENT STYLE
INVESTMENT OBJECTIVE
DATE OF ALLOTMENT
December 28, 2015
FUND MANAGER
NAV
FUND SIZE
Rs.253.91 (Rs. in Cr.)
MONTHLY AVERAGE AUM
Rs.244.19 (Rs. in Cr.)
TURN OVER
Portfolio Turnover (Total)Portfolio Turnover (Equity component only)
44.30%44.30%
PORTFOLIO
99.67
21.1910.8110.104.573.772.69
7.266.465.635.254.654.574.412.342.142.121.71
276700226800708000595000520900133400
97800363000277300
2430062000
272000788000
800008000022300
420000
25306.63
5380.712745.072563.311159.66958.20683.81
1843.191640.221429.621332.261181.751161.301119.75594.00542.64537.91433.23
Company name
RepoPortfolio TotalNet Current LiabilitiesNet Assets
154.9625461.59
-70.4725391.12
0.62100.29
-0.29100.00
Primarily focuses on investment in at least 80% of its net assets in equity/equity related instruments of the companies in the Banking and Financial Services sector in India.
The investment objective of the scheme is to seek long term capital appreciation by investing atleast 80% of its net assets in equity/equity related instruments of the companies in the Banking and Financial Services sector in India.
Sonam Udasi (Managing Since 1-Apr-16 and overall experience of 20 years) & Pradeep Gokhale (Managing Since 28-Dec-15 and overall experience of 26 years) BENCHMARK
Nifty Financial Services TRI
Direct - DividendDirect - GrowthRegular - DividendRegular - Growth
::::
18.570618.570616.425317.8454
Equity & Equity Related TotalBanksHDFC Bank Ltd.Kotak Mahindra Bank Ltd.Yes Bank Ltd.Dcb Bank Ltd.City Union Bank Ltd.Bandhan Bank Ltd.FinanceHousing Development Finance Ltd.Muthoot Finance Ltd.Max Financial Services Ltd.Bajaj Finserv Ltd.Bajaj Finance Ltd.ICICI Prudential Life Insurance Company Ltd.Jm Financial Ltd.Sbi Life Insurance Company Ltd.Gruh Finance Ltd.Shriram City Union Finance Ltd.Geojit Financial Services Ltd.
No. of Shares
Market ValueRs. Lakhs
% of Assets
Tata Banking & Financial Services Fund(An open ended equity scheme investing in Banking & Financial Services Sector)
ADDITIONAL INVESTMENT/MULTIPLES FOR EXISTING INVESTORS
Rs. 1,000/- and in multiples of Re. 1/- thereafter.
LOAD STRUCTURE
Entry Load : Not Applicable
Exit Load :
VOLATILITY MEASURES^ FUND BENCHMARK
Std. Dev (Annualised)Sharpe RatioPortfolio BetaR SquaredTreynorJenson
18.500.231.001.001.23
NA
18.620.320.860.752.000.66
^Risk-free rate based on the FBIL Overnight MIBOR rate of 6% as on Apr 27, 2018For calculation methodology please refer to Pg 48
0.25% of NAV if redeemed on or before expiry of 3 months from the date of allotment.
MINIMUM INVESTMENT /MULTIPLES FOR NEW INVESTMENT
Rs. 5,000/- and in multiples of Re. 1/- thereafter.
EXPENSE RATIO**DirectRegular
1.322.74
**Note: The rates specified are the actual weighted average expenses charged for the month of Apr 2018. The above ratio includes the Service tax on Investment Management Fees. The above ratio excludes, proportionate charge (out of maximum 30 bps on daily average net assets allowed) in respect sales beyond T-30 cities assets, wherever applicable.
As on 30th April 2018PORTFOLIO
89.94
14.1211.947.997.677.096.376.015.714.394.223.943.022.882.302.28
44600111093
72100127500
68000655008300083500
1370008200041800
1300007500
2483420500
10034.42
1575.001332.45891.70856.23791.15710.90670.64637.23489.71471.25439.49336.44321.42256.70254.11
Company name
RepoPortfolio TotalCash / Net Current AssetNet Assets
943.3510977.77
178.4511156.22
8.8798.811.19
100.00
Equity & Equity Related TotalSoftwareTata Consultancy Services Ltd.Infosys Ltd.Tata Elxsi Ltd.Tech Mahindra Ltd.Niit Technologies Ltd.Mindtree Ltd.Persistent Systems Ltd.Cyient Ltd.Sonata Software Ltd.Majesco Ltd.HCL Technologies Ltd.Kpit Technologies Ltd.Oracle Financials Services Soft Ltd.Mphasis Ltd.Info Edge (India) Ltd.
No. of Shares
Market ValueRs. Lakhs
% of Assets
Tata Digital India Fund(An open ended equity scheme investing in Information Technology Sector)
INVESTMENT STYLE
INVESTMENT OBJECTIVE
DATE OF ALLOTMENT
December 28,2015
FUND MANAGER
FUND SIZE
Rs.111.56 (Rs. in Cr.)
MONTHLY AVERAGE AUM
Rs.90.94 (Rs. in Cr.)
TURN OVER
Portfolio Turnover (Total)Portfolio Turnover (Equity component only)
31.83%31.83%
Primarily focuses on investment in at least 80% of its net assets in equity/equity related instruments of the companies in the Information Technology sector in India.
The investment objective of the scheme is to seek long term capital appreciation by investing atleast 80% of its net assets in equity/equity related instruments of the companies in Information Technology Sector in India.However, there is no assurance or guarantee that the investment objective of the Scheme will be achieved.The Scheme does not assure or guarantee any returns.
Sonam Udasi (Managing Since 1-Apr - 16 and overall experience of 20 years) & Pradeep Gokhale (Managing Since 28-Dec-15 and overall experience of 26 years)
BENCHMARK
NAV
S&P BSE IT TRI
Direct - DividendDirect - GrowthRegular - DividendRegular - Growth
::::
14.770114.770114.181414.1814
ADDITIONAL INVESTMENT/ MULTIPLES FOR EXISTINGINVESTORS
Rs. 1,000/- and in multiples of Re. 1/- thereafter.
LOAD STRUCTURE
Entry Load : Not Applicable
Exit Load :
VOLATILITY MEASURES^ FUND BENCHMARK
Std. Dev (Annualised)Sharpe RatioPortfolio BetaR SquaredTreynorJenson
19.020.111.001.000.63
NA
18.890.170.920.900.970.32
^Risk-free rate based on the FBIL Overnight MIBOR rate of 6% as on Apr 27, 2018 For calculation methodology please refer to Pg 48
0.25% of NAV if redeemed on or before expiry of 3 months from the date of allotment
EXPENSE RATIO**DirectRegular
1.372.91
**Note: The rates specified are the actual weighted average expenses charged for the month of Apr 2018. The above ratio includes the Service tax on Investment Management Fees. The above ratio excludes, proportionate charge (out of maximum 30 bps on daily average net assets allowed) in respect sales beyond T-30 cities assets, wherever applicable.
MINIMUM INVESTMENT /MULTIPLES FOR NEW INVESTMENT
Rs. 5,000/- and in multiples of Re. 1/- thereafter.
Please refer to our Tata Mutual Fund website for fundamental changes, wherever applicable
Please refer to our Tata Mutual Fund website for fundamental changes, wherever applicable

17www.tatamutualfund.com TATA MUTUAL FUND
As on 30th April 2018PORTFOLIO
92.85
7.183.942.982.472.27
2.461.55
2.922.301.901.481.01
7.787.033.723.393.273.192.192.101.951.901.08
4.663.75
5.122.281.141.10
2.492.26
7920044000098500
1460000219900
300094500
35500041000016300091050
300000
5020002430000142000785569
107000084000038700
1700003100019700
148000
772410415000
825000372500031500072000
10000198500
90392.37
6987.663839.662903.782400.972206.81
2396.461504.35
2846.212241.881849.641440.78979.50
7575.436839.243619.583302.143184.323105.482131.112040.261893.681853.051050.95
4532.893650.13
4987.542220.101108.801075.07
2420.462204.44
Company name
RepoPortfolio TotalNet Current LiabilitiesNet Assets
6967.7997360.16
-10.2097349.96
7.28100.13
-0.13100.00
Equity & Equity Related TotalAutoMaruti Suzuki India Ltd.Mahindra & Mahindra Ltd.Bajaj Auto Ltd.Ashok Leyland Ltd.Escorts Ltd.Auto AncillariesMRF Ltd.Ceat Ltd.Consumer DurablesBata India Ltd.Havells India Ltd.Amber Enterprises India Ltd.Whirlpool Of India Ltd.Century Plyboards (India) Ltd.Consumer Non DurablesHindustan Unilever Ltd.ITC Ltd.Jubilant Foodworks Ltd.Radico Khaitan Ltd.Tata Global Beverages Ltd.Dabur India Ltd.Britannia Industries Ltd.Asian Paints (India) Ltd.Glaxo Smithkline Con Healthcar Ltd.Nestle India Ltd.Heritage Foods Ltd.Media & EntertainmentZee Entertainment Enterprises Ltd.Sun Tv Network Ltd.RetailingFuture Retail Ltd.Future Consumer Ltd.Trent Ltd.Avenue Supermarts Ltd.Textile ProductsPage Industries Ltd.Raymond Ltd.
No. of Shares
Market ValueRs. Lakhs
% of Assets
Tata India Consumer Fund(An open ended equity scheme investing in Consumption Oriented Sector)
INVESTMENT STYLE
INVESTMENT OBJECTIVE
DATE OF ALLOTMENT
December 28, 2015
FUND MANAGER
NAV
FUND SIZE
Rs.973.50 (Rs. in Cr.)
MONTHLY AVERAGE AUM
Rs.881.02 (Rs. in Cr.)
TURN OVER
Portfolio Turnover (Total)Portfolio Turnover (Equity component only)
32.55%32.55%
Primarily focuses on investment in at least 80% of its net assets in equity/equity related instruments of the companies in the Consumption Oriented sectors in India.
The investment objective of the scheme is to seek long term capital appreciation by investing atleast 80% of its assets in equity/equity related instruments of the companies in the Consumption Oriented sectors in India.However, there is no assurance or guarantee that the investment objective of the Scheme will be achieved.The Scheme does not assure or guarantee any returns.
Sonam Udasi (Managing Since 1-Apr-16 and overall experience of 20 years) & Rupesh Patel (Managing Since 28-Dec-15 and overall experience of 17 years)
BENCHMARKNifty India Consumption TRI
Direct - DividendDirect - GrowthRegular - DividendRegular - Growth
::::
19.219819.219816.986718.4650
ADDITIONAL INVESTMENT/MULTIPLES FOR EXISTING INVESTORSRs. 1,000/- and in multiples of Re. 1/- thereafter.
LOAD STRUCTUREEntry Load : Not ApplicableExit Load :
VOLATILITY MEASURES^ FUND BENCHMARKStd. Dev (Annualised)Sharpe RatioPortfolio BetaR SquaredTreynorJenson
14.620.241.001.001.00
NA
16.290.380.930.731.920.85
^Risk-free rate based on the FBIL Overnight MIBOR rate of 6% as on Apr 27, 2018 For calculation methodology please refer to Pg 48
1% if redeemed on or before 18 months from the date of allotment (w.e.f 5th April, 2018)
MINIMUM INVESTMENT /MULTIPLES FOR NEW INVESTMENT
Rs. 5,000/- and in multiples of Re. 1/- thereafter.
EXPENSE RATIO**DirectRegular
0.972.48
**Note: The rates specified are the actual weighted average expenses charged for the month of Apr 2018. The above ratio includes the Service tax on Investment Management Fees. The above ratio excludes, proportionate charge (out of maximum 30 bps on daily average net assets allowed) in respect sales beyond T-30 cities assets, wherever applicable.
Please refer to our Tata Mutual Fund website for fundamental changes, wherever applicable
As on 30th April 2018INVESTMENT STYLE
INVESTMENT OBJECTIVE
DATE OF ALLOTMENTDecember 28, 2015
FUND MANAGER
FUND SIZERs.143.81 (Rs. in Cr.)
MONTHLY AVERAGE AUM
Rs.139.46 (Rs. in Cr.)
TURN OVER
Portfolio Turnover (Total)Portfolio Turnover (Equity component only)
54.13%54.13%
PORTFOLIO
96.49
4.49
14.8010.089.879.717.696.704.624.303.573.463.062.462.022.001.891.731.511.411.11
59300
403100193000118600
53617178000259000124000150000
8000082000
90005750
360006800053000
101000110002500034000
13875.96
645.60
2128.971450.111419.351396.831106.27964.13664.52618.23512.84497.45440.77353.17290.97287.33271.52248.97216.76202.93159.24
Company name
RepoPortfolio TotalCash / Net Current AssetNet Assets
449.1614325.12
56.1614381.28
3.1499.630.37
100.00
Primarily focuses on investment in at least 80% of its net assets in equity/equity related instruments of the companies in the Pharma & Healthcare sectors in India.
The investment objective of the scheme is to seek long term capital appreciation by investing atleast 80% of its net assets in equity/equity related instruments of the companies in the pharma & healthcare sectors in India.However, there is no assurance or guarantee that the investment objective of the Scheme will be achieved.The Scheme does not assure or guarantee any returns.
Sonam Udasi (Managing Since 1-Apr - 16 and overall experience of 20 years) & Rupesh Patel (Managing Since 28-Dec-15 and overall experience of 17 years)
BENCHMARK
NAV
Nifty Pharma TRI
Direct - DividendDirect - GrowthRegular - DividendRegular - Growth
::::
9.30649.30648.94378.9437
Equity & Equity Related TotalHealthcare ServicesApollo Hospitals Enterprise Ltd.PharmaceuticalsSun Pharmaceutical Industries Ltd.IPCA Laboratories Ltd.Divi Laboratories Ltd.Piramal Enterprises Ltd.Syngene International Ltd.Dishman Carbogen Amcis Ltd.Alembic Pharmaceuticals Ltd.Cadila Healthcare Ltd.Aurobindo Pharma Ltd.Cipla Ltd.Sanofi India Ltd.Abbott India Ltd.Natco Pharma Ltd.Sun Pharma Advanced Research Co Ltd.Laurus Labs Ltd.Fdc Ltd.Alkem Laboratories Ltd.Lupin Ltd.Shilpa Medicare Ltd.
No. of Shares
Market ValueRs. Lakhs
% of Assets
Tata India Pharma & Healthcare Fund(An open ended equity scheme investing in Pharma and Healthcare Services Sector)
ADDITIONAL INVESTMENT/MULTIPLES FOR EXISTING INVESTORS
Rs. 1,000/- and in multiples of Re. 1/- thereafter.
LOAD STRUCTUREEntry Load : Not ApplicableExit Load :
VOLATILITY MEASURES^ FUND BENCHMARKStd. Dev (Annualised)Sharpe RatioPortfolio BetaR SquaredTreynorJenson
16.49-0.301.001.00
-1.42NA
14.63-0.190.800.81
-1.020.32
^Risk-free rate based on the FBIL Overnight MIBOR rate of 6% as on Apr 27, 2018 For calculation methodology please refer to Pg 48
0.25% of NAV if redeemed on or before expiry of 3 months from the date of allotment
MINIMUM INVESTMENT /MULTIPLES FOR NEW INVESTMENT
Rs. 5,000/- and in multiples of Re. 1/- thereafter.
EXPENSE RATIO**DirectRegular
1.262.84
**Note: The rates specified are the actual weighted average expenses charged for the month of Apr 2018. The above ratio includes the Service tax on Investment Management Fees. The above ratio excludes, proportionate charge (out of maximum 30 bps on daily average net assets allowed) in respect sales beyond T-30 cities assets, wherever applicable.
^ Exposure less than 1% has been clubbed under Other Equities
Please refer to our Tata Mutual Fund website for fundamental changes, wherever applicable
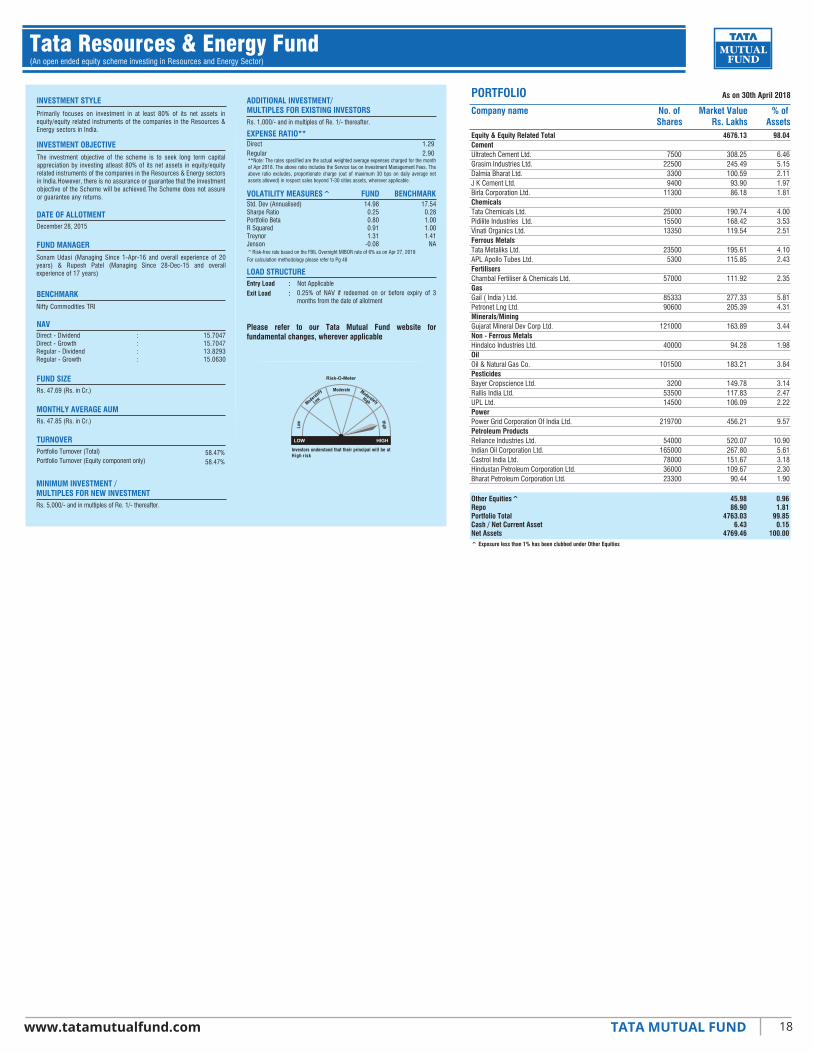
18www.tatamutualfund.com TATA MUTUAL FUND
As on 30th April 2018INVESTMENT STYLE
INVESTMENT OBJECTIVE
DATE OF ALLOTMENTDecember 28, 2015
FUND MANAGER
NAV
FUND SIZERs. 47.69 (Rs. in Cr.)
MONTHLY AVERAGE AUMRs. 47.85 (Rs. in Cr.)
TURNOVERPortfolio Turnover (Total)Portfolio Turnover (Equity component only)
58.47%58.47%
PORTFOLIO
98.04
6.465.152.111.971.81
4.003.532.51
4.102.43
2.35
5.814.31
3.44
1.98
3.84
3.142.472.22
9.57
10.905.613.182.301.90
750022500
33009400
11300
250001550013350
235005300
57000
8533390600
121000
40000
101500
32005350014500
219700
54000165000
780003600023300
4676.13
308.25245.49100.59
93.9086.18
190.74168.42119.54
195.61115.85
111.92
277.33205.39
163.89
94.28
183.21
149.78117.83106.09
456.21
520.07267.80151.67109.67
90.44
Company namePrimarily focuses on investment in at least 80% of its net assets in equity/equity related instruments of the companies in the Resources & Energy sectors in India.
The investment objective of the scheme is to seek long term capital appreciation by investing atleast 80% of its net assets in equity/equity related instruments of the companies in the Resources & Energy sectors in India.However, there is no assurance or guarantee that the investment objective of the Scheme will be achieved.The Scheme does not assure or guarantee any returns.
Sonam Udasi (Managing Since 1-Apr-16 and overall experience of 20 years) & Rupesh Patel (Managing Since 28-Dec-15 and overall experience of 17 years)
BENCHMARKNifty Commodities TRI
Direct - DividendDirect - GrowthRegular - DividendRegular - Growth
::::
15.704715.704713.829315.0630
Other Equities^RepoPortfolio TotalCash / Net Current AssetNet Assets
45.9886.90
4763.036.43
4769.46
0.961.81
99.850.15
100.00
Equity & Equity Related TotalCementUltratech Cement Ltd.Grasim Industries Ltd.Dalmia Bharat Ltd.J K Cement Ltd.Birla Corporation Ltd.ChemicalsTata Chemicals Ltd.Pidilite Industries Ltd.Vinati Organics Ltd.Ferrous MetalsTata Metaliks Ltd.APL Apollo Tubes Ltd.FertilisersChambal Fertiliser & Chemicals Ltd.GasGail ( India ) Ltd.Petronet Lng Ltd.Minerals/MiningGujarat Mineral Dev Corp Ltd.Non - Ferrous MetalsHindalco Industries Ltd.OilOil & Natural Gas Co.PesticidesBayer Cropscience Ltd.Rallis India Ltd.UPL Ltd.PowerPower Grid Corporation Of India Ltd.Petroleum ProductsReliance Industries Ltd.Indian Oil Corporation Ltd.Castrol India Ltd.Hindustan Petroleum Corporation Ltd.Bharat Petroleum Corporation Ltd.
No. of Shares
Market ValueRs. Lakhs
% of Assets
Tata Resources & Energy Fund(An open ended equity scheme investing in Resources and Energy Sector)
ADDITIONAL INVESTMENT/MULTIPLES FOR EXISTING INVESTORSRs. 1,000/- and in multiples of Re. 1/- thereafter.
LOAD STRUCTUREEntry Load : Not ApplicableExit Load :
VOLATILITY MEASURES^ FUND BENCHMARKStd. Dev (Annualised)Sharpe RatioPortfolio BetaR SquaredTreynorJenson
17.540.281.001.001.41
NA
14.980.250.800.911.31
-0.08^Risk-free rate based on the FBIL Overnight MIBOR rate of 6% as on Apr 27, 2018 For calculation methodology please refer to Pg 48
0.25% of NAV if redeemed on or before expiry of 3 months from the date of allotment
MINIMUM INVESTMENT /MULTIPLES FOR NEW INVESTMENTRs. 5,000/- and in multiples of Re. 1/- thereafter.
EXPENSE RATIO**DirectRegular
1.292.90
**Note: The rates specified are the actual weighted average expenses charged for the month of Apr 2018. The above ratio includes the Service tax on Investment Management Fees. The above ratio excludes, proportionate charge (out of maximum 30 bps on daily average net assets allowed) in respect sales beyond T-30 cities assets, wherever applicable.
^ Exposure less than 1% has been clubbed under Other Equities
Please refer to our Tata Mutual Fund website for fundamental changes, wherever applicable

19www.tatamutualfund.com TATA MUTUAL FUND
VOLATILITY MEASURES^ FUND BENCHMARK
INVESTMENT STYLE
INVESTMENT OBJECTIVE
DATE OF ALLOTMENT
December 31, 2004
FUND MANAGER
NAV
Direct - GrowthDirect - DividendReg - GrowthReg - Dividend
::::
60.355731.546258.851827.9238
FUND SIZE
Rs.655.82 (Rs. in Cr.)
TURN OVER
Portfolio Turnover (Total)Portfolio Turnover (Equity component only)
33.80%33.80%
MINIMUM INVESTMENT/MULTIPLES FOR NEW INVESTMENT
Rs. 5,000/- and in multiples of Re. 1/- thereafter.
ADDITIONAL INVESTMENT/MULTIPLES FOR EXISTING INVESTORS
Rs. 1,000/- and multiples of Re. 1/- thereafter.
LOAD STRUCTURE
Entry Load : Not Applicable
Exit Load :
PORTFOLIO
Company name No. of Shares
Market ValueRs. Lakhs
% of Assets
64858.13
3328.071810.251750.14
2273.991564.271471.361367.79686.39
1056.85
3987.981046.00993.30833.80
3709.643480.492343.801432.77
972.12
2276.51885.27
1213.02870.21
98.90
5.072.762.67
3.472.392.242.091.05
1.61
6.081.591.511.27
5.665.313.572.18
1.48
3.471.35
1.851.33
117000050000090000
1350019000035800
13693090000
100000
12320001000000660000298000
972000248500
17550001080925
81000
38280040500
2070000990000
Company name No. of Shares
Market ValueRs. Lakhs
% of Assets
SIP - If you had invested INR 10000 every month1 Year 3 Year 5 Year 7 Year 10 Year Since Inception
Total Amount Invested (Rs.)
Total Value as on Apr 30, 2018 (Rs.)
Returns
Total Value of B: Nifty 500 TRI
B: Nifty 500 TRI
Total Value of AB: Nifty 50 TRI
AB: Nifty 50 TRI
(Inception date :31-Dec-2004) (First Installment date : 01-Feb-2005)
1,20,000
1,23,166
4.97%
1,28,894
14.14%
1,28,627
13.71%
3,60,000
4,45,598
14.39%
4,64,518
17.32%
4,49,584
15.02%
6,00,000
9,11,410
16.76%
9,04,748
16.46%
8,42,764
13.58%
8,40,000
14,14,334
14.64%
14,76,564
15.84%
13,59,145
13.52%
12,00,000
21,79,678
11.49%
25,43,234
14.38%
23,29,851
12.74%
15,90,000
34,23,223
10.90%
40,90,760
13.31%
38,22,998
12.40%
Primarily focuses on equity / equity related instruments of the companies in the Infrastructure sector in India.
Rupesh Patel (Managing Since 1-Jan-14 and overall experience of 17 years)
To provide income distribution and / or medium to long term capital gains by investing predominantly in equity / equity related instruments of the companies in the infrastructure sector.
Std. Dev (Annualised)Sharpe RatioPortfolio BetaR SquaredTreynorJenson
14.140.161.001.000.63
NA
17.190.111.140.880.46
-0.19
^Risk-free rate based on the FBIL Overnight MIBOR rate of 6% as on Apr 27, 2018
For calculation methodology please refer to Pg 48
0.25% of NAV if redeemed on or before expiry of 3 months from the date of allotment
Top 10 Holdings Equity Industry Allocation
Market Capitalisation wise Exposure NAV Movement
Issuer NameKNR ConstructionSadbhav Engineering Ltd.Larsen & Toubro Ltd.ICICI Bank Ltd.Astral Poly Technik Ltd.Power Grid Corporation Of India Ltd.NCC Ltd.Tata Steel Ltd.Shree Cement Ltd.Finolex Cables Ltd.Total
% to NAV6.085.665.315.073.923.903.573.533.472.93
43.44
Large Cap
Mid Cap
Small Cap
GasGujarat State Petronet Ltd.Industrial Capital GoodsABB India Ltd.Thermax Ltd.Bharat Electronics Ltd.Industrial ProductsAstral Poly Technik Ltd.Finolex Cables Ltd.AIA Engineering Ltd.Timken India Ltd.Schaeffler Ltd.Grindwell Norton Ltd.Ador Welding Ltd.Cummins India Ltd.Petroleum ProductsHindustan Petroleum Corporation Ltd.Indian Oil Corporation Ltd.PowerPower Grid Corporation Of India Ltd.Kalpataru Power Transmission Ltd.Torrent Power Ltd.TransportationInterglobe Aviation Ltd.Container Corporation Of India Ltd.
900000
102600100000693000
27000027500010340018250021000
20000018000090000
360000648000
1233000182500315000
13700078500
1602.45
1390.231142.75910.60
2569.591920.741493.771256.601134.001015.80705.06692.87
1096.741051.70
2560.32887.50778.05
1917.591024.94
2.44
2.121.741.39
3.922.932.281.921.731.551.081.06
1.671.60
3.901.351.19
2.921.56
Other Equities^RepoPortfolio TotalCash / Net Current AssetNet Assets
352.81709.87
65568.0014.08
65582.08
0.541.09
99.990.01
100.00
^ Exposure less than 1% has been clubbed under Other Equities
43.52%
44.22%
12.26%
Market Capitalisation includes only domestic listed Equity exposure in BSE. Large Cap Companies are top 125 stocks by market capitalisation on S&P BSE 500 Index and Mid Cap stocks are those between 126 to 499 stocks by market capitalisation and 500 & above being classified as Small cap. For calculation purpose, the previous month market capitalisation data have been used. All the figures has been rebased to 100 (Based on internal calculation).
Past performance may or may not be sustained in the future. Returns greater than 1 year period are compounded annualized. Dividends are assumed to be reinvested and bonus is adjusted. Load is not taken in to consideration. For SIP returns, monthly investment of equal amounts invested on the 1st day of every month has been considered.For scheme performance refer pages 36-48.*B: Benchmark, AB: Additional BenchmarkSource: MFI Explorer
BENCHMARK
Nifty 500 TRI
MONTHLY AVERAGE AUM
Rs.650.16 (Rs. in Cr.)
EXPENSE RATIO**
DirectRegular
2.142.71
**Note: The rates specified are the actual weighted average expenses charged for the month of Apr 2018. The above ratio includes the Service tax on Investment Management Fees. The above ratio excludes, proportionate charge (out of maximum 30 bps on daily average net assets allowed) in respect sales beyond T-30 cities assets, wherever applicable.
As on 30th April 2018
Tata Infrastructure Fund(An Open-Ended Equity Scheme)
Equity & Equity Related TotalBanksICICI Bank Ltd.Yes Bank Ltd.HDFC Bank Ltd.CementShree Cement Ltd.The Ramco Cements Ltd.Ultratech Cement Ltd.J K Cement Ltd.Birla Corporation Ltd.ChemicalsSolar Industries India Ltd.ConstructionKNR Constructions Ltd.NBCC India Ltd.Welspun Enterprises Ltd.Brigade Enterprises Ltd.Construction ProjectSadbhav Engineering Ltd.Larsen & Toubro Ltd.NCC Ltd.Sadbhav Infrastructure Project Ltd.Consumer Non DurablesAsian Paints (India) Ltd.Ferrous MetalsTata Steel Ltd.APL Apollo Tubes Ltd.FinanceIDFC Ltd.Power Finance Corporation Ltd.
16.72%16.45%
11.23%10.50%10.46%
6.44%5.36%5.25%
4.49%3.28%3.18%
2.44%1.61%1.48%
0.00% 5.00% 10.00% 15.00% 20.00%
Construction ProjectIndustrial Products
CementBanks
ConstructionPower
Ferrous MetalsIndustrial Capital Goods
TransportationPetroleum Products
FinanceGas
ChemicalsConsumer Non Durables
80
96
112
128
144
160
Apr-15 Apr-16 Apr-17 Apr-18
Tata Infrastructure Fund - Reg - GrowthNifty 500 TRI
Please refer to our Tata Mutual Fund website for fundamental changes, wherever applicable
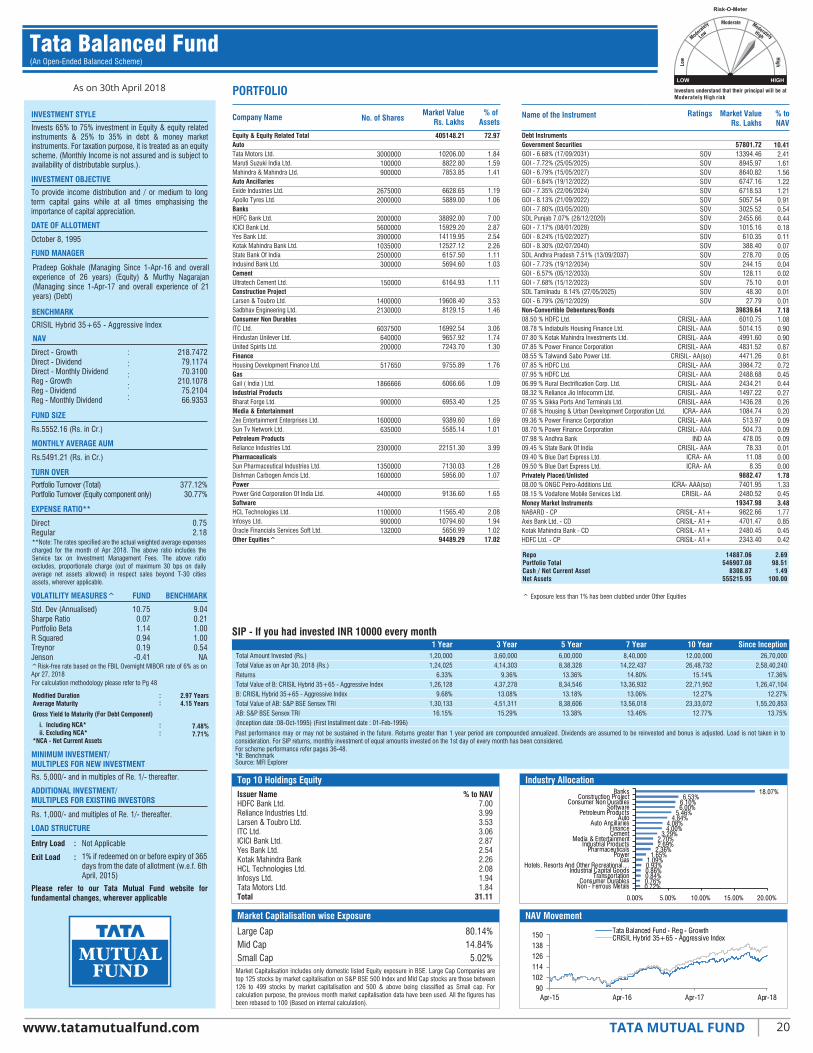
Please refer to our Tata Mutual Fund website for fundamental changes, wherever applicable
VOLATILITY MEASURES^ FUND BENCHMARK
20www.tatamutualfund.com TATA MUTUAL FUND
As on 30th April 2018
INVESTMENT STYLE
INVESTMENT OBJECTIVE
DATE OF ALLOTMENT
October 8, 1995
FUND MANAGER
NAV
Direct - GrowthDirect - DividendDirect - Monthly DividendReg - GrowthReg - DividendReg - Monthly Dividend
: 218.747279.117470.3100
210.107875.210466.9353
: : : :
FUND SIZE
Rs.5552.16 (Rs. in Cr.)
TURN OVER
Portfolio Turnover (Total)Portfolio Turnover (Equity component only)
377.12%30.77%
MINIMUM INVESTMENT/MULTIPLES FOR NEW INVESTMENT
Rs. 5,000/- and in multiples of Re. 1/- thereafter.
ADDITIONAL INVESTMENT/MULTIPLES FOR EXISTING INVESTORS
Rs. 1,000/- and multiples of Re. 1/- thereafter.
LOAD STRUCTURE
Entry Load : Not Applicable
Exit Load :
PORTFOLIO
405148.21
10206.008822.807853.85
6628.655889.00
38892.0015929.2014119.9512527.12
6157.505694.60
6164.93
19608.408129.15
16992.549657.927243.70
9755.89
6066.66
6953.40
9389.605585.14
22151.30
7130.035956.00
9136.60
11565.4010794.60
5656.9994489.29
72.97
1.841.591.41
1.191.06
7.002.872.542.261.111.03
1.11
3.531.46
3.061.741.30
1.76
1.09
1.25
1.691.01
3.99
1.281.07
1.65
2.081.941.02
17.02
Name of the Instrument Ratings Market ValueRs. Lakhs
% to NAV
RepoPortfolio TotalCash / Net Current AssetNet Assets
14887.06546907.08
8308.87555215.95
2.6998.51
1.49100.00
SIP - If you had invested INR 10000 every month1 Year 3 Year 5 Year 7 Year 10 Year Since Inception
Total Amount Invested (Rs.)Total Value as on Apr 30, 2018 (Rs.)ReturnsTotal Value of B: CRISIL Hybrid 35+65 - Aggressive IndexB: CRISIL Hybrid 35+65 - Aggressive IndexTotal Value of AB: S&P BSE Sensex TRIAB: S&P BSE Sensex TRI(Inception date :08-Oct-1995) (First Installment date : 01-Feb-1996)
1,20,0001,24,025
6.33%1,26,128
9.68%1,30,133
16.15%
3,60,0004,14,303
9.36%4,37,278
13.08%4,51,311
15.29%
6,00,0008,38,328
13.36%8,34,546
13.18%8,38,606
13.38%
8,40,00014,22,437
14.80%13,36,932
13.06%13,56,018
13.46%
12,00,00026,48,732
15.14%22,71,952
12.27%23,33,072
12.77%
26,70,0002,58,40,240
17.36%1,26,47,104
12.27%1,55,20,853
13.75%
Invests 65% to 75% investment in Equity & equity related instruments & 25% to 35% in debt & money market instruments. For taxation purpose, it is treated as an equity scheme. (Monthly Income is not assured and is subject to availability of distributable surplus.).
To provide income distribution and / or medium to long term capital gains while at all times emphasising the importance of capital appreciation.
Pradeep Gokhale (Managing Since 1-Apr-16 and overall experience of 26 years) (Equity) & Murthy Nagarajan (Managing since 1-Apr-17 and overall experience of 21 years) (Debt)
Std. Dev (Annualised)Sharpe RatioPortfolio BetaR SquaredTreynorJenson
9.040.211.001.000.54
NA
10.750.071.140.940.19
-0.41^Risk-free rate based on the FBIL Overnight MIBOR rate of 6% as on Apr 27, 2018 For calculation methodology please refer to Pg 48
1% if redeemed on or before expiry of 365 days from the date of allotment (w.e.f. 6th April, 2015)
Equity & Equity Related TotalAutoTata Motors Ltd.Maruti Suzuki India Ltd.Mahindra & Mahindra Ltd.Auto AncillariesExide Industries Ltd.Apollo Tyres Ltd.BanksHDFC Bank Ltd.ICICI Bank Ltd.Yes Bank Ltd.Kotak Mahindra Bank Ltd.State Bank Of IndiaIndusind Bank Ltd.CementUltratech Cement Ltd.Construction ProjectLarsen & Toubro Ltd.Sadbhav Engineering Ltd.Consumer Non DurablesITC Ltd.Hindustan Unilever Ltd.United Spirits Ltd.FinanceHousing Development Finance Ltd.GasGail ( India ) Ltd.Industrial ProductsBharat Forge Ltd.Media & EntertainmentZee Entertainment Enterprises Ltd.Sun Tv Network Ltd.Petroleum ProductsReliance Industries Ltd.PharmaceuticalsSun Pharmaceutical Industries Ltd.Dishman Carbogen Amcis Ltd.PowerPower Grid Corporation Of India Ltd.SoftwareHCL Technologies Ltd.Infosys Ltd.Oracle Financials Services Soft Ltd.Other Equities^
V
Top 10 Holdings Equity Industry Allocation
Market Capitalisation wise Exposure NAV Movement
Issuer NameHDFC Bank Ltd.Reliance Industries Ltd.Larsen & Toubro Ltd.ITC Ltd.ICICI Bank Ltd.Yes Bank Ltd.Kotak Mahindra BankHCL Technologies Ltd.Infosys Ltd.Tata Motors Ltd.Total
% to NAV7.003.993.533.062.872.542.262.081.941.84
31.11
Large CapMid CapSmall Cap
Debt InstrumentsGovernment SecuritiesGOI - 6.68% (17/09/2031)GOI - 7.72% (25/05/2025)GOI - 6.79% (15/05/2027)GOI - 6.84% (19/12/2022)GOI - 7.35% (22/06/2024)GOI - 8.13% (21/09/2022)GOI - 7.80% (03/05/2020)SDL Punjab 7.07% (28/12/2020)GOI - 7.17% (08/01/2028)GOI - 8.24% (15/02/2027)GOI - 8.30% (02/07/2040)SDL Andhra Pradesh 7.51% (13/09/2037)GOI - 7.73% (19/12/2034)GOI - 6.57% (05/12/2033)GOI - 7.68% (15/12/2023)SDL Tamilnadu 8.14% (27/05/2025)GOI - 6.79% (26/12/2029)Non-Convertible Debentures/Bonds08.50 % HDFC Ltd.08.78 % Indiabulls Housing Finance Ltd.07.80 % Kotak Mahindra Investments Ltd.07.85 % Power Finance Corporation08.55 % Talwandi Sabo Power Ltd.07.85 % HDFC Ltd.07.95 % HDFC Ltd.06.99 % Rural Electrification Corp. Ltd.08.32 % Reliance Jio Infocomm Ltd.07.95 % Sikka Ports And Terminals Ltd.07.68 % Housing & Urban Development Corporation Ltd.09.36 % Power Finance Corporation08.70 % Power Finance Corporation07.98 % Andhra Bank09.45 % State Bank Of India09.40 % Blue Dart Express Ltd.09.50 % Blue Dart Express Ltd.Privately Placed/Unlisted08.00 % ONGC Petro-Additions Ltd.08.15 % Vodafone Mobile Services Ltd.Money Market InstrumentsNABARD - CPAxis Bank Ltd. - CDKotak Mahindra Bank - CDHDFC Ltd. - CP
57801.7213394.46
8945.978640.826747.166718.535057.543025.522455.661015.16
610.35388.40278.70244.15128.11
75.1048.3027.79
39839.646010.755014.154991.604831.524471.263984.722488.682434.211497.221436.281084.74
513.97504.73478.05
78.3311.08
8.359882.477401.952480.52
19347.989822.664701.472480.452343.40
SOVSOVSOVSOVSOVSOVSOVSOVSOVSOVSOVSOVSOVSOVSOVSOVSOV
CRISIL- AAACRISIL- AAACRISIL- AAACRISIL- AAA
CRISIL- AA(so)CRISIL- AAACRISIL- AAACRISIL- AAACRISIL- AAACRISIL- AAA
ICRA- AAACRISIL- AAACRISIL- AAA
IND AACRISIL- AAA
ICRA- AAICRA- AA
ICRA- AAA(so)CRISIL- AA
CRISIL- A1+CRISIL- A1+CRISIL- A1+CRISIL- A1+
3000000100000900000
26750002000000
20000005600000390000010350002500000
300000
150000
14000002130000
6037500640000200000
517650
1866666
900000
1600000635000
2300000
13500001600000
4400000
1100000900000132000
10.412.411.611.561.221.210.910.540.440.180.110.070.050.040.020.010.010.017.181.080.900.900.870.810.720.450.440.270.260.200.090.090.090.010.000.001.781.330.453.481.770.850.450.42
Past performance may or may not be sustained in the future. Returns greater than 1 year period are compounded annualized. Dividends are assumed to be reinvested and bonus is adjusted. Load is not taken in to consideration. For SIP returns, monthly investment of equal amounts invested on the 1st day of every month has been considered.
^ Exposure less than 1% has been clubbed under Other Equities
For scheme performance refer pages 36-48.*B: BenchmarkSource: MFI Explorer
80.14%14.84%5.02%
Market Capitalisation includes only domestic listed Equity exposure in BSE. Large Cap Companies are top 125 stocks by market capitalisation on S&P BSE 500 Index and Mid Cap stocks are those between 126 to 499 stocks by market capitalisation and 500 & above being classified as Small cap. For calculation purpose, the previous month market capitalisation data have been used. All the figures has been rebased to 100 (Based on internal calculation).
Company Name No. of SharesMarket Value
Rs. Lakhs% of
Assets
BENCHMARK
CRISIL Hybrid 35+65 - Aggressive Index
MONTHLY AVERAGE AUM
Rs.5491.21 (Rs. in Cr.)
EXPENSE RATIO**
DirectRegular
0.752.18
**Note: The rates specified are the actual weighted average expenses charged for the month of Apr 2018. The above ratio includes the Service tax on Investment Management Fees. The above ratio excludes, proportionate charge (out of maximum 30 bps on daily average net assets allowed) in respect sales beyond T-30 cities assets, wherever applicable.
Tata Balanced Fund(An Open-Ended Balanced Scheme)
Modified DurationAverage Maturity
Gross Yield to Maturity (For Debt Component)
i. Including NCA* ii. Excluding NCA**NCA - Net Current Assets
: 2.97 Years4.15 Years
7.48%7.71%
:
::
18.07%6.53%
6.10%6.00%
5.46%4.84%
4.08%4.00%
3.29%2.70%2.69%
2.36%1.65%
1.09%0.93%0.86%0.84%0.76%0.72%
0.00% 5.00% 10.00% 15.00% 20.00%
BanksConstruction Project
Consumer Non DurablesSoftware
Petroleum ProductsAuto
Auto AncillariesFinanceCement
Media & EntertainmentIndustrial Products
PharmaceuticalsPower
GasHotels, Resorts And Other Recreational…
Industrial Capital GoodsTransportation
Consumer DurablesNon - Ferrous Metals
90102114126138150
Apr-15 Apr-16 Apr-17 Apr-18
Tata Balanced Fund - Reg - GrowthCRISIL Hybrid 35+65 - Aggressive Index
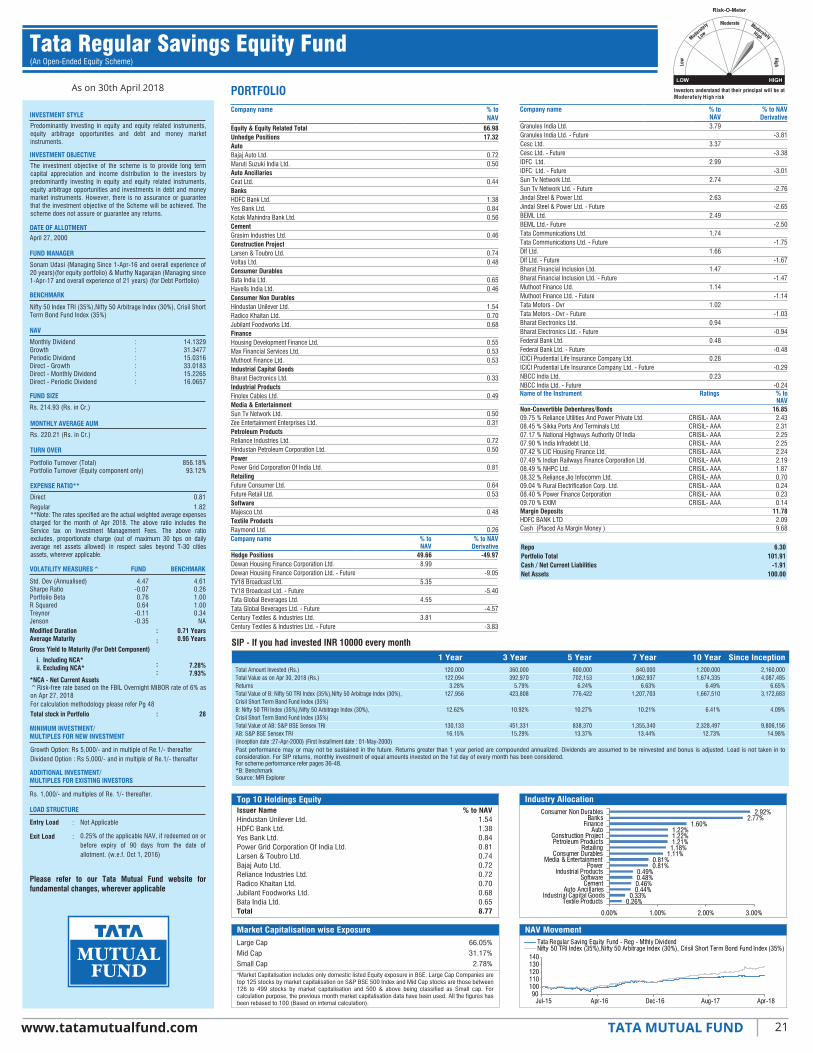
1 Year 3 Year 5 Year 7 Year 10 Year Since Inception
Please refer to our Tata Mutual Fund website for fundamental changes, wherever applicable
VOLATILITY MEASURES^ FUND BENCHMARK
21www.tatamutualfund.com TATA MUTUAL FUND
As on 30th April 2018
INVESTMENT STYLE
INVESTMENT OBJECTIVE
DATE OF ALLOTMENT
April 27, 2000
FUND MANAGER
NAV
Monthly DividendGrowthPeriodic DividendDirect - GrowthDirect - Monthly DividendDirect - Periodic Dividend
14.132931.347715.031633.018315.226516.0657
FUND SIZE
Rs. 214.93 (Rs. in Cr.)
MINIMUM INVESTMENT/MULTIPLES FOR NEW INVESTMENT
ADDITIONAL INVESTMENT/MULTIPLES FOR EXISTING INVESTORS
Rs. 1,000/- and multiples of Re. 1/- thereafter.
LOAD STRUCTURE
Entry Load : Not Applicable
Exit Load :
PORTFOLIO% toNAV
Company name
RepoPortfolio TotalCash / Net Current LiabilitiesNet Assets
6.30101.91
-1.91100.00
Predominantly investing in equity and equity related instruments, equity arbitrage opportunities and debt and money market instruments.
The investment objective of the scheme is to provide long term capital appreciation and income distribution to the investors by predominantly investing in equity and equity related instruments, equity arbitrage opportunities and investments in debt and money market instruments. However, there is no assurance or guarantee that the investment objective of the Scheme will be achieved. The scheme does not assure or guarantee any returns.
Sonam Udasi (Managing Since 1-Apr-16 and overall experience of 20 years)(for equity portfolio) & Murthy Nagarajan (Managing since 1-Apr-17 and overall experience of 21 years) (for Debt Portfolio)
::::::
Std. Dev (Annualised)Sharpe RatioPortfolio BetaR SquaredTreynorJenson
4.610.261.001.000.34
NA
4.47-0.070.760.64
-0.11-0.35
^Risk-free rate based on the FBIL Overnight MIBOR rate of 6% as on Apr 27, 2018
Growth Option: Rs 5,000/- and in multiple of Re.1/- thereafterDividend Option : Rs 5,000/- and in multiple of Re.1/- thereafter
For calculation methodology please refer Pg 48
0.25% of the applicable NAV, if redeemed on or before expiry of 90 days from the date of allotment. (w.e.f. Oct 1, 2016)
Modified DurationAverage Maturity
Gross Yield to Maturity (For Debt Component)
i. Including NCA* ii. Excluding NCA*
*NCA - Net Current Assets
: 0.71 Years0.95 Years
7.28%7.93%
:
::
Top 10 Holdings Equity Industry Allocation
Market Capitalisation wise Exposure NAV Movement
Issuer NameHindustan Unilever Ltd.HDFC Bank Ltd.Yes Bank Ltd.Power Grid Corporation Of India Ltd.Larsen & Toubro Ltd.Bajaj Auto Ltd.Reliance Industries Ltd.Radico Khaitan Ltd.Jubilant Foodworks Ltd.Bata India Ltd.Total
% to NAV1.541.380.840.810.740.720.720.700.680.658.77
Large Cap
Mid Cap
Small Cap
66.05%
31.17%
2.78%
"Market Capitalisation includes only domestic listed Equity exposure in BSE. Large Cap Companies are top 125 stocks by market capitalisation on S&P BSE 500 Index and Mid Cap stocks are those between 126 to 499 stocks by market capitalisation and 500 & above being classified as Small cap. For calculation purpose, the previous month market capitalisation data have been used. All the figures has been rebased to 100 (Based on internal calculation).
66.9817.32
0.720.50
0.44
1.380.840.56
0.46
0.740.48
0.650.46
1.540.700.68
0.550.530.53
0.33
0.49
0.500.31
0.720.50
0.81
0.640.53
0.48
0.26
Equity & Equity Related TotalUnhedge PositionsAutoBajaj Auto Ltd.Maruti Suzuki India Ltd.Auto AncillariesCeat Ltd.BanksHDFC Bank Ltd.Yes Bank Ltd.Kotak Mahindra Bank Ltd.CementGrasim Industries Ltd.Construction ProjectLarsen & Toubro Ltd.Voltas Ltd.Consumer DurablesBata India Ltd.Havells India Ltd.Consumer Non DurablesHindustan Unilever Ltd.Radico Khaitan Ltd.Jubilant Foodworks Ltd.FinanceHousing Development Finance Ltd.Max Financial Services Ltd.Muthoot Finance Ltd.Industrial Capital GoodsBharat Electronics Ltd.Industrial ProductsFinolex Cables Ltd.Media & EntertainmentSun Tv Network Ltd.Zee Entertainment Enterprises Ltd.Petroleum ProductsReliance Industries Ltd.Hindustan Petroleum Corporation Ltd.PowerPower Grid Corporation Of India Ltd.RetailingFuture Consumer Ltd.Future Retail Ltd.SoftwareMajesco Ltd.Textile ProductsRaymond Ltd.
Company name % toNAV
% to NAVDerivative
Granules India Ltd.Granules India Ltd. - FutureCesc Ltd.Cesc Ltd. - FutureIDFC Ltd.IDFC Ltd. - FutureSun Tv Network Ltd.Sun Tv Network Ltd. - FutureJindal Steel & Power Ltd.Jindal Steel & Power Ltd. - FutureBEML Ltd.BEML Ltd.- FutureTata Communications Ltd.Tata Communications Ltd. - FutureDlf Ltd.Dlf Ltd. - FutureBharat Financial Inclusion Ltd.Bharat Financial Inclusion Ltd. - FutureMuthoot Finance Ltd.Muthoot Finance Ltd. - FutureTata Motors - DvrTata Motors - Dvr - FutureBharat Electronics Ltd.Bharat Electronics Ltd. - FutureFederal Bank Ltd.Federal Bank Ltd. - FutureICICI Prudential Life Insurance Company Ltd.ICICI Prudential Life Insurance Company Ltd. - FutureNBCC India Ltd.NBCC India Ltd. - Future
-3.81
-3.38
-3.01
-2.76
-2.65
-2.50
-1.75
-1.67
-1.47
-1.14
-1.03
-0.94
-0.48
-0.29
-0.24
3.79
3.37
2.99
2.74
2.63
2.49
1.74
1.66
1.47
1.14
1.02
0.94
0.48
0.28
0.23
Company name % toNAV
% to NAVDerivative
Hedge PositionsDewan Housing Finance Corporation Ltd.Dewan Housing Finance Corporation Ltd. - FutureTV18 Broadcast Ltd.TV18 Broadcast Ltd. - FutureTata Global Beverages Ltd.Tata Global Beverages Ltd. - FutureCentury Textiles & Industries Ltd.Century Textiles & Industries Ltd. - Future
-49.97
-9.05
-5.40
-4.57
-3.83
49.668.99
5.35
4.55
3.81
Name of the Instrument Ratings % toNAV
Non-Convertible Debentures/Bonds09.75 % Reliance Utilities And Power Private Ltd.08.45 % Sikka Ports And Terminals Ltd.07.17 % National Highways Authority Of India07.90 % India Infradebt Ltd.07.42 % LIC Housing Finance Ltd.07.49 % Indian Railways Finance Corporation Ltd.08.49 % NHPC Ltd.08.32 % Reliance Jio Infocomm Ltd.09.04 % Rural Electrification Corp. Ltd.08.40 % Power Finance Corporation09.70 % EXIMMargin DepositsHDFC BANK LTDCash (Placed As Margin Money )
16.852.432.312.252.252.242.191.870.700.240.230.14
11.782.099.68
CRISIL- AAACRISIL- AAACRISIL- AAACRISIL- AAACRISIL- AAACRISIL- AAACRISIL- AAACRISIL- AAACRISIL- AAACRISIL- AAACRISIL- AAA
Total stock in Portfolio 28:
BENCHMARK
Nifty 50 Index TRI (35%),Nifty 50 Arbitrage Index (30%), Crisil Short Term Bond Fund Index (35%)
MONTHLY AVERAGE AUM
Rs. 220.21 (Rs. in Cr.)
TURN OVER
Portfolio Turnover (Total)Portfolio Turnover (Equity component only)
856.18%93.12%
EXPENSE RATIO**
Direct
Regular
0.81
1.82**Note: The rates specified are the actual weighted average expenses charged for the month of Apr 2018. The above ratio includes the Service tax on Investment Management Fees. The above ratio excludes, proportionate charge (out of maximum 30 bps on daily average net assets allowed) in respect sales beyond T-30 cities assets, wherever applicable.
Tata Regular Savings Equity Fund(An Open-Ended Equity Scheme)
SIP - If you had invested INR 10000 every month
Total Amount Invested (Rs.)Total Value as on Apr 30, 2018 (Rs.)ReturnsTotal Value of B: Nifty 50 TRI Index (35%),Nifty 50 Arbitrage Index (30%),Crisil Short Term Bond Fund Index (35%)B: Nifty 50 TRI Index (35%),Nifty 50 Arbitrage Index (30%),Crisil Short Term Bond Fund Index (35%)Total Value of AB: S&P BSE Sensex TRIAB: S&P BSE Sensex TRI(Inception date :27-Apr-2000) (First Installment date : 01-May-2000)
120,000122,094
3.28%127,956
12.62%
130,13316.15%
360,000392,970
5.79%423,808
10.92%
451,33115.29%
600,000702,153
6.24%776,422
10.27%
838,37013.37%
840,0001,062,937
6.63%1,207,703
10.21%
1,355,34013.44%
1,200,0001,674,335
6.49%1,667,510
6.41%
2,328,49712.73%
2,160,0004,087,485
6.65%3,172,683
4.09%
9,806,15614.98%
For scheme performance refer pages 36-48.*B: BenchmarkSource: MFI Explorer
Past performance may or may not be sustained in the future. Returns greater than 1 year period are compounded annualized. Dividends are assumed to be reinvested and bonus is adjusted. Load is not taken in to consideration. For SIP returns, monthly investment of equal amounts invested on the 1st day of every month has been considered.
2.92%2.77%
1.60%1.22%1.22%1.21%
1.18%1.11%
0.81%0.81%
0.49%0.48%0.46%0.44%
0.33%0.26%
0.00% 1.00% 2.00% 3.00%
Consumer Non DurablesBanks
FinanceAuto
Construction ProjectPetroleum Products
RetailingConsumer Durables
Media & EntertainmentPower
Industrial ProductsSoftwareCement
Auto AncillariesIndustrial Capital Goods
Textile Products
90100110120130140
Jul-15 Apr-16 Dec-16 Aug-17 Apr-18
Tata Regular Saving Equity Fund - Reg - Mthly DividendNifty 50 TRI Index (35%),Nifty 50 Arbitrage Index (30%), Crisil Short Term Bond Fund Index (35%)

VOLATILITY MEASURES^ FUND BENCHMARK
22www.tatamutualfund.com TATA MUTUAL FUND
As on 30th April 2018
INVESTMENT STYLE
INVESTMENT OBJECTIVE
DATE OF ALLOTMENT
September 03,2003
FUND MANAGER
NAV
Direct - GrowthDirect - DividendReg - GrowthReg - Dividend
27.652516.410226.218415.1177
FUND SIZE
Rs.701.43 (Rs. in Cr.)
MONTHLY AVERAGE AUM
Rs.755.80 (Rs. in Cr.)
EXPENSE RATIO**
DirectRegular
Modified DurationAverage Maturity
Gross Yield to Maturity (For Debt Component)
i. Including NCA* ii. Excluding NCA**NCA - Net Current Assets
: 3.10 Years4.43 Years
7.44%7.54%
:
::
MINIMUM INVESTMENT/MULTIPLES FOR NEW INVESTMENT
Rs. 5,000/- and in multiples of Re. 1/- thereafter.
ADDITIONAL INVESTMENT/MULTIPLES FOR EXISTING INVESTORS
Rs. 1,000/- and multiples of Re. 1/- thereafter.
LOAD STRUCTURE
Entry Load : Not Applicable
Exit Load :
PORTFOLIO
Name of the Instrument
21688.1519193.862235.62
99.3399.3048.8311.21
25277.914964.46
3864.75
3559.412528.412494.72
2468.432449.221476.74
1471.77
30.9227.363.190.140.140.070.02
36.047.08
5.51
5.073.603.56
3.523.492.11
2.10
SOVSOVSOVSOVSOVSOV
ICRA- AAA
CRISIL- AAA
CRISIL- AAACRISIL- AAACRISIL- AAA
CRISIL- AAACRISIL- AAACRISIL- AAA
CRISIL- AAA
Name of the Instrument RatingsRs. Lakhs
% to NAV
Repo
Portfolio Total
Cash / Net Current Asset
Net Assets
15444.39
67227.97
2915.27
70143.24
22.02
95.85
4.15
100.00
SIP - If you had invested INR 10000 every month
1 Year 3 Year 5 Year 7 Year 10 Year Since Inception
Total Amount Invested (Rs.)
Total Value as on Apr 30, 2018 (Rs.)
Returns
Total Value of B: CRISIL Composite Bond Fund Index
B: CRISIL Composite Bond Fund Index
Total Value of AB: CRISIL 10 Yr Gilt Index
AB: CRISIL 10 Yr Gilt Index
(Inception date :03-Sep-2003) (First Installment date : 01-Oct-2003)
120,000
120,175
0.28%
120,364
0.58%
116,850
-4.95%
360,000
389,437
5.21%
393,379
5.89%
376,156
2.90%
600,000
716,377
7.06%
728,145
7.71%
689,259
5.51%
840,000
1,112,348
7.92%
1,117,276
8.05%
1,040,832
6.05%
1,200,000
1,788,739
7.76%
1,802,698
7.91%
1,630,756
5.99%
1,750,000
3,066,485
7.32%
3,084,607
7.39%
2,755,700
5.97%
[ICRA]AAAmfs rating by ICRA$
Aims to create a liquid portfolio of good quality debt as well as Money Market Instruments so as to provide reasonable returns and liquidity.
To provide reasonable returns and high level of liquidity by investing in debt instruments including bonds, debentures and Government securities; and money market instruments such as treasury bills, commercial papers, certificates of deposit, including repos in permitted securities of different maturities, as permitted by regulation so as to spread the risk across different kinds of issuers in the debt markets.
Std. Dev (Annualised)Portfolio BetaR SquaredTreynorJenson
3.531.001.000.21
NA
3.761.060.870.04
-0.18
^Risk-free rate based on the FBIL Overnight MIBOR rate of 6% as on Apr 27, 2018 For calculation methodology please refer Pg 48
0.50% of NAV if redeemed on or before expiry of 30 days from the date of allotment (w.e.f 15th November, 2017).
Debt InstrumentsGovernment SecuritiesGOI - 7.17% (08/01/2028)GOI - 6.68% (17/09/2031)GOI - 7.72% (26/10/2055)GOI - 7.88% (19/03/2030)GOI 7.35% (22/06/2024)GOI - 7.37% (16/04/2023)Non-Convertible Debentures/Bonds07.70 % Housing & UrbanDevelopment Corporation Ltd.07.60 % Reliance Utilities AndPower Private Ltd.07.85 % Power Finance Corporation08.90 % Reliance Jio Infocomm Ltd.07.85 % Small Indust Devlop BankOf India07.38 % Kotak Mahindra Prime Ltd.07.05 % Power Finance Corporation08.01 % Rural ElectrificationCorp. Ltd.08.37 % India Infradebt Ltd.
2467.322467.322350.202350.20
3.523.523.353.35
ICRA- AAA(so)
CRISIL- A1+
Privately Placed/Unlisted08.00 % ONGC Petro-additions Ltd.Money Market InstrumentsHDFC Ltd. - CP
Market ValueRatingsRs. Lakhs
% to NAV
Market Value
Maturity Ladder
Composition by Ratings Instrument Wise Composition
NAV Movement
Past performance may or may not be sustained in the future. Returns greater than 1 year period are compounded annualized. Dividends are assumed to be reinvested and bonus is adjusted. Load is not taken in to consideration. For SIP returns, monthly investment of equal amounts invested on the 1st day of every month has been considered.For scheme performance refer pages 36-48.*B: Benchmark, AB: Additional BenchmarkSource: MFI Explorer
Akhil Mittal (Managing Since 26-Jun-14 and overall experience of 15 years)
BENCHMARK
CRISIL Composite Bond Fund Index
0.601.70
::::
**Note: The rates specified are the actual weighted average expenses charged for the month of Apr 2018. The above ratio includes the Service tax on Investment Management Fees. The above ratio excludes, proportionate charge (out of maximum 30 bps on daily average net assets allowed) in respect sales beyond T-30 cities assets, wherever applicable.
Tata Dynamic Bond Fund(An open ended dynamic debt scheme investing across duration)
42.91%
30.92%
26.17%A1+ / AAA
SOV
Cash & Cash Equivalents
39.56%
30.92%
3.35%
26.17% NCD - Non Convertible Deb
Government Securities
Commercial Papers
Cash & Cash Equivalents
28.93%
24.77%
7.69%
30.98%
3.47%
4.16%
0.00% 10.00% 20.00% 30.00% 40.00%
0 - 1 Yrs
1 - 3 Yrs
3 - 7 Yrs
7 - 10 Yrs
Abv 10 Yrs
Cash & Others
90
98
106
114
122
130
Apr-15 Apr-16 Apr-17 Apr-18
Tata Dynamic Bond Fund - Reg - GrowthCRISIL Composite Bond Fund Index
Please refer to our Tata Mutual Fund website for fundamental changes, wherever applicable
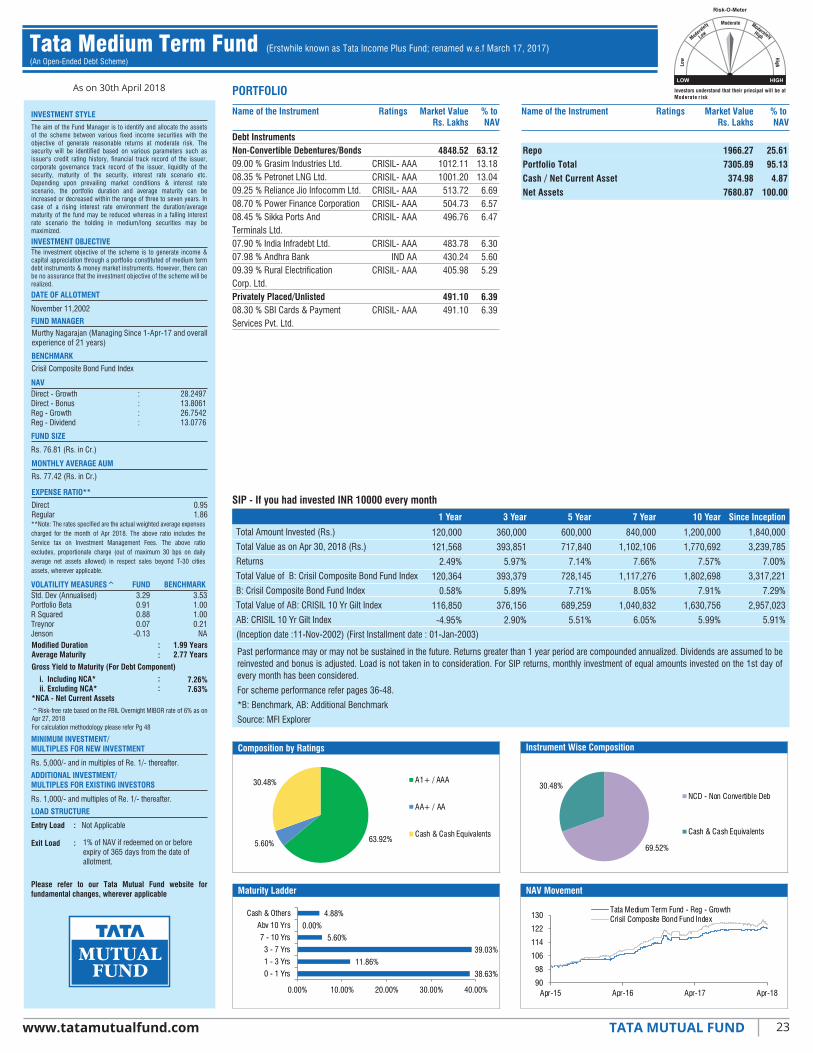
VOLATILITY MEASURES^ FUND BENCHMARKStd. Dev (Annualised)Portfolio BetaR SquaredTreynorJenson
3.531.001.000.21
NA
3.290.910.880.07
-0.13
23www.tatamutualfund.com TATA MUTUAL FUND
As on 30th April 2018
INVESTMENT STYLE
INVESTMENT OBJECTIVE
DATE OF ALLOTMENT
November 11,2002
FUND MANAGER
NAVDirect - GrowthDirect - BonusReg - GrowthReg - Dividend
::::
28.249713.806126.754213.0776
Rs. 76.81 (Rs. in Cr.)
MINIMUM INVESTMENT/MULTIPLES FOR NEW INVESTMENT
Rs. 5,000/- and in multiples of Re. 1/- thereafter.
ADDITIONAL INVESTMENT/MULTIPLES FOR EXISTING INVESTORS
Rs. 1,000/- and multiples of Re. 1/- thereafter.
LOAD STRUCTURE
Entry Load : Not Applicable
Exit Load :
PORTFOLIO
Name of the Instrument Ratings Market ValueRs. Lakhs
% to NAV
4848.521012.111001.20513.72504.73496.76
483.78430.24405.98
491.10491.10
63.1213.1813.046.696.576.47
6.305.605.29
6.396.39
Name of the Instrument RatingsRs. Lakhs
% to NAV
RepoPortfolio TotalCash / Net Current AssetNet Assets
1966.277305.89374.98
7680.87
25.6195.134.87
100.00
SIP - If you had invested INR 10000 every month
1 Year 3 Year 5 Year 7 Year 10 Year Since Inception
Total Amount Invested (Rs.)
Total Value as on Apr 30, 2018 (Rs.)
Returns
Total Value of B: Crisil Composite Bond Fund Index
B: Crisil Composite Bond Fund Index
Total Value of AB: CRISIL 10 Yr Gilt Index
AB: CRISIL 10 Yr Gilt Index
(Inception date :11-Nov-2002) (First Installment date : 01-Jan-2003)
120,000
121,568
2.49%
120,364
0.58%
116,850
-4.95%
360,000
393,851
5.97%
393,379
5.89%
376,156
2.90%
600,000
717,840
7.14%
728,145
7.71%
689,259
5.51%
840,000
1,102,106
7.66%
1,117,276
8.05%
1,040,832
6.05%
1,200,000
1,770,692
7.57%
1,802,698
7.91%
1,630,756
5.99%
1,840,000
3,239,785
7.00%
3,317,221
7.29%
2,957,023
5.91%
The aim of the Fund Manager is to identify and allocate the assets of the scheme between various fixed income securities with the objective of generate reasonable returns at moderate risk. The security will be identified based on various parameters such as issuer's credit rating history, financial track record of the issuer, corporate governance track record of the issuer, liquidity of the security, maturity of the security, interest rate scenario etc. Depending upon prevailing market conditions & interest rate scenario, the portfolio duration and average maturity can be increased or decreased within the range of three to seven years. In case of a rising interest rate environment the duration/average maturity of the fund may be reduced whereas in a falling interest rate scenario the holding in medium/long securities may be maximized.
The investment objective of the scheme is to generate income & capital appreciation through a portfolio constituted of medium term debt instruments & money market instruments. However, there can be no assurance that the investment objective of the scheme will be realized.
Murthy Nagarajan (Managing Since 1-Apr-17 and overall experience of 21 years)
FUND SIZE
^Risk-free rate based on the FBIL Overnight MIBOR rate of 6% as on Apr 27, 2018 For calculation methodology please refer Pg 48
1% of NAV if redeemed on or beforeexpiry of 365 days from the date ofallotment.
Debt InstrumentsNon-Convertible Debentures/Bonds09.00 % Grasim Industries Ltd.08.35 % Petronet LNG Ltd.09.25 % Reliance Jio Infocomm Ltd.08.70 % Power Finance Corporation08.45 % Sikka Ports AndTerminals Ltd.07.90 % India Infradebt Ltd.07.98 % Andhra Bank09.39 % Rural ElectrificationCorp. Ltd.Privately Placed/Unlisted08.30 % SBI Cards & PaymentServices Pvt. Ltd.
Market Value
Maturity Ladder
Composition by Ratings Instrument Wise Composition
NAV Movement
CRISIL- AAACRISIL- AAACRISIL- AAACRISIL- AAACRISIL- AAA
CRISIL- AAAIND AA
CRISIL- AAA
CRISIL- AAA
Past performance may or may not be sustained in the future. Returns greater than 1 year period are compounded annualized. Dividends are assumed to be reinvested and bonus is adjusted. Load is not taken in to consideration. For SIP returns, monthly investment of equal amounts invested on the 1st day of every month has been considered.
For scheme performance refer pages 36-48.
*B: Benchmark, AB: Additional Benchmark
Source: MFI Explorer
Modified DurationAverage Maturity
Gross Yield to Maturity (For Debt Component)
i. Including NCA* ii. Excluding NCA**NCA - Net Current Assets
: 1.99 Years2.77 Years
7.26%7.63%
:
::
BENCHMARK
Crisil Composite Bond Fund Index
MONTHLY AVERAGE AUM
Rs. 77.42 (Rs. in Cr.)
EXPENSE RATIO**
DirectRegular
0.951.86
**Note: The rates specified are the actual weighted average expenses charged for the month of Apr 2018. The above ratio includes the Service tax on Investment Management Fees. The above ratio excludes, proportionate charge (out of maximum 30 bps on daily average net assets allowed) in respect sales beyond T-30 cities assets, wherever applicable.
Tata Medium Term Fund(An Open-Ended Debt Scheme)
(Erstwhile known as Tata Income Plus Fund; renamed w.e.f March 17, 2017)
63.92%5.60%
30.48% A1+ / AAA
AA+ / AA
Cash & Cash Equivalents
69.52%
30.48%NCD - Non Convertible Deb
Cash & Cash Equivalents
38.63%
11.86%
39.03%
5.60%
0.00%
4.88%
0.00% 10.00% 20.00% 30.00% 40.00%
0 - 1 Yrs
1 - 3 Yrs
3 - 7 Yrs
7 - 10 Yrs
Abv 10 Yrs
Cash & Others
90
98
106
114
122
130
Apr-15 Apr-16 Apr-17 Apr-18
Tata Medium Term Fund - Reg - GrowthCrisil Composite Bond Fund Index
Please refer to our Tata Mutual Fund website for fundamental changes, wherever applicable

VOLATILITY MEASURES^ FUND BENCHMARK
24www.tatamutualfund.com TATA MUTUAL FUND
As on 30th April 2018
INVESTMENT STYLE
INVESTMENT OBJECTIVE
DATE OF ALLOTMENT
April 28, 1997
FUND MANAGER
NAVDirect - GrowthDirect - Half Yearly DividendDir- Periodic DividendReg - GrowthReg - Half Yearly DividendReg- Dividend
::::::
54.084213.634630.795351.859413.010530.0819
FUND SIZE
Rs. 112.41 (Rs. in Cr.)
MINIMUM INVESTMENT/ MULTIPLES FOR NEW INVESTMENT
ADDITIONAL INVESTMENT/MULTIPLES FOR EXISTING INVESTORS
Rs. 1,000/- and multiples of Re. 1/- thereafter.
LOAD STRUCTURE
Entry Load :
:
Not Applicable
Exit Load
PORTFOLIO
Name of the Instrument
3779.231492.041439.54487.24329.7426.414.26
3100.96993.51961.43
653.77
492.25982.20982.20
33.6213.2712.814.332.930.230.04
27.588.848.55
5.82
4.388.748.74
Name of the Instrument RatingsRs. Lakhs
% to NAV
Repo
Portfolio Total
Cash / Net Current Asset
Net Assets
2560.46
10422.86
818.62
11241.48
22.78
92.72
7.28
100.00
SIP - If you had invested INR 10000 every month
1 Year 3 Year 5 Year 7 Year 10 Year Since Inception
Total Amount Invested (Rs.)
Total Value as on Apr 30, 2018 (Rs.)
Returns
Total Value of B: Crisil Composite Bond Fund Index
B: Crisil Composite Bond Fund Index
Total Value of AB: CRISIL 10 Yr Gilt Index
AB: CRISIL 10 Yr Gilt Index
(Inception date :28-Apr-1997) (First Installment date : 01-Aug-1997)
120,000
120,364
0.58%
119,707
-0.46%
116,850
-4.95%
360,000
387,214
4.83%
393,379
5.89%
376,156
2.90%
2,490,000
5,539,333
7.12%
5,209,615
6.61%
4,909,975
6.10%
1,200,000
1,743,474
7.27%
1,802,698
7.91%
1,630,756
5.99%
840,000
1,092,064
7.40%
1,117,276
8.05%
1,040,832
6.05%
600,000
708,252
6.60%
728,145
7.71%
689,259
5.51%
[ICRA]AAAmfs rating by ICRA$
An income scheme with exposure to rated debt instruments with medium to long term maturity.
To provide income distribution and / or medium to long term capital gains while at all times emphasising the importance of safety and capital appreciation.
Akhil Mittal (Managing Since 26-Jun-14 and overall experience of 15 years)
Half Yearly Dividend Plan, Periodic Dividend Plan, rowth Plan, Bonus Plan: Rs. 5,000/- and in multiples of Re. 1/- thereafter. Quarterly Dividend Plan: Rs. 10,000/- and in multiples of Re. 1/- thereafter.
Std. Dev (Annualised)Portfolio BetaR SquaredTreynorJenson
3.531.001.000.21
NA
3.771.080.920.02
-0.20
^Risk-free rate based on the FBIL Overnight MIBOR rate of 6% as on Apr 27, 2018
1% if redeemed before expiry of 365 days from the date of allotment(w.e.f. 1st July, 2014)
Market ValueRatingsRs. Lakhs
% to NAV
Market Value
Debt InstrumentsGovernment SecuritiesGOI - 7.68% (15/12/2023)GOI - 7.17% (08/01/2028)GOI - 7.16% (20/05/2023)GOI - 6.84% (19/12/2022)GOI - 7.88% (19/03/2030)GOI - 6.79% (26/12/2029)Non-Convertible Debentures/Bonds08.45 % Sikka Ports And Terminals Ltd.07.67 % Reliance Utilities AndPower Private Ltd.09.84 % IOT Utkal EnergyServices Ltd.08.01 % Rural Electrification Corp. Ltd.Privately Placed/Unlisted08.30 % SBI Cards &Payment Services Pvt. Ltd.
SOVSOVSOVSOVSOVSOV
CRISIL- AAACRISIL- AAA
CRISIL- AAA(so)
CRISIL- AAA
CRISIL- AAA
Maturity Ladder
Composition by Ratings Instrument Wise Composition
NAV Movement
For calculation methodology please refer Pg 48 Past performance may or may not be sustained in the future. Returns greater than 1 year period are compounded annualized. Dividends are assumed to be reinvested and bonus is adjusted. Load is not taken in to consideration. For SIP returns, monthly investment of equal amounts invested on the 1st day of every month has been considered. For scheme performance refer pages 36-48. *B: Benchmark, AB: Additional Benchmark Source: MFI Explorer
Modified DurationAverage Maturity
Gross Yield to Maturity (For Debt Component)
i. Including NCA* ii. Excluding NCA**NCA - Net Current Assets
: 3.09 Years4.21 Years
7.10%7.65%
:
::
BENCHMARK
Crisil Composite Bond Fund Index
MONTHLY AVERAGE AUM
Rs. 115.61 (Rs. in Cr.)
EXPENSE RATIO**
DirectRegular
0.382.02
**Note: The rates specified are the actual weighted average expenses charged for the month of Apr 2018. The above ratio includes the Service tax on Investment Management Fees. The above ratio excludes, proportionate charge (out of maximum 30 bps on daily average net assets allowed) in respect sales beyond T-30 cities assets, wherever applicable.
Tata Long Term Debt Fund (Erstwhile known as Tata Income Fund; renamed w.e.f December 1, 2016)(An Open-Ended Debt Scheme)
36.32%
33.62%
30.06%A1+ / AAA
SOV
Cash & Cash Equivalents
36.32%
33.62%
30.06%NCD - Non Convertible Deb
Government Securities
Cash & Cash Equivalents
24.91%
3.69%
46.67%
17.18%
0.27%
7.28%
0.00% 10.00% 20.00% 30.00% 40.00% 50.00%
0 - 1 Yrs
1 - 3 Yrs
3 - 7 Yrs
7 - 10 Yrs
Abv 10 Yrs
Cash & Others
90
98
106
114
122
130
Apr-15 Apr-16 Apr-17 Apr-18
Tata Long Term Debt Fund - Reg - GrowthCrisil Composite Bond Fund Index
Please refer to our Tata Mutual Fund website for fundamental changes, wherever applicable

VOLATILITY MEASURES^ FUND BENCHMARK
Std. Dev (Annualised)Portfolio BetaR SquaredTreynorJenson
1.351.001.000.17
NA
1.391.000.910.08
-0.09
25www.tatamutualfund.com TATA MUTUAL FUND
As on 30th April 2018
INVESTMENT STYLE
INVESTMENT OBJECTIVE
DATE OF ALLOTMENT
August 8, 2002
FUND MANAGER
NAV
Direct - GrowthDirect - Monthly DividendDirect -DividendReg - GrowthReg - Monthly DividendReg -Dividend
::::::
33.478115.676617.752632.214415.056917.0701
FUND SIZE
Rs. 6230.70 (Rs. in Cr.)
MINIMUM INVESTMENT/MULTIPLES FOR NEW INVESTMENT
Rs. 5,000/- and in multiples of Re. 1/- thereafter.
ADDITIONAL INVESTMENT/MULTIPLES FOR EXISTING INVESTORS
Rs. 1,000/- and multiples of Re. 1/- thereafter.
LOAD STRUCTURE
Entry Load : Not Applicable
Exit Load :
PORTFOLIO
Name of the Instrument
59691.379766.729646.458840.377586.315854.014666.904086.952526.362409.701531.83994.00482.07449.46244.42190.94177.12108.6468.0461.08
355320.2722960.1421421.0317719.2917507.2315018.8914239.7112268.9911630.7011540.9410957.9810000.579837.379803.379787.739760.748015.815081.415026.115009.905008.175007.685003.344999.894991.604989.434975.314967.574959.744946.614939.424936.874929.634928.47
9.581.571.551.421.220.940.750.660.410.390.250.160.080.070.040.030.030.020.010.01
57.033.693.442.842.812.412.291.971.871.851.761.611.581.571.571.571.290.820.810.800.800.800.800.800.800.800.800.800.800.790.790.790.790.79
SOVSOVSOVSOVSOVSOVSOVSOVSOVSOVSOVSOVSOVSOVSOVSOVSOVSOVSOV
CRISIL- AAACRISIL- AAACRISIL- AAACRISIL- AAA
ICRA- AAA(so)CRISIL- AAACRISIL- AAACRISIL- AAACRISIL- AAACRISIL- AAACRISIL- AAACRISIL- AAACRISIL- AAACRISIL- AAACRISIL- AAACRISIL- AAA
ICRA- AAACRISIL- AAACRISIL- AAACRISIL- AAACRISIL- AAACRISIL- AAACRISIL- AAACRISIL- AAACRISIL- AAA
ICRA- AAA(so)CRISIL- AAACRISIL- AAACRISIL- AAACRISIL- AAACRISIL- AAACRISIL- AAACRISIL- AAA
Name of the Instrument Ratings Market ValueRs. Lakhs
% to NAV
RepoPortfolio TotalCash / Net Current AssetNet Assets
25503.49595375.9227694.03
623069.95
4.1095.564.44
100.00
SIP - If you had invested INR 10000 every month1 Year 3 Year 5 Year 7 Year 10 Year Since Inception
Total Amount Invested (Rs.)Total Value as on Apr 30, 2018 (Rs.)ReturnsTotal Value of B: Crisil Short Term Bond Fund IndexB: Crisil Short Term Bond Fund IndexTotal Value of AB: CRISIL 1 Yr T-Bill IndexAB: CRISIL 1 Yr T-Bill Index(Inception date :08-Aug-2002) (First Installment date : 01-Sep-2002)
120,000
122,428
3.87%
122,730
4.35%
123,851
6.16%
360,000
395,394
6.24%
398,325
6.74%
396,520
6.43%
600,000
721,012
7.32%
728,612
7.74%
714,695
6.97%
840,000
1,111,314
7.90%
1,120,526
8.13%
1,079,979
7.09%
1,200,000
1,809,525
7.98%
1,817,827
8.07%
1,702,483
6.82%
1,880,000
3,643,411
7.96%
3,555,265
7.68%
3,173,624
6.36%
[ICRA]AAAmfs rating by ICRA$
A debt scheme that invests in short term debt instruments having high level of liquidity.
To create a liquid portfolio of debt as well as Money Market Instruments so as to provide reasonable returns and liquidity to the Unitholders.
Murthy Nagarajan (Managing Since 1-Apr-17 and overall experience of 21 years)
^Risk-free rate based on the FBIL Overnight MIBOR rate of 6% as on Apr 27, 2018 For calculation methodology please refer Pg 48
Nil (w.e.f. 7th July, 2017)
Ratings Market ValueRs. Lakhs
% to NAV
Composition by Ratings Instrument Wise Composition
NAV MovementMaturity Ladder
Debt InstrumentsGovernment SecuritiesGOI - 7.35% (22/06/2024)SDL Gujarat 8.99% (14/03/2022)SDL Punjab 7.07% (28/12/2020)GOI - 8.13% (21/09/2022)SDL Punjab 6.90% (11/01/2021)GOI - 6.68% (17/09/2031)SDL Punjab 6.99% (13/10/2020)SDL Punjab 8.34% (06/10/2020)GOI - 6.84% (19/12/2022)SDL Gujarat 7.21% (09/08/2027)GOI - 7.72% (25/05/2025)SDL Rajasthan Uday 8.15% (23/06/2021)SDL Kerala 8% (11/04/2028)GOI - 6.79% (26/12/2029)GOI - 6.79% (15/05/2027)SDL Maharashtra 7.33% (13/09/2027)GOI - 7.17% (08/01/2028)GOI - 7.68% (15/12/2023)GOI - 8.27% (09/06/2020)Non-Convertible Debentures/bonds07.85 % NABARD06.99 % Rural Electrification Corp. Ltd.09.04 % Rural Electrification Corp. Ltd.08.10 % Reliance Jio Infocomm Ltd.08.35 % Nabha Power Ltd.07.50 % Bajaj Finance Ltd.07.40 % Gruh Finance Ltd.08.90 % Reliance Jio Infocomm Ltd.08.36 % Power Finance Corporation07.85 % HDFC Ltd.07.65 % Kotak Mahindra Investments Ltd.07.00 % HDFC Ltd.08.00 % Reliance Jio Infocomm Ltd.07.43 % Hdb Financial Services Ltd.09.25 % Reliance Jio Infocomm Ltd.08.55 % Reliance Jio Infocomm Ltd.08.82 % Rural Electrification Corp. Ltd.08.52 % Power Finance Corporation07.75 % India Infradebt Ltd.08.60 % HDFC Ltd.08.06 % Small Indust Devlop Bank Of India08.38 % HDFC Ltd.08.35 % LIC Housing Finance Ltd.07.80 % Kotak Mahindra Investments Ltd.07.85 % Small Indust Devlop Bank Of India08.12 % Nabha Power Ltd.08.45 % Sikka Ports And Terminals Ltd.07.59 % LIC Housing Finance Ltd.07.59 % Kotak Mahindra Investments Ltd.07.42 % Rural Electrification Corp. Ltd.07.38 % Kotak Mahindra Prime Ltd.07.42 % Power Finance Corporation07.62 % Bajaj Finance Ltd.
07.85 % Power Finance Corporation09.02 % Rural Electrification Corp. Ltd.07.20 % Indian Railways Finance Corporation Ltd.08.39 % HDFC Ltd.07.50 % Power Finance Corporation08.37 % India Infradebt Ltd.08.38 % LIC Housing Finance Ltd.09.50 % IDFC Bank Ltd.07.70 % Rural Electrification Corp. Ltd.08.30 % Nabha Power Ltd.08.00 % Kotak Mahindra Prime Ltd.07.51 % LIC Housing Finance Ltd.07.96 % LIC Housing Finance Ltd.08.10 % Orix Leasing & Financial Services India Ltd.07.95 % HDB Financial Services Ltd.09.35 % LIC Housing Finance Ltd.08.36 % Rural Electrification Corp. Ltd.08.45 % HDFC Ltd.09.84 % Iot Utkal Energy Services Ltd.08.32 % Reliance Jio Infocomm Ltd.07.65 % Indian Railways Finance Corporation Ltd.08.40 % Power Finance Corporation08.18 % LIC Housing Finance Ltd.08.34 % IDFC Bank Ltd.07.39 % LIC Housing Finance Ltd.07.90 % India Infradebt Ltd.08.28 % Power Finance CorporationPrivately Placed/Unlisted07.44 % Daimler Financial Services India Private Ltd.08.00 % Ongc Petro-additions Ltd.08.30 % SBI Cards & Payment Services Pvt. Ltd.08.35 % Daimler Financial Services India Private Ltd.08.05 % Daimler Financial Services India Private Ltd.08.10 % SBI Cards & Payment Services Pvt. Ltd.08.22 % Daimler Financial Services India Private Ltd.07.54 % Gruh Finance Ltd.Money Market InstrumentsHDFC Ltd. - CPYes Bank Ltd. - CDEXIM - CPAxis Bank Ltd. - CDAxis Bank Ltd. - CDNABARD - CPIndusind Bank Ltd. - CDIL&FS Ltd. - CPHDFC Ltd. - CPHDFC Bank Ltd. - CDYes Bank Ltd. - CDIndusind Bank Ltd. - CD
CRISIL- AAACRISIL- AAACRISIL- AAACRISIL- AAACRISIL- AAACRISIL- AAACRISIL- AAA
ICRA- AAACRISIL- AAA
ICRA- AAA(so)CRISIL- AAACRISIL- AAACRISIL- AAA
IND AAACRISIL- AAACRISIL- AAACRISIL- AAACRISIL- AAA
CRISIL- AAA(so)CRISIL- AAACRISIL- AAACRISIL- AAACRISIL- AAA
ICRA- AAACRISIL- AAACRISIL- AAACRISIL- AAA
CRISIL- AAAICRA- AAA(SO)
CRISIL- AAACRISIL- AAACRISIL- AAACRISIL- AAACRISIL- AAACRISIL- AAA
CRISIL- A1+ICRA- A1+
CRISIL- A1+CRISIL- A1+CRISIL- A1+CRISIL- A1+CRISIL- A1+
ICRA- A1+CRISIL- A1+CARE- A1+ICRA- A1+
CRISIL- A1+
4831.524547.023937.553505.343451.003041.653004.062526.532519.882502.742497.832490.242487.612487.062485.772024.042012.372004.491961.30998.15762.96501.08500.69500.02480.3177.4110.01
64428.9617268.0914014.3610804.197502.014992.734860.322496.972490.29
90431.8421090.609731.509722.819464.657042.434911.334866.544838.634700.414694.044686.934681.97
0.780.730.630.560.550.490.480.410.400.400.400.400.400.400.400.320.320.320.310.160.120.080.080.080.080.010.00
10.342.772.251.731.200.800.780.400.40
14.513.381.561.561.521.130.790.780.780.750.750.750.75
Past performance may or may not be sustained in the future. Returns greater than 1 year period are compounded annualized. Dividends are assumed to be reinvested and bonus is adjusted. Load is not taken in to consideration. For SIP returns, monthly investment of equal amounts invested on the 1st day of every month has been considered.For scheme performance refer pages 36-48*B: Benchmark, AB: Additional BenchmarkSource: MFI Explorer
Modified DurationAverage Maturity
Gross Yield to Maturity (For Debt Component)
i. Including NCA* ii. Excluding NCA**NCA - Net Current Assets
: 1.60 Years1.98 Years
7.71%7.96%
:
::
BENCHMARK
Crisil Short Term Bond Fund Index
MONTHLY AVERAGE AUM
Rs. 6367.03 (Rs. in Cr.)
EXPENSE RATIO**DirectRegular
0.231.11
**Note: The rates specified are the actual weighted average expenses charged for the month of Apr 2018. The above ratio includes the Service tax on Investment Management Fees. The above ratio excludes, proportionate charge (out of maximum 30 bps on daily average net assets allowed) in respect sales beyond T-30 cities assets, wherever applicable.
Tata Short Term Bond Fund(An Open-Ended Debt Scheme)
81.88%
9.58%
8.54%
A1+ / AAA
SOV
Cash & Cash Equivalents 67.37%4.19%
7.26%
7.25%
5.39%8.54% NCD - Non Convertible Deb
Government Securities
Commercial Papers
Certificate Of Deposit
State Development Loans
Cash & Cash Equivalents
33.74%46.08%
13.62%1.33%0.79%
4.44%
0.00% 10.00% 20.00% 30.00% 40.00% 50.00%
0 - 1 Yrs1 - 3 Yrs3 - 7 Yrs
7 - 10 YrsAbv 10 Yrs
Cash & Others
100
106
112
118
124
130
Apr-15 Apr-16 Apr-17 Apr-18
Tata Short Term Bond Fund - Reg - GrowthCrisil Short Term Bond Fund Index
Please refer to our Tata Mutual Fund website for fundamental changes, wherever applicable

26www.tatamutualfund.com TATA MUTUAL FUND
As on 30th April 2018
INVESTMENT STYLE
INVESTMENT OBJECTIVE
MINIMUM INVESTMENT/MULTIPLES FOR NEW INVESTMENT
Rs. 5,000/- and in multiples of Re. 1/- thereafter.
ADDITIONAL INVESTMENT/MULTIPLES FOR EXISTING INVESTORS
Rs. 1,000/- and multiples of Re. 1/- thereafter.
LOAD STRUCTURE
Entry Load : Not Applicable
Exit Load : Nil
PORTFOLIO
Name of the Instrument Name of the Instrument RatingsRs. Lakhs
% to NAV
RepoPortfolio TotalCash / Net Current AssetNet Assets
2314.9257593.362038.30
59631.66
3.8896.583.42
100.00
SIP - If you had invested INR 10000 every month
1 Year 3 Year 5 Year 7 Year 10 Year Since Inception
Total Amount Invested (Rs.)Total Value as on Apr 30, 2018 (Rs.)ReturnsTotal Value of B: Crisil Short Term Bond Fund IndexB: Crisil Short Term Bond Fund IndexTotal Value of AB: CRISIL 1 Yr T-Bill IndexAB: CRISIL 1 Yr T-Bill Index(Inception date :13-Jul-2007) (First Installment date : 01-Aug-2007)
120,000123,452
5.52%122,730
4.35%123,851
6.16%
360,000397,862
6.66%398,325
6.74%396,520
6.43%
600,000721,168
7.33%728,623
7.74%714,702
6.97%
840,0001,104,632
7.73%1,120,540
8.13%1,080,000
7.09%
1,200,0001,796,786
7.85%1,817,859
8.07%1,702,506
6.82%
1,290,0001,995,860
7.86%2,017,842
8.05%1,874,615
6.75%
Maturity Ladder
Composition by Ratings Instrument Wise Composition
NAV Movement
The Scheme endeavors to generate returns and capital appreciation by predominantly investing in corporate debt securities of varying maturities across the credit spectrum. The Scheme will seek opportunities across the credit curve and will endeavor to take benefit from superior yield available from time to time.
The investment objective of the scheme is to generate returns over short to medium term by investing predominantly in corporate debt instruments. However, there is no guarantee or assurance that the investment objective of the scheme will be achieved. The scheme doesn't assure or guarantee any returns.
^Risk-free rate based on the FBIL Overnight MIBOR rate of 6% as on Apr 27, 2018
For calculation methodology please refer Pg 48
Market ValueRatingsRs. Lakhs
% to NAV
Market Value
Debt InstrumentsNon-Convertible Debentures/Bonds07.73 % Mahindra Rural HousingFinance Ltd.08.15 % Piramal Enterprises Ltd.08.29 % NABARD07.85 % Indiabulls Housing Finance Ltd.07.70 % Tata Power Company Ltd.08.54 % J.M. Financial Products Ltd.08.54 % IL & FS Financial Ser Ltd.07.70 % Housing & Urban DevelopmentCorporation Ltd.07.59 % Rural ElectrificationCorp. Ltd.07.84 % Trent Ltd.08.25 % Vizag General Cargo BerthPvt. Ltd.07.99 % Tata Power Company Ltd.09.15 % Tata Capital FinancialServices Ltd.07.85 % NABARD08.32 % Nabha Power Ltd.08.10 % Reliance Jio Infocomm Ltd.07.50 % Power Finance Corporation
CRISIL- AA+
ICRA- AACRISIL- AAACRISIL- AAACRISIL- AA-CRISIL- AACARE- AAAICRA- AAA
CRISIL- AAA
CARE- AA+CRISIL- AA(so)
CRISIL- AA-CRISIL- AA+
CRISIL- AAAICRA- AAA(so)
CRISIL- AAACRISIL- AAA
38766.494947.52
3977.012503.492499.832495.242493.922486.672482.23
2480.21
2477.042472.54
2455.681503.12
1497.401001.34500.25493.00
65.018.30
6.674.204.194.184.184.174.16
4.16
4.154.15
4.122.52
2.511.680.840.83
Privately Placed/unlisted08.00 % ONGC Petro-additions Ltd.08.05 % Daimler FinancialServices India Private Ltd.08.10 % SBI Cards & PaymentServices Pvt. Ltd.Money Market InstrumentsICICI Bank Ltd. - CDReliance Industries Ltd. - CPDewan Housing Fin CorporationLtd. - CPYes Bank Ltd. - CDHDFC Ltd. - CP
ICRA- AAA(so)CRISIL- AAA
CRISIL- AAA
ICRA- A1+CRISIL- A1+CRISIL- A1+
ICRA- A1+CRISIL- A1+
4457.382467.32
998.55
991.51
12054.572487.672437.332422.98
2363.192343.40
7.474.141.67
1.66
20.224.174.094.06
3.963.93
Past performance may or may not be sustained in the future. Returns greater than 1 year period are compounded annualized. Dividends are assumed to be reinvested and bonus is adjusted. Load is not taken in to consideration. For SIP returns, monthly investment of equal amounts invested on the 1st day of every month has been considered.For scheme performance refer pages 36-48.*B: Benchmark, AB: Additional BenchmarkSource: MFI Explorer
VOLATILITY MEASURES^ FUND BENCHMARK1.351.001.000.17
NA
Std. Dev (Annualised)Portfolio BetaR SquaredTreynorJenson
0.730.430.680.210.02
DATE OF ALLOTMENT
July 13,2007
FUND MANAGER
NAV
Direct - GrowthDirect - Monthly DividendDirect - Weekly DividendDirect - Daily DividendReg - GrowthReg - Monthly DividendReg - Weekly DividendReg - Daily Dividend
2363.23881000.88161009.15131006.02762282.47911000.84621008.06721005.8111
FUND SIZE
Rs. 596.32 (Rs. in Cr.)
BENCHMARK
Crisil Short Term Bond Fund Index
Amit Somani (Managing Since 21-May-14 and overall experience of 16 years)
MONTHLY AVERAGE AUM
Rs. 580.53 (Rs. in Cr.)
EXPENSE RATIO**DirectRegular
0.290.93
Modified DurationAverage MaturityGross Yield to Maturity (For Debt Component) i. Including NCA* ii. Excluding NCA**NCA - Net Current Assets
: 0.94 Years1.17 Years
7.74%8.02%
:
::
**Note: The rates specified are the actual weighted average expenses charged for the month of Apr 2018. The above ratio includes the Service tax on Investment Management Fees. The above ratio excludes, proportionate charge (out of maximum 30 bps on daily average net assets allowed) in respect sales beyond T-30 cities assets, wherever applicable.
Tata Corporate Bond Fund(An Open-Ended Debt Scheme)
::::::::
(Erstwhile known as Tata Treasury Manager Fund; renamed w.e.f March 17, 2017)
54.43%
25.82%
8.30%
4.15%7.30%
A1+ / AAA
AA+ / AA
AA-
Db
Cash & Cash Equivalents72.48%
12.08%
8.13%7.31%
NCD - Non Convertible Deb
Commercial Papers
Certificate Of Deposit
Cash & Cash Equivalents
8.05%4.20%
12.35%14.59%
42.50%13.23%
0.00%1.66%
3.42%
0.00% 10.00% 20.00% 30.00% 40.00% 50.00%
0 - 1 Mths1 - 3 Mths3 - 6 Mths
6 - 12 Mths1 - 2 Yrs2 - 3 Yrs3 - 5 Yrs
Abv 5 YrsCash & Others
100
106
112
118
124
130
Apr-15 Apr-16 Apr-17 Apr-18
Tata Corporate Bond Fund - Reg - GrowthCrisil Short Term Bond Fund Index
Please refer to our Tata Mutual Fund website for fundamental changes, wherever applicable

VOLATILITY MEASURES^ FUND BENCHMARK
27www.tatamutualfund.com TATA MUTUAL FUND
As on 30th April 2018
INVESTMENT STYLE
INVESTMENT OBJECTIVE
DATE OF ALLOTMENT
September 06,2005
FUND MANAGER
NAV
Direct - GrowthDirect - DividendDirect - Weekly DivDirect - Daily DividendReg - GrowthReg - DividendReg - Weekly DivReg - Daily Dividend
: 2665.60621690.58511007.59981003.05762642.06711676.31161007.53161002.9969
: : : : : :
FUND SIZE
Rs. 4544.69 (Rs. in Cr.)
MINIMUM INVESTMENT/MULTIPLES FOR NEW INVESTMENT
Rs. 5,000/- and in multiples of Re. 1/- thereafter.
ADDITIONAL INVESTMENT/MULTIPLES FOR EXISTING INVESTORS
Rs. 1,000/- and multiples of Re. 1/- thereafter.
LOAD STRUCTURE
Entry Load : Not ApplicableExit Load :
PORTFOLIO
Name of the Instrument
198164.3719121.0318552.3618538.5212524.709965.189905.067954.027515.207496.967482.697453.426968.725003.464998.824987.284980.904974.134964.464946.614487.223973.682528.412502.782494.722483.882466.762455.681517.611475.201470.171008.55966.19
41389.8810006.919994.565006.074980.574933.742502.892467.321497.82
43.604.214.084.082.762.192.181.751.651.651.651.641.531.101.101.101.101.091.091.090.990.870.560.550.550.550.540.540.330.320.320.220.219.112.202.201.101.101.090.550.540.33
Name of the Instrument
RepoPortfolio TotalCash / Net Current AssetNet Assets
17640.47444030.5810438.61
454469.19
3.9497.762.24
100.00
SIP - If you had invested INR 10000 every month1 Year 3 Year 5 Year 7 Year 10 Year Since Inception
Total Amount Invested (Rs.)
Total Value as on Apr 30, 2018 (Rs.)
Returns
Total Value of B: Crisil Liquid Fund Index
B: Crisil Liquid Fund Index
Total Value of AB: CRISIL 1 Yr T-Bill Index
AB: CRISIL 1 Yr T-Bill Index
(Inception date :06-Sep-2005) (First Installment date : 01-Oct-2005)
120,000
124,007
6.41%
124,348
6.96%
123,851
6.16%
360,000
401,476
7.27%
400,087
7.04%
396,520
6.43%
600,000
730,503
7.84%
724,826
7.53%
714,702
6.97%
840,000
1,124,080
8.22%
1,109,192
7.84%
1,080,000
7.09%
1,200,000
1,835,499
8.25%
1,788,947
7.76%
1,702,506
6.82%
1,510,000
2,589,180
8.20%
2,492,624
7.64%
2,325,602
6.61%
[ICRA]AAAmfs rating by ICRA$
RatingsRs. Lakhs
% to NAV
Market Value RatingsRs. Lakhs
% to NAV
Market ValueThe Scheme will invest in various money market and fixed income securities with objective of providing liquidity and generating reasonable returns with lower interest rate risk. The average maturity of the portfolio shall be between three months to one year.
The investment objective of the scheme is to generate regular income & capital appreciation by investing in a portfolio of debt & money market instruments with relatively lower interest rate risk. However, there is no assurance or guarantee that the investment objective of the Scheme will be achieved. The Scheme does not assure or guarantee any returns.
Std. Dev (Annualised)Portfolio BetaR SquaredTreynorJenson
0.261.001.000.10
NA
0.551.350.490.10
-0.01
^Risk-free rate based on the FBIL Overnight MIBOR rate of 6% as on Apr 27, 2018 For calculation methodology please refer Pg 48
Debt InstrumentsNon-Convertible Debentures/Bonds/ZCB09.38 % Rural Electrification Corp. Ltd.08.78 % Indiabulls Housing Finance Ltd.09.15 % Tata Capital Financial Services Ltd.08.55 % Reliance Jio Infocomm Ltd.07.50 % HDFC Ltd.06.75 % Rural Electrification Corp. Ltd.08.15 % Piramal Enterprises Ltd.09.20 % Tata Motors Finance Ltd.07.95 % Nabard07.65 % Kotak Mahindra Prime Ltd.08.13 % Piramal Enterprises Ltd.08.50 % Vedanta Ltd.08.62 % Tata Capital Housing Finance Ltd.07.90 % NABARD07.90 % HDFC Ltd.07.85 % HDFC Ltd.08.10 % Orix Leasing & Financial Services India Ltd.07.70 % Housing & Urban Development Corporation Ltd.07.59 % Kotak Mahindra Investments Ltd.07.85 % Shriram Trans. Fin. Co. Ltd.07.39 % Power Grid Corporation Of India Ltd.08.90 % Reliance Jio Infocomm Ltd.08.40 % Reliance Jio Infocomm Ltd.07.85 % Small Indust Devlop Bank Of India07.63 % Tata Capital Financial Services Ltd.07.25 % Reliance Utilities And Power Private Ltd.07.99 % Tata Power Company Ltd.09.76 % LIC Housing Finance Ltd.07.33 % Reliance Utilities And Power Private Ltd.07.40 % Reliance Utilities And Power Private Ltd.09.65 % HDFC Ltd.07.60 % Reliance Utilities And Power Private Ltd.Privately Placed/Unlisted08.40 % Citicorp Finance Ltd.Shriram City Union Finance Ltd. - Frb08.19 % Mahindra Vehicle Manufacturers Ltd.07.54 % Gruh Finance Ltd.07.44 % Daimler Financial Services India Private Ltd.08.05 % Vodafone Mobile Services Ltd.08.00 % ONGC Petro-additions Ltd.08.05 % Daimler Financial Services India Private Ltd.
Maturity Ladder
Composition by Ratings Instrument Wise Composition
NAV Movement
Money Market InstrumentsAxis Bank Ltd. - CDBandhan Bank Ltd. - CDEdelweiss Commodities Services Ltd. - CPHousing & Urban Development Corporation Ltd. - CPPiramal Enterprises Ltd. - CPDewan Housing Fin Corporation Ltd. - CPIndusind Bank Ltd. - CDHDFC Ltd. - CPIl & Fs Financial Ser Ltd. - CPHDFC Bank Ltd. - CDReliance Industries Ltd. - CPIndusind Bank Ltd. - CDICICI Bank Ltd. - CDHdb Financial Services Ltd. - CPICICI Bank Ltd. - CDIl&fs Securities Services Ltd. - CPNABARD - CPRural Electrification Corp. Ltd. - CPIndusind Bank Ltd. - CDIndusind Bank Ltd. - CDYes Bank Ltd. - CDIndusind Bank Ltd. - CDYes Bank Ltd. - CDHDFC Ltd. - CPIndusind Bank Ltd. - CDReliance Industries Ltd. - CPHDFC Ltd. - CPIndusind Bank Ltd. - CDICICI Bank Ltd. - CDICICI Bank Ltd. - CD
186835.8617361.0114907.409806.259757.839736.249691.929555.499373.607443.677099.734966.564963.424962.754958.184957.874933.944911.334875.794870.204866.544865.754727.724725.444722.934675.502437.332350.202340.98995.80994.49
CRISIL- A1+ICRA- A1+
CRISIL- A1+ICRA- A1+ICRA- A1+
CRISIL- A1+CRISIL- A1+CRISIL- A1+
ICRA- A1+CARE- A1+
CRISIL- A1+CRISIL- A1+
ICRA- A1+CRISIL- A1+
ICRA- A1+ICRA- A1+
CRISIL- A1+CRISIL- A1+CRISIL- A1+CRISIL- A1+
ICRA- A1+CRISIL- A1+
ICRA- A1+CRISIL- A1+CRISIL- A1+CRISIL- A1+CRISIL- A1+CRISIL- A1+
ICRA- A1+ICRA- A1+
41.113.823.282.162.152.142.132.102.061.641.561.091.091.091.091.091.091.081.071.071.071.071.041.041.041.030.540.520.520.220.22
CRISIL- AAACRISIL- AAA
CRISIL- AA+CRISIL- AAACRISIL- AAACRISIL- AAA
ICRA- AACRISIL- AA
CRISIL- AAACRISIL- AAA
ICRA- AACRISIL- AA
CRISIL- AA+CRISIL- AAACRISIL- AAACRISIL- AAA
IND AAAICRA- AAA
CRISIL- AAACRISIL- AA+CRISIL- AAACRISIL- AAACRISIL- AAACRISIL- AAA
CRISIL- AA+CRISIL- AAACRISIL- AA-CRISIL- AAACRISIL- AAACRISIL- AAACRISIL- AAACRISIL- AAA
CRISIL- AAACRISIL- AA-ICRA- AAA
CRISIL- AAACRISIL- AAA
CRISIL- AAICRA- AAA(so)
CRISIL- AAA
NIL
Past performance may or may not be sustained in the future. Returns greater than 1 year period are compounded annualized. Dividends are assumed to be reinvested and bonus is adjusted. Load is not taken in to consideration. For SIP returns, monthly investment of equal amounts invested on the 1st day of every month has been considered.For scheme performance refer pages 36-48.*B: Benchmark, AB: Additional BenchmarkSource: MFI Explorer
Modified DurationAverage Maturity
Gross Yield to Maturity (For Debt Component)
i. Including NCA* ii. Excluding NCA**NCA - Net Current Assets
: 6.96 Months8.06 Months
7.61%7.68%
:
::
BENCHMARK
Crisil Liquid Fund Index
MONTHLY AVERAGE AUMRs. 4754.30 (Rs. in Cr.)
EXPENSE RATIO**DirectRegular
0.150.36
**Note: The rates specified are the actual weighted average expenses charged for the month of Apr 2018. The above ratio includes the Service tax on Investment Management Fees. The above ratio excludes, proportionate charge (out of maximum 30 bps on daily average net assets allowed) in respect sales beyond T-30 cities assets, wherever applicable.
Tata Ultra Short Term Fund(An Open-Ended Debt Scheme)
Akhil Mittal (Managing Since 26-Jun-14 and overall experience of 15 years)
(Erstwhile known as Tata Floater Fund; renamed w.e.fMarch 17, 2017)
77.24%
13.84%
2.74%6.18%
A1+ / AAA
AA+ / AA
AA-
Cash & Cash Equivalents
50.51%
19.80%
21.31%
2.20%6.18%NCD - Non Convertible Deb
Commercial Papers
Certificate Of Deposit
Floating Rate Bonds
Cash & Cash Equivalents
4.10%17.71%
27.68%26.85%
17.66%3.49%
0.21%0%
2.30%
0.00% 5.00% 10.00% 15.00% 20.00% 25.00% 30.00%
0 - 1 Mths1 - 3 Mths3 - 6 Mths
6 - 12 Mths1 - 2 Yrs2 - 3 Yrs3 - 5 Yrs
Abv 5 YrsCash & Others
100
106
112
118
124
130
Apr-15 Apr-16 Apr-17 Apr-18
Tata Ultra Short Term Fund - Reg - GrowthCrisil Liquid Fund Index
Please refer to our Tata Mutual Fund website for fundamental changes, wherever applicable

Please refer to our Tata Mutual Fund website for fundamental changes, wherever applicable
VOLATILITY MEASURES^ FUND BENCHMARK
Std. Dev (Annualised)Portfolio BetaR SquaredTreynorJenson
To create a highly liquid portfolio of money market instruments so as to provide reasonable returns and high liquidity to the unitholders.
Amit Somani (Managing Since 16-Oct-13 and overall experience of 16 years)
28www.tatamutualfund.com TATA MUTUAL FUND
As on 30th April 2018
INVESTMENT STYLE
INVESTMENT OBJECTIVE
DATE OF ALLOTMENT
September 01,2004
FUND MANAGER
Crisil Liquid Fund IndexBENCHMARK
NAV
Direct - GrowthDirect - Daily Dividend Reg - GrowthReg - Daily Dividend
::::
2753.98791001.51872742.37491001.5157
FUND SIZE
Rs. 15156.38 (Rs. in Cr.)
MONTHLY AVERAGE AUM
Rs. 14640.84 (Rs. in Cr.)
EXPENSE RATIO**DirectRegular
MINIMUM INVESTMENT/MULTIPLES FOR NEW INVESTMENT
Rs. 5,000/- and in multiples of Re. 1/- thereafter.
ADDITIONAL INVESTMENT/MULTIPLES FOR EXISTING INVESTORS
Rs. 1,000/- and multiples of Re. 1/- thereafter.
LOAD STRUCTURE
Entry Load : Not Applicable
Exit Load : Nil
PORTFOLIO
1442415.1454728.7049907.7646910.1044740.1644570.6142300.4141704.9639770.6535836.3534842.7634730.3832325.0029844.5929468.8527341.6324958.0124880.1424864.6624863.0324837.7124795.5724785.9024781.2824580.1322485.4822378.7119915.0519891.8719887.6519877.8719825.4319807.7119783.1519729.4619670.8818970.6817423.9116525.5814997.1314956.9414954.1314947.7412493.0812427.3912420.5312406.95
9997.76
95.173.613.293.102.952.942.792.752.622.362.302.292.131.971.941.801.651.641.641.641.641.641.641.641.621.481.481.311.311.311.311.311.311.311.301.301.251.151.090.990.990.990.990.820.820.820.820.66
RepoPortfolio TotalNet Current LiabilitiesNet Assets
689.971572105.11
-56467.111515638.00
0.05103.73
-3.73100.00
SIP - If you had invested INR 10000 every month1 Year 3 Year 5 Year 7 Year 10 Year Since Inception
Total Amount Invested (Rs.)Total Value as on Apr 30, 2018 (Rs.)ReturnsTotal Value of B: Crisil Liquid Fund IndexB: Crisil Liquid Fund IndexTotal Value of AB: CRISIL 1 Yr T-Bill IndexAB: CRISIL 1 Yr T-Bill Index(Inception date :01-Sep-2004) (First Installment date : 01-Oct-2004)
120,000124,421
6.94%124,435
6.96%123,934
6.17%
360,000400,587
7.07%400,355
7.03%396,819
6.44%
600,000726,236
7.58%725,342
7.53%715,184
6.96%
840,0001,115,819
7.99%1,109,983
7.84%1,080,738
7.09%
1,200,0001,814,615
8.02%1,790,216
7.76%1,703,596
6.82%
1,630,0002,873,241
7.94%2,795,156
7.57%2,590,443
6.54%
[ICRA]A1+mfs rating by ICRA$
A money market scheme (liquid fund category) that invests 100% of its net assets in Money market securities.
0.220.740.780.140.03
0.261.001.000.10
NA
0.090.14
^Risk-free rate based on the FBIL Overnight MIBOR rate of 6.0% as on Apr 27, 2018 For calculation methodology please refer to Pg 48
Name of the Instrument RatingsRs. Lakhs
% toNAV
Market Value Name of the Instrument RatingsRs. Lakhs
% toNAV
Market Value
Debt InstrumentsMoney Market InstrumentsICICI Bank Ltd. - CDReliance Retail Ltd. - CPNABARD - CPPunjab & Sind Bank - CDTreasury Bill 182 Days (28/06/2018)HDFC Bank Ltd. - CDTreasury Bill 91 Days (05/07/2018)Edelweiss Commodities Services Ltd. - CPTreasury Bill 91 Days (12/07/2018)Vijaya Bank - CDPiramal Enterprises Ltd. - CPIndiabulls Housing Finance Ltd. - CPIndian Oil Corp Ltd. - CPSTCI Finance Ltd. - CPMahindra & Mahindra Financial Services Ltd. - CPKotak Securities Ltd. - CPCentury Textiles & Industries Ltd. - CPNABARD - CPDewan Housing Fin Corporation Ltd. - CPEdelweiss Commodities Services Ltd. - CPPiramal Housing Finance Ltd. - CPNabha Power Ltd. - CPIL&FS Ltd. - CPVedanta Ltd. - CPPiramal Enterprises Ltd. - CPIndia Infoline Finance Ltd. - CPFederal Bank Ltd. - CDPiramal Enterprises Ltd. - CPIL&FS Securities Services Ltd. - CPIDFC Bank Ltd. - CDIL&FS Financial Ser Ltd. - CPIL& FS Financial Ser Ltd. - CPUjjivan Small Finance Bank Ltd. - CDReliance Industries Ltd. - CPHDFC Ltd. - CPTalwandi Sabo Power Ltd. - CPRbl Bank Ltd. - CDTreasury Bill 91 Days (26/07/2018)Indiabulls Housing Finance Ltd. - CPHdb Financial Services Ltd. - CPL&t Housing Finance Ltd. - CPBajaj Finance Ltd. - CPIDFC Bank Ltd. - CDSmartchem Technologies Ltd. - CPAxis Bank Ltd. - CDDewan Housing Fin Corporation Ltd. - CPIIFL Wealth Finance Ltd. - CP
Small Indust Devlop Bank Of India - CPSmall Indust Devlop Bank Of India - CDEXIM - CPCox & Kings Ltd. - CPIndia Infoline Ltd. - CPCox & Kings Ltd. - CPKotak Mahindra Bank - CDSmartchem Technologies Ltd. - CPIndia Infoline Finance Ltd. - CPYes Bank Ltd. - CDNABARD - CPHDFC Credila Financial Services Pvt Ltd. - CPIndusind Bank Ltd. - CDAxis Bank Ltd. - CDVedanta Ltd. - CPAadhar Housing Finance Ltd. - CPYes Bank Ltd. - CDAxis Bank Ltd. - CDHDFC Credila Financial Services Pvt Ltd. - CPIDFC Bank Ltd. - CDFederal Bank Ltd. - CDEdelweiss Commodities Services Ltd. - CPMuthoot Homefin (india) Ltd. - CPCox & Kings Ltd. - CPBharti Hexacom Ltd. - CPJm Financial Asset Reconstruction Company Ltd. - CPIl&fs Securities Services Ltd. - CPSmall Indust Devlop Bank Of India - CPFedbank Financial Services Ltd. - CPReliance Jio Infocomm Ltd. - CPAxis Finance Ltd. - CPYes Bank Ltd. - CDIndia Infoline Ltd. - CPICICI Bank Ltd. - CDICICI Bank Ltd. - CDReliance Industries Ltd. - CPPower Finance Corporation - CPTreasury Bill 91 Days (17/05/2018)Treasury Bill 91 Days (24/05/2018)Treasury Bill 91 Days (07/06/2018)Treasury Bill 91 Days (19/07/2018)Fixed DepositYes Bank Ltd.Rbl Bank Ltd.Bandhan Bank
Composition by Ratings
Maturity Ladder NAV Movement
Instrument Wise Composition
ICRA- A1+CRISIL- A1+CRISIL- A1+
ICRA- A1+SOV
CARE- A1+SOV
CRISIL- A1+SOV
CARE- A1+ICRA- A1+
CRISIL- A1+CRISIL- A1+CRISIL- A1+CRISIL- A1+CRISIL- A1+CRISIL- A1+CRISIL- A1+CRISIL- A1+CRISIL- A1+CRISIL- A1+CRISIL- A1+
ICRA- A1+CRISIL- A1+
ICRA- A1+CRISIL- A1+CRISIL- A1+
ICRA- A1+ICRA- A1+ICRA- A1+ICRA- A1+ICRA- A1+
CRISIL- A1+CRISIL- A1+CRISIL- A1+
CRISIL- A1+(so)ICRA- A1+
SOVCRISIL- A1+CRISIL- A1+
ICRA- A1+CRISIL- A1+
ICRA- A1+ICRA- A1+
CRISIL- A1+CRISIL- A1+CRISIL- A1+
9988.529958.629949.549948.089940.079927.529899.079891.529889.189879.029853.919494.239483.647990.817495.487448.695476.004981.734975.924970.664970.174970.104963.824955.724946.434941.244933.943979.722979.982493.062492.662490.172489.422486.762486.222481.912475.24
498.70459.57307.93
25.75129000.00
20000.0034000.0075000.00
0.660.660.660.660.660.660.650.650.650.650.650.630.630.530.490.490.360.330.330.330.330.330.330.330.330.330.330.260.200.160.160.160.160.160.160.160.160.030.030.020.008.511.322.244.95
Past performance may or may not be sustained in the future. Returns greater than 1 year period are compounded annualized. Dividends are assumed to be reinvested and bonus is adjusted. Load is not taken in to consideration. For SIP returns, monthly investment of equal amounts invested on the 1st day of every month has been considered.For scheme performance refer pages 36-48.*B: Benchmark, AB: Additional BenchmarkSource: MFI Explorer
CRISIL- A1+CRISIL- A1+CRISIL- A1+CARE- A1+
CRISIL- A1+CARE- A1+
CRISIL- A1+ICRA- A1+
CRISIL- A1+ICRA- A1+
CRISIL- A1+CRISIL- A1+CRISIL- A1+CRISIL- A1+CRISIL- A1+CRISIL- A1+
ICRA- A1+CRISIL- A1+CRISIL- A1+
ICRA- A1+CRISIL- A1+CRISIL- A1+
ICRA- A1+CARE- A1+ICRA- A1+
CRISIL- A1+ICRA- A1+
CRISIL- A1+CRISIL- A1+CRISIL- A1+CRISIL- A1+
ICRA- A1+CRISIL- A1+
ICRA- A1+ICRA- A1+
CRISIL- A1+CRISIL- A1+
SOVSOVSOVSOV
Modified DurationAverage Maturity
Gross Yield to Maturity (For Debt Component)
i. Including NCA* ii. Excluding NCA**NCA - Net Current Assets
: 1.31 Months1.31 Months
6.95%6.96%
:
::
**Note: The rates specified are the actual weighted average expenses charged for the month of Apr 2018. The above ratio includes the Service tax on Investment Management Fees. The above ratio excludes Borrowing cost of 0.21 in regular plan and 0.20 in Direct plan and also excludes, proportionate charge (out of maximum 30 bps on daily average net assets allowed) in respect sales beyond T-30 cities
Tata Money Market Fund(An Open-Ended Money Market Scheme )
85.94%
9.23%4.83%
A1+ / AAA
SOV
Cash & Cash Equivalents
9.23%
62.61%
23.33%
4.83%
Treasury Bills
Commercial Papers
Certificate Of Deposit
Cash & Cash Equivalents
6.31%
11.06%
29.26%
43.42%
13.68%
-3.73%
-8.00% 0.00% 8.00% 16.00% 24.00% 32.00% 40.00% 48.00%
1 - 7 Days
Abv 7 - 15 Days
Abv 15 - 30 Days
1 - 2 Mths
2 - 3 Mths
Cash & Others
100
106
112
118
124
130
Apr-15 Apr-16 Apr-17 Apr-18
Tata Money Market Fund - Reg - GrowthCrisil Liquid Fund Index

VOLATILITY MEASURES^ FUND BENCHMARK
29www.tatamutualfund.com TATA MUTUAL FUND
As on 30th April 2018
INVESTMENT STYLE
INVESTMENT OBJECTIVE
DATE OF ALLOTMENT
May 22, 2003
FUND MANAGER
NAVDirect - GrowthDirect - Daily DividendReg - GrowthReg - Daily Dividend
::::
3221.86311114.52003209.56641114.5200
0.100.15
FUND SIZERs. 3908.24 (Rs. in Cr.)
MONTHLY AVERAGE AUMRs. 3833.45 (Rs. in Cr.)
EXPENSE RATIO**DirectRegular
MINIMUM INVESTMENT/MULTIPLES FOR NEW INVESTMENT
Rs. 5,000/- and in multiples of Re. 1/- thereafter.
ADDITIONAL INVESTMENT/MULTIPLES FOR EXISTING INVESTORS
Rs. 1,000/- and multiples of Re. 1/- thereafter.
LOAD STRUCTURE
Entry Load : Not Applicable
Exit Load : Nil
PORTFOLIO
RepoPortfolio TotalNet Current LiabilitiesNet Assets
553.86405877.62-15053.86390823.76
0.14103.85
-3.85100.00
SIP - If you had invested INR 10000 every month
1 Year 3 Year 5 Year 7 Year 10 Year Since Inception
Total Amount Invested (Rs.)
Total Value as on Apr 30, 2018 (Rs.)
Returns
Total Value of B: Crisil Liquid Fund Index
B: Crisil Liquid Fund Index
Total Value of AB: CRISIL 1 Yr T-Bill Index
AB: CRISIL 1 Yr T-Bill Index
(Inception date :22-May-2003) (First Installment date : 01-Jun-2003)
120,000
124,393
6.89%
124,435
6.96%
123,934
6.17%
360,000
400,295
7.02%
400,355
7.03%
396,819
6.44%
600,000
725,213
7.52%
725,342
7.53%
715,184
6.96%
840,000
1,113,064
7.92%
1,109,983
7.84%
1,080,738
7.09%
1,200,000
1,809,647
7.97%
1,790,216
7.76%
1,703,596
6.82%
1,790,000
3,306,985
7.78%
3,215,702
7.44%
2,957,462
6.42%
Past performance may or may not be sustained in the future. Returns greater than 1 year period are compounded annualized. Dividends are assumed to be reinvested and bonus is adjusted. Load is not taken in to consideration. For SIP returns, monthly investment of equal amounts invested on the 1st day of every month has been considered. For scheme performance refer pages 36-48.*B: Benchmark, AB: Additional BenchmarkSource: MFI Explorer
[ICRA]A1+mfs rating by ICRA$
To create a highly liquid portfolio of good quality debt as well as money market instruments so as to provide reasonable returns and high liquidity to the unitholders.
A high liquidity income scheme that aims to generate reasonable returns.
Amit Somani (Managing Since 16-Oct-13 and overall experience of 16 years)
BENCHMARK
Crisil Liquid Fund Index
Std. Dev (Annualised)Portfolio BetaR SquaredTreynorJenson
0.261.001.000.10
NA
0.220.770.810.130.02
^Risk-free rate based on the FBIL Overnight MIBOR rate of 6.0% as on Apr 27, 2018
For calculation methodology please refer to Pg 48
Debt InstrumentsMoney Market InstrumentsNABARD - CPYes Bank Ltd. - CDMahindra & Mahindra FinancialServices Ltd. - CPBajaj Finance Ltd. - CPReliance Jio Infocomm Ltd. - CPIL & FS Financial Ser Ltd. - CPAxis Bank Ltd. - CDIndiabulls Housing Finance Ltd. - CPFederal Bank Ltd. - CDTreasury Bill 91 Days (12/07/2018)L&T Infrastucture Finance CoLtd. - CPEdelweiss Commodities ServicesLtd. - CPVedanta Ltd. - CPL&T Housing Finance Ltd. - CPVijaya Bank - CDIndia Infoline Housing FinanceLtd. - CPIL&FS Securities Services Ltd. - CPICICI Bank Ltd. - CDKotak Mahindra Bank - CDIDFC Bank Ltd. - CDTreasury Bill 91 Days (05/07/2018)IDFC Bank Ltd. - CD
CRISIL- A1+ICRA- A1+
CRISIL- A1+
CRISIL- A1+CRISIL- A1+
ICRA- A1+CRISIL- A1+CRISIL- A1+CRISIL- A1+
SOVICRA- A1+
CRISIL- A1+
CRISIL- A1+ICRA- A1+
CARE- A1+CRISIL- A1+
ICRA- A1+ICRA- A1+
CRISIL- A1+ICRA- A1+
SOVICRA- A1+
405323.7629837.5929637.0622370.42
19930.3219907.4619834.1117436.0417405.7717379.6517290.2514918.69
14910.29
9993.979969.429955.079951.67
9946.169944.909899.079896.259891.679842.8
103.717.637.585.72
5.105.095.074.464.454.454.423.82
3.82
2.562.552.552.55
2.542.542.532.532.532.52
Raymond Ltd. - CPAxis Bank Ltd. - CDThe South Indian Bank Ltd. - CDIIFL Wealth Finance Ltd. - CPPiramal Enterprises Ltd. - CPTalwandi Sabo Power Ltd. - CPPunjab & Sind Bank - CDPiramal Enterprises Ltd. - CPNABARD - CPFedbank Financial Services Ltd. - CPICICI Bank Ltd. - CDShriram Trans. Fin. Co. Ltd. - CPAxis Bank Ltd. - CDSmartchem Technologies Ltd. - CPTreasury Bill 91 Days (26/07/2018)Treasury Bill 91 Days (31/05/2018)Treasury Bill 91 Days (14/06/2018)
7475.167452.326970.614998.884996.774992.294974.774972.972496.962496.822490.742488.402487.392472.882464.06917.8026.31
CRISIL- A1+CRISIL- A1+CRISIL- A1+CRISIL- A1+
ICRA- A1+CRISIL- A1+(so)
ICRA- A1+ICRA- A1+
CRISIL- A1+CRISIL- A1+
ICRA- A1+CRISIL- A1+CRISIL- A1+
ICRA- A1+SOVSOVSOV
1.911.911.781.281.281.281.271.270.640.640.640.640.640.630.630.230.01
Composition by Ratings
Maturity Ladder NAV Movement
Instrument Wise Composition
Name of the Instrument Ratings Market ValueRs. Lakhs
% to NAV
Name of the Instrument Ratings Market ValueRs. Lakhs
% to NAV
Modified DurationAverage Maturity
Gross Yield to Maturity (For Debt Component)
i. Including NCA* ii. Excluding NCA**NCA - Net Current Assets
: 1.27 Months1.27 Months
7.00%7.00%
:
::
**Note: The rates specified are the actual weighted average expenses charged for the month of Apr 2018. The above ratio includes the Service tax on Investment Management Fees. The above ratio excludes Borrowing cost of 0.24 in regular plan and 0.23 in Direct plan and also excludes, proportionate charge (out of maximum 30 bps on daily average net assets allowed) in respect sales beyond T-30 cities
Tata Liquid Fund(An Open-Ended Liquid Scheme)
6.53%1.28%
53.35%25.00%
17.69%
- 3.85%
-8.00% 14.00% 36.00% 58.00%
1 - 7 DaysAbv 7 - 15 Days
Abv 15 - 30 Days1 - 2 Mths2 - 3 Mths
Cash & Others
100
106
112
118
124
130
Apr-15 Apr-16 Apr-17 Apr-18
Tata Liquid Fund - Reg - GrowthCrisil Liquid Fund Index
95.88%
7.83% -3.71%
A1+ / AAA
SOV
Cash & Cash Equivalents
7.83%
60.48%
35.40%
-3.71%
Treasury Bills
Commercial Papers
Certificate Of Deposit
Cash & Cash Equivalents
Please refer to our Tata Mutual Fund website for fundamental changes, wherever applicable
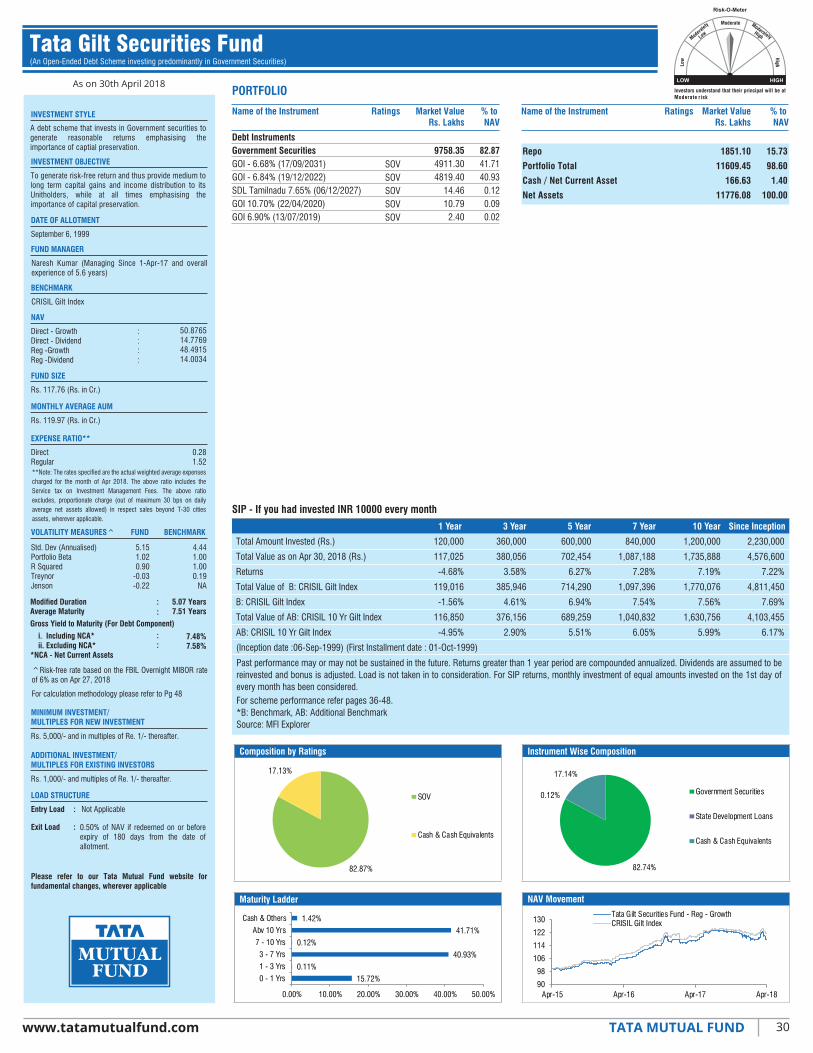
30www.tatamutualfund.com TATA MUTUAL FUND
As on 30th April 2018
INVESTMENT STYLE
INVESTMENT OBJECTIVE
DATE OF ALLOTMENT
September 6, 1999
FUND MANAGER
NAV
Direct - GrowthDirect - DividendReg -GrowthReg -Dividend
::::
FUND SIZE
Rs. 117.76 (Rs. in Cr.)
MONTHLY AVERAGE AUM
Rs. 119.97 (Rs. in Cr.)
EXPENSE RATIO**
DirectRegular
MINIMUM INVESTMENT/ MULTIPLES FOR NEW INVESTMENT
Rs. 5,000/- and in multiples of Re. 1/- thereafter.
ADDITIONAL INVESTMENT/ MULTIPLES FOR EXISTING INVESTORS
Rs. 1,000/- and multiples of Re. 1/- thereafter.
LOAD STRUCTURE
Entry Load : Not Applicable
Exit Load :
PORTFOLIO
Name of the Instrument Ratings Market ValueRs. Lakhs
% to NAV
Debt InstrumentsGovernment SecuritiesGOI - 6.68% (17/09/2031)GOI - 6.84% (19/12/2022)SDL Tamilnadu 7.65% (06/12/2027)GOI 10.70% (22/04/2020)GOI 6.90% (13/07/2019)
9758.354911.304819.40
14.4610.792.40
82.8741.7140.930.120.090.02
SOVSOVSOVSOVSOV
Name of the Instrument RatingsRs. Lakhs
% to NAV
Repo
Portfolio Total
Cash / Net Current Asset
Net Assets
1851.10
11609.45
166.63
11776.08
15.73
98.60
1.40
100.00
SIP - If you had invested INR 10000 every month
1 Year 3 Year 5 Year 7 Year 10 Year Since Inception
Total Amount Invested (Rs.)
Total Value as on Apr 30, 2018 (Rs.)
Returns
Total Value of B: CRISIL Gilt Index
B: CRISIL Gilt Index
Total Value of AB: CRISIL 10 Yr Gilt Index
AB: CRISIL 10 Yr Gilt Index
(Inception date :06-Sep-1999) (First Installment date : 01-Oct-1999)
120,000
117,025
-4.68%
119,016
-1.56%
116,850
-4.95%
360,000
380,056
3.58%
385,946
4.61%
376,156
2.90%
600,000
702,454
6.27%
714,290
6.94%
689,259
5.51%
840,000
1,087,188
7.28%
1,097,396
7.54%
1,040,832
6.05%
1,200,000
1,735,888
7.19%
1,770,076
7.56%
1,630,756
5.99%
2,230,000
4,576,600
7.22%
4,811,450
7.69%
4,103,455
6.17%
A debt scheme that invests in Government securities to generate reasonable returns emphasising the importance of captial preservation.
To generate risk-free return and thus provide medium to long term capital gains and income distribution to its Unitholders, while at all times emphasising the importance of capital preservation.
Naresh Kumar (Managing Since 1-Apr-17 and overall experience of 5.6 years)
BENCHMARK
CRISIL Gilt Index
50.876514.776948.491514.0034
VOLATILITY MEASURES^ FUND BENCHMARK
Std. Dev (Annualised)Portfolio BetaR SquaredTreynorJenson
^Risk-free rate based on the FBIL Overnight MIBOR rate of 6% as on Apr 27, 2018
For calculation methodology please refer to Pg 48
Composition by Ratings
Maturity Ladder
Instrument Wise Composition
NAV Movement
Market Value
Past performance may or may not be sustained in the future. Returns greater than 1 year period are compounded annualized. Dividends are assumed to be reinvested and bonus is adjusted. Load is not taken in to consideration. For SIP returns, monthly investment of equal amounts invested on the 1st day of every month has been considered.
5.151.020.90
-0.03-0.22
For scheme performance refer pages 36-48.*B: Benchmark, AB: Additional BenchmarkSource: MFI Explorer
4.441.001.000.19
NA
0.50% of NAV if redeemed on or before expiry of 180 days from the date of allotment.
Modified DurationAverage Maturity
Gross Yield to Maturity (For Debt Component)
i. Including NCA* ii. Excluding NCA**NCA - Net Current Assets
: 5.07 Years7.51 Years
7.48%7.58%
:
::
0.281.52
**Note: The rates specified are the actual weighted average expenses charged for the month of Apr 2018. The above ratio includes the Service tax on Investment Management Fees. The above ratio excludes, proportionate charge (out of maximum 30 bps on daily average net assets allowed) in respect sales beyond T-30 cities assets, wherever applicable.
Tata Gilt Securities Fund(An Open-Ended Debt Scheme investing predominantly in Government Securities)
82.87%
17.13%
SOV
Cash & Cash Equivalents
82.74%
0.12%
17.14%
Government Securities
State Development Loans
Cash & Cash Equivalents
15.72%
0.11%
40.93%
0.12%
41.71%
1.42%
0.00% 10.00% 20.00% 30.00% 40.00% 50.00%
0 - 1 Yrs
1 - 3 Yrs
3 - 7 Yrs
7 - 10 Yrs
Abv 10 Yrs
Cash & Others
90
98
106
114
122
130
Apr-15 Apr-16 Apr-17 Apr-18
Tata Gilt Securities Fund - Reg - GrowthCRISIL Gilt Index
Please refer to our Tata Mutual Fund website for fundamental changes, wherever applicable

31www.tatamutualfund.com TATA MUTUAL FUND
As on 30th April 2018
INVESTMENT STYLE
INVESTMENT OBJECTIVE
DATE OF ALLOTMENT
June 24, 2010
BENCHMARK
I-Sec Composite Index
FUND MANAGER
NAV
FUND SIZE
Rs. 196.40 (Rs. in Cr.)
MONTHLY AVERAGE AUM
Rs. 198.87 (Rs. in Cr.)
EXPENSE RATIO**DirectRegular
MINIMUM INVESTMENT/ MULTIPLES FOR NEW INVESTMENT
Rs. 5,000/- and in multiples of Re. 1/- thereafter.
ADDITIONAL INVESTMENT/ MULTIPLES FOR EXISTING INVESTORS
Rs. 1,000/- and multiples of Re. 1/- thereafter.
LOAD STRUCTURE
Entry Load : Not ApplicableExit Load :
PORTFOLIO
Name of the Instrument RatingsRs. Lakhs
% toNAV
Debt InstrumentsGovernment SecuritiesGOI - 8.28% (21/09/2027)GOI - 8.35% (14/05/2022)GOI - 8.24% (15/02/2027)GOI - 7.16% (20/05/2023)SDL Maharashtra 8.94% (23/07/2024)GOI - 7.68% (15/12/2023)GOI - 7.35% (22/06/2024)SDL Karnataka 7.27% (28/12/2026)SDL Tamilnadu 8.06% (25/02/2025)SDL Maharashtra 8.44% (26/11/2024)
17831.374087.664076.033916.433410.70516.92497.35488.34428.02258.25151.67
90.7920.8120.7519.9417.372.632.532.492.181.310.77
SOVSOVSOVSOVSOVSOVSOVSOVSOVSOV
Name of the Instrument % to NAV
1389.37
19220.74
419.67
19640.41
Repo
Portfolio Total
Cash / Net Current Asset
Net Assets
7.08
97.87
2.13
100.00
SIP - If you had invested INR 10000 every month
1 Year 3 Year 5 Year 7 Year 10 Year Since Inception
Total Amount Invested (Rs.)
Total Value as on Apr 30, 2018 (Rs.)
Returns
Total Value of B: I-Sec Composite Index
B: I-Sec Composite Index
Total Value of AB: CRISIL 10 Yr Gilt Index
AB: CRISIL 10 Yr Gilt Index
(Inception date :24-Jun-2010) (First Installment date : 01-Jul-2010)
120,000
119,731
-0.43%
120,868
1.38%
116,850
-4.95%
360,000
386,324
4.68%
393,454
5.91%
376,156
2.90%
600,000
715,144
6.99%
730,161
7.82%
689,259
5.51%
840,000
1,115,050
7.99%
1,128,066
8.32%
1,040,832
6.05%
NA
NA
NA
NA
NA
NA
NA
940,000
1,297,689
8.09%
1,312,149
8.37%
1,197,702
6.09%
Past performance may or may not be sustained in the future. Returns greater than 1 year period are compounded annualized. Dividends are assumed to be reinvested and bonus is adjusted. Load is not taken in to consideration. For SIP returns, monthly investment of equal amounts invested on the 1st day of every month has been considered. For scheme performance refer pages 36-48. *B: Benchmark, AB: Additional BenchmarkSource: MFI Explorer
A debt scheme that invests in Government securities to generate returns. Under normal circumstances the average portfolio maturity shall not exceed 15 years.
To provide reasonable returns and high liquidity to the Unitholders by investing predominantly in Government Securities having residual maturity upto 15 years. However, there can be no assurance that the investment objective of the scheme will be realized.
Naresh Kumar (Managing Since 1-Apr-17 and overall experience of 5.6 years)
19.394918.1517#
18.501617.5590
VOLATILITY MEASURES^ FUND BENCHMARK
Std. Dev (Annualised)Portfolio BetaR SquaredTreynorJenson
^Risk-free rate based on the FBIL Overnight MIBOR rate of 6% as on Apr 27, 2018 For calculation methodology please refer to Pg 48
Composition by Ratings
Maturity Ladder
Instrument Wise Composition
NAV Movement
Direct - GrowthDirect - DividendReg - GrowthReg - Dividend
::::
#Direct Plans are available for subscription under all open ended schemes of Tata Mutual Fund w.e.f 1st January 2013. Separate NAV will be calculated & published for respective option(s) of the Direct Plan upon initial subscription.
Market Value RatingsRs. Lakhs
Market Value
3.861.060.970.03
-0.23
3.711.001.000.24
NA
0.371.64
NIL
Modified DurationAverage Maturity
Gross Yield to Maturity (For Debt Component)
i. Including NCA* ii. Excluding NCA**NCA - Net Current Assets
: 4.53 Years6.23 Years
7.59%7.76%
:
::
**Note: The rates specified are the actual weighted average expenses charged for the month of Apr 2018. The above ratio includes the Service tax on Investment Management Fees. The above ratio excludes, proportionate charge (out of maximum 30 bps on daily average net assets allowed) in respect sales beyond T-30 cities assets, wherever applicable.
Tata Gilt Mid Term Fund(An Open-Ended Debt Scheme investing predominantly in Government Securities)
90.79%
9.21%
SOV
Cash & Cash Equivalents
83.89%
6.90%
9.21%Government Securities
State Development Loans
Cash & Cash Equivalents
7.07%
0.00%
47.86%
42.93%
0.00%
2.14%
0.00% 10.00% 20.00% 30.00% 40.00% 50.00%
0 - 1 Yrs
1 - 3 Yrs
3 - 7 Yrs
7 - 10 Yrs
Abv 10 Yrs
Cash & Others
Please refer to our Tata Mutual Fund website for fundamental changes, wherever applicable
90
98
106
114
122
130
Apr-15 Apr-16 Apr-17 Apr-18
Tata Gilt Mid Term Fund - Reg - GrowthI-Sec Composite Index

Please refer to our Tata Mutual Fund website for fundamental changes, wherever applicable
VOLATILITY MEASURES^ FUND BENCHMARK
Std. Dev (Annualised)Sharpe RatioPortfolio BetaR SquaredTreynorJenson
15.990.220.960.691.030.55
13.760.111.001.000.45
NA
32www.tatamutualfund.com TATA MUTUAL FUND
As on 30th April 2018
INVESTMENT STYLE
INVESTMENT OBJECTIVE
DATE OF ALLOTMENT
November 1, 2011
FUND MANAGER
NAV
Direct - GrowthReg - Growth
: 32.673630.0529:
FUND SIZE
Rs. 451.51 (Rs. in Cr.)
TURN OVER
Portfolio Turnover (Total)Portfolio Turnover (Equity component only)
47.01%47.01%
MINIMUM INVESTMENT/MULTIPLES FOR NEW INVESTMENT
Rs. 5,000/- and in multiples of Re. 1/- thereafter.
ADDITIONAL INVESTMENT/MULTIPLES FOR EXISTING INVESTORS
Rs. 1,000/- and multiples of Re. 1/- thereafter.
LOAD STRUCTURE
Entry Load : Not Applicable
Exit Load :
PORTFOLIO
Company name
43979.10
1610.16970.26885.87
856.44
2299.022168.231919.62
661.47654.63464.42
1813.78836.68584.42
898.76656.16
1252.511019.60
977.73959.45914.71907.68568.08
641.33
866.08
914.95
97.40
3.572.151.96
1.90
5.094.804.25
1.471.451.03
4.021.851.29
1.991.45
2.772.262.172.132.032.011.26
1.42
1.92
2.03
18250590000
30050
53800
635000111500158600
217006000011300
129500130000370000
112100120000
8300040000
23260010200
325000305000
80000
197333
124000
95000
96500221838
4700016150
204500139000
102200151500
680000
1950001495000
47000
92000109500180000
83800
51514
1818.691143.69
895.84885.43873.11628.07
898.90889.08
1412.02
1178.87891.02701.78
1137.81629.30465.84
930.64
672.59
4.032.531.981.961.931.39
1.991.97
3.13
2.611.971.55
2.521.391.03
2.06
1.49
Company name
A Fund that aims to provide an investment tool for retirement planning to suit the risk profile of the investor.
To provide a financial planning tool for long term financial security for investors based on their retirement planning goals. However, there can be no assurance that the investment objective of the fund will be realized, as actual market movements may be at variance with anticipated trends.
^Risk-free rate based on the FBIL Overnight MIBOR rate of 6% as on Apr 27, 2018
**Note: The rates specified are the actual weighted average expenses charged for the month of Apr 2018. The above ratio includes the Service tax on Investment Management Fees. The above ratio excludes, proportionate charge (out of maximum 30 bps on daily average net assets allowed) in respect sales beyond T-30 cities assets, wherever applicable.
For calculation methodology please refer to Pg 48
(A) If redeemed / switched-out on or after attainment of retirement age i.e. 60 years of age: Nil. (B) In case of Auto switch-out of units on occurrence of “Auto-switch trigger event” : NIL (C) If redeemed before 60 years of age: 1%.
No. of Shares Rs. Lakhs
% of Assets
Market ValueNo. of Shares Rs. Lakhs
% of Assets
Market Value
Equity & Equity Related TotalAutoMaruti Suzuki India Ltd.Ashok Leyland Ltd.Bajaj Auto Ltd.Auto AncillariesCeat Ltd.BanksYes Bank Ltd.HDFC Bank Ltd.Kotak Mahindra Bank Ltd.CementDalmia Bharat Ltd.Grasim Industries Ltd.Ultratech Cement Ltd.Construction ProjectLarsen & Toubro Ltd.Voltas Ltd.Engineers India Ltd.Consumer DurablesBata India Ltd.Havells India Ltd.Consumer Non DurablesHindustan Unilever Ltd.Jubilant Foodworks Ltd.Radico Khaitan Ltd.Nestle India Ltd.ITC Ltd.Tata Global Beverages Ltd.Heritage Foods Ltd.GasGail ( India ) Ltd.Industrial ProductsFinolex Cables Ltd.Petroleum ProductsReliance Industries Ltd.
FinanceHousing Development Finance Ltd.Max Financial Services Ltd.Bajaj Finance Ltd.Bajaj Finserv Ltd.ICICI Prudential Life Insurance Company Ltd.Muthoot Finance Ltd.Media & EntertainmentSun Tv Network Ltd.Zee Entertainment Enterprises Ltd.PowerPower Grid Corporation Of India Ltd.RetailingFuture Retail Ltd.Future Consumer Ltd.Avenue Supermarts Ltd.SoftwareTata Elxsi Ltd.Majesco Ltd.Kpit Technologies Ltd.Textile ProductsRaymond Ltd.TransportationContainer Corporation Of India Ltd.
1624.38899.37
44878.47272.51
45150.98
3.602.01
99.410.59
100.00
Other Equities^RepoPortfolio TotalCash / Net Current AssetNet Assets
^ Exposure less than 1% has been clubbed under Other Equities
Market Capitalisation wise Exposure
Top 10 Holdings Equity Industry Allocation
NAV Movement
Issuer NameYes Bank Ltd.HDFC Bank Ltd.Kotak Mahindra BankHDFC Ltd.Larsen & Toubro Ltd.Maruti Suzuki India Ltd.Power Grid Corporation Of India Ltd.Hindustan Unilever Ltd.Future Retail Ltd.Max Financial Services Ltd.Total
% to NAV5.094.804.254.034.023.573.132.772.612.5336.8
Large CapMid CapSmall Cap
1 Year 3 Year 5 Year 7 Year 10 Year Since Inception
SIP - If you had invested INR 10000 every month
Total Amount Invested (Rs.)
Total Value as on Apr 30, 2018 (Rs.)
Returns
Total Value of B: S&P BSE Sensex TRI
B: S&P BSE Sensex TRI
(Inception date :01-Nov-2011) (First Installment date : 01-Dec-2011)
7,70,000
14,89,160
20.36%
12,03,589
13.76%
1,20,000
1,31,497
18.38%
1,30,133
16.15%
3,60,000
4,97,600
22.25%
4,51,311
15.29%
6,00,000
10,23,223
21.52%
8,38,606
13.38%
NA
NA
NA
NA
NA
NA
NA
NA
NA
NA
67.92%30.65%1.43%
Market Capitalisation includes only domestic listed Equity exposure in BSE. Large Cap Companies are top 125 stocks by market capitalisation on S&P BSE 500 Index and Mid Cap stocks are those between 126 to 499 stocks by market capitalisation and 500 & above being classified as Small cap. For calculation purpose, the previous month market capitalisation data have been used. All the figures has been rebased to 100 (Based on internal calculation).
Sonam Udasi (Managing Since 1-Apr-16 and overall experience of 20 years) (Equity) & Murthy Nagarajan (Managing since 1-Apr-17 and overall experience of 21 years) (Debt)
BENCHMARK
S&P BSE Sensex TRI
MONTHLY AVERAGE AUM
Rs. 429.81 (Rs. in Cr.)
EXPENSE RATIO**
DirectRegular
1.722.74
Tata Retirement Savings Fund - Progressive(An open ended retirement solution oriented scheme having a lock-in of 5 years or till retirement age (whichever is earlier)
Past performance may or may not be sustained in the future. Returns greater than 1 year period are compounded annualized. Dividends are assumed to be reinvested and bonus is adjusted. Load is not taken in to consideration. For SIP returns, monthly investment of equal amounts invested on the 1st day of every month has been considered For scheme performance refer pages 36-48.*B: Benchmark Source: MFI Explorer
14.62%14.15%
13.83%7.68%
7.16%6.14%
4.95%3.96%3.94%
3.44%3.13%
2.87%2.35%
2.06%2.03%1.90%
1.49%0.97%0.74%
0.00% 5.00% 10.00% 15.00% 20.00%
Consumer Non DurablesBanks
FinanceAuto
Construction ProjectRetailingSoftware
Media & EntertainmentCement
Consumer DurablesPower
Industrial ProductsGas
Textile ProductsPetroleum Products
Auto AncillariesTransportation
PharmaceuticalsConstruction
80
98
116
134
152
170
Apr-15 Apr-16 Apr-17 Apr-18
Tata Retirement Savings Fund - Progressive Plan - RegS&P BSE Sensex TRI

Please refer to our Tata Mutual Fund website for fundamental changes, wherever applicable
1 Year 3 Year 5 Year 7 Year 10 Year Since InceptionVOLATILITY MEASURES^ FUND BENCHMARK
Std. Dev (Annualised)Sharpe RatioPortfolio BetaR SquaredTreynorJenson
12.230.201.080.860.660.06
10.390.201.001.000.61
NA
33www.tatamutualfund.com TATA MUTUAL FUND
As on 30th April 2018
INVESTMENT STYLE
INVESTMENT OBJECTIVE
DATE OF ALLOTMENTNovember 1, 2011
FUND MANAGER
NAV
Direct - GrowthReg - Growth
: 32.733930.4895:
FUND SIZE
Rs.659.89 (Rs. in Cr.)
TURN OVER
Portfolio Turnover (Total)Portfolio Turnover (Equity component only)
30.99%30.99%
MINIMUM INVESTMENT/MULTIPLES FOR NEW INVESTMENT
Rs. 5,000/- and in multiples of Re. 1/- thereafter.
ADDITIONAL INVESTMENT/MULTIPLES FOR EXISTING INVESTORS
Rs. 1,000/- and multiples of Re. 1/- thereafter.
LOAD STRUCTURE
Entry Load : Not Applicable
Exit Load :
PORTFOLIO
Company name
52960.11
1963.961208.711126.14
1025.18
2822.182625.212300.27
847.57810.65
2254.97981.49699.88
1128.06820.20
1576.961194.611174.881172.541169.571125.80
685.52
2252.161411.571134.101085.541084.45
708.05
80.26
2.981.831.71
1.55
4.283.983.49
1.281.23
3.421.491.06
1.711.24
2.391.811.781.781.771.711.04
3.412.141.721.651.641.07
2226073500038200
64400
779500135000190050
2780574300
161000152500443100
140700150000
10450012700
27950046000
39300040000096538
1195002737995950019800
254000156700
Company name No. of Shares
Market ValueRs. Lakhs
% of Assets
RepoPortfolio TotalCash / Net Current AssetNet Assets
8099.5965262.29
726.9365989.22
12.4199.030.97
100.00
SIP - If you had invested INR 10000 every month
Total Amount Invested (Rs.)Total Value as on Apr 30, 2018 (Rs.)ReturnsTotal Value of B: CRISIL Hybrid 25 75 Aggressive IndexB: CRISIL Hybrid 25 75 Aggressive IndexTotal Value of AB: S&P BSE Sensex TRIAB: S&P BSE Sensex TRI(Inception date :01-Nov-2011) (First Installment date : 01-Dec-2011)
A Fund that aims to provide an investment tool for retirement planning to suit the risk profile of the investor.
To provide a financial planning tool for long term financial security for investors based on their retirement planning goals. However, there can be no assurance that the investment objective of the fund will be realized, as actual market movements may be at variance with anticipated trends.
^Risk-free rate based on the FBIL Overnight MIBOR rate of 6% as on Apr 27, 2018
**Note: The rates specified are the actual weighted average expenses charged for the month of Apr 2018. The above ratio includes the Service tax on Investment Management Fees .The above ratio includes, proportionate charge (out of maximum 30 bps on daily average net assets allowed) in respect sales beyond T-30 cities assets, wherever applicable.
For calculation methodology please refer to Pg 48
(A) If redeemed / switched-out on or after attainment of retirement age i.e. 60 years of age: Nil. (B) In case of Auto switch-out of units on occurrence of “Auto-switch trigger event” : NIL (C) If redeemed before 60 years of age: 1%.
Equity & Equity Related TotalAutoMaruti Suzuki India Ltd.Ashok Leyland Ltd.Bajaj Auto Ltd.Auto AncillariesCeat Ltd.BanksYes Bank Ltd.HDFC Bank Ltd.Kotak Mahindra Bank Ltd.CementDalmia Bharat Ltd.Grasim Industries Ltd.Construction ProjectLarsen & Toubro Ltd.Voltas Ltd.Engineers India Ltd.Consumer DurablesBata India Ltd.Havells India Ltd.Consumer Non DurablesHindustan Unilever Ltd.Nestle India Ltd.Radico Khaitan Ltd.Jubilant Foodworks Ltd.Tata Global Beverages Ltd.ITC Ltd.Heritage Foods Ltd.FinanceHousing Development Finance Ltd.Max Financial Services Ltd.Bajaj Finance Ltd.Bajaj Finserv Ltd.ICICI Prudential Life Insurance Company Ltd.Muthoot Finance Ltd.
Market Capitalisation wise Exposure
Top 10 Holdings Equity Industry Allocation
NAV Movement
Issuer NameYes Bank Ltd.HDFC Bank Ltd.Kotak Mahindra BankLarsen & Toubro Ltd.HDFC Ltd.Maruti Suzuki India Ltd.Power Grid Corporation Of India Ltd.Hindustan Unilever Ltd.Tata Elxsi India Ltd.Max Financial Services Ltd.Total
% to NAV4.283.983.493.423.412.982.562.392.142.14
30.79
Large CapMid CapSmall Cap
GasGail ( India ) Ltd.Industrial ProductsFinolex Cables Ltd.Media & EntertainmentSun Tv Network Ltd.Zee Entertainment Enterprises Ltd.Petroleum ProductsReliance Industries Ltd.PowerPower Grid Corporation Of India Ltd.RetailingFuture Retail Ltd.Future Consumer Ltd.SoftwareTata Elxsi Ltd.Majesco Ltd.Textile ProductsRaymond Ltd.TransportationContainer Corporation Of India Ltd.Other Equities^
208000
146156
125650186550
115000
815000
2315001885000
114200133500
79750
60986
676.00
1020.83
1105.151094.77
1107.57
1692.35
1399.531123.46
1412.37767.22
885.66
796.263488.72
1.02
1.55
1.671.66
1.68
2.56
2.121.70
2.141.16
1.34
1.215.29
Name of the Instrument Ratings Market ValueRs. Lakhs
% toNAV
Debt InstrumentsGovernment SecuritiesGOI - 8.40% (28/07/2024)Non-Convertible Debentures/Bonds/ZCBHDFC Ltd. - ZCB06.99 % Rural Electrification Corp. Ltd.
SOV
CRISIL- AAACRISIL- AAA
512.25512.25
3690.342716.66973.68
0.780.785.594.121.48
No. of Shares
Market ValueRs. Lakhs
% of Assets
1,20,0001,29,592
15.27%1,26,982
11.05%1,30,133
16.15%
3,60,0004,74,070
18.77%4,44,039
14.15%4,51,311
15.29%
6,00,0009,95,449
20.39%8,50,901
13.97%8,38,606
13.38%
NANANANANANANA
NANANANANANANA
7,70,00014,68,984
19.93%12,15,941
14.07%12,03,589
13.76%
Past performance may or may not be sustained in the future. Returns greater than 1 year period are compounded annualized. Dividends are assumed to be reinvested and bonus is adjusted. Load is not taken in to consideration. For SIP returns, monthly investment of equal amounts invested on the 1st day of every month has been considered.For scheme performance refer pages 36-48. *B: Benchmark, AB: Additional Benchmark Source: MFI Explorer
^ Exposure less than 1% has been clubbed under Other Equities
68.05%30.50%1.45%
"Market Capitalisation includes only domestic listed Equity exposure in BSE. Large Cap Companies are top 125 stocks by market capitalisation on S&P BSE 500 Index and Mid Cap stocks are those between 126 to 499 stocks by market capitalisation and 500 & above being classified as Small cap. For calculation purpose, the previous month market capitalisation data have been used. All the figures has been rebased to 100 (Based on internal calculation).
Sonam Udasi (Managing Since 1-Apr-16 and overall experience of 20 years) (Equity) & Murthy Nagarajan (Managing since 1-Apr-17 and overall experience of 21 years) (Debt)
BENCHMARK
CRISIL Hybrid 25+75 Aggressive Index
MONTHLY AVERAGE AUM
Rs.618.40 (Rs. in Cr.)
EXPENSE RATIO**
DirectRegular
1.522.61
Tata Retirement Savings Fund - Moderate(An open ended retirement solution oriented scheme having a lock-in of 5 years or till retirement age (whichever is earlier)
12.27%11.74%11.63%
6.51%5.97%
4.59%4.20%
3.37%3.33%
2.95%2.56%
2.39%1.78%1.68%1.55%
1.34%1.21%
0.61%0.55%
0.00% 5.00% 10.00% 15.00%
Consumer Non DurablesBanks
FinanceAuto
Construction ProjectRetailingSoftwareCement
Media & EntertainmentConsumer Durables
PowerIndustrial Products
GasPetroleum Products
Auto AncillariesTextile Products
TransportationConstruction
Pharmaceuticals
80
96
112
128
144
160
Apr-15 Apr-16 Apr-17 Apr-18
Tata Retirement Savings Fund - Moderate Plan - RegCRISIL Hybrid 25 75 Aggressive Index
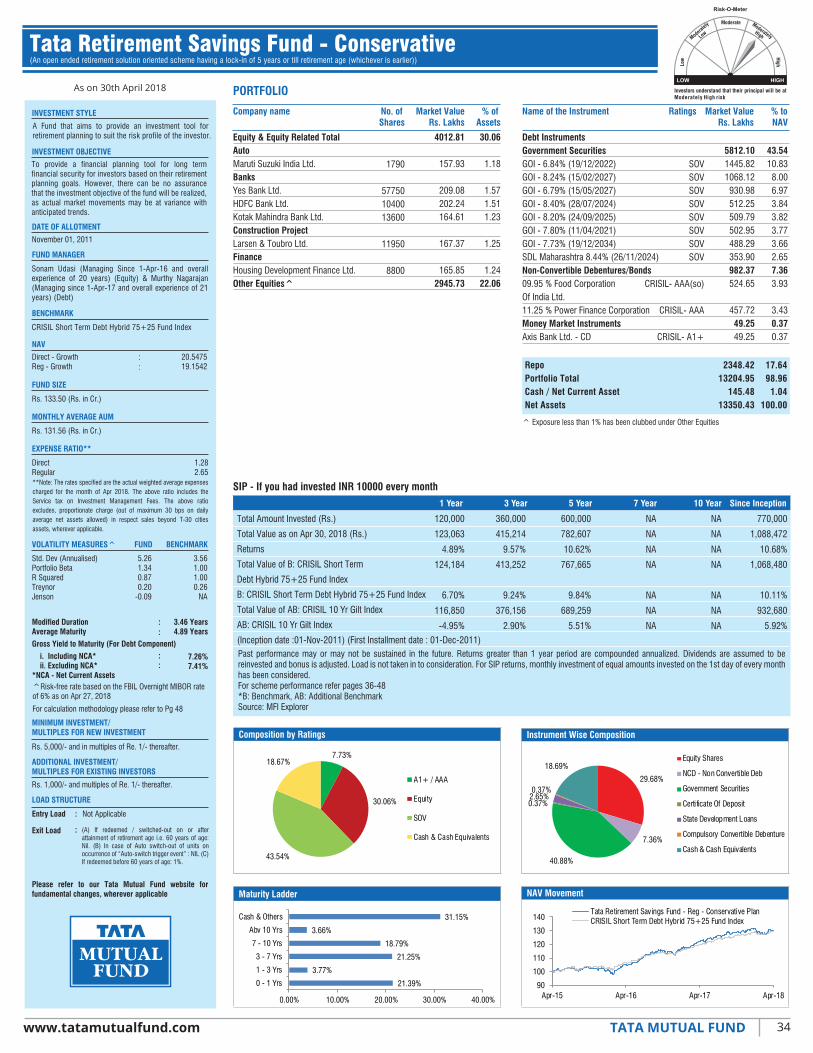
Please refer to our Tata Mutual Fund website for fundamental changes, wherever applicable
1 Year 3 Year 5 Year 7 Year 10 Year Since Inception
VOLATILITY MEASURES^ FUND BENCHMARK
Std. Dev (Annualised)Portfolio BetaR SquaredTreynorJenson
5.261.340.870.20
-0.09
3.561.001.000.26
NA
1.282.65
34www.tatamutualfund.com TATA MUTUAL FUND
As on 30th April 2018
INVESTMENT STYLE
INVESTMENT OBJECTIVE
DATE OF ALLOTMENT
November 01, 2011
FUND MANAGER
NAV
Direct - GrowthReg - Growth
: 20.547519.1542:
FUND SIZE
Rs. 133.50 (Rs. in Cr.)
MONTHLY AVERAGE AUM
Rs. 131.56 (Rs. in Cr.)
EXPENSE RATIO**
DirectRegular
MINIMUM INVESTMENT/MULTIPLES FOR NEW INVESTMENT
Rs. 5,000/- and in multiples of Re. 1/- thereafter.
ADDITIONAL INVESTMENT/MULTIPLES FOR EXISTING INVESTORS
Rs. 1,000/- and multiples of Re. 1/- thereafter.
LOAD STRUCTURE
Entry Load Not Applicable
Exit Load
PORTFOLIO
Company name
4012.81
157.93
209.08202.24164.61
167.37
165.852945.73
30.06
1.18
1.571.511.23
1.25
1.2422.06
Name of the Instrument
RepoPortfolio TotalCash / Net Current AssetNet Assets
2348.4213204.95
145.4813350.43
17.6498.96
1.04100.00
SIP - If you had invested INR 10000 every month
Total Amount Invested (Rs.)
Total Value as on Apr 30, 2018 (Rs.)
Returns
Total Value of B: CRISIL Short Term
Debt Hybrid 75+25 Fund Index
B: CRISIL Short Term Debt Hybrid 75+25 Fund Index
Total Value of AB: CRISIL 10 Yr Gilt Index
AB: CRISIL 10 Yr Gilt Index
(Inception date :01-Nov-2011) (First Installment date : 01-Dec-2011)
770,000
1,088,472
10.68%
1,068,480
10.11%
932,680
5.92%
A Fund that aims to provide an investment tool for retirement planning to suit the risk profile of the investor.
To provide a financial planning tool for long term financial security for investors based on their retirement planning goals. However, there can be no assurance that the investment objective of the fund will be realized, as actual market movements may be at variance with anticipated trends.
^Risk-free rate based on the FBIL Overnight MIBOR rate of 6% as on Apr 27, 2018
For calculation methodology please refer to Pg 48
No. of Shares Rs. Lakhs
% of Assets
Market Value RatingsRs. Lakhs
% toNAV
Market Value
Equity & Equity Related TotalAutoMaruti Suzuki India Ltd.BanksYes Bank Ltd.HDFC Bank Ltd.Kotak Mahindra Bank Ltd.Construction ProjectLarsen & Toubro Ltd.FinanceHousing Development Finance Ltd.Other Equities^
1790
577501040013600
11950
8800
NAV Movement
Instrument Wise Composition
^ Exposure less than 1% has been clubbed under Other Equities
Past performance may or may not be sustained in the future. Returns greater than 1 year period are compounded annualized. Dividends are assumed to be reinvested and bonus is adjusted. Load is not taken in to consideration. For SIP returns, monthly investment of equal amounts invested on the 1st day of every month has been considered. For scheme performance refer pages 36-48*B: Benchmark, AB: Additional BenchmarkSource: MFI Explorer
120,000
123,063
4.89%
124,184
6.70%
116,850
-4.95%
360,000
415,214
9.57%
413,252
9.24%
376,156
2.90%
600,000
782,607
10.62%
767,665
9.84%
689,259
5.51%
NA
NA
NA
NA
NA
NA
NA
NA
NA
NA
NA
NA
NA
NA
Composition by Ratings
Maturity Ladder
5812.101445.821068.12
930.98512.25509.79502.95488.29353.90982.37524.65
457.7249.2549.25
43.5410.83
8.006.973.843.823.773.662.657.363.93
3.430.370.37
Debt InstrumentsGovernment SecuritiesGOI - 6.84% (19/12/2022)GOI - 8.24% (15/02/2027)GOI - 6.79% (15/05/2027)GOI - 8.40% (28/07/2024)GOI - 8.20% (24/09/2025)GOI - 7.80% (11/04/2021)GOI - 7.73% (19/12/2034)SDL Maharashtra 8.44% (26/11/2024)Non-Convertible Debentures/Bonds09.95 % Food CorporationOf India Ltd.11.25 % Power Finance CorporationMoney Market InstrumentsAxis Bank Ltd. - CD
SOVSOVSOVSOVSOVSOVSOVSOV
CRISIL- AAA(so)
CRISIL- AAA
CRISIL- A1+
(A) If redeemed / switched-out on or after attainment of retirement age i.e. 60 years of age: Nil. (B) In case of Auto switch-out of units on occurrence of “Auto-switch trigger event” : NIL (C) If redeemed before 60 years of age: 1%.
:
:
Sonam Udasi (Managing Since 1-Apr-16 and overall experience of 20 years) (Equity) & Murthy Nagarajan (Managing since 1-Apr-17 and overall experience of 21 years) (Debt)
BENCHMARK
CRISIL Short Term Debt Hybrid 75+25 Fund Index
**Note: The rates specified are the actual weighted average expenses charged for the month of Apr 2018. The above ratio includes the Service tax on Investment Management Fees. The above ratio excludes, proportionate charge (out of maximum 30 bps on daily average net assets allowed) in respect sales beyond T-30 cities assets, wherever applicable.
Tata Retirement Savings Fund - Conservative(An open ended retirement solution oriented scheme having a lock-in of 5 years or till retirement age (whichever is earlier))
Modified DurationAverage Maturity
Gross Yield to Maturity (For Debt Component)
i. Including NCA* ii. Excluding NCA**NCA - Net Current Assets
: 3.46 Years4.89 Years
7.26%7.41%
:
::
7.73%
30.06%
43.54%
18.67%
A1+ / AAA
Equity
SOV
Cash & Cash Equivalents
29.68%
7.36%
40.88%
0.37%2.65%0.37%
18.69%Equity Shares
NCD - Non Convertible Deb
Government Securities
Certificate Of Deposit
State Development Loans
Compulsory Convertible Debenture
Cash & Cash Equivalents
21.39%
3.77%
21.25%
18.79%
3.66%
31.15%
0.00% 10.00% 20.00% 30.00% 40.00%
0 - 1 Yrs
1 - 3 Yrs
3 - 7 Yrs
7 - 10 Yrs
Abv 10 Yrs
Cash & Others
90
100
110
120
130
140
Apr-15 Apr-16 Apr-17 Apr-18
Tata Retirement Savings Fund - Reg - Conservative PlanCRISIL Short Term Debt Hybrid 75+25 Fund Index

35www.tatamutualfund.com TATA MUTUAL FUND
As on 30th April 2018
INVESTMENT STYLE
INVESTMENT OBJECTIVE
DATE OF ALLOTMENT
October 14, 1995
FUND MANAGER
NAVDirectReg
: 28.471826.9331:
FUND SIZE
Rs. 222.41 (Rs. in Cr.)
TURN OVER
Portfolio Turnover (Total)Portfolio Turnover (Equity component only)
30.66%13.66%
MINIMUM INVESTMENT/ MUL TIPLES FOR NEW INVESTMENT
Rs. 500/- and in multiples of Rs. 500/- thereafter.
ADDITIONAL INVESTMENT/ MUL TIPLES FOR EXISTING INVESTORSRs. 500/- and in multiples of Rs. 500/- thereafter.LOAD STRUCTURE
Entry Load : Not Applicable
Exit Load :
PORTFOLIO
11287.64
714.65448.10339.77230.23
397.98
1149.51423.92
290.63244.57
450.32270.19259.05
415.70340.26
375.55
334.62
597.17
322.77
249.18
471.55447.00
610.80
50.75
3.212.011.531.04
1.79
5.171.91
1.311.10
2.021.211.16
1.871.53
1.69
1.50
2.69
1.45
1.12
2.122.01
2.75
8100152009100
140000
25000
31750021800
18400038000
160000106002725
9200066000
115554
90000
85500
55000
120000
78000750000
55000
32500 424.341479.78
1.916.65
SIP - If you had invested INR 10000 every month1 Year 3 Year 5 Year 7 Year 10 Year Since Inception
Total Amount Invested (Rs.)Total Value as on Apr 30, 2018 (Rs.)ReturnsTotal Value of B: CRISIL Hybrid 35+65 - Aggressive IndexB: CRISIL Hybrid 35+65 - Aggressive IndexTotal Value of AB: CRISIL 10 Yr Gilt IndexAB: CRISIL 10 Yr Gilt Index(Inception date :14-Oct-1995) (First Installment date : 01-Feb-1996)
120,000125,026
7.92%126,128
9.68%116,960-4.70%
360,000424,56511.04%
437,27813.08%
376,4852.94%
600,000810,74512.01%
834,54613.18%
689,7445.52%
840,0001,292,113
12.10%1,336,932
13.06%1,041,363
6.05%
1,200,0002,216,796
11.81%2,271,952
12.27%1,631,915
5.99%
2,670,00013,853,324
12.93%12,647,104
12.27%5,472,095
5.98%
For scheme performance refer pages 36-48.*B: BenchmarkSource: MFI Explorer
A balanced scheme that aims to invest its debt portion in quality debt papers / government securities of long term maturity. While equity portfolio invests in high quality companies to create long term wealth for the investor.
To provide long term capital growth along with steady capital appreciation to its unitholders, while at all times emphasising the importance of capital preservation.
^Risk-free rate based on the FBIL Overnight MIBOR rate of 6% as on Apr 27, 2018 For calculation methodology please refer to Pg 48
Compulsory Lock-in Option: 5 years or till the child attains age of majority (whichever is earlier). If redeemed before child attains 18 years of age, Exit load is 1% (w.e.f. May 3, 2018)
Top 10 Holdings Equity Industry Allocation
NAV Movement
Issuer NameYes Bank Ltd.Maruti Suzuki India Ltd.Raymond Ltd.Finolex Cables Ltd.Future Retail Ltd.ITC Ltd.Bajaj Auto Ltd.Future Consumer Ltd.HDFC Bank Ltd.Container Corporation Of India Ltd.Total
% to NAV5.173.212.752.682.122.022.012.011.911.91
25.79
Equity & Equity Related TotalAutoMaruti Suzuki India Ltd.Bajaj Auto Ltd.Hero Motocorp Ltd.Ashok Leyland Ltd.Auto AncillariesCeat Ltd.BanksYes Bank Ltd.HDFC Bank Ltd.Construction ProjectEngineers India Ltd.Voltas Ltd.Consumer Non DurablesITC Ltd.Jubilant Foodworks Ltd.P & G Hygiene & Health Care Ltd.FinanceMuthoot Finance Ltd.Max Financial Services Ltd.GasGail ( India ) Ltd.Hotels, Resorts And Other Recreational ActivitiesWonderla Holidays Ltd.Industrial ProductsFinolex Cables Ltd.Media & EntertainmentZee Entertainment Enterprises Ltd.PowerPower Grid Corporation Of India Ltd.RetailingFuture Retail Ltd.Future Consumer Ltd.Textile ProductsRaymond Ltd.
TransportationContainer Corporation Of India Ltd.Other Equities^
Past performance may or may not be sustained in the future. Returns greater than 1 year period are compounded annualized. Dividends are assumed to be reinvested and bonus is adjusted. Load is not taken in to consideration. For SIP returns, monthly investment of equal amounts invested on the 1st day of every month has been considered.
SOVSOVSOVSOVSOVSOVSOV
CRISIL- AAACRISIL- AAACRISIL- AAACRISIL- AAA
CRISIL- AAACRISIL- AAA
ICRA- AAA
CRISIL- AAA
CRISIL- AAA
4334.741005.91
915.53732.50510.96509.79507.36152.69
3950.251027.45
608.96509.31489.53
483.78465.25
265.66
100.31972.06972.06
19.494.524.123.292.302.292.280.69
17.764.622.742.292.20
2.182.09
1.19
0.454.374.37
Name of the Instrument Ratings Market ValueRs. Lakhs
% to NAV
Debt InstrumentsGovernment SecuritiesGOI - 7.80% (11/04/2021)GOI - 8.24% (15/02/2027)GOI - 7.35% (22/06/2024)GOI - 8.28% (21/09/2027)GOI - 8.20% (24/09/2025)GOI - 8.20% (15/02/2022)GOI - 8.27% (09/06/2020)Non-Convertible Debentures/Bonds09.25 % Reliance Jio Infocomm Ltd.09.39 % Rural Electrification Corp. Ltd.08.87 % EXIM07.60 % National Highways AuthorityOf India07.90 % India Infradebt Ltd.07.30 % Power Grid CorporationOf India Ltd.07.63 % Housing & UrbanDevelopment Corporation Ltd.08.49 % NHPC Ltd.Privately Placed/Unlisted08.10 % SBI Cards & PaymentServices Pvt. Ltd.
1464.7522009.44
231.9722241.41
RepoPortfolio TotalCash / Net Current AssetNet Assets
6.6198.981.02
100.00
^ Exposure less than 1% has been clubbed under Other Equities
Large Cap
Mid Cap
Small Cap
59.19%
37.85%
2.96%
"Market Capitalisation includes only domestic listed Equity exposure in BSE. Large Cap Companies are top 125 stocks by market capitalisation on S&P BSE 500 Index and Mid Cap stocks are those between 126 to 499 stocks by market capitalisation and 500 & above being classified as Small cap. For calculation purpose, the previous month market capitalisation data have been used. All the figures has been rebased to 100 (Based on internal calculation).
Market Capitalisation wise Exposure
Company name No. of Shares Market ValueRs. Lakhs
% of Assets
Company name No. of Shares Market ValueRs. Lakhs
% of Assets
VOLATILITY MEASURES^ FUND BENCHMARK
Std. Dev (Annualised)Sharpe RatioPortfolio BetaR SquaredTreynorJenson
7.340.120.730.850.34
-0.15
9.040.211.001.000.54
NA
Akhil Mittal (Managing Since 30-Jul-15 and overall experience of 15 years) (Debt) & Sonam Udasi (Managing Since 1-Apr-16 and overall experience of 20 years) (Equity)
BENCHMARKCRISIL Hybrid 35+65 - Aggressive Index
MONTHLY AVERAGE AUMRs. 220.73 (Rs. in Cr.)
EXPENSE RATIO**DirectRegular
1.832.95
**Note: The rates specified are the actual weighted average expenses charged for the month of Apr 2018. The above ratio includes the Service tax on Investment Management Fees. The above ratio excludes, proportionate charge (out of maximum 30 bps on daily average net assets allowed) in respect sales beyond T-30 cities assets, wherever applicable.
Tata Young Citizens’ Fund(An Open-Ended Balanced Scheme)
Modified DurationAverage Maturity
Gross Yield to Maturity (For Debt Component)
i. Including NCA* ii. Excluding NCA**NCA - Net Current Assets
: 3.39 Years4.59 Years
7.68%7.85%
:
::
7.95%7.79%
6.30%5.10%
3.40%2.75%2.68%
2.42%2.41%
1.91%1.79%1.69%
1.50%1.12%
0.83%0.74%
0.37%
0.00% 5.00% 10.00%
BanksAuto
Consumer Non DurablesRetailingFinance
Textile ProductsIndustrial Products
Media & EntertainmentConstruction Project
TransportationAuto Ancillaries
GasHotels, Resorts And Other Recreational…
PowerSoftwareCement
Petroleum Products
90
102
114
126
138
150
Apr-15 Apr-16 Apr-17 Apr-18
Tata Young Citizens Fund - RegCRISIL Hybrid 35+65 - Aggressive Index
Please refer to our Tata Mutual Fund website for fundamental changes, wherever applicable
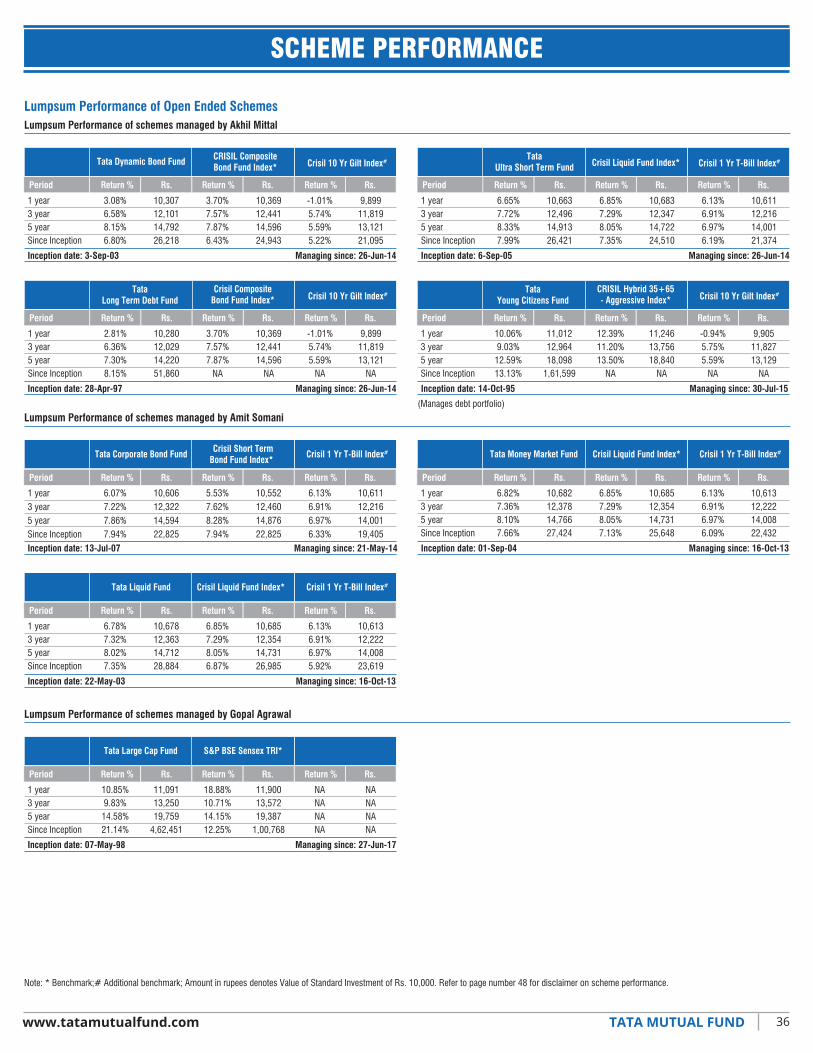
Period Return % Rs.Return % Rs.Return % Rs.
Managing since: 26-Jun-14
36www.tatamutualfund.com TATA MUTUAL FUND
SCHEME PERFORMANCE
1 year3 year5 yearSince Inception
3.08%6.58%8.15%6.80%
10,30712,10114,79226,218
3.70%7.57%7.87%6.43%
10,36912,44114,59624,943
-1.01%5.74%5.59%5.22%
9,89911,81913,12121,095
Tata Dynamic Bond Fund CRISIL CompositeBond Fund Index* Crisil 10 Yr Gilt Index#
Inception date: 3-Sep-03
Period Return % Rs.Return % Rs.Return % Rs.
Managing since: 26-Jun-14
1 year3 year5 yearSince Inception
2.81%6.36%7.30%8.15%
10,28012,02914,22051,860
3.70%7.57%7.87%
NA
10,36912,44114,596
NA
-1.01%5.74%5.59%
NA
9,89911,81913,121
NA
TataLong Term Debt Fund
Crisil CompositeBond Fund Index* Crisil 10 Yr Gilt Index#
Inception date: 28-Apr-97
Period Return % Rs.Return % Rs.Return % Rs.
Managing since: 26-Jun-14
1 year3 year5 yearSince Inception
6.65%7.72%8.33%7.99%
10,66312,49614,91326,421
6.85%7.29%8.05%7.35%
10,68312,34714,72224,510
6.13%6.91%6.97%6.19%
10,61112,21614,00121,374
TataUltra Short Term Fund Crisil Liquid Fund Index* Crisil 1 Yr T-Bill Index#
Inception date: 6-Sep-05
Period Return % Rs.Return % Rs.Return % Rs.
Managing since: 30-Jul-15
1 year3 year5 yearSince Inception
10.06%9.03%
12.59%13.13%
11,01212,96418,098
1,61,599
11,24613,75618,840
NA
12.39%11.20%13.50%
NA
-0.94%5.75%5.59%
NA
9,90511,82713,129
NA
TataYoung Citizens Fund
CRISIL Hybrid 35+65- Aggressive Index* Crisil 10 Yr Gilt Index#
Inception date: 14-Oct-95
Period Return % Rs.Return % Rs.Return % Rs.
Managing since: 21-May-14
1 year3 year5 yearSince Inception
6.07%7.22%7.86%7.94%
10,60612,32214,59422,825
5.53%7.62%8.28%7.94%
10,55212,46014,87622,825
6.13%6.91%6.97%6.33%
10,61112,21614,00119,405
Tata Corporate Bond Fund Crisil Short TermBond Fund Index* Crisil 1 Yr T-Bill Index#
Inception date: 13-Jul-07
Period Return % Rs.Return % Rs.Return % Rs.
Managing since: 16-Oct-13
1 year3 year5 yearSince Inception
6.78%7.32%8.02%7.35%
10,67812,36314,71228,884
6.85%7.29%8.05%6.87%
10,68512,35414,73126,985
6.13%6.91%6.97%5.92%
10,61312,22214,00823,619
Tata Liquid Fund Crisil Liquid Fund Index* Crisil 1 Yr T-Bill Index#
Inception date: 22-May-03
Period Return % Rs.Return % Rs.Return % Rs.
Managing since: 16-Oct-13
1 year3 year5 yearSince Inception
6.82%7.36%8.10%7.66%
10,68212,37814,76627,424
10,68512,35414,73125,648
6.85%7.29%8.05%7.13%
6.13%6.91%6.97%6.09%
10,61312,22214,00822,432
Tata Money Market Fund Crisil Liquid Fund Index* Crisil 1 Yr T-Bill Index#
Inception date: 01-Sep-04
Lumpsum Performance of schemes managed by Akhil Mittal
Lumpsum Performance of Open Ended Schemes
Lumpsum Performance of schemes managed by Amit Somani
Period Return % Rs.Return % Rs.Return % Rs.
Managing since: 27-Jun-17
1 year3 year5 yearSince Inception
10.85%9.83%14.58%21.14%
11,09113,25019,759
4,62,451
18.88%10.71%14.15%12.25%
11,90013,57219,387
1,00,768
NANANANA
NANANANA
Tata Large Cap Fund S&P BSE Sensex TRI*
Inception date: 07-May-98
Lumpsum Performance of schemes managed by Gopal Agrawal
Note: * Benchmark;# Additional benchmark; Amount in rupees denotes Value of Standard Investment of Rs. 10,000. Refer to page number 48 for disclaimer on scheme performance.
(Manages debt portfolio)

Period Return % Rs.Return % Rs.Return % Rs.
Managing since: 01-Apr-17
37www.tatamutualfund.com TATA MUTUAL FUND
SCHEME PERFORMANCE
1 year3 year5 yearSince Inception
6.65%8.23%16.79%16.02%
10,66912,67921,734
2,86,270
12.39%11.20%13.50%
NA
11,24613,75618,840
NA
18.88%10.71%14.15%11.38%
11,90013,57219,387
1,13,939
Tata Balanced FundCRISIL Hybrid 35+65- Aggressive Index* S&P BSE Sensex TRI#
Inception date: 8-Oct-95
Period Return % Rs.Return % Rs.Return % Rs.
Managing since: 01-Apr-17
1 year3 year5 yearSince Inception
18.75%17.85%20.82%18.45%
11,88616,37425,75530,053
18.88%10.71%14.15%12.95%
11,90013,57219,38722,068
NANANANA
NANANANA
Tata Retirement SavingsFund - Progressive Plan
S&P BSE Sensex TRI*
Inception date: 1-Nov-11
Period Return % Rs.Return % Rs.Return % Rs.
Managing since: 01-Apr-17
1 year3 year5 yearSince Inception
4.63%6.86%7.49%6.57%
10,46212,19914,34526,754
3.70%7.57%7.87%6.70%
10,36912,44114,59627,249
-1.01%5.74%5.59%5.92%
9,89911,81913,12124,354
Tata Medium Term FundCrisil Composite
Bond Fund Index*Crisil 10 Yr Gilt Index#
Inception date: 11-Nov-02
Period Return % Rs.Return % Rs.Return % Rs.
Managing since: 01-Apr-17
1 year3 year5 yearSince Inception
6.79%9.36%
11.19%10.53%
10,67713,07216,98619,154
10,82912,96216,39218,779
8.31%9.05%
10.40%10.20%
-1.01%5.74%5.59%7.12%
9,89911,81913,12115,622
Tata Retirement SavingsFund - Conservative Plan
CRISIL Short Term DebtHybrid 75+25 Fund Index*
Crisil 10 Yr Gilt Index#
Inception date: 1-Nov-11
Period Return % Rs.Return % Rs.Return % Rs.
Managing since: 01-Apr-17
1 year3 year5 yearSince Inception
3.40%4.92%6.35%7.26%
10,34211,55013,60435,345
12.46%9.11%10.32%
NA
11,25312,99316,348
NA
18.88%10.71%14.15%12.80%
11,90013,57219,38787,663
Tata Regular SavingEquity Fund
Nifty 50 Index TRI (35%),Nifty 50Arbitrage Index (30%), Crisil
Short Term Bond Fund Index (35%)*S&P BSE Sensex TRI#
Inception date: 27-Apr-00
Period Return % Rs.Return % Rs.Return % Rs.
Managing since: 01-Apr-17
1 year3 year5 yearSince Inception
15.54%14.68%21.00%18.71%
11,56315,08825,94730,490
13.72%11.69%14.30%13.26%
11,38013,93819,51822,466
18.88%10.71%14.15%12.95%
11,90013,57219,38722,068
Tata Retirement SavingsFund - Moderate Plan
CRISIL Hybrid 25+75- Aggressive Index* S&P BSE Sensex TRI#
Inception date: 1-Nov-11
Period Return % Rs.Return % Rs.Return % Rs.
Managing since: 01-Apr-17
1 year3 year5 yearSince Inception
2.57%6.40%8.18%8.16%
10,25612,04014,80718,502
4.15%7.61%8.00%8.28%
10,41412,45714,68918,668
-1.01%5.74%5.59%5.97%
9,89911,81913,12115,761
Tata Gilt Mid Term Fund I-Sec Composite Index* Crisil 10 Yr Gilt Index#
Inception date: 24-Jun-10
Period Return % Rs.Return % Rs.Return % Rs.
Managing since: 01-Apr-17
1 year3 year5 yearSince Inception
5.06%7.12%8.00%7.72%
10,50512,28614,69032,215
10,55212,46014,87629,456
5.53%7.62%8.28%7.11%
6.13%6.91%6.97%5.96%
10,61112,21614,00124,851
Tata Short TermBond Fund
Crisil Short TermBond Fund Index* Crisil 1 Yr T-Bill Index#
Inception date: 8-Aug-02
Period Return % Rs.Return % Rs.Return % Rs.
Managing since: 01-Apr-17
1 year3 year5 yearSince Inception
0.63%5.57%7.31%8.83%
10,06311,76214,22448,492
1.87%6.68%6.95%9.01%
10,18612,13713,98549,974
-1.01%5.74%5.59%
NA
9,89911,81913,121
NA
TataGilt Securities Fund
CRISIL Gilt Index* Crisil 10 Yr Gilt Index#
Inception date: 6-Sep-99
Lumpsum Performance of schemes managed by Murthy Nagarajan
Lumpsum Performance of Open Ended Schemes
Lumpsum Performance of schemes managed by Naresh Kumar
Note: * Benchmark; # Additional benchmark; Amount in rupees denotes Value of Standard Investment of Rs. 10,000. Refer to page number 48 for disclaimer on scheme performance.
(Manages debt portfolio) (Manages debt portfolio)
(Manages debt portfolio)
(Manages debt portfolio)
(Manages debt portfolio)

Period Return % Rs.Return % Rs.Return % Rs.
Managing since: 01-Apr-16
38www.tatamutualfund.com TATA MUTUAL FUND
SCHEME PERFORMANCE
1 year3 year5 yearSince Inception
6.65%8.23%16.79%16.02%
10,66912,67921,734
2,86,270
12.39%11.20%13.50%
NA
11,24613,75618,840
NA
18.88%10.71%14.15%11.38%
11,90013,57219,387
1,13,939
Tata Balanced FundCRISIL Hybrid 35+65- Aggressive Index* S&P BSE Sensex TRI#
Inception date: 8-Oct-95
Period Return % Rs.Return % Rs.Return % Rs.
Managing since: 28-Dec-15
1 year3 year5 yearSince Inception
14.83%NANA
28.09%
11,492NANA
17,845
18.63%NANA
20.76%
11,875NANA
15,548
16.91%NANA
15.32%
11,701NANA
13,959
Tata Banking AndFinancial Services Fund$
Nifty FinancialServices TRI*
Nifty 50 TRI#
Inception date: 28-Dec-15
Period Return % Rs.Return % Rs.Return % Rs.
Managing since: 28-Dec-15
1 year3 year5 yearSince Inception
57.93%NANA
16.10%
15,832NANA
14,181
43.68%NANA
11.05%
14,396NANA
12,779
18.88%NANA
15.15%
11,900NANA
13,911
Tata Digital India Fund$ S&P BSE IT TRI* S&P BSE Sensex#
Inception date: 28-Dec-15
Period Return % Rs.Return % Rs.Return % Rs.
Managing since: 02-Jan-12
1 year3 year5 yearSince Inception
16.33%9.91%
17.97%16.65%
11,64213,28022,860
2,93,549
18.57%15.56%19.90%
NA
11,86815,44024,787
NA
16.91%10.89%14.03%12.33%
11,70113,64019,286
1,28,278
Tata Ethical Fund Nifty 500 Shariah TRI* Nifty 50 TRI#
Inception date: 24-May-96
Period Return % Rs.Return % Rs.Return % Rs.
Managing since: 07-Jun-13
1 year3 year5 yearSince Inception
10.43%11.30%17.38%16.68%
11,04913,79122,29579,573
16.91%13.40%16.74%15.67%
11,70114,58621,69370,785
16.91%10.89%14.03%15.31%
11,70113,64019,28667,850
Tata Dividend Yield Fund Nifty 500 TRI* Nifty 50 TRI#
Inception date: 22-Nov-04
Period Return % Rs.Return % Rs.Return % Rs.
Managing since: 01-Jan-12
1 year3 year5 yearSince Inception
17.87%9.97%
18.68%12.58%
11,79813,30223,56024,543
11,50314,27720,98620,175
14.94%12.59%15.97%9.71%
16.91%10.89%14.03%8.90%
11,70113,64019,28619,079
Tata Offshore IndiaSharia Scheme Nifty 50 Shariah TRI* Nifty 50 TRI#
Inception date: 04-Oct-10
Period Return % Rs.Return % Rs.Return % Rs.
Managing since: 07-Jun-13
1 year3 year5 yearSince Inception
11.86%11.53%17.99%12.64%
11,19313,87922,876
2,00,612
17.22%13.51%16.90%
NA
11,73214,63221,840
NA
18.88%10.71%14.15%11.25%
11,90013,57219,387
1,46,547
Tata EquityOpportunities Fund S&P BSE 500 TRI* S&P BSE Sensex TRI#
Inception date: 25-Feb-93
Lumpsum Performance of schemes managed by Pradeep Gokhale
Lumpsum Performance of Open Ended Schemes
Lumpsum Performance of schemes managed by Rupesh Patel
Note: * Benchmark;# Additional benchmark; Amount in rupees denotes Value of Standard Investment of Rs. 10,000. Refer to page number 48 for disclaimer on scheme performance.
Note: $Pradeep Gokhale is the co-fund manager
(Manages equity portfolio)
Period Return % Rs.Return % Rs.Return % Rs.
Managing since: 01-Jan-14
1 year3 year5 yearSince Inception
7.19%11.35%16.69%14.21%
10,72313,81021,64358,852
16.91%13.40%16.74%14.68%
11,70114,58621,69362,136
16.91%10.89%14.03%14.50%
11,70113,64019,28660,868
Tata Infrastructure Fund Nifty 500 TRI* Nifty 50 TRI#
Inception date: 31-Dec-04
Period Return % Rs.Return % Rs.Return % Rs.
Managing since: 28-Dec-15
1 year3 year5 yearSince Inception
34.94%NANA
29.97%
13,517NANA
18,465
25.25%NANA
17.57%
12,540NANA
14,603
16.91%NANA
15.32%
11,701NANA
13,959
TataIndia Consumer Fund$
Nifty IndiaConsumption TRI*
Nifty 50 TRI#
Inception date: 28-Dec-15
Period Return % Rs.Return % Rs.Return % Rs.
Managing since: 28-Dec-15
1 year3 year5 yearSince Inception
-2.95%NANA
-4.66%
9,703NANA
8,944
-9.87%NANA
-10.94%
9,008NANA
7,626
16.91%NANA
15.32%
11,701NANA
13,959
Tata India PharmaAnd Healthcare Fund$ Nifty Pharma TRI* Nifty 50 TRI#
Inception date: 28-Dec-15
Note: $Rupesh Patel is the co-fund manager
Period Return % Rs.Return % Rs.Return % Rs.
Managing since: 01-Apr-15
1 year3 year5 yearSince Inception
15.65%16.30%21.66%19.98%
11,57415,73626,663
5,59,867
18.88%10.71%14.15%11.98%
11,90013,57219,387
1,21,779
NANANANA
NANANANA
TataIndia Tax Savings Fund S&P BSE Sensex TRI*
Inception date: 31-Mar-96

39www.tatamutualfund.com TATA MUTUAL FUND
SCHEME PERFORMANCE
Period Return % Rs.Return % Rs.Return % Rs.
Managing since: 28-Dec-15
1 year3 year5 yearSince Inception
4.15%NANA
19.14%
10,418NANA
15,063
9.77%NANA
25.12%
10,982NANA
16,894
16.91%NANA
15.32%
11,701NANA
13,959
Tata Resources &Energy Fund$ Nifty Commodities TRI* Nifty 50 TRI#
Inception date: 28-Dec-15
Lumpsum Performance of schemes managed by Rupesh Patel (contd.)
Period Return % Rs.Return % Rs.Return % Rs.
Managing since: 01-Apr-16
1 year3 year5 yearSince Inception
14.83%NANA
28.09%
11,492NANA
17,845
18.63%NANA
20.76%
11,875NANA
15,548
16.91%NANA
15.32%
11,701NANA
13,959
Tata Banking And FinancialServices Fund
Nifty FinancialServices TRI*
Nifty 50 TRI#
Inception date: 28-Dec-15
Period Return % Rs.Return % Rs.Return % Rs.
Managing since: 01-Apr-16
1 year3 year5 yearSince Inception
57.93%NANA
16.10%
15,832NANA
14,181
43.68%NANA
11.05%
14,396NANA
12,779
18.88%NANA
15.15%
11,900NANA
13,911
Tata Digital India Fund S&P BSE IT TRI* S&P BSE Sensex TRI#
Inception date: 28-Dec-15
Period Return % Rs.Return % Rs.Return % Rs.
Managing since: 01-Apr-16
1 year3 year5 yearSince Inception
15.52%17.90%25.16%21.23%
11,56116,39730,728
1,43,716
18.88%10.71%14.15%16.69%
11,90013,57219,38784,734
NANANANA
NANANANA
Tata Equity P/E Fund S&P BSE Sensex TRI*
Inception date: 29-Jun-04
Lumpsum Performance of schemes managed by Sonam Udasi
Note: * Benchmark;# Additional benchmark; Amount in rupees denotes Value of Standard Investment of Rs. 10,000. Refer to page number 48 for disclaimer on scheme performance.
Period Return % Rs.Return % Rs.Return % Rs.
Managing since: 01-Apr-16
1 year3 year5 yearSince Inception
12.71%10.89%16.28%14.01%
11,27913,64121,26553,358
18.88%10.71%14.15%14.37%
11,90013,57219,38754,316
NANANANA
NANANANA
Tata Offshore IndiaOpportunities Scheme
S&P BSE Sensex TRI*
Inception date: 26-Jul-05
Period Return % Rs.Return % Rs.Return % Rs.
Managing since: 01-Jan-14
1 year3 year5 yearSince Inception
8.47%12.94%18.64%12.43%
10,85214,41023,51831,343
18.88%10.71%14.15%10.94%
11,90013,57219,38727,512
NANANANA
NANANANA
Tata Offshore IndiaInfrastructure Scheme
S&P BSE Sensex TRI*
Inception date: 01-Aug-08
Period Return % Rs.Return % Rs.Return % Rs.
Managing since: 27-Jun-17
1 year3 year5 yearSince Inception
10.98%12.55%26.03%12.68%
11,10414,26431,820
1,72,177
13.28%18.34%22.54%
NA
11,33516,58127,646
NA
16.91%10.89%14.03%10.59%
11,70113,64019,286
1,10,284
Tata Mid Cap Growth Fund Nifty Midcap 100 TRI*
Inception date: 01-Jul-94
Nifty 50 TRI#
Period Return % Rs.Return % Rs.Return % Rs.
Managing since: 01-Apr-16
1 year3 year5 year
Since Inception
15.84%
9.78%
12.60%
16.68%
11,593
13,234
18,110
1,04,137
16.91%
10.89%
14.03%
18.15%
11,701
13,640
19,286
1,25,836
NA
NA
NA
NA
NA
NA
NA
NA
Tata Index Fund -Nifty Plan Nifty 50 TRI*
Inception date: 25-Feb-03
Period Return % Rs.Return % Rs.Return % Rs.
Managing since: 01-Apr-16
1 year3 year5 yearSince Inception
17.79%9.56%
12.61%16.38%
11,78913,15618,111
1,00,045
18.88%10.71%14.15%18.09%
11,90013,57219,387
1,24,998
NANANANA
NANANANA
Tata Index Fund- Sensex Plan S&P BSE Sensex TRI*
Inception date: 25-Feb-03
Period Return % Rs.Return % Rs.Return % Rs.
Managing since: 01-Apr-16
1 year3 year5 yearSince Inception
34.94%NANA
29.97%
13,517NANA
18,465
25.25%NANA
17.57%
12,540NANA
14,603
16.91%NANA
15.32%
11,701NANA
13,959
Tata India Consumer Fund Nifty India ConsumptionTRI* Nifty 50 TRI#
Inception date: 28-Dec-15
-2.95%NANA
-4.66%
9,703NANA
8,944
-9.87%NANA
-10.94%
9,008NANA
7,626
16.91%NANA
15.32%
11,701NANA
13,959
Period Return % Rs.Return % Rs.Return % Rs.
Managing since: 01-Apr-16
1 year3 year5 yearSince Inception
Tata India Pharma AndHealthcare Fund Nifty Pharma TRI* Nifty 50 TRI#
Inception date: 28-Dec-15
Period Return % Rs.Return % Rs.Return % Rs.
Managing since: 01-Apr-16
1 year3 year5 yearSince Inception
3.40%4.92%6.35%7.26%
10,34211,55013,60435,345
12.46%9.11%
10.32%NA
11,25312,99316,348
NA
18.88%10.71%14.15%12.80%
11,90013,57219,38787,663
Tata Regular SavingEquity Fund S&P BSE Sensex TRI#
Nifty 50 Index TRI (35%), Nifty 50Arbitrage Index (30%), Crisil Short
Term Bond Fund Index (35%)*
Inception date: 27-Apr-00
(Manages equity portfolio)
Note: $Rupesh Patel is the co-fund manager

40www.tatamutualfund.com TATA MUTUAL FUND
SCHEME PERFORMANCE
6.79%9.36%
11.19%10.53%
10,67713,07216,98619,154
8.31%9.05%
10.40%10.20%
10,82912,96216,39218,779
-1.01%5.74%5.59%7.12%
9,89911,81913,12115,622
Period Return % Rs.Return % Rs.Return % Rs.
Managing since: 01-Apr-16
1 year3 year5 yearSince Inception
Tata Retirement SavingsFund - Conservative Plan
CRISIL Short Term DebtHybrid 75+25 Fund Index* Crisil 10 Yr Gilt Index#
Inception date: 01-Nov-11
Lumpsum Performance of schemes managed by Sonam Udasi (contd.)
10.06%9.03%
12.59%13.13%
11,01212,96418,098
1,61,599
12.39%11.20%13.50%
NA
11,24613,75618,840
NA
-0.94%5.75%5.59%
NA
9,90511,82713,129
NA
Period Return % Rs.Return % Rs.Return % Rs.
Managing since: 01-Apr-16
1 year3 year5 yearSince Inception
Tata Young Citizens Fund CRISIL Hybrid 35+65- Aggressive Index*
Crisil 10 Yr Gilt Index#
Inception date: 14-Oct-95
Note: * Benchmark;# Additional benchmark; Amount in rupees denotes Value of Standard Investment of Rs. 10,000. Refer to page number 48 for disclaimer on scheme performance.
Period Return % Rs.Return % Rs.Return % Rs.
Managing since: 01-Apr-16
1 year3 year5 yearSince Inception
10.98%12.55%26.03%12.68%
11,10414,26431,820
1,72,177
13.28%18.34%22.54%
NA
11,33516,58127,646
NA
16.91%10.89%14.03%10.59%
11,70113,64019,286
1,10,284
TataMid Cap Growth Fund$ Nifty Midcap 100 TRI* Nifty 50 TRI#
Inception date: 01-Jul-94
Period Return % Rs.Return % Rs.Return % Rs.
Managing since: 1-Apr-16
1 year3 year5 yearSince Inception
12.71%10.89%16.28%14.01%
11,27913,64121,26553,358
18.88%10.71%14.15%14.37%
11,90013,57219,38754,316
NANANANA
NANANANA
Tata Offshore IndiaOpportunities Scheme S&P BSE Sensex TRI*
Inception date: 26-Jul-05
Lumpsum Performance of schemes co-managed by Danesh Mistry
(Manages equity portfolio)
(Manages equity portfolio)
(Manages equity portfolio)
Note: $Danesh Mistry is the assistant fund manager
Period Return % Rs.Return % Rs.Return % Rs.
Managing since: 01-Apr-16
1 year3 year5 yearSince Inception
4.15%NANA
19.14%
10,418NANA
15,063
9.77%NANA
25.12%
10,982NANA
16,894
16.91%NANA
15.32%
11,701NANA
13,959
Tata Resources &Energy Fund
Nifty Commodities TRI* Nifty 50 TRI#
Inception date: 28-Dec-15
15.54%14.68%21.00%18.71%
11,56315,08825,94730,490
13.72%11.69%14.30%13.26%
11,38013,93819,51822,466
18.88%10.71%14.15%12.95%
11,90013,57219,38722,068
Period Return % Rs.Return % Rs.Return % Rs.
Managing since: 01-Apr-16
1 year3 year5 yearSince Inception
Tata Retirement SavingsFund - Moderate Plan
CRISIL Hybrid 25+75- Aggressive Index* S&P BSE Sensex TRI#
Inception date: 01-Nov-11
Manages equity portfolio
Period Return % Rs.Return % Rs.Return % Rs.
Managing since: 01-Apr-16
1 year3 year5 yearSince Inception
Tata Retirement SavingsFund - Progressive Plan S&P BSE Sensex TRI*
Inception date: 01-Nov-11
18.75%17.85%20.82%18.45%
11,88616,37425,75530,053
18.88%10.71%14.15%12.95%
11,90013,57219,38722,068
NANANANA
NANANANA

41www.tatamutualfund.com TATA MUTUAL FUND
SIP Performance of schemes managed by Akhil Mittal
SCHEME PERFORMANCE
Return %Return %Return %Period Rs.Rs.Rs.
Crisil 10 Yr GiltIndex#
CRISIL Composite BondFund Index*
TataDynamic Bond Fund
Managing since: 26-Jun-14
1 Year
3 Year
5 Year
Since Inception
0.28%
5.21%
7.06%
7.32%
1,20,000
3,60,000
6,00,000
17,50,000
1,20,175
3,89,437
7,16,377
30,66,485
0.58%
5.89%
7.71%
7.39%
1,20,364
3,93,379
7,28,145
30,84,607
-4.95%
2.90%
5.51%
5.97%
1,16,850
3,76,156
6,89,259
27,55,700
Inception date: 3-Sep-03 First Installment date: 1-Oct-03
Return %Return %Return %Period Rs.Rs.Rs.
Crisil 1 Yr T-BillIndex#
Crisil Liquid FundIndex*
TataUltra Short Term Fund
Amt. Invested
Managing since: 26-Jun-14
1 Year
3 Year
5 Year
Since Inception
6.41%
7.27%
7.84%
8.20%
1,20,000
3,60,000
6,00,000
15,10,000
1,24,007
4,01,476
7,30,503
25,89,180
6.96%
7.04%
7.53%
7.64%
1,24,348
4,00,087
7,24,826
24,92,624
6.16%
6.43%
6.97%
6.61%
1,23,851
3,96,520
7,14,702
23,25,602
Inception date: 6-Sep-05 First Installment date: 1-Oct-05
Amt. Invested
Return % Rs.Return %Return %Period Rs.Rs.
Crisil 10 Yr GiltIndex#
CRISIL Hybrid 35+65- Aggressive Index*
TataYoung Citizens Fund
Amt. Invested
Managing since: 30-Jul-15
1 Year
3 Year
5 Year
Since Inception
7.92%
11.04%
12.01%
12.93%
1,20,000
3,60,000
6,00,000
26,70,000
1,25,026
4,24,565
8,10,745
1,38,53,324
9.68%
13.08%
13.18%
12.27%
-4.70%
2.94%
5.52%
5.98%
1,26,128
4,37,278
8,34,546
1,26,47,104
1,16,960
3,76,485
6,89,744
54,72,095
Inception date: 14-Oct-95 First Installment date: 1-Feb-96
Return %Return %Return %Period Rs.Rs.Rs.
Crisil 10 Yr Gilt Index#Crisil Composite Bond
Fund Index*Tata
Long Term Debt Fund
Managing since: 26-Jun-14
1 Year
3 Year
5 Year
Since Inception
-0.46%
4.83%
6.60%
7.12%
1,20,000
3,60,000
6,00,000
24,90,000
1,19,707
3,87,214
7,08,252
55,39,333
0.58%
5.89%
7.71%
6.61%
1,20,364
3,93,379
7,28,145
52,09,615
-4.95%
2.90%
5.51%
6.10%
1,16,850
3,76,156
6,89,259
49,09,975
Inception date: 28-Apr-97 First Installment date: 1-Aug-97
Amt. Invested
SIP Performance of schemes managed by Amit Somani
Return %Return %Return %Period Rs.Rs.Rs.
Crisil 1 Yr T-BillIndex#
Crisil Liquid FundIndex*
Tata Liquid Fund
Amt. Invested
Managing since: 16-Oct-13
1 Year
3 Year
5 Year
Since Inception
6.89%
7.02%
7.52%
7.78%
1,20,000
3,60,000
6,00,000
17,90,000
1,24,393
4,00,295
7,25,213
33,06,985
6.96%
7.03%
7.53%
7.44%
1,24,435
4,00,355
7,25,342
32,15,702
6.17%
6.44%
6.96%
6.42%
1,23,934
3,96,819
7,15,184
29,57,462
Inception date: 22-May-03 First Installment date: 1-Jun-03
Return %Return %Return %Period Rs.Rs.Rs.
Crisil 1 Yr T-BillIndex#
Crisil Short Term BondFund Index*
TataCorporate Bond Fund
Managing since: 21-May-14
1 Year
3 Year
5 Year
Since Inception
5.52%
6.66%
7.33%
7.86%
1,20,000
3,60,000
6,00,000
12,90,000
1,23,452
3,97,862
7,21,168
19,95,860
4.35%
6.74%
7.74%
8.05%
1,22,730
3,98,325
7,28,623
20,17,842
6.16%
6.43%
6.97%
6.75%
1,23,851
3,96,520
7,14,702
18,74,615
Inception date: 13-Jul-07 First Installment date: 1-Aug-07
Amt. Invested Return %Return %Return %Period Rs.Rs.Rs.
Crisil 1 Yr T-Bill Index#Crisil Liquid Fund
Index*Tata
Money Market Fund
Managing since: 16-Oct-13
1 Year
3 Year
5 Year
Since Inception
6.94%
7.07%
7.58%
7.94%
1,20,000
3,60,000
6,00,000
16,30,000
1,24,421
4,00,587
7,26,236
28,73,241
6.96%
7.03%
7.53%
7.57%
1,24,435
4,00,355
7,25,342
27,95,156
6.17%
6.44%
6.96%
6.54%
1,23,934
3,96,819
7,15,184
25,90,443
Inception date: 1-Sep-04 First Installment date: 1-Oct-04
Amt. Invested
SIP Performance of Open Ended Schemes
SIP Performance of schemes managed by Gopal Agrawal
Return %Return %Return %Period Rs.Rs.Rs.
S&P BSE Sensex TRI*Tata
Large Cap Fund
Managing since: 27-Jun-17
1 Year
3 Year
5 Year
Since Inception
7.50%
11.94%
12.80%
18.96%
1,24,761
4,30,116
8,26,694
2,14,11,904
1,20,000
3,60,000
6,00,000
23,90,000
16.15%
15.29%
13.38%
14.50%
1,30,133
4,51,311
8,38,606
1,23,29,822
NA
NA
NA
NA
NA
NA
NA
NA
Inception date: 07-May-98 First Installment date: 01-Jun-98
Amt. Invested
Note: * Benchmark;# Additional benchmark; Amount invested denotes value of standard investment of Rs. 10,000 per month. Refer to page number 48 for disclaimer on scheme performance.

42www.tatamutualfund.com TATA MUTUAL FUND
SCHEME PERFORMANCE
SIP Performance of Open Ended Schemes
SIP Performance of schemes managed by Naresh Kumar
Return %Return %Return %Period Rs.Rs.Rs.
Crisil 10 Yr Gilt Index#I-SecComposite Index*
TataGilt Mid Term Fund
Managing since: 1-Apr-17
1 Year
3 Year
5 Year
Since Inception
-0.43%
4.68%
6.99%
8.09%
1,20,000
3,60,000
6,00,000
9,40,000
1,19,731
3,86,324
7,15,144
12,97,689
1.38%
5.91%
7.82%
8.37%
1,20,868
3,93,454
7,30,161
13,12,149
-4.95%
2.90%
5.51%
6.09%
1,16,850
3,76,156
6,89,259
11,97,702
Inception date: 24-Jun-10 First Installment date: 1-Jul-10
Amt. Invested Return %Return %Return %Period Rs.Rs.Rs.
Crisil 10 Yr Gilt Index#CRISIL Gilt Index*Tata
Gilt Securities Fund
Managing since: 1-Apr-17
1 Year
3 Year
5 Year
Since Inception
-4.68%
3.58%
6.27%
7.22%
1,20,000
3,60,000
6,00,000
22,30,000
1,17,025
3,80,056
7,02,454
45,76,600
-1.56%
4.61%
6.94%
7.69%
1,19,016
3,85,946
7,14,290
48,11,450
-4.95%
2.90%
5.51%
6.17%
1,16,850
3,76,156
6,89,259
41,03,455
Inception date: 6-Sep-99 First Installment date: 1-Oct-99
Amt. Invested
Note: * Benchmark;# Additional benchmark; Amount invested denotes value of standard investment of Rs. 10,000 per month. Refer to page number 48 for disclaimer on scheme performance.
SIP Performance of schemes managed by Danesh Mistry
Return %Return %Return %Period Rs.Rs.Rs.
Nifty 50 TRI#Nifty Midcap100 TRI*
TataMid Cap Growth Fund
Managing since: 1-Apr-16
1 Year
3 Year
5 Year
Since Inception
8.84%
15.71%
21.45%
17.62%
1,20,000
3,60,000
6,00,000
28,60,000
1,25,601
4,54,027
10,21,490
2,10,87,548
14.02%
20.69%
22.46%
18.04%
1,28,820
4,86,937
10,46,615
2,21,91,707
13.71%
15.02%
13.58%
14.02%
1,28,627
4,49,584
8,42,764
1,36,64,601
Inception date: 1-Jul-94 First Installment date: 1-Jul-94
Amt. Invested
SIP Performance of schemes managed by Pradeep Gokhale
Return %Return %Return %Period Rs.Rs.Rs.
S&P BSE Sensex TRI#CRISIL Hybrid 35+65- Aggressive Index*
Tata Balanced Fund
Managing since: 1-Apr-16
1 Year
3 Year
5 Year
Since Inception
6.33%
9.36%
13.36%
17.36%
1,20,000
3,60,000
6,00,000
26,70,000
1,24,025
4,14,303
8,38,328
2,58,40,240
9.68%
13.08%
13.18%
12.27%
1,26,128
4,37,278
8,34,546
1,26,47,104
16.15%
15.29%
13.38%
13.75%
1,30,133
4,51,311
8,38,606
1,55,20,853
Inception date: 8-Oct-95 First Installment date: 1-Feb-96
Return %Return %Return %Period Rs.Rs.Rs.
Nifty 50 TRI#Nifty FinancialServices TRI*
Tata Banking AndFinancial Services Fund
Amt. Invested
Managing since: 28-Dec-15
1 Year
3 Year
5 Year
Since Inception
12.42%
NA
NA
25.47%
1,20,000
NA
NA
2,80,000
1,27,833
NA
NA
3,72,137
11.56%
NA
NA
22.78%
1,27,301
NA
NA
3,61,773
13.71%
NA
NA
17.26%
1,28,627
NA
NA
3,41,027
Inception date: 28-Dec-15 First Installment date: 1-Jan-16
Amt. Invested Return %Return %Return %Period Rs.Rs.Rs.
S&P BSE Sensex TRI#S&P BSE IT TRI*Tata
Digital India Fund
Managing since: 28-Dec-15
1 Year
3 Year
5 Year
Since Inception
75.49%
NA
NA
32.06%
1,20,000
NA
NA
2,80,000
1,64,273
NA
NA
3,98,048
54.84%
NA
NA
23.45%
1,52,839
NA
NA
3,64,345
16.15%
NA
NA
17.93%
1,30,133
NA
NA
3,43,505
Inception date: 28-Dec-15 First Installment date: 1-Jan-16
Amt. Invested
Return %Return %Return %Period Rs.Rs.Rs.
Nifty 500 Shariah TRI* Nifty 50 TRI#Tata Ethical Fund
Managing since: 2-Jan-12
1 Year
3 Year
5 Year
Since Inception
16.78%
13.03%
14.59%
18.81%
1,20,000
3,60,000
6,00,000
26,00,000
1,30,515
4,36,949
8,64,171
2,86,63,972
13.71%
18.32%
18.02%
9.03%
1,28,631
4,71,100
9,39,870
76,73,142
13.71%
15.02%
13.58%
14.40%
1,28,627
4,49,584
8,42,764
1,56,54,224
Inception date: 24-May-96 First Installment date: 1-Sep-96
Amt. Invested
SIP Performance of schemes managed by Murthy Nagarajan
Return %Return %Return %Period Rs.Rs.Rs.
S&P BSE Sensex TRI#CRISIL Hybrid 35+65- Aggressive Index*Tata Balanced Fund
Managing since: 1-Apr-17
1 Year
3 Year
5 Year
Since Inception
6.33%
9.36%
13.36%
17.36%
1,20,000
3,60,000
6,00,000
26,70,000
1,24,025
4,14,303
8,38,328
2,58,40,240
9.68%
13.08%
13.18%
12.27%
1,26,128
4,37,278
8,34,546
1,26,47,104
16.15%
15.29%
13.38%
13.75%
1,30,133
4,51,311
8,38,606
1,55,20,853
Inception date: 8-Oct-95 First Installment date: 1-Feb-96
Amt. Invested Return %Return %Return %Period Rs.Rs.Rs.
Crisil 10 Yr Gilt Index#Crisil Composite Bond
Fund Index*Tata
Medium Term Fund
Amt. Invested
Managing since: 1-Apr-17
1 Year
3 Year
5 Year
Since Inception
2.49%
5.97%
7.14%
7%
1,20,000
3,60,000
6,00,000
18,40,000
1,21,568
3,93,851
7,17,840
32,39,785
0.58%
5.89%
7.71%
7.29%
1,20,364
3,93,379
7,28,145
33,17,221
-4.95%
2.90%
5.51%
5.91%
1,16,850
3,76,156
6,89,259
29,57,023
Inception date: 11-Nov-02 First Installment date: 1-Jan-03

43www.tatamutualfund.com TATA MUTUAL FUND
SCHEME PERFORMANCE
SIP Performance of Open Ended Schemes
SIP Performance of schemes managed by Rupesh Patel
Return %Return %Return %Period Rs.Rs.Rs.
Nifty 50 TRI#Nifty 500 TRI*TataDividend Yield Fund
Managing since: 7-Jun-13
1 Year
3 Year
5 Year
Since Inception
11.26%
13.99%
15.60%
15.17%
1,20,000
3,60,000
6,00,000
16,10,000
1,27,109
4,43,044
8,85,769
48,29,742
14.14%
17.32%
16.46%
13.39%
1,28,894
4,64,518
9,04,748
42,19,708
13.71%
15.02%
13.58%
12.50%
1,28,627
4,49,584
8,42,764
39,47,656
Inception date: 22-Nov-04 First Installment date: 1-Dec-04
Amt. Invested
Note: * Benchmark;# Additional benchmark; Amount invested denotes value of standard investment of Rs. 10,000 per month. Refer to page number 48 for disclaimer on scheme performance.
Return % Rs.Return %Return %Period Rs.Rs.
S&P BSE Sensex TRI#CRISIL Hybrid 25+75- Aggressive Index*
Tata Retirement SavingsFund - Moderate Plan
Amt. Invested
Managing since: 1-Apr-17
1 Year
3 Year
5 Year
Since Inception
15.27%
18.77%
20.39%
19.93%
1,20,000
3,60,000
6,00,000
7,70,000
1,29,592
4,74,070
9,95,449
14,68,984
11.05%
14.15%
13.97%
14.07%
1,26,982
4,44,039
8,50,901
12,15,941
16.15%
15.29%
13.38%
13.76%
1,30,133
4,51,311
8,38,606
12,03,589
Inception date: 1-Nov-11 First Installment date: 1-Dec-11
Return %Return %Return %Period Rs.Rs.Rs.
S&P BSE Sensex TRI#Nifty 50 Index TRI (35%),Nifty 50
Arbitrage Index (30%), Crisil ShortTerm Bond Fund Index (35%)*
Tata RegularSaving Equity Fund
Managing since: 1-Apr-17
1 Year
3 Year
5 Year
Since Inception
3.28%
5.79%
6.24%
6.65%
1,20,000
3,60,000
6,00,000
21,60,000
1,22,094
3,92,970
7,02,153
40,87,485
12.62%
10.92%
10.27%
4.09%
1,27,956
4,23,808
7,76,422
31,72,683
16.15%
15.29%
13.37%
14.98%
1,30,133
4,51,331
8,38,370
98,06,156
Inception date: 27-Apr-00 First Installment date: 1-May-00
Amt. Invested Return %Return %Return %Period Rs.Rs.Rs.
Crisil 10 Yr Gilt Index#CRISIL Short Term Debt
Hybrid 75+25 Fund Index*Tata Retirement SavingsFund - Conservative Plan
Amt. Invested
Managing since: 1-Apr-17
1 Year
3 Year
5 Year
Since Inception
4.89%
9.57%
10.62%
10.68%
1,20,000
3,60,000
6,00,000
7,70,000
1,23,063
4,15,214
7,82,607
10,88,472
6.70%
9.24%
9.84%
10.11%
1,24,184
4,13,252
7,67,665
10,68,480
-4.95%
2.90%
5.51%
5.92%
1,16,850
3,76,156
6,89,259
9,32,680
Inception date: 1-Nov-11 First Installment date: 1-Dec-11
Return %Return %Return %Period Rs.Rs.Rs.
Crisil 1 Yr T-Bill Index#Crisil Short Term Bond
Fund Index*Tata
Short Term Bond Fund
Managing since: 1-Apr-17
1 Year
3 Year
5 Year
Since Inception
3.87%
6.24%
7.32%
7.96%
1,20,000
3,60,000
6,00,000
18,80,000
1,22,428
3,95,394
7,21,012
36,43,411
4.35%
6.74%
7.74%
7.68%
1,22,730
3,98,325
7,28,612
35,55,265
6.16%
6.43%
6.97%
6.36%
1,23,851
3,96,520
7,14,695
31,73,624
Inception date: 8-Aug-02 First Installment date: 1-Sep-02
Amt. Invested
SIP Performance of schemes managed by Murthy Nagarajan (contd.)
Return %Return %Return %Period Rs.Rs.Rs.
S&P BSE Sensex TRI*Tata Retirement SavingsFund - Progressive Plan
Managing since: 1-Apr-17
1 Year
3 Year
5 Year
Since Inception
18.38%
22.25%
21.52%
20.36%
1,20,000
3,60,000
6,00,000
7,70,000
1,31,497
4,97,600
10,23,223
14,89,160
16.15%
15.29%
13.38%
13.76%
1,30,133
4,51,311
8,38,606
12,03,589
NA
NA
NA
NA
NA
NA
NA
NA
Inception date: 1-Nov-11 First Installment date: 1-Dec-11
Amt. Invested
Return %Return %Return %Period Rs.Rs.Rs.
S&P BSE Sensex TRI#S&P BSE 500 TRI*Tata EquityOpportunities Fund
Managing since: 7-Jun-13
1 Year
3 Year
5 Year
Since Inception
10.29%
13.49%
15.66%
17.46%
1,20,000
3,60,000
6,00,000
30,20,000
1,26,508
4,39,847
8,87,121
3,80,38,936
14.45%
17.49%
16.58%
14.92%
1,29,086
4,65,625
9,07,301
2,56,38,854
16.15%
15.29%
13.38%
13.02%
1,30,133
4,51,311
8,38,606
1,91,34,798
Inception date: 25-Feb-93 First Installment date: 1-Mar-93
Amt. Invested
Return %Return %Return %Period Rs.Rs.Rs.
Nifty 50 TRI#Nifty IndiaConsumption TRI*
TataIndia Consumer Fund
Managing since: 28-Dec-15
1 Year
3 Year
5 Year
Since Inception
32.35%
NA
NA
36.66%
1,20,000
NA
NA
2,80,000
1,39,873
NA
NA
4,16,672
1,33,011
NA
NA
3,58,404
20.87%
NA
NA
21.89%
13.71%
NA
NA
17.26%
1,28,627
NA
NA
3,41,027
Inception date: 28-Dec-15 First Installment date: 1-Jan-16
Amt. Invested
Return %Return %Return %Period Rs.Rs.Rs.
Nifty 50 TRI#Nifty Pharma TRI*Tata India Pharma AndHealthcare Fund
Managing since: 28-Dec-15
1 Year
3 Year
5 Year
Since Inception
6.67%
NA
NA
-1.10%
1,20,000
NA
NA
2,80,000
1,24,243
NA
NA
2,76,313
-4.22%
NA
NA
-9.63%
1,17,269
NA
NA
2,48,497
13.71%
NA
NA
17.26%
1,28,627
NA
NA
3,41,027
Inception date: 28-Dec-15 First Installment date: 1-Jan-16
Amt. Invested

44www.tatamutualfund.com TATA MUTUAL FUND
SCHEME PERFORMANCE
Return %Return %Return %Period Rs.Rs.Rs.
Nifty 50 TRI#Nifty Commodities TRI*Tata Resources &
Energy Fund
Amt. Invested
Managing since: 28-Dec-15
1 Year
3 Year
5 Year
Since Inception
0.66%
NA
NA
13.49%
1,20,000
NA
NA
2,80,000
1,20,422
NA
NA
3,27,196
5.21%
NA
NA
20.21%
1,23,321
NA
NA
3,52,055
13.71%
NA
NA
17.26%
1,28,627
NA
NA
3,41,027
Inception date: 28-Dec-15 First Installment date: 1-Jan-16
Return % Rs.Return %Return %Period Rs.Rs.
S&P BSE Sensex TRI*Tata
India Tax Savings Fund
Amt. Invested
Managing since: 1-Apr-15
1 Year
3 Year
5 Year
Since Inception
12.18%
18.32%
20.13%
20.40%
1,20,000
3,60,000
6,00,000
26,20,000
1,27,680
4,71,075
9,89,282
3,68,25,450
16.15%
15.29%
13.38%
13.88%
1,30,133
4,51,311
8,38,606
1,49,17,906
NA
NA
NA
NA
NA
NA
NA
NA
Inception date: 31-Mar-96 First Installment date: 1-Jul-96
Return % Rs.Return %Return %Period Rs.Rs.
Nifty 50 TRI#Nifty Midcap 100 TRI*Tata
Mid Cap Growth Fund
Amt. Invested
Managing since: 27-Jun-17
1 Year
3 Year
5 Year
Since Inception
8.84%
15.71%
21.45%
17.62%
1,20,000
3,60,000
6,00,000
28,60,000
1,25,601
4,54,027
10,21,490
2,10,87,548
14.02%
20.69%
22.46%
18.04%
1,28,820
4,86,937
10,46,615
2,21,91,707
13.71%
15.02%
13.58%
14.02%
1,28,627
4,49,584
8,42,764
1,36,64,601
Inception date: 01-Jul-94 First Installment date: 01-Jul-94
Return %Return %Return %Period Rs.Rs.Rs.
Nifty 50 TRI#Nifty FinancialServices TRI*
Tata Banking AndFinancial Services Fund
Managing since: 1-Apr-16
1 Year
3 Year
5 Year
Since Inception
1,20,000
NA
NA
2,80,000
12.42%
NA
NA
25.47%
1,27,833
NA
NA
3,72,137
11.56%
NA
NA
22.78%
1,27,301
NA
NA
3,61,773
13.71%
NA
NA
17.26%
1,28,627
NA
NA
3,41,027
Inception date: 28-Dec-15 First Installment date: 1-Jan-16
Return % Rs.Return %Return %Period Rs.Rs.
S&P BSE Sensex TRI#S&P BSE IT TRI*TataDigital India Fund
Amt. Invested
Managing since: 1-Apr-16
1 Year
3 Year
5 Year
Since Inception
75.49%
NA
NA
32.06%
1,20,000
NA
NA
2,80,000
1,64,273
NA
NA
3,98,048
54.84%
NA
NA
23.45%
1,52,839
NA
NA
3,64,345
16.15%
NA
NA
17.93%
1,30,133
NA
NA
3,43,505
Inception date: 28-Dec-15 First Installment date: 1-Jan-16
Amt. Invested
SIP Performance of schemes managed by Sonam Udasi
SIP Performance of schemes managed by Rupesh Patel (contd.)
Note: * Benchmark;# Additional benchmark; Amount invested denotes value of standard investment of Rs. 10,000 per month. Refer to page number 48 for disclaimer on scheme performance.
Return %Return %Return %Period Rs.Rs.Rs.
S&P BSE Sensex TRI*TataEquity P/E Fund
Managing since: 1-Apr-16
1 Year
3 Year
5 Year
Since Inception
15.54%
23.13%
24.16%
18.59%
1,20,000
3,60,000
6,00,000
16,60,000
1,29,758
5,03,686
10,90,184
67,85,445
16.15%
15.29%
13.38%
12.88%
1,30,133
4,51,311
8,38,606
43,24,617
NA
NA
NA
NA
NA
NA
NA
NA
Inception date: 29-Jun-04 First Installment date: 1-Jul-04
Amt. Invested
Return %Return %Return %Period Rs.Rs.Rs.
Nifty 50 TRI#Nifty 500 TRI*Tata
Infrastructure Fund
Managing since: 1-Jan-14
1 Year
3 Year
5 Year
Since Inception
4.97%
14.39%
16.76%
10.90%
1,20,000
3,60,000
6,00,000
15,90,000
1,23,166
4,45,598
9,11,410
34,23,223
14.14%
17.32%
16.46%
13.31%
1,28,894
4,64,518
9,04,748
40,90,760
13.71%
15.02%
13.58%
12.40%
1,28,627
4,49,584
8,42,764
38,22,998
Inception date: 31-Dec-04 First Installment date: 1-Feb-05
Amt. Invested
Return % Rs.Return %Return %Period Rs.Rs.
Nifty 50 TRI*TataIndex Fund - Nifty Plan
Amt. Invested
Managing since: 1-Apr-16
1 Year
3 Year
5 Year
Since Inception
12.76%
13.86%
12.30%
12.63%
1,20,000
3,60,000
6,00,000
18,10,000
1,28,043
4,42,202
8,16,707
50,83,807
13.71%
15.02%
13.58%
14.04%
1,28,627
4,49,584
8,42,764
57,41,753
NA
NA
NA
NA
NA
NA
NA
NA
Inception date: 25-Feb-03 First Installment date: 1-Apr-03
Return %Return %Return %Period Rs.Rs.Rs.
S&P BSE Sensex TRI*Tata Index Fund- Sensex Plan
Managing since: 1-Apr-16
1 Year
3 Year
5 Year
Since Inception
15.18%
14.15%
12.06%
12.16%
1,20,000
3,60,000
6,00,000
18,10,000
1,29,534
4,44,067
8,11,859
48,83,178
16.15%
15.29%
13.38%
14.02%
1,30,133
4,51,311
8,38,606
57,32,353
NA
NA
NA
NA
NA
NA
NA
NA
Inception date: 25-Feb-03 First Installment date: 1-Apr-03
Amt. Invested
Return % Rs.Return %Return %Period Rs.Rs.
NiftyIndia Consumption TRI*
TataIndia Consumer Fund
Amt. Invested
Managing since: 1-Apr-16
1 Year
3 Year
5 Year
Since Inception
32.35%
NA
NA
36.66%
1,20,000
NA
NA
2,80,000
1,39,873
NA
NA
4,16,672
20.87%
NA
NA
21.89%
1,33,011
NA
NA
3,58,404
13.71%
NA
NA
17.26%
1,28,627
NA
NA
3,41,027
Inception date: 28-Dec-15 First Installment date: 1-Jan-16
Nifty 50 TRI#

45www.tatamutualfund.com TATA MUTUAL FUND
SCHEME PERFORMANCE
Return %Return %Return %Period Rs.Rs.Rs.
Nifty 50 TRI#Nifty Pharma TRI*Tata India PharmaAnd Healthcare Fund
Managing since: 1-Apr-16
1 Year
3 Year
5 Year
Since Inception
6.67%
NA
NA
-1.10%
1,20,000
NA
NA
2,80,000
1,24,243
NA
NA
2,76,313
-4.22%
NA
NA
-9.63%
1,17,269
NA
NA
2,48,497
13.71%
NA
NA
17.26%
1,28,627
NA
NA
3,41,027
Inception date: 28-Dec-15 First Installment date: 1-Jan-16
Amt. Invested
Return %Return %Return %Period Rs.Rs.Rs.
Nifty 50 TRI#Nifty Commodities TRI*Tata Resources &
Energy Fund
Managing since: 1-Apr-16
1 Year
3 Year
5 Year
Since Inception
0.66%
NA
NA
13.49%
1,20,000
NA
NA
2,80,000
1,20,422
NA
NA
3,27,196
5.21%
NA
NA
20.21%
1,23,321
NA
NA
3,52,055
13.71%
NA
NA
17.26%
1,28,627
NA
NA
3,41,027
Inception date: 28-Dec-15 First Installment date: 1-Jan-16
Amt. Invested
Return % Rs.Return %Return %Period Rs.Rs.
S&P BSE Sensex TRI#CRISIL Hybrid 25+75- Aggressive Index*
Tata Retirement SavingsFund - Moderate Plan
Amt. Invested
Managing since: 1-Apr-16
1 Year
3 Year
5 Year
Since Inception
15.27%
18.77%
20.39%
19.93%
1,20,000
3,60,000
6,00,000
7,70,000
1,29,592
4,74,070
9,95,449
14,68,984
11.05%
14.15%
13.97%
14.07%
1,26,982
4,44,039
8,50,901
12,15,941
16.15%
15.29%
13.38%
13.76%
1,30,133
4,51,311
8,38,606
12,03,589
Inception date: 1-Nov-11 First Installment date: 1-Dec-11
Return % Rs.Return %Return %Period Rs.Rs.
Crisil10 Yr Gilt Index#
CRISIL Short Term DebtHybrid 75+25 Fund Index*
Tata Retirement SavingsFund - Conservative Plan
Amt. Invested
Managing since: 1-Apr-16
1 Year
3 Year
5 Year
Since Inception
4.89%
9.57%
10.62%
10.68%
1,20,000
3,60,000
6,00,000
7,70,000
1,23,063
4,15,214
7,82,607
10,88,472
6.70%
9.24%
9.84%
10.11%
1,24,184
4,13,252
7,67,665
10,68,480
-4.95%
2.90%
5.51%
5.92%
1,16,850
3,76,156
6,89,259
9,32,680
Inception date: 1-Nov-11 First Installment date: 1-Dec-11
SIP Performance of schemes managed by Sonam Udasi (contd.)
Note: * Benchmark;# Additional benchmark; Amount invested denotes value of standard investment of Rs. 10,000 per month. Refer to page number 48 for disclaimer on scheme performance.
Return %Return %Return %Period Rs.Rs.Rs.
Crisil10 Yr Gilt Index#
CRISIL Hybrid 35+65- Aggressive Index*
TataYoung Citizens Fund
Managing since: 1-Apr-16
1 Year
3 Year
5 Year
Since Inception
7.92%
11.04%
12.01%
12.93%
1,20,000
3,60,000
6,00,000
26,70,000
1,25,026
4,24,565
8,10,745
1,38,53,324
9.68%
13.08%
13.18%
12.27%
1,26,128
4,37,278
8,34,546
1,26,47,104
-4.70%
2.94%
5.52%
5.98%
1,16,960
3,76,485
6,89,744
54,72,095
Inception date: 14-Oct-95 First Installment date: 1-Feb-96
Amt. Invested
Return %Return %Return %Period Rs.Rs.Rs.
S&P BSE Sensex TRI#Nifty 50 Index TRI (35%), Nifty 50Arbitrage Index (30%), Crisil Short
Term Bond Fund Index (35%)*
Tata RegularSaving Equity Fund
Amt. Invested
Managing since: 1-Apr-16
1 Year
3 Year
5 Year
Since Inception
3.28%
5.79%
6.24%
6.65%
1,20,000
3,60,000
6,00,000
21,60,000
1,22,094
3,92,970
7,02,153
40,87,485
12.62%
10.92%
10.27%
4.09%
1,27,956
4,23,808
7,76,422
31,72,683
16.15%
15.29%
13.37%
14.98%
1,30,133
4,51,331
8,38,370
98,06,156
Inception date: 27-Apr-00 First Installment date: 1-May-00
Return %Return %Return %Period Rs.Rs.Rs.
S&P BSE Sensex TRI*Tata Retirement SavingsFund - Progressive Plan
Managing since: 1-Apr-16
1 Year
3 Year
5 Year
Since Inception
18.38%
22.25%
21.52%
20.36%
1,20,000
3,60,000
6,00,000
7,70,000
1,31,497
4,97,600
10,23,223
14,89,160
16.15%
15.29%
13.38%
13.76%
1,30,133
4,51,311
8,38,606
12,03,589
NA
NA
NA
NA
NA
NA
NA
NA
Inception date: 1-Nov-11 First Installment date: 1-Dec-11
Amt. Invested
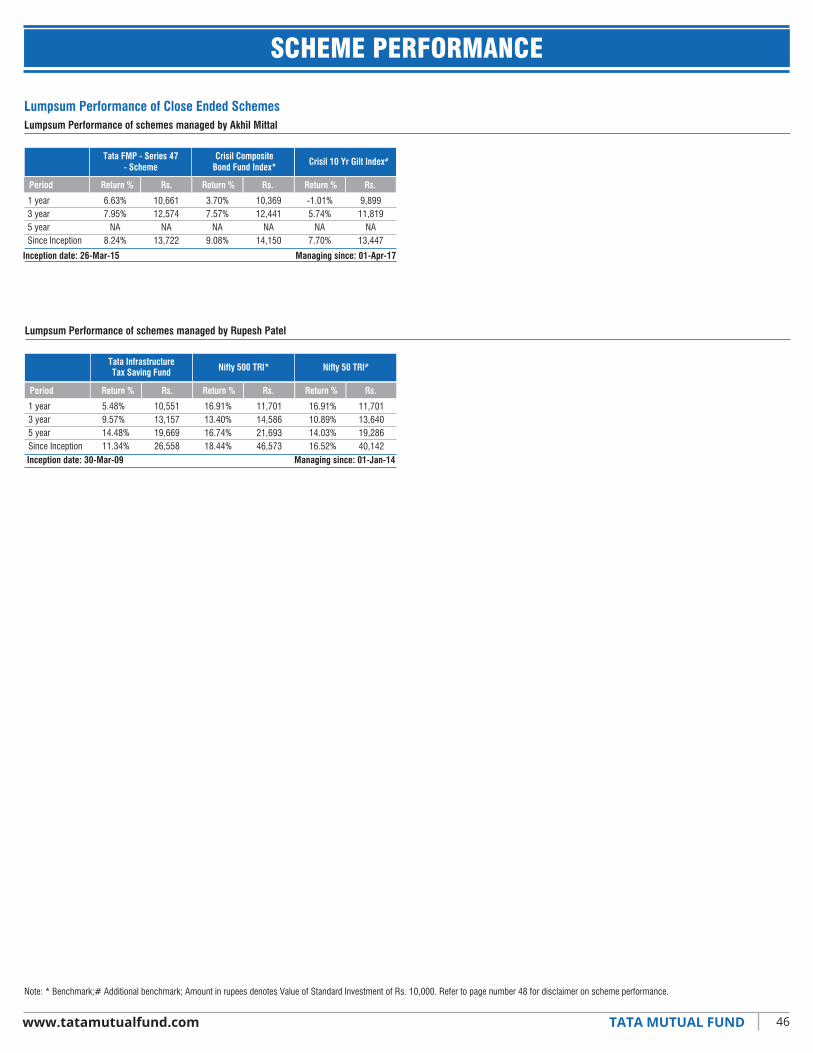
Managing since: 01-Jan-14Inception date: 30-Mar-09
Period Return % Rs.Return % Rs.Return % Rs.
1 year3 year5 yearSince Inception
5.48%9.57%14.48%11.34%
10,55113,15719,66926,558
16.91%13.40%16.74%18.44%
11,70114,58621,69346,573
16.91%10.89%14.03%16.52%
11,70113,64019,28640,142
Tata InfrastructureTax Saving Fund Nifty 500 TRI* Nifty 50 TRI#
Lumpsum Performance of schemes managed by Rupesh Patel
46www.tatamutualfund.com TATA MUTUAL FUND
SCHEME PERFORMANCE
Lumpsum Performance of schemes managed by Akhil Mittal
Lumpsum Performance of Close Ended Schemes
Period Return % Rs.Return % Rs.Return % Rs.
Managing since: 01-Apr-17
1 year3 year5 yearSince Inception
6.63%7.95%
NA8.24%
10,66112,574
NA13,722
3.70%7.57%
NA9.08%
10,36912,441
NA14,150
-1.01%5.74%
NA7.70%
9,89911,819
NA13,447
Tata FMP - Series 47- Scheme
Crisil CompositeBond Fund Index*
Crisil 10 Yr Gilt Index#
Inception date: 26-Mar-15
Note: * Benchmark;# Additional benchmark; Amount in rupees denotes Value of Standard Investment of Rs. 10,000. Refer to page number 48 for disclaimer on scheme performance.
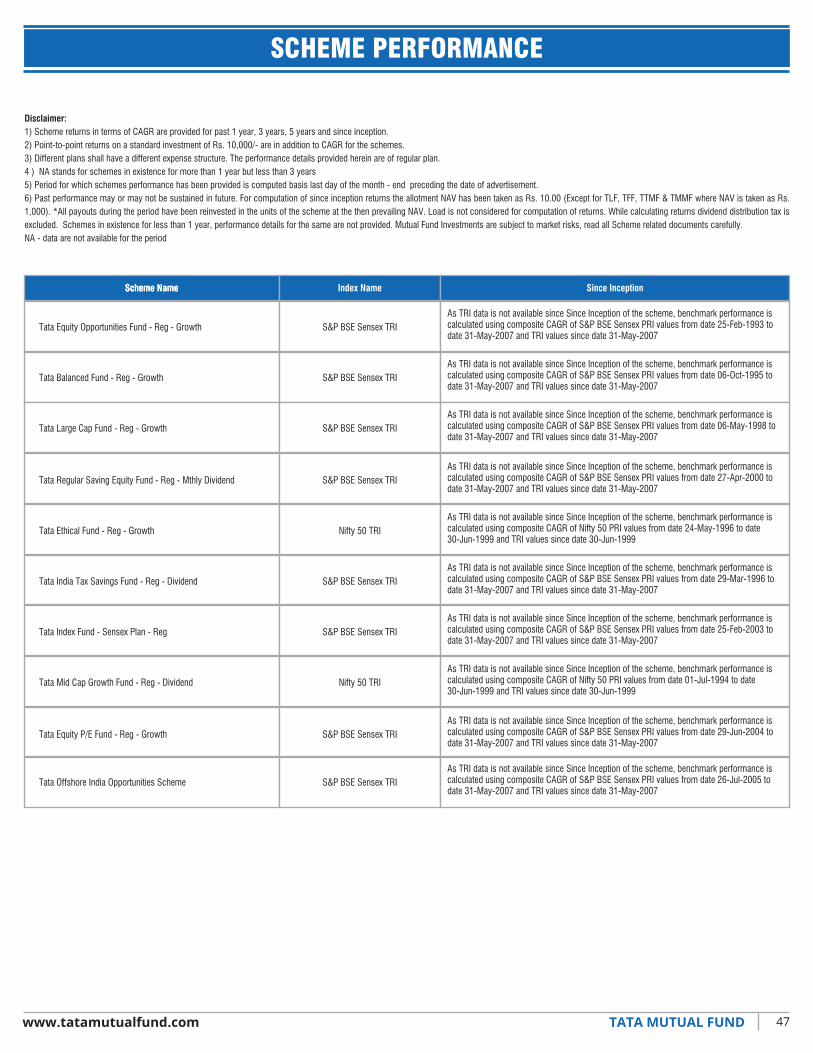
47www.tatamutualfund.com TATA MUTUAL FUND
SCHEME PERFORMANCE
Disclaimer:1) Scheme returns in terms of CAGR are provided for past 1 year, 3 years, 5 years and since inception.2) Point-to-point returns on a standard investment of Rs. 10,000/- are in addition to CAGR for the schemes. 3) Different plans shall have a different expense structure. The performance details provided herein are of regular plan.4 ) NA stands for schemes in existence for more than 1 year but less than 3 years5) Period for which schemes performance has been provided is computed basis last day of the month - end preceding the date of advertisement.6) Past performance may or may not be sustained in future. For computation of since inception returns the allotment NAV has been taken as Rs. 10.00 (Except for TLF, TFF, TTMF & TMMF where NAV is taken as Rs. 1,000). *All payouts during the period have been reinvested in the units of the scheme at the then prevailing NAV. Load is not considered for computation of returns. While calculating returns dividend distribution tax is excluded. Schemes in existence for less than 1 year, performance details for the same are not provided. Mutual Fund Investments are subject to market risks, read all Scheme related documents carefully.NA - data are not available for the period
Scheme NameScheme Name Index Name Since Inception
Tata Equity Opportunities Fund - Reg - Growth S&P BSE Sensex TRIAs TRI data is not available since Since Inception of the scheme, benchmark performance is calculated using composite CAGR of S&P BSE Sensex PRI values from date 25-Feb-1993 to date 31-May-2007 and TRI values since date 31-May-2007
Tata Balanced Fund - Reg - Growth S&P BSE Sensex TRIAs TRI data is not available since Since Inception of the scheme, benchmark performance is calculated using composite CAGR of S&P BSE Sensex PRI values from date 06-Oct-1995 to date 31-May-2007 and TRI values since date 31-May-2007
Tata Large Cap Fund - Reg - Growth S&P BSE Sensex TRIAs TRI data is not available since Since Inception of the scheme, benchmark performance is calculated using composite CAGR of S&P BSE Sensex PRI values from date 06-May-1998 to date 31-May-2007 and TRI values since date 31-May-2007
Tata Regular Saving Equity Fund - Reg - Mthly Dividend S&P BSE Sensex TRIAs TRI data is not available since Since Inception of the scheme, benchmark performance is calculated using composite CAGR of S&P BSE Sensex PRI values from date 27-Apr-2000 to date 31-May-2007 and TRI values since date 31-May-2007
Tata Ethical Fund - Reg - Growth Nifty 50 TRIAs TRI data is not available since Since Inception of the scheme, benchmark performance is calculated using composite CAGR of Nifty 50 PRI values from date 24-May-1996 to date 30-Jun-1999 and TRI values since date 30-Jun-1999
Tata India Tax Savings Fund - Reg - Dividend S&P BSE Sensex TRIAs TRI data is not available since Since Inception of the scheme, benchmark performance is calculated using composite CAGR of S&P BSE Sensex PRI values from date 29-Mar-1996 to date 31-May-2007 and TRI values since date 31-May-2007
Tata Index Fund - Sensex Plan - Reg S&P BSE Sensex TRIAs TRI data is not available since Since Inception of the scheme, benchmark performance is calculated using composite CAGR of S&P BSE Sensex PRI values from date 25-Feb-2003 to date 31-May-2007 and TRI values since date 31-May-2007
Tata Mid Cap Growth Fund - Reg - Dividend Nifty 50 TRIAs TRI data is not available since Since Inception of the scheme, benchmark performance is calculated using composite CAGR of Nifty 50 PRI values from date 01-Jul-1994 to date 30-Jun-1999 and TRI values since date 30-Jun-1999
Tata Equity P/E Fund - Reg - Growth S&P BSE Sensex TRIAs TRI data is not available since Since Inception of the scheme, benchmark performance is calculated using composite CAGR of S&P BSE Sensex PRI values from date 29-Jun-2004 to date 31-May-2007 and TRI values since date 31-May-2007
Tata Offshore India Opportunities Scheme S&P BSE Sensex TRIAs TRI data is not available since Since Inception of the scheme, benchmark performance is calculated using composite CAGR of S&P BSE Sensex PRI values from date 26-Jul-2005 to date 31-May-2007 and TRI values since date 31-May-2007

48www.tatamutualfund.com TATA MUTUAL FUND
• The Std. Dev., Sharpe Ratio, Jensen’s Alpha, Treynor, Portfolio Beta & R-squared are based on one month return calculated using last 3 years data.•
Price/Earning Ratio, Price/Book Value Ratio, are based on the historical earnings and accounting numbers, and have been computed only for the invested portion of the portfolio.
• Portfolio turnover has been computed as the ratio of the lower value of average purchase and average sales to the average net assets in the past one year (For schemes that have not completed one year, since
inception is considered)• Cash & Cash Equivalents includes CBLO, REPO, Fixed Deposits and Cash & Bank Balance.
Past performance may or may not be sustained in future.• After payment of dividend the NAV will fall to the extent of dividend payout and statutory levy, if any. (Unit face value - ` 10/-).• Pursuant to allotment of bonus units, the NAV of the scheme would fall in proportion to the bonus units allotted & as a result the total value of units held by investor would remain the same.
$-ICRA’s mutual fund rating methodology is based on evaluating the inherent credit quality of the fund’s portfolio. As a measure of the credit quality of a debt fund’s assets. ICRA uses the concept of ‘credit scores’. These scores are based on ICRA’s estimates of credit risk associated with each exposure of the portfolio taking into account its maturity. To quantify the credit risk scores, ICRA uses its database of historical default rates for various rating categories for various maturity buckets. The credit risk ratings incorporate ICRA’s assessment of a debt fund’s published investment objectives and policies, its management characteristics, and the creditworthiness of its investment portfolio. ICRA reviews relevant fund information on an ongoing basis to support its published rating opinions. If the portfolio credit score meets the benchmark of the assigned rating during the review, the rating is retained. In an event that the benchmark credit score is breached, ICRA gives a month’s time to the debt fund manager to bring the portfolio credit score within the benchmark credit score. If the debt fund manager is able to reduce the portfolio credit score within the benchmark credit score, the rating is retained. If the portfolio still continues to breach the benchmark credit score, the rating is revised to reflect the change in credit quality.
Note : Media & Entertainment Sector includes stock of Navneet Education Ltd. which is approved by our Sharia advisors Dar-ul-Sharia. This Company is in the business of Publication of education related books & Stationery items.
SCHEME PERFORMANCE
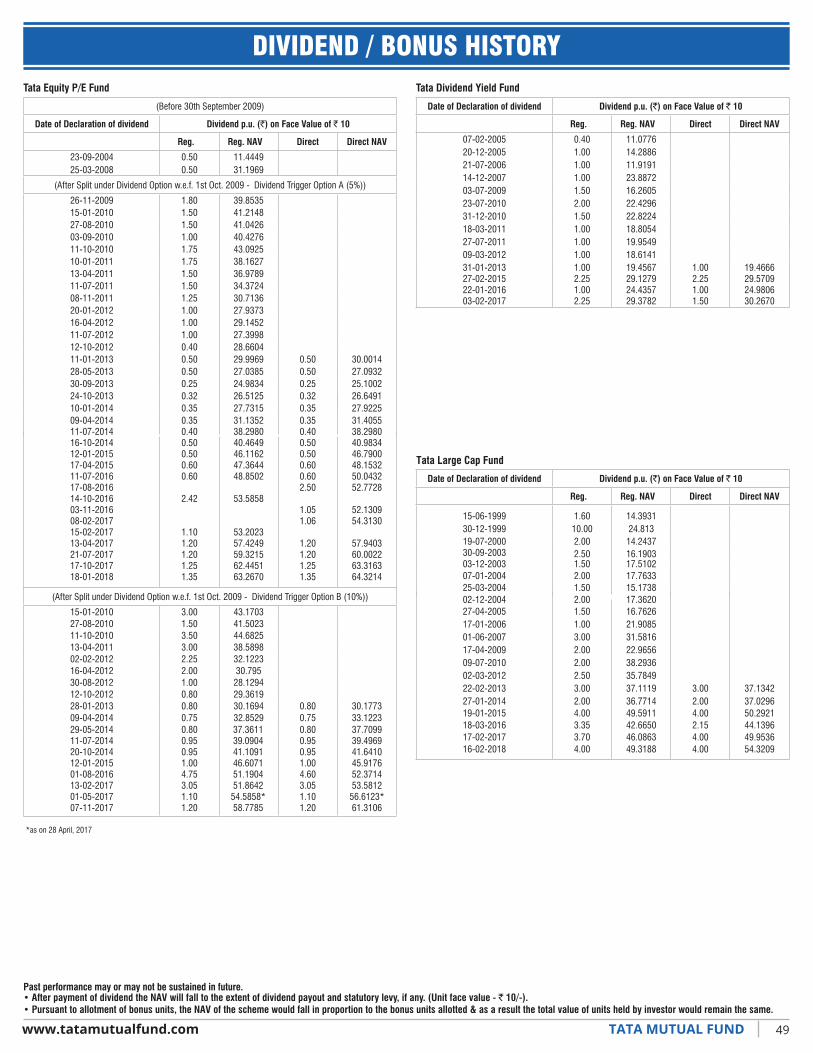
49
DIVIDEND / BONUS HISTORY
Past performance may or may not be sustained in future.• After payment of dividend the NAV will fall to the extent of dividend payout and statutory levy, if any. (Unit face value - ` 10/-).• Pursuant to allotment of bonus units, the NAV of the scheme would fall in proportion to the bonus units allotted & as a result the total value of units held by investor would remain the same.
Tata Equity P/E Fund
(Before 30th September 2009)
Date of Declaration of dividend Dividend p.u. (`) on Face Value of ` 10
Reg. Reg. NAV Direct Direct NAV
23-09-2004 0.50 11.444925-03-2008 0.50 31.1969
(After Split under Dividend Option w.e.f. 1st Oct. 2009 - Dividend Trigger Option A (5%))
26-11-2009 1.80 39.853515-01-2010 1.50 41.214827-08-2010 1.50 41.042603-09-2010 1.00 40.427611-10-2010 1.75 43.092510-01-2011 1.75 38.162713-04-2011 1.50 36.978911-07-2011 1.50 34.372408-11-2011 1.25 30.713620-01-2012 1.00 27.937316-04-2012 1.00 29.145211-07-2012 1.00 27.399812-10-2012 0.40 28.660411-01-2013 0.50 29.9969 0.50 30.001428-05-2013 0.50 27.0385 0.50 27.093230-09-2013 0.25 24.9834 0.25 25.100224-10-2013 0.32 26.5125 0.32 26.649110-01-2014 0.35 27.7315 0.35 27.922509-04-201411-07-201416-10-201412-01-201517-04-201511-07-201617-08-201614-10-201603-11-201608-02-201715-02-201713-04-201721-07-201717-10-201718-01-2018
0.350.400.500.500.600.60
2.42
1.101.201.201.251.35
31.135238.298040.464946.116247.364448.8502
53.5858
53.202357.424959.321562.445163.2670
0.350.400.500.500.600.602.50
1.051.06
1.201.201.251.35
31.405538.298040.983446.790048.153250.043252.7728
52.130954.3130
57.940360.002263.316364.3214
(After Split under Dividend Option w.e.f. 1st Oct. 2009 - Dividend Trigger Option B (10%))
15-01-2010 3.00 43.170327-08-2010 1.50 41.502311-10-2010 3.50 44.682513-04-2011 3.00 38.589802-02-2012 2.25 32.122316-04-2012 2.00 30.79530-08-2012 1.00 28.129412-10-2012 0.80 29.361928-01-2013 0.80 30.1694 0.80 30.177309-04-2014 0.75 32.8529 0.75 33.122329-05-201411-07-201420-10-201412-01-201501-08-201613-02-201701-05-201707-11-2017
0.800.950.951.004.753.051.101.20
37.361139.090441.109146.607151.190451.8642
54.5858*58.7785
0.800.950.951.004.603.051.101.20
37.709939.496941.641045.917652.371453.5812
56.6123*61.3106
Date of Declaration of dividend Dividend p.u. (`) on Face Value of ` 10
Reg. Reg. NAV Direct Direct NAV
27-04-2005 1.50 16.762617-01-2006 1.00 21.908501-06-2007 3.00 31.581617-04-2009 2.00 22.965609-07-2010 2.00 38.293602-03-2012 2.50 35.784922-02-2013 3.00 37.1119 3.00 37.134227-01-201419-01-201518-03-201617-02-201716-02-2018
2.004.003.353.704.00
36.771449.591142.665046.086349.3188
2.004.002.154.004.00
37.029650.292144.139649.953654.3209
02-12-2004 2.00 17.362025-03-2004 1.50 15.173807-01-2004 2.00 17.763303-12-2003 1.50 17.510230-09-2003 2.50 16.1903
www.tatamutualfund.com TATA MUTUAL FUND
Tata Large Cap Fund
15-06-1999 1.60 14.393130-12-1999 10.00 24.81319-07-2000 2.00 14.2437
Tata Dividend Yield Fund
Date of Declaration of dividend Dividend p.u. (`) on Face Value of ` 10
Reg. Reg. NAV Direct Direct NAV
07-02-2005 0.40 11.077620-12-2005 1.00 14.288621-07-2006 1.00 11.919114-12-2007 1.00 23.887203-07-2009 1.50 16.260523-07-2010 2.00 22.429631-12-2010 1.50 22.822418-03-2011 1.00 18.805427-07-2011 1.00 19.954909-03-2012 1.00 18.614131-01-201327-02-201522-01-201603-02-2017
1.002.251.002.25
19.456729.127924.435729.3782
1.002.251.001.50
19.466629.570924.980630.2670
*as on 28 April, 2017
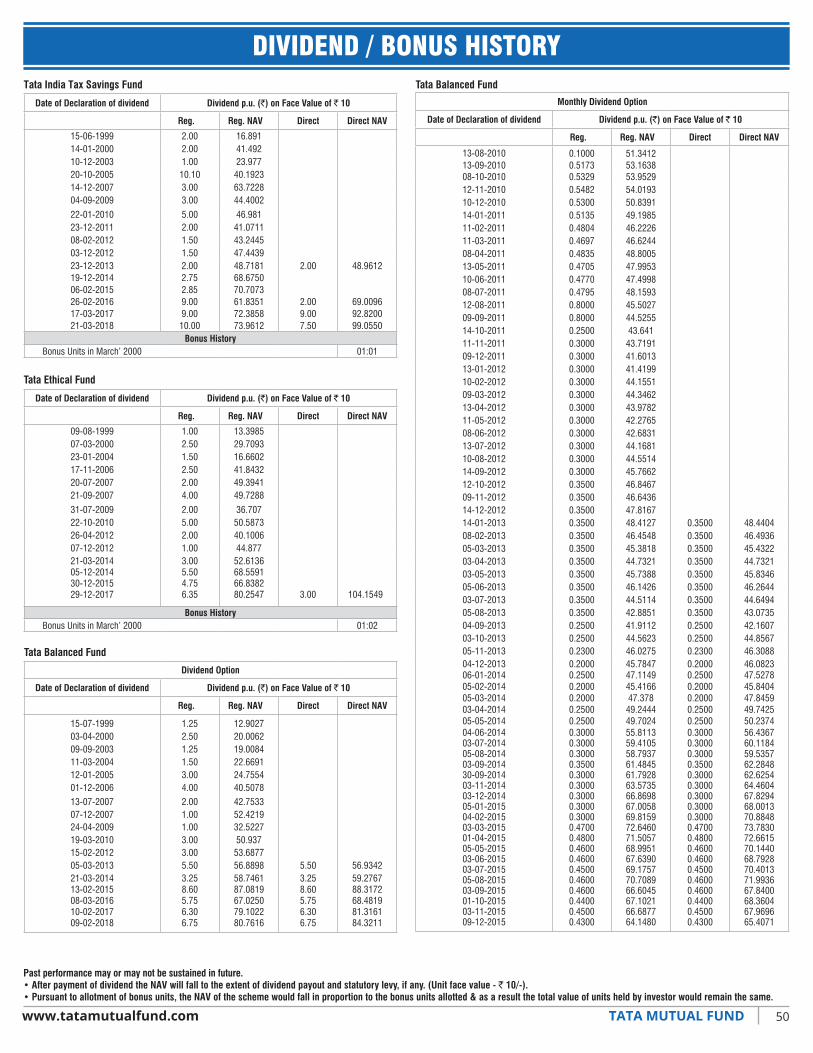
Bonus HistoryBonus Units in March’ 2000 01:02
50
DIVIDEND / BONUS HISTORY
Past performance may or may not be sustained in future.• After payment of dividend the NAV will fall to the extent of dividend payout and statutory levy, if any. (Unit face value - ` 10/-).• Pursuant to allotment of bonus units, the NAV of the scheme would fall in proportion to the bonus units allotted & as a result the total value of units held by investor would remain the same.
www.tatamutualfund.com TATA MUTUAL FUND
Dividend Option
Date of Declaration of dividend Dividend p.u. (`) on Face Value of ` 10
Reg. Reg. NAV Direct Direct NAV
15-02-2012 3.00 53.687705-03-2013 5.50 56.8898 5.50 56.934221-03-201413-02-201508-03-201610-02-201709-02-2018
3.258.605.756.306.75
58.746187.081967.025079.102280.7616
3.258.605.756.306.75
59.276788.317268.481981.316184.3211
24-04-2009 1.00 32.522719-03-2010 3.00 50.937
13-07-2007 2.00 42.753307-12-2007 1.00 52.4219
Tata Balanced Fund
15-07-1999 1.25 12.902703-04-2000 2.50 20.006209-09-2003 1.25 19.008411-03-2004 1.50 22.669112-01-2005 3.00 24.755401-12-2006 4.00 40.5078
Tata Balanced Fund
Monthly Dividend Option
Date of Declaration of dividend Dividend p.u. (`) on Face Value of ` 10
Reg. Reg. NAV Direct Direct NAV
13-09-2010 0.5173 53.163808-10-201012-11-201010-12-201014-01-201111-02-201111-03-201108-04-201113-05-201110-06-201108-07-201112-08-201109-09-201114-10-201111-11-201109-12-201113-01-201210-02-201209-03-201213-04-201211-05-201208-06-201213-07-201210-08-201214-09-201212-10-201209-11-201214-12-201214-01-201308-02-201305-03-201303-04-201303-05-201305-06-201303-07-201305-08-201304-09-201303-10-201305-11-201304-12-201306-01-2014
0.5329 53.95290.5482 54.01930.5300 50.83910.5135 49.19850.4804 46.22260.4697 46.62440.4835 48.80050.4705 47.99530.4770 47.49980.4795 48.15930.8000 45.50270.8000 44.52550.2500 43.6410.3000 43.71910.3000 41.60130.3000 41.41990.3000 44.15510.3000 44.34620.3000 43.97820.3000 42.27650.3000 42.68310.3000 44.16810.3000 44.55140.3000 45.76620.3500 46.84670.3500 46.64360.3500 47.81670.3500 48.4127 0.3500 48.44040.3500 46.4548 0.3500 46.49360.3500 45.3818 0.3500 45.43220.3500 44.7321 0.3500 44.73210.3500 45.7388 0.3500 45.83460.3500 46.1426 0.3500 46.26440.3500 44.5114 0.3500 44.64940.3500 42.8851 0.3500 43.07350.2500 41.9112 0.2500 42.16070.2500 44.5623 0.2500 44.85670.2300 46.0275 0.2300 46.30880.2000 45.7847 0.2000 46.0823
13-08-2010 0.1000 51.3412
0.2500 47.1149 0.2500 47.5278
Tata India Tax Savings Fund
Date of Declaration of dividend Dividend p.u. (`) on Face Value of ` 10
Reg. Reg. NAV Direct Direct NAV
15-06-1999 2.00 16.89114-01-2000 2.00 41.49210-12-2003 1.00 23.97720-10-2005 10.10 40.192314-12-2007 3.00 63.722804-09-2009 3.00 44.4002
22-01-2010 5.00 46.98123-12-2011 2.00 41.071108-02-2012 1.50 43.244503-12-2012 1.50 47.443923-12-201319-12-201406-02-201526-02-201617-03-201721-03-2018
2.002.752.859.009.0010.00
48.718168.675070.707361.835172.385873.9612
2.00
2.009.007.50
48.9612
69.009692.820099.0550
Bonus HistoryBonus Units in March’ 2000 01:01
Tata Ethical Fund
Date of Declaration of dividend Dividend p.u. (`) on Face Value of ` 10
Reg. Reg. NAV Direct Direct NAV
09-08-1999 1.00 13.398507-03-2000 2.50 29.709323-01-2004 1.50 16.660217-11-2006 2.50 41.843220-07-2007 2.00 49.394121-09-2007 4.00 49.7288
31-07-2009 2.00 36.70722-10-2010 5.00 50.587326-04-2012 2.00 40.100607-12-2012 1.00 44.87721-03-201405-12-201430-12-201529-12-2017
3.005.504.756.35
52.613668.559166.838280.2547 104.15493.00
05-02-201405-03-201403-04-201405-05-201404-06-201403-07-201405-08-201403-09-201430-09-201403-11-201403-12-201405-01-201504-02-201503-03-201501-04-201505-05-201503-06-201503-07-201505-08-201503-09-201501-10-201503-11-201509-12-2015
0.2000 45.4166 0.2000 45.84040.2000 47.378 0.2000 47.84590.2500 49.2444 0.2500 49.74250.2500 49.7024 0.2500 50.23740.30000.30000.30000.35000.30000.30000.30000.30000.30000.47000.48000.46000.46000.45000.46000.46000.44000.45000.4300
55.811359.410558.793761.484561.792863.573566.869867.005869.815972.646071.505768.995167.639069.175770.708966.604567.102166.687764.1480
0.30000.30000.30000.35000.30000.30000.30000.30000.30000.47000.48000.46000.46000.45000.46000.46000.44000.45000.4300
56.436760.118459.535762.284862.625464.460467.829468.001370.884873.783072.661570.144068.792870.401371.993667.840068.360467.969665.4071
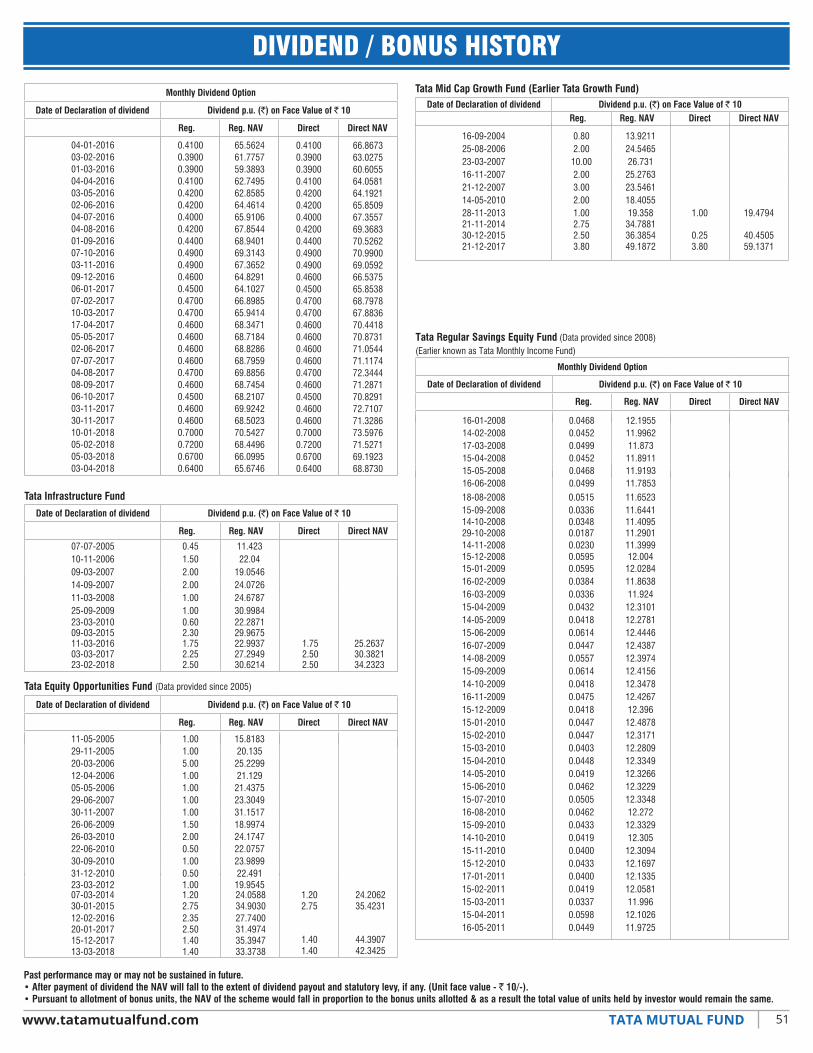
51www.tatamutualfund.com TATA MUTUAL FUND
DIVIDEND / BONUS HISTORY
Past performance may or may not be sustained in future.• After payment of dividend the NAV will fall to the extent of dividend payout and statutory levy, if any. (Unit face value - ` 10/-).• Pursuant to allotment of bonus units, the NAV of the scheme would fall in proportion to the bonus units allotted & as a result the total value of units held by investor would remain the same.
Tata Mid Cap Growth Fund (Earlier Tata Growth Fund)Date of Declaration of dividend Dividend p.u. (`) on Face Value of ` 10
Reg. Reg. NAV Direct Direct NAV
16-09-2004 0.80 13.921125-08-2006 2.00 24.546523-03-2007 10.00 26.73116-11-2007 2.00 25.276321-12-2007 3.00 23.546114-05-2010 2.00 18.405528-11-201321-11-201430-12-201521-12-2017
1.002.752.503.80
19.35834.788136.385449.1872
1.00
0.253.80
19.4794
40.450559.1371
Tata Infrastructure Fund
Date of Declaration of dividend Dividend p.u. (`) on Face Value of ` 10
Reg. Reg. NAV Direct Direct NAV
07-07-2005 0.45 11.42310-11-2006 1.50 22.0409-03-2007 2.00 19.054614-09-2007 2.00 24.072611-03-2008 1.00 24.678725-09-2009 1.00 30.998423-03-201009-03-201511-03-201603-03-201723-02-2018
0.602.301.752.252.50
1.752.502.50
22.287129.967522.993727.294930.6214
25.263730.382134.2323
04-01-201603-02-201601-03-201604-04-201603-05-201602-06-201604-07-201604-08-201601-09-201607-10-201603-11-201609-12-201606-01-201707-02-201710-03-201717-04-201705-05-201702-06-201707-07-201704-08-201708-09-201706-10-201703-11-201730-11-201710-01-201805-02-201805-03-201803-04-2018
0.41000.39000.39000.41000.42000.42000.40000.42000.44000.49000.49000.46000.45000.47000.47000.46000.46000.46000.46000.47000.46000.45000.46000.46000.70000.72000.67000.6400
65.562461.775759.389362.749562.858564.461465.910667.854468.940169.314367.365264.829164.102766.898565.941468.347168.718468.828668.795969.885668.745468.210769.924268.502370.542768.449666.099565.6746
0.41000.39000.39000.41000.42000.42000.40000.42000.44000.49000.49000.46000.45000.47000.47000.46000.46000.46000.46000.47000.46000.45000.46000.46000.70000.72000.67000.6400
66.867363.027560.605564.058164.192165.850967.355769.368370.526270.990069.059266.537565.853868.797867.883670.441870.873171.054471.117472.344471.287170.829172.710771.328673.597671.527169.192368.8730
Monthly Dividend Option
Date of Declaration of dividend Dividend p.u. (`) on Face Value of ` 10
Reg. Reg. NAV Direct Direct NAV
Tata Equity Opportunities Fund (Data provided since 2005)
Date of Declaration of dividend Dividend p.u. (`) on Face Value of ` 10
Reg. Reg. NAV Direct Direct NAV
11-05-2005 1.00 15.818329-11-2005 1.00 20.13520-03-2006 5.00 25.229912-04-2006 1.00 21.12905-05-2006 1.00 21.437529-06-2007 1.00 23.304930-11-2007 1.00 31.151726-06-2009 1.50 18.997426-03-2010 2.00 24.174722-06-2010 0.50 22.075730-09-2010 1.00 23.989931-12-2010 0.50 22.49123-03-2012 1.00 19.954507-03-201430-01-2015
1.202.75
24.058834.9030
1.202.75
1.401.40
24.206235.4231
44.390742.3425
12-02-201620-01-201715-12-201713-03-2018
2.352.501.401.40
27.740031.497435.394733.3738
Tata Regular Savings Equity Fund (Data provided since 2008)
Monthly Dividend Option
Date of Declaration of dividend Dividend p.u. (`) on Face Value of ` 10
Reg. Reg. NAV Direct Direct NAV
(Earlier known as Tata Monthly Income Fund)
16-01-2008 0.0468 12.195514-02-2008 0.0452 11.996217-03-2008 0.0499 11.87315-04-2008 0.0452 11.891115-05-2008 0.0468 11.919316-06-2008 0.0499 11.7853
15-01-2009 0.0595 12.028416-02-2009 0.0384 11.863816-03-2009 0.0336 11.92415-04-2009 0.0432 12.310114-05-2009 0.0418 12.278115-06-2009 0.0614 12.444616-07-2009 0.0447 12.438714-08-2009 0.0557 12.397415-09-2009 0.0614 12.415614-10-2009 0.0418 12.347816-11-2009 0.0475 12.426715-12-2009 0.0418 12.39615-01-2010 0.0447 12.487815-02-2010 0.0447 12.317115-03-2010 0.0403 12.280915-04-2010 0.0448 12.334914-05-2010 0.0419 12.326615-06-2010 0.0462 12.322915-07-2010 0.0505 12.334816-08-2010 0.0462 12.27215-09-2010 0.0433 12.332914-10-2010 0.0419 12.30515-11-2010 0.0400 12.309415-12-2010 0.0433 12.169717-01-2011 0.0400 12.133515-02-2011 0.0419 12.058115-03-2011 0.0337 11.99615-04-2011 0.0598 12.102616-05-2011 0.0449 11.9725
14-11-2008 0.0230 11.399915-12-2008 0.0595 12.004
29-10-2008 0.0187 11.290114-10-2008 0.0348 11.4095
18-08-2008 0.0515 11.652315-09-2008 0.0336 11.6441

52www.tatamutualfund.com TATA MUTUAL FUND
DIVIDEND / BONUS HISTORY
Past performance may or may not be sustained in future.• After payment of dividend the NAV will fall to the extent of dividend payout and statutory levy, if any. (Unit face value - ` 10/-).• Pursuant to allotment of bonus units, the NAV of the scheme would fall in proportion to the bonus units allotted & as a result the total value of units held by investor would remain the same.
Monthly Dividend Option
Date of Declaration of dividend Dividend p.u. (`) on Face Value of ` 10
Reg. Reg. NAV Direct Direct NAV
15-05-2014 0.0513 12.839112-06-201415-07-201412-08-201415-09-201416-10-201413-11-201414-01-201512-02-201512-03-201515-04-201514-05-201512-06-201515-07-201507-10-201603-11-201609-12-201606-01-201707-02-201710-03-201717-04-201705-05-201702-06-201707-07-201704-08-201708-09-201706-10-201703-11-201730-11-201710-01-201805-02-201805-03-201803-04-2018
0.04780.05630.04780.05810.05090.04460.04780.04620.04460.05410.04590.04590.05220.10000.10000.10000.10000.10000.10000.07500.07500.07500.08500.08500.08500.08500.08500.08500.08500.09000.09000.0820
13.141313.082713.060213.254813.292713.522613.842214.027114.042114.041313.844113.673013.825314.728014.611214.490814.430014.562114.471614.625914.647714.601814.600614.581414.553614.484714.435814.378014.409214.227314.118214.0956
0.04780.05630.04780.05810.05090.04460.04780.04620.04460.05410.04590.04590.05220.10000.10000.10000.10000.10000.1000
0.07500.08500.08500.08500.0850
0.09000.0820
13.143013.094
13.079213.281313.330413.570413.905814.101414.126114.122213.934313.767313.928115.032314.932014.827814.780214.932114.8550
15.180615.196015.193515.183915.1268
15.168915.1679
12-03-2014 0.0461 12.669415-04-2014 0.0581 12.6933
13-02-2014 0.0496 12.551115-01-2014 0.0513 12.7377
14-02-2013 0.058 12.856914-03-2013 0.0541 12.821115-04-2013 0.0523 12.801315-05-2013 0.0576 13.169514-06-2013 0.0513 13.057115-07-2013 0.0529 12.969416-08-2013 0.0546 12.406616-09-2013 0.0529 12.564115-10-2013 0.0496 12.7097
15-03-2012 0.042 12.181716-04-2012 0.0463 12.226315-05-2012 0.042 12.187915-06-2012 0.0449 12.243716-07-2012 0.0449 12.319216-08-2012 0.0449 12.39817-09-2012 0.0463 12.502115-10-2012 0.0405 12.620415-11-2012 0.0449 12.620517-12-2012 0.0463 12.749315-01-2013 0.056 12.9512
15-12-2011 0.0434 11.970016-01-2012 0.0463 12.035615-02-2012 0.0434 12.2860
17-10-2011 0.0463 11.902415-11-2011 0.042 11.8737
15-09-2011 0.058 12.002316-08-2011 0.0463 12.0332
16-06-2011 0.0434 11.91315-07-2011 0.0434 12.0924
Quarterly Dividend Option
Date of Declaration of dividend
Reg. Reg. NAV Direct Direct NAV
16-12-201617-03-201715-06-2017
0.30000.30000.2200
14.663014.776314.8165
0.30000.30000.2200
15.405815.574115.6701
Dividend p.u. (`) on Face Value of ` 10
Tata Young Citizens’ FundBonus History
Bonus Units in March’ 1999 01:03Bonus Units in March’ 2000 01:02Bonus Units in Nov’ 2003 01:04Bonus Units in Nov’ 2007 01:02Bonus Units in Nov’ 2010 01:03Bonus Units in Nov’ 2011 01:05
Tata Banking & Financial Services FundDate of Declaration of dividend Dividend p.u. (`) on Face Value of ` 10
Reg. Reg. NAV Direct Direct NAV
19-01-2018 1.40 17.5941
Tata India Consumer FundDate of Declaration of dividend Dividend p.u. (`) on Face Value of ` 10
Reg. Reg. NAV Direct Direct NAV
19-01-2018 1.45 18.0181
Tata Resources & Energy FundDate of Declaration of dividend Dividend p.u. (`) on Face Value of ` 10
Reg. Reg. NAV Direct Direct NAV
19-01-2018 1.30 16.0031

53www.tatamutualfund.com TATA MUTUAL FUND
HOW TO READ A FACT SHEET
SCHEDULE 3
Fund Manager: An employee of the asset management company such as a mutual fund or life insurer, who manages investments of the scheme. He is usually part of a larger team of fund managers and research analysts.
Application Amount for Fresh Subscription: This is the minimum investment amount for a new investor in a mutual fund scheme.
Minimum Additional Amount: This is the minimum investment amount for an existing investor in a mutual fund scheme.
Yield to Maturity: The Yield to Maturity or the YTM is the rate of return anticipated on a bond if held until maturity. YTM is expressed as an annual rate. The YTM factors in the bond’s current market price, par value, coupon interest rate and time to maturity.
SIP: SIP or systematic investment plan works on the principle of making periodic investments of a fixed sum. It works similar to a recurring bank deposit. For instance, an investor may opt for an SIP that invests Rs 500 every 15th of the month in an equity fund for a period of three years.
NAV: The NAV or the net asset value is the total asset value per unit of the mutual fund after deducting all related and permissible expenses. The NAV is calculated at the end of every business day. It is the value at which the investor enters or exits the mutual fund.
Benchmark: A group of securities, usually a market index, whose performance is used as a standard or benchmark to measure investment performance of mutual funds, among other investments. Some typical benchmarks include the Nifty, Sensex, BSE200, BSE500, 10-Year Gsec.
Entry Load: A mutual fund may have a sales charge or load at the time of entry and/or exit to compensate the distributor/agent.
Entry load is charged at the time an investor purchases the units of a mutual fund. The entry load is added to the prevailing NAV at the time of investment. For instance, if the NAV is Rs. 100 and the entry load is 1%, the investor will enter the fund at Rs 101.
Exit Load: Exit load is charged at the time an investor redeems the units of a mutual fund. The exit load is reduced from the prevailing NAV at the time of redemption The investor will receive redemption proceeds at net value of NAV less Exit Load. For instance, if the NAV is Rs 100 and the exit load is 1%, the investor will receive Rs 99.
Modified Duration: Modified duration is the price sensitivity and the percentage change in price for a unit change in yield.
Standard Deviation: Standard deviation is a statistical measure of the range of an investment’s performance. When a mutual fund has a high standard deviation, its means its range of performance is wide, implying greater volatility.
Sharpe Ratio: The Sharpe Ratio, named after its founder, the Nobel Laureate William Sharpe, is a measure of risk-adjusted returns. It is calculated using standard deviation and excess return to determine reward per unit of risk.
Beta: Beta is a measure of an investment’s volatility vis-à-vis the market. Beta of less than 1 means that the security will be less volatile than the market. A beta of greater than 1 implies that the security’s price will be more volatile than the market.
AUM: AUM or assets under management refers to the recent / updated cumulative market value of investments managed by a mutual fund or any investment firm.
Holdings: The holdings or the portfolio is a mutual fund’s latest or updated reported statement of investments/securities. These are usually displayed in terms of percentage to net assets or the rupee value or both. The objective is to give investors an idea of where their money is being invested by the fund manager.
Nature of Scheme: The investment objective and underlying investments determine the nature of the mutual fund scheme. For instance, a mutual fund that aims at generating capital appreciation by investing in stock markets is an equity fund or growth fund. Likewise, a mutual fund that aims at capital preservation by investing in debt markets is a debt fund or income fund. Each of these categories may have sub-categories.
Rating Profile: Mutual funds invest in securities after evaluating their creditworthiness as disclosed by the ratings. A depiction of the mutual fund in various investments based on their ratings becomes the rating profile of the fund. Typically, this is a feature of debt funds.
R-Squared: R-squared measures the relationship between a portfolio and its benchmark. It is simply a measure of the correlation of the portfolio’s returns to the benchmark’s returns.
Treynor Ratio: Treynor Ratio is a measurement of efficiency utilizing the relationship between annualized risk-adjusted return and risk. Unlike Sharpe Ratio, Treynor Ratio utilizes “market” risk (beta) instead of tatal risk (standard deviation).
Jensen Alpha: A measure of the difference between a fund’s actual returns and its expected performance, given its level of risk as measured by beta. Jensen’s Alpha is equivalent to the alpha derived from regressing the same or portfolio’s returns in excess of the risk free rate against the market return in excess of the risk free rate.