risk management and balance sheet volatility · pdf file1 | risk management and bsv during...
TRANSCRIPT

1 | R i s k m a n a g e m e n t a n d B S V d u r i n g t u r b u l e n t t i m e s
R I S K M A N A G E M E N T A N D B A L A N C E S H E E T V O L A T I L I T Y D U R I N G
T U R B U L E N T T I M E S
FRANCESCO GIULIANI

2 | R i s k m a n a g e m e n t a n d B S V d u r i n g t u r b u l e n t t i m e s
A B S T R A C T
Risk management is a very broad field. It is relevant from a theoretical point of view, given the vast amount of research describing optimal hedging techniques. It is also central in managing balance sheets, given the relevance of risk management departments in the organization of financial institutions.
Risk Management is also acknowledged by accounting standards, which allow for particular accounting treatments of certain hedging techniques (one of these is the Fair Value Hedge Accounting).
What is the purpose of risk management? Does it play a role in value creation or preservation? Should Risk Management be revisited in light of the extraordinary volatility experienced during the current financial crisis?
In addressing these questions we derive that risk management should identify some “Principal factors of risk”, and derive the exposure in relation to such factors. In determining what risk factors matter risk management should determine the statistical significance of such risk factors in explaining the evolution of the Bank’s CDS. This approach represents a strong detour from standard risk management which, traditionally, focuses on risks which are represented by the accounting reading of the balance sheet.
This strong departure leads to identifying a class of liabilities that should be designed to decrease the risk on balance sheet: we thus introduce a concept of subordinated debt which is atypical: subordinated since lower to the senior debt in the waterfall of priorities, yet with no (as of today) relevance from a regulatory point of view.
In this simple framework we address bank specific liquidity requirements and maturity transformation. Both of them have to be consistent with the definition of risk and with the capital strength of the bank, rather than identical requirements for all banks.
We also derive an alternative measure of Risk weighting factors (currently adopted in the definition of the regulatory ratios) which has to depend from the risk factors relevant for the purpose of explaining the volatility of the bank’s CDS (and ultimately its cost of funding).

3 | R i s k m a n a g e m e n t a n d B S V d u r i n g t u r b u l e n t t i m e s
QUESTIONS POSED BY THIS WORK.
This work innovates on the idea of Risk Management by investigating on a number of questions arising from the current financial crisis. This work finds its rationale in redefining the notion of risk. Hence risk management will be revisited by proposing a new approach and a specific objective.
If the CDS of the bank were an input for risk Management, then the management of a bank would have to acknowledge the volatility of the latter and recognize such volatility as detrimental to the value of the shareholder.
This approach compels the Management to acknowledge the difference between market evaluation and Balance sheet representation of the bank: equity value of a bank, in terms of book value, may remarkably differ from market capitalization; similarly, realized cost of debt may be very different from the opportunity cost of issuing liabilities at current market conditions.
The main objective of this work is the definition of a new method for risk managing the balance sheet of a bank. In its turn such a new method triggers a number of questions arising from the mere comparison with risk management, as practitioners are currently implementing it. These questions stem from the methodological differences between the two approaches. We will very briefly address such questions since the author believes they are a good test for assessing the soundness of this work.
Is accounting just a model? Does it distort management from choices which would add economic value in favor of others that preserve accounting value as represented by the Financials?
Should regulators acknowledge that certain risks are to be addressed by instruments other than rights issuance? Is equity the piece of capital structure that should be increased to address a systemic risk or should regulators give a more risk-specific answer to the balance sheet strength of the banking sector?
Is sovereign risk well measured? What are the implications of the correlation between Banks CDS and sovereign state CDS from a risk management perspective?
Are risk weights a satisfactory measure of risk on balance sheets? Is it methodologically valid to associate a risk weight to one asset, independently from the composition of the balance sheet?

4 | R i s k m a n a g e m e n t a n d B S V d u r i n g t u r b u l e n t t i m e s
These questions are at the heart of the causes of the current financial crisis, as identified by the existing literature. They also summarize most of the criticism towards risk management as implemented in current days. Hence in proposing a new method of risk managing the balance sheet of the bank, the author cannot avoid acknowledging these questions: they represent a strong test to make sure that the foundations of this Risk management method does not fall back into the flaws that literature has already identified.
Hence this work, in presenting a new risk and capital management tool, will refer to some of these questions, for the purpose of checking its soundness against the most important weaknesses of current risk management and of the definition of regulatory ratios.
This work will be based on an empirical approach, with extensive use of the statistical tool of Principal Component Analysis.
LITERATURE ON THE TOPIC
Literature on Risk Management may be divided into various strands, to be distinguished by content and chronologically.
Especially before the inception of the 2008 crisis, the most relevant contributions on the theme of risk management had its theoretical foundations commonly associated with the names of Markovitz, Sharpe, Fama, Samuelson. We deem redundant to describe the theories of Efficient Markets, CAPM and Portfolio Selection; they compose the “Modern Portfolio Theory”: not only they provide the backbone for modern financial economics but earned both Markovitz and Sharpe Nobel Prizes.
Mainly after the inception of the latest financial crisis (and still unfolding during current days), a second strand of the related literature has analyzed what went wrong in risk management and in its theoretical foundations, both from a theoretical and regulatory point of view. Contributions count a number of practitioners who have developed a summary of the many flaws that risk management departments have encountered while dealing with exceptionally volatile markets. The most recurrent theme is the difficulty of dealing with Tail events, or “Black swans”, in the metaphor of Nassim Nicholas Taleb. He also mentions, among others, the usage of quantitative risk methods (Var) over heuristic methods; and the lack of accountability of the individuals involved in risk-bearing. Gabriele Sabato points at (a) lack of a defined capital allocation strategy, (b) disaggregated vision of risks and (c) inappropriate risk governance

5 | R i s k m a n a g e m e n t a n d B S V d u r i n g t u r b u l e n t t i m e s
structure. Shojai and Feiger highlight the shortcomings of academic thought in developing models to institute enterprise wide risk management systems. They suggest a rethinking of risk management based on a 3-level schema: (i) risk at the level of the individual financial instrument, (ii) risk at the level of a financial institution holding diverse instruments and (iii) risk at the level of the system of financial institutions. A different approach in reviewing the flaws of risk management emphasizes the role of systemic risk; Lehar (June 2003) uses stock market information and estimates the joint dynamics of banks’ asset portfolios for a sample of international banks: via a Monte Carlo simulations the author estimates the joint probability of default of banks within the sample. Acharya, Pedersen Philippon and Richardson (May 2010) present a model to quantify systemic risk where the contribution of a financial institution is measured via its Systemic Expected Shortfall, i.e. the event of being undercapitalized when the whole system is undercapitalized: the authors propose a taxation based on such measure so that such externality is internalized within the financial institution. Dealing with systemic risk makes it difficult to obtain a micro-economic guidance on how to manage such risk: the regulator derives meaningful implications when managing the entire banking system. The contribution of this work is in providing an intuitive and statistical approach of systemic risk via the Principal Component Analysis: we will define principal components of risk and the one with highest explanatory power can intuitively be considered the one representing systemic risk. In this respect, management of systemic risk is internalized within the risk management of a single financial institution: this work moves away from a whole banking system assessment of systemic risk and moves the focus to the balance sheet of a single bank.
Risk management and Capital Management for banks are highly regulated fields: hence a third strand of literature analyzes the content of the regulatory innovations known as “Basel III”. As a result, Risk Management and Capital Management have adopted official models of accounting and have implemented International Financial Reporting Standards as per regulator’s requirements. Also, in the definition of capital and liquidity requirements the new Basel III regime is imposing new rules and addressing specific requirements on composition of assets and liabilities. The result is that capital management becomes the tool to be compliant with the new regime, described in the document: “Basel III: A global regulatory framework for more resilient banks and banking systems”. A field of research focuses on how Basel III plays a role in risk assessment, measurement and how it affects banks’ and customers’ portfolio selection and performance. Iannotta and Pennacchi investigate on the form of moral hazard where the current framework of Capital required for investments may lead banks to take excessive systematic risk. Some literature

6 | R i s k m a n a g e m e n t a n d B S V d u r i n g t u r b u l e n t t i m e s
focuses on the flaws of such regulatory approach: Carmassi and Micossi (2012, CEPS) emphasize that Basel solvency ratios are not easy to read, fail to identify weak banks and fail to take account of systemic risk. This work contributes on this point by proposing a new definition of Risk weights, fully deduced by the introduction of a new concept of Risk Management. Within the new definition of regulatory capital posed by Basel III and on the theme of Additional Tier 1 capital the literature produces examples of alternative securities: Pennacchi introduces, analyzes and values a new form of contingent convertible: COERC (Call Option Enhanced Reversed Convertible). This work contributes in this particular aspect by defining a new class of liability with the purpose of reducing the balance sheet volatility. On the theme of Liquidity the publications range from regulators’ opinions (Tarantola, 2008) to models of Liquidity Risk Management (Brunnermeier and Yogo, 2009) proposing a model of liquidity risk management in which a firm is subject to rollover risk.
A forth strand of literature elaborates on the principles to be respected for laying the foundations of a more mature Risk Management: Golub and Crum list and describe in detail eight lessons from the credit Crisis. Via a more quantitative approach Attilio Meucci (2011) presents the Prayer, a recipe of ten sequential steps for the risk management of portfolios with no restrictions in terms of asset classes allocation and investment horizons. The latter approach is not bank specific but seems more tailored for an asset manager.

7 | R i s k m a n a g e m e n t a n d B S V d u r i n g t u r b u l e n t t i m e s
INTRODUCTION: CAPITAL STRUCTURE, RISK MANAGEMENT AND BALANCE SHEET VOLATILITY
The importance of an analysis on the capital structure derives from the public relevance of a bank, as opposed to any other firm which, if mismanaged, may impose a loss with limited public consequences. Suboptimal capital management may generate scenarios where an excessive leverage makes the equity not large enough to absorb the volatility of assets and the CDS market quotes a higher level for insuring the debt of a bank. As a consequence higher levels of CDS are likely to be followed by higher cost of funding, hence lower profit and a higher speed of growth of the nominal debt; lower future profits ultimately lead to a slower growth of equity. At the limit then suboptimal capital structures may converge towards scenarios where the evolution of debt relative to equity make fluctuation of assets no longer absorbed only by equity, but strongly correlated with the value of debt.
When deriving the optimal level of capital structure1, highly volatile periods would require an active intervention of management in reducing leverage, in the aim of making sure that the capital structure is optimal given the volatility of assets. Last 4 years of financial crisis represent a good sample to test whether Equity and CDS evolution suggests that we were dealing with capital structures where Equity was capable to absorb a good portion of the realized volatility.
Volatility of assets is to be controlled, among various tools, via risk management; capital structure, risk management and balance sheet volatility cannot be considered independent topics.
Led by this intuition, we will make use of the Principal Component Analysis (or simply PCA) to identify if the volatility of the variables contained in the asset side is mainly explained by the debt of a bank and/or by its equity. In the first case we would conclude that the true equity is Debt, since it eventually adjusts its value reflecting the volatility of the assets, with negligible contribution of equity adjustments. This, in empirical terms, is “Equityzation of Debt”, as introduced in a previous work by the same author and here proposed again via an econometric approach2.
1 A framework where optimal capital structure is analyzed in relation with the endogenous character of the capital structure is the work by this author “Optimal Capital Structure of a Bank: the Role of Asymmetry of Information and Equityzation of Debt”. 2 See footnote 1

8 | R i s k m a n a g e m e n t a n d B S V d u r i n g t u r b u l e n t t i m e s
Far more than a mere theoretical concept, Equityzation of Debt is a signal for management that the correction of the capital structure is to be achieved, among other measures, by a reduction of Balance Sheet Variance3. If such variance is explained by means of the evolution of debt, then its cost (yield of the debt) reflects assets volatility, thus affecting profit stability across years. Ultimately suboptimal capital structures introduce too much variance on profits, which is detrimental for the equity-holder.
On the contrary, we will conclude that if equity does have a primary role in explaining the volatility of assets, then the standard subordination of Equity to Debt is respected and the capital structure is not necessarily off from its optimal point.
The difficulty in this econometric investigation lies essentially in the non observable character of some assets: hence we will have to make use of a number of proxies.
AN EXAMPLE OF PCA ANALYSIS APPLIED TO THE ASSETS OF A BANK.
A set of variable which was shocked during the financial crisis, especially during last 2 years, was the set of yields of European government bonds. We deem these variables crucial also for the purpose of approximating a number of non observable assets, like mortgages which are held on balance sheet until maturity4. The reason why we deem that the yield of government bonds is a good proxy for the pricing of the mortgages originated by the bank may be derived from the empirical analysis of prices evolution of government bonds in relation to covered bonds5. Covered bonds are priced as a spread versus the most liquid benchmark for debt in their own jurisdiction: government bonds of similar maturity. Indeed the credit enhancement received by the overcollateralization provided by a covered bond may produce up to 6 Rating notches difference between standard bank6 issuance and rating of the covered bond. We will then approximate residential mortgages, i.e. the collateral for covered bonds, with the yield of the government bonds. We remind the reader that such approximation is for the purpose of analyzing the variation in value and not absolute levels.
3 By the generic term Balance Sheet Variance we will refer to the realized volatility of the assets contained in the balance sheet of a bank. 4 Making an exception when the bank repackages them in a securitization and then sells it in the market. 5 An exhaustive definition of covered bonds is beyond the scope of this work and we invite the reader to explore the number of publications on the topic. In essence Covered Bonds are bonds issued by the bank and guaranteed by a pool of segregated residential mortgages. Such guarantee is a credit quality enhancement: hence market prices covered bonds no longer with reference to the CDS of the originating bank, but by adopting government securities as a benchmark. 6 Senior bond issuance.

9 | R i s k m a n a g e m e n t a n d B S V d u r i n g t u r b u l e n t t i m e s
Once we have represented the portion of assets allocated into government risk and Mortgages, residual assets may be represented as a diversified pool of credits. Finding a proxy for such residual set of assets is not trivial: we will make use of very liquid indices belonging to the Itraxx family of Indices, in order to obtain proxies for a diversified portfolio of (performing) credit. We will also insert proxies for high yield credit, although the author acknowledges that the actual composition of the bank’s credit portfolio is more concentrated than these indices, depending upon the expertise and the knowhow of the bank in lending to particular sectors and regions of the economy. We will discuss these assumptions below. The rationale we are following is quite simple: we assume a simple portfolio of assets that may resemble the same variables managed on the asset side by a bank; we also strive to make sure that we may approximate such portfolio with liquid variables so that we may have daily data to investigate econometrically.
We then run a PCA on such variables: we will derive that the extraordinary volatility experienced in recent years can be decomposed into few principal factors; we will also derive that such factors also have a strong explanatory power on CDS7 levels.
We will then derive that an observable variable, CDS of financial issuers, is much more than a mere derivative contract quoted by the market: it is one of the main variables to infer on the volatility of assets, even for the portion not disclosed by accounting standards.
CDS and balance sheet variance8 will prove central in the definition of risk management of the bank; standard balance sheet representation of the bank avails itself of a realized set of costs and revenues. Accounting applied to the banks’ does not consider CDS or BSV. Regulators framework to compile Financials does not recognize the relevance of these crucial inputs; we are then facing two opposite approaches: accounting well reflects the status quo, or, better, the past status, i.e. what occurred. Financial markets instead require an assessment on balance sheet soundness for the future and in relation to the turbulent times we are currently experiencing.
As an example of the PCA described above, the principal component analysis run on the last 2 years of data shows that the following variables, listed below, may be summarized in only 3 principal components, for the representation of almost 90% of the sample variation. In particular, we report the composition of
7 When refererring to CDS level, we will consider the CDS of the bank running risk management. When instead we refer to CDS of other reference entities we will be explicit or refer to indices. 8 We will denote balance sheet variance as BSV below.

10 | R i s k m a n a g e m e n t a n d B S V d u r i n g t u r b u l e n t t i m e s
the first 2 principal components which together can explain almost 83% of the sample variation.
Below we list 11 market variables and present the results of a Principal Component Analysis on a sample of approximately 2 years: such variables are chosen for their liquidity and so that the PCA is run across a portfolio representing rates levels (Swap rates for Eonia and Euribor), Credit (Itraxx indices with reference to different sectors and subordination) and sovereign yields. In a section below, dedicated to Capital Structure and regressions of CDS levels on the variables obtained via PCA, we will be more specific in adding more detail on the definition of the variables.

11 | R i s k m a n a g e m e n t a n d B S V d u r i n g t u r b u l e n t t i m e s
From the specific results of the principal component analysis we then define the following variables:
���� � �����
���� �
���� � �����
���� �
���� � �����
���� �
We will report a more detailed analysis in the appendix; we list here the weights, α, of the first 2 principal components of risk:

12 | R i s k m a n a g e m e n t a n d B S V d u r i n g t u r b u l e n t t i m e s
PCR stands for principal component of risk; the results above suggest that to explain 83% of the movements over last 2 years the risk manager may analyze 2 variables only composed by the linear combination of the variables listed above. From the sign of the weights we may understand from a risk decomposition perspective the variables moving together; the absolute magnitude of the loading factor signals the importance of the variable for the purpose of the definition of the principal component factor. Principal component 1 emphasizes that the world sees a strong correlation across the world of credit and government yields. In a second scenario, recurring less frequently (principal component 2) and independently (statistically, from PC1) credit and yield of government bonds move in opposite direction. The risk manager can then reduce the number of variables to manage from 11 to 3: this reduction in the number of variables leads to a loss of just 10% of the sample variance. These variables (or principal components) are independent, which allows the risk manager to address them separately.
THE RELEVANCE OF THE CDS LEVELS IN THIS WORK.
If management has as primary mission the maximization of return for shareholders then CDS and BSV play a relevant role. Given the leveraged nature of the banks, costs for interests on debt is a central variable in determining profit for current and future years. The author represents the cost of debt as determined by9 Euribor + CDS. CDS is the credit default swap quoted
9 Although Euribor is a parameter commonly used for Euro denominated issuance, Euribor in this work should be considered as the interbank offer rate for funds over a certain short horizon (for example 3 months), across a panel of financial institutions of primary standing, with no restriction on the currency of funds.

13 | R i s k m a n a g e m e n t a n d B S V d u r i n g t u r b u l e n t t i m e s
by the market whose reference entity is the bank itself; admittedly, the actual levels where the bank may issue its debt may be different from Euribor + CDS: the primary market will determine a premium to the current outstanding bonds’ yields for subscribing the new issuance. This is not necessarily linked to CDS levels, yet, when we analyze the aggregate bond issuance and the variations in cost for servicing the debt, the CDS is a good and readily available proxy. The reader may argue that most of the bond issuance is subscribed by retail; therefore analyzing CDS may be misleading. Yet, even in this case, the analysis should be based on the opportunity cost of debt and not on the actual cost.
If the assets due for redemption were similar in size to the issued bonds about to expire, then the reader would argue that the bank is quite hedged against adverse evolution of the credit market since a worsening of renewal conditions on the liability side (bond issuance) is matched by a higher yield on the asset side. This unfortunately is only a remote possibility since this reasoning finds its limit especially in the extreme scenario experienced during 2011. Deterioration of the credit conditions forced banks to issue debt with very short maturity (if issuance was feasible): hence transformation of maturity is more extreme especially under severe market conditions. This makes it very unlikely that Notional Amounts of debt about to be redeemed may be similar to the assets due for redemption.10
CURRENT CAPITAL MANAGEMENT (UNDER A REGULATORY APPROACH) AND IMPLICATIONS FOR RISK MANAGEMENT
Management faces then a decision: a volatile world requires active balance sheet management especially in the format of Variance management: a wrong choice may lead the market to believe that the bank is too weak against certain shocks; the number of stress tests taking place during the financial crisis is ultimately the demonstration that the market needs reassurance on the balance sheet strength of the banking sector. If it is immediate to agree upon the need of managing risk, it is not so trivial to choose a model of risk management.
In particular, when financial markets question balance sheet strength, the reply is often addressed in regulatory terms showing what would happen to Core Tier 1 Ratio under certain assumptions of stress test. Addressing balance sheet strength in terms of regulatory measures, like Tier 1 ratio, is equivalent to the adoption of a regulatory model for the assessment of the balance sheet
10 The author has explored the evolution of liquidity and the problem of rolling debt under severe market conditions in the work “CDS: Liquidity Shortage or Structural Insolvency?”
14 | R i s k m a n a g e m e n t a n d B S V d u r i n g t u r b u l e n t t i m e s
soundness and for the purpose of running risk management11. In essence such model is based on a notion of equity, or core capital, equal to the raised capital and the sum of past profits12 : the limitation is that past profits are a pure accounting measure. More simply, if a loss is not realized, it does not participate to the computation of the yearly profit: hence it does not affect the computation of Core Capital. This is relevant, for example for the book of Loans and Receivables13, which contains most of the credit originated and represents for the majority of banks the most relevant book (by dimension) within the assets. In the regulatory framework such a notion of capital, which allows for latent losses, is the buffer for risk. Risk instead is defined as a fraction of the assets. Such fraction is named “Risk weight”. Risk weighted assets are the sum of all assets, multiplied by their respective risk weights. If we try to read the rationale behind it, a risk weight should be the loss (in percentage points) that could be possibly realized on such asset and that would imply a deduction from capital if realized14. Once we consider the ratio between the Core Capital as previously defined and the Risk weighted assets then we obtain the leading indicator (in a regulatory world) of balance sheet strength.
��� � ������
Given that the numerator is an accounting measure of capital, it may substantially differ from a credible capital measure from the viewpoint of financial markets: in other words market capitalization of a bank may be a percentage, sometimes even well below 100%, of the book value. Such a difference clearly has many reasons to exist: one of them is that the market believes too many assets are marked on balance sheet above their market value, hence the value of the bank quoted in terms of market capitalization, is well inferior to the “Tangible Value” deduced from the balance sheet.
The importance of the risk weights is then crucial given that the numerator is purely an accounting measure: from a methodological point of view an asset whose losses may not be deducted from capital unless realized cannot receive a zero risk weight unless there is absolute certainty, especially at a regulatory level, that any future decline in value of the asset will be only temporary and led only by demand supply dynamics rather than fundamental reasons of deterioration. 11 Here the terms of Risk Management also includes the notional of Capital Management given that risk ultimately affects, with gains and losses, the consistency of capital. 12 We will expose the rationale behind the construction of Core tier1 ratio, sometimes with an oversimplification meant to address more effectively the questions of this work. 13 The accounting treatment of the assets in the category “Loan and Receivables” is compliant with the rule of amortized cost, hence only an impairment would decrease the value during the life of the assets. 14 This rationale holds well for the majority of assets, whose risk weight is below 100%

15 | R i s k m a n a g e m e n t a n d B S V d u r i n g t u r b u l e n t t i m e s
From a capital management point of view an asset whose fall in value would never contribute to a decrease of the numerator and never increase the denominator is an asset with infinite return on (regulatory) capital: if its cost of financing is lower than the yield of the assets, then management has an incentive in choosing such investments in large notional (maybe ignoring the actual volatility of the asset), especially when operating in a context of high scrutiny of capital ratios and poor profitability. Indeed such asset is simply disregarded until default (or impairment) from capital considerations.
The author believes that Capital Management from a regulatory point of view should be very different from a Capital Management oriented to the creation of value for shareholders. As mentioned before, at least two variables will be crucial when proposing a framework to run a modern risk management: CDS and BSV.
READING PCA AND IMPLICATIONS FOR RISK MANAGEMENT: INTRODUCTION TO PCA RISK MANAGEMENT
In assessing on balance sheet risk we will start from a pure market approach and then gauge what relevant market variables should be considered when running risk management. Given that
������ � �����������
Then
��� ������! � ��� �����������! Where, as mentioned above, the market value of some assets are not disclosed within financials. On the liability side, instead, we may derive from the CDS level the representative market value of all senior debt; the market capitalization of the bank will be considered the evaluation of equity 15 . Deposits are guaranteed and subject to first call reimbursement, hence for the purpose of this work their variance will be deemed equal to zero.
Assets are not as easy to model, since their composition is not immediate to reconstruct; some assumptions will have to be made so that assets may be represented by means of liquid variables. The purpose is not to represent the value of the assets, but to reconstruct a valuable framework for risk
15 We may also introduce the CDS for subordinated debt as representative of the stock of subordinated debt: this will not change significantly the conclusions of this work.

16 | R i s k m a n a g e m e n t a n d B S V d u r i n g t u r b u l e n t t i m e s
management, which requires a good representation for the variation (and not for the absolute level) of the assets.
We will therefore consider the asset side of the bank’s balance sheet as a basket of credits where government risk represents a portion of financial assets and an important component of residential mortgages16 risk. We will also represent the remaining portion of credit by adopting diversified indices of CDS, the Itraxx Main Europe and Itraxx Main Crossover. The reason for such choice of representation is that once we exclude mortgages, government bonds and Cash, the remaining portion of assets is allocated into a diversified portfolio of credit. The latter will be performing for its main portion and a subset will instead deteriorate in its credit quality. Hence the performing portion of credit will be approximated by Itraxx Main Europe, which by definition comprises 125 equally weighted credit default swaps on investment grade European corporate entities (the composition and description will be in the appendix). We approximate the non performing portfolio with the Markit iTraxx Europe Crossover index since it comprises 50 equally weighted credit default swaps on the most liquid sub-investment grade European corporate entities The reader may argue that a bank is not exposed to such a diversified basket of credit (from an international point of view). If this is the case, then the component of higher national concentration will be closer to the evolution of national government risk, which is already included in the sample to be analyzed via PCA. We will also add to the variables swap rates (with different tenor, 2 years and 10 years, having as underlying the floating parameter Euribor and Eonia).
We will analyze this basket to investigate under a principal component analysis the definition of risk (in terms of principal components of risk). In other words, when dealing with so many variables and a diversified portfolio of credits, the bank would run risk suboptimally if it ignored the correlation across such portfolios and if it contemplated managing risks one by one. Principal component analysis defines, from hystorical data, the principal factors of risks explaining most of the variance of the assets. We will denote such Principal Components of Risk as PCR.
16 This assumption reflects the empirical fact that covered bonds are priced as a spread with respect to the government bond of similar maturity: the rating of the covered bond is so much higher than the bank issuing the “covered “ obligation that most of the credit risk of a Covered Bond is in the residential mortgages contained in the asset pool representing the segregated collateral. If a covered bond is then priced as a spread to government bond, we find that the assumption to represent mortgages by the government proxy is good enough for analyzing the variation in their values.

17 | R i s k m a n a g e m e n t a n d B S V d u r i n g t u r b u l e n t t i m e s
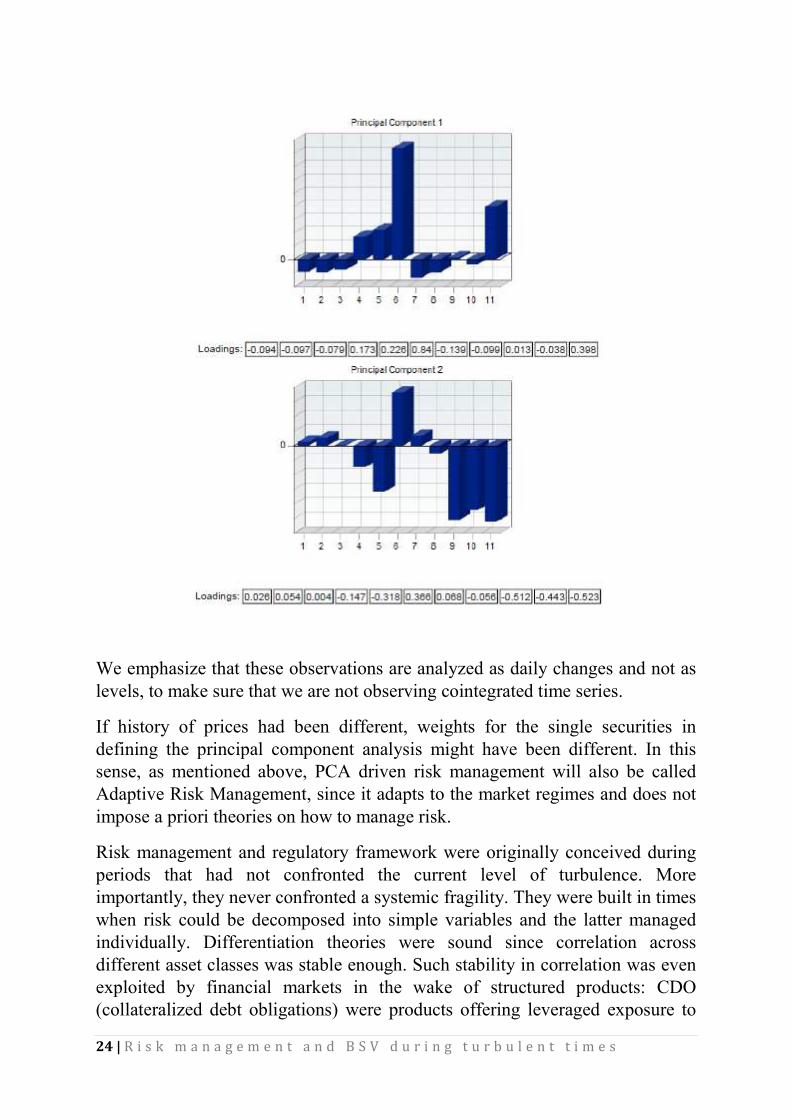
Following in a histogram format are the loadings of each variable in defining PCR(1) and PCR(2).

18 | R i s k m a n a g e m e n t a n d B S V d u r i n g t u r b u l e n t t i m e s
If the representation of the asset could be deemed correct, then PCA Risk management would allow the following considerations:
1. The worsening of the credit conditions of government bonds is simultaneous with the deterioration in quality of subinvestment entities. The first Principal component of risk also signals that the drivers in such market movement (representing over 60% of the variation of the portfolio) are the index Crossover, the yield of Italian Government bonds and the yield of Spanish government Bonds.
2. In such credit deteriorating market rates decrease (and we will specify below why this remark may turn important for the risk manager).
3. A remaining 23% of the variance is explained by government bonds moving in opposite way with respect to Crossover. This latest analysis emphasizes the importance of government bonds as a variable: not only they are relevant when analyzing the first PCR (typically the first PCR represents the systemic risk in the economy), but a further 23% of the variance is mainly driven by their movements.
4. Government bonds and Crossover have the highest loading factor in defining the PCR, whereas the weights of interest rates are contained.

19 | R i s k m a n a g e m e n t a n d B S V d u r i n g t u r b u l e n t t i m e s
5. German Government bonds’ yields move in the direction opposite to the movement of the remaining government bonds.
Next question relates to capital structure: who bears all the variance borne by the assets? How is it distributed across equity and debt? Is equity a relevant variable in explaining the volatility of assets? In this new framework the definition of Equityzation of Debt, intuitively given above, may be rephrased quantitatively (we will explore the theme of capital structure below, when running specific econometric assessments on PCR based on a sample of European banks).
Every bank should add to this framework all the relevant (internal) information that would make the analysis more specific, especially when approximating the market value of the assets.
It is immediate to identify the bold differences between a regulatory approach and a PCA Approach: the first defines the risk factors and their relevance by the adoption of Risk Weights. Principal Component Analysis analyzes the behavior of assets and provides few risk factors: it then restricts the attention from a plethora of variables to very few.
Leverage or deleverage policies can then be implemented by looking at risk factors primarily. Deleverage is ultimately a reduction on BSV and can also be achieved if financial markets quote derivatives on (some of) the principal factors identified by PCA. We will also introduce below a specific example on how to originate a new set of subordinated liabilities with the purpose to reduce balance sheet variance.
Also, hedging does not have to observe rigidly the definition of the Principal components of risk: it is evident for example that if the risk manager buys protection on the index Crossover, in over 60% of the movements he will have a benefit also in the scenario of a deterioration of a government position. Also, interest rates movements do not seem to have a particular role in explaining risk during last year.
How would the analysis change if, rather than 1 year the risk manager chose 2 years of history? We will define PCA Risk Management as “Adaptive” since it displays correlations as they realize within the data sample; clearly with a different time series the definition of risk factors may be different. Hence, as time evolves, PCA ran to the latest window of data will adapt to new correlations shown by the market.
We note even from a graphical approach that the first component of risk factor does not significantly change (both in its percentage of explained variance and

20 | R i s k m a n a g e m e n t a n d B S V d u r i n g t u r b u l e n t t i m e s
in its loadings). Hence, although we are considering the most volatile years in financial history, the expansion of data by inclusion of 1 more year make the PCA risk management not too data sensitive.
In this work we are applying a very basic implementation of PCA: a field of literature explores how to make PCA and Functional PCA more robust to data and time variation. Ideally PCR should be temporally and market consistent to produce a consistent risk management. While the purpose of this work is to propose a new idea of risk management, the author acknowledges that the statistical tools here adopted are by choice the simplest: further literature develops the theme of how PCA can be best adapted to the features of financial time series. Ramsay & Silverman and Hamilton are excellent for an introduction
21 | R i s k m a n a g e m e n t a n d B S V d u r i n g t u r b u l e n t t i m e s
to Functional PCA. Also, Jaimungal & Eddie K.H.Ng (2007) propose to remove the temporal structure embedded in the time series so that the principal components can be extracted in a self consistent manner. Among the practical implications, the authors show that a sample perturbation produces a higher difference on the standard principal components as opposed to the principal components obtained via the method they propose.
PRACTICAL IMPLICATIONS: WHEN REGULATORY FRAMEWORK DIVERGES FROM PCA DRIVEN RISK MANAGEMENT
In spite of the simple framework here adopted, it is immediate to derive that a PCA derived risk management may lead to conclusions quite divergent from the regulatory/accounting model of risk management. Yet the latter is imposed by regulators, hence it is widely used in the banking sector, at least at the stage of computing capital and solvency requirements to be published within Financials.
This is the stage where management must take a view on the theme that the accounting definition of capital may diverge from economic capital. It must also take the view that risk from a regulatory viewpoint may be a different notion from the one identified by a PCA driven risk management.
In this section we will make one example, relating to interest rates risk. Interest rates risk is the risk that a change in interest rates may cause a change in the value of the asset (or the liability). Interest rates risk is quite closely monitored by regulators who impose, among various requirements, that a (potential) change17 in interest rates of 2% should not (potentially) reduce the regulatory capital by more than 20%.
Interest rates risk was so central until few years ago that Banks ALM department were considering it as the absolute priority. The rationale behind it is quite easy to interpret: managing interest rates risk would decrease the potential change in the value of assets and liabilities. Hence, ultimately, reducing this risk would mean a smaller variability on the capital of the bank.
Balance sheet items typically hedged against an interest rates move are mainly loans where the borrower pays fixed rate or debt where the bank pays fixed rate. The overall idea is to hedge the net exposure (after a “natural hedge” effect between assets and liabilities) to interest rates. This reasoning was leading ALM departments to identify a net interest rates exposure by maturity (sometimes
17 Meant as absolute variation.

22 | R i s k m a n a g e m e n t a n d B S V d u r i n g t u r b u l e n t t i m e s
called “buckets”). Such interest rates exposure is most of the times hedged via an accounting scheme18 called “Fair Value Hedge Accounting”.
Fair Value Hedge accounting is a hedging technique whereby an asset (Hedged Item) is hedged against, for example, a rise in interest rates (Designated Risk), by a derivative contract (Hedging Instrument)19. Hence, if, for example, we consider a fixed rate Mortgage and interest rates rise, the Mortgage will lose value and such value loss will be associated in accounting terms to a derivative contract gaining value in the same scenario. A similar reasoning (although on the liability side) may be made in terms of ordinary bond paying fixed rate coupon.
The ultimate question is: will assets and liabilities paying fixed rate be actually worth more due to a drop in interest rates?
Adopting Fair Value Hedge Accounting (below FVHA) means an affirmative reply to all last question. We may ask the same question to PCA and then deduce if FVHA is an efficient tool in preserving the value of assets and liabilities. More generally, we may ask the same questions analyzing the same portfolio of variables presented above: we will then determine if, in the context of an entire portfolio, hedging the interest rate component adds stability to the portfolio or produce an increase in variance.
More specifically, we will determine if an increase in interest rates does actually primarily imply a reduction of value in Government bonds.
We have emphasized above that interest rates loading factor in the definition of the first principal component of risk (PCR) is negligible with respect to the loading factor of the government bonds. We deduce that preserving the value of government bonds is not an issue of interest rates. However the conclusion may significantly change if we consider German government bonds rather than Italian/ Spanish government bonds. The conclusion would be opposite: a PCA driven risk management would encourage not to take positions on interest rates since a rise in yield in Spanish government bond is simultaneous with lower interest rates (loading weight have the opposite sign). What conclusion would we derive if instead we analyzed last 4 years? The reader should be aware that observing the last 4 years is equivalent to testing the PCA Risk Management against the 4 most volatile years after the Great Depression. As a result PCA
18 This section does not mean to list all accounting schemes implemented to manage risk. It simply provides examples to hint at the drastic change in approach PCA risk management may mean. The ultimate conclusion is that there is a chance that currently risk management is amplifying risk and not reducing it. 19 The author acknowledges that such a definition is reductive, yet it suffices for the purpose of this work.

23 | R i s k m a n a g e m e n t a n d B S V d u r i n g t u r b u l e n t t i m e s
risk Management immediately lowers the explanatory power of the first Principal Component of Risk.
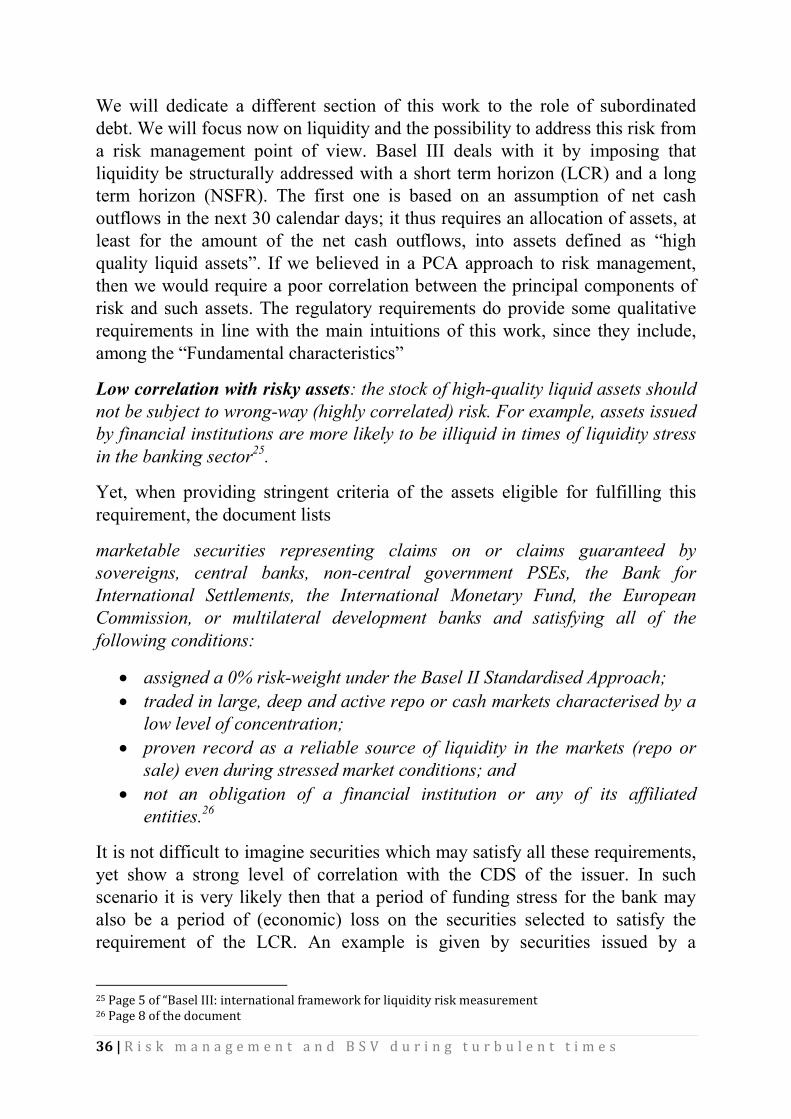
German government bonds would have been stable in their value if their interest rate risk had been hedged but the same cannot be stated for all other bonds. It is evident simply by graphical approach that the principal component points at a deterioration first of the subprime world (Index Crossover has the highest loading weight). Instead the second Principal component of risk also associates a high loading weight to the government bonds of peripheral countries.
24 | R i s k m a n a g e m e n t a n d B S V d u r i n g t u r b u l e n t t i m e s
We emphasize that these observations are analyzed as daily changes and not as levels, to make sure that we are not observing cointegrated time series.
If history of prices had been different, weights for the single securities in defining the principal component analysis might have been different. In this sense, as mentioned above, PCA driven risk management will also be called Adaptive Risk Management, since it adapts to the market regimes and does not impose a priori theories on how to manage risk.
Risk management and regulatory framework were originally conceived during periods that had not confronted the current level of turbulence. More importantly, they never confronted a systemic fragility. They were built in times when risk could be decomposed into simple variables and the latter managed individually. Differentiation theories were sound since correlation across different asset classes was stable enough. Such stability in correlation was even exploited by financial markets in the wake of structured products: CDO (collateralized debt obligations) were products offering leveraged exposure to

25 | R i s k m a n a g e m e n t a n d B S V d u r i n g t u r b u l e n t t i m e s
defaults of multiple entities and priced with reliance on stable correlation (implied by the correlation market and by the actual stability of realized correlation).
In its own way the bank deals with a leverage exposure to plenty of variables too: a risk management cannot ignore the correlation across all of them. The bank also needs a focus on fewer variables to understand where the core risk is and how it affects the perception of the riskiness of the bank on the market (i.e. the CDS level). That is why risk weight factors and balance sheet policies cannot be properly addressed if not within an aim to control (realized) Balance Sheet Variance and the CDS of the bank.
Some readers may object to the mentioned divergence between PCA approach and Fair Value Hedge accounting, by emphasizing that the reason why a drop in interest rates is simultaneous with a drop in the value of some government bonds is due to the credit deterioration priced by the market against sovereign risk. Hence the interest rate risk is properly addressed by risk management; Credit risk is not addressed since the purpose of the investment is to monetize the credit risk priced by the market for government bonds. This kind of objection finds its rationale in the logic division between credit risk and interest rates risk. Principal component analysis hints that a risk management does not have to take as given the number of risks to analyze. PCA driven risk management asks history what relevant variables of risk are to be considered. Credit and rates move together, hence addressing them separately may lead to amplifying risks rather than managing the balance sheet variance (even if the latter may not be measured by the accounting model).
Furthermore risk is not necessarily to be avoided, otherwise we could not expect profitability either. Uncorrelated (or poorly correlated) risk contributing only marginally to the balance sheet variance may provide, ceteris paribus, a high return on economic capital (even if such conclusion may not apply in regulatory terms).
Increasing interest rates have the property to be negatively correlated with credit deterioration during the financial crisis: a reduction on interest rates was simultaneous with an increase in yields of many securities. Hence to hedge the interest rate risk component of such securities may have reduced the volatility (ex ante) in terms of regulatory capital, but it did not have the same result in terms of Balance sheet variance (hence volatility of economic Capital).

26 | R i s k m a n a g e m e n t a n d B S V d u r i n g t u r b u l e n t t i m e s
THE RATIONALE BEHIND PCA RISK MANAGEMENT AND INVERTED CAPITAL STRUCTURE.
It is evident to the reader that the term risk management is adopted with a wide meaning by also including Capital Management: in the author’s opinion only a unified frame may bring together 2 sides of the same coin: risk ultimately has to do with capital, since a high balance sheet variance will eventually require capital to absorb potential negative realizations.
The rationale of this work until now can be summarized as follows: banks operate on balance sheets whose volatility of assets is significantly underestimated by Financials. Accounting may not prove a good model to estimate the risk represented by assets, primarily because it was not conceived for managing risk. The author proposes an approach which merges the intuition of the critical variables to manage (management is supposed to have a view and a deeper knowledge of the balance sheet assets) with a statistical approach (principal component analysis) that may help in identifying the main factors of risk.
Clearly running a PCA on the assets of a bank requires a strong modeling effort; this implies the introduction of assumptions and proxies to simulate a market value even for the illiquid assets of the bank. In this theoretical world where assets can be scrutinized in their evolution in value, then Risk management should derive the main risk factors and focus on the management of very few variables: the few that have the highest explanatory power on the variance of assets, or, as per previous notation, PCR. By doing so, the value of equity is preserved and its variance is the result of the managed variance on the asset side.
If instead the assets cannot be clearly monitored to gather observations and therefore a principal component analysis cannot be run, then the author approximates the assets with some liquid variables: we derive some principal component factors which may be considered the main building block of risk in terms of liquid variables traded in the market. Risk management may consider such variables when hedging risks, aiming at choosing hedging policies which reduce variance of the assets.
This theoretical approach may find its limit in the error of approximating the behavior of assets by means of liquid variables. This is the reason why, once obtained the PCR from liquid (and approximating) variables, they must be validated in their explanatory power. Therefore we go back to the results of the PCA presented at the beginning of this work: we use the obtained PCR in a linear regression model and assess if they can be considered good regressors for

27 | R i s k m a n a g e m e n t a n d B S V d u r i n g t u r b u l e n t t i m e s
the daily differences of the values of debt and/or equity. We may then expect various outcomes:
a) PCR have no explanatory power on equity nor debt: hence the approximation of risk via PCR does not properly address the volatility of assets and therefore PCR cannot explain the volatility of liabilities.
b) PCR have a satisfactory explanatory power on equity, but not on debt: this is a signal of a healthy capital structure, since the equity is more reactive than debt and most of the volatility of assets is absorbed by equity. Therefore we cannot conclude that the level of capital structure is off its optimal point. Also PCR obtained via liquid (approximating) variables may be considered explanatory variables for the evolution of assets.
c) PCR have a satisfactory explanatory power on debt, but not so satisfactory on equity. If this is the case, then debt is absorbing most of the volatility of the assets and therefore we conclude that (form a strict economical point of view) the bank is operating under an inadequate capital structure since the role of equity is being played by debt. We might define in this framework Equityzation of Debt as a difference between Debt regression R Squared and Equity regression R Squared being too large.
By debt regression we mean the linear regression as per equation below:
" � #�� $ ����� % �� $ ����� % &
Where we consider the first 2 PCR as regressors and we gauge the explanatory power of their daily variations on the daily variations of the CDS (y) of the Bank whose risk management and capital structure we are evaluating.
Point (a) above means that PCA Risk Management did not guess the right Principal components of risk, which were derived from the most liquid variables representing Rates risk, Government risk, and Credit Risk. Point (a) is a simple assessment that such a guess may be misleading, since we are dealing with PCR that have nothing to explain on balance sheet variance. If instead we are under the scenarios described under point (b) and (c), then PCA risk management has a strong descriptive power on the risk that the bank is handling. In this sense PCA driven risk management may be considered a new tool of risk management since it decomposes risk into independent factors, which can be handled separately.
If PCR provide a satisfactory explanatory variable on debt (and/or equity) management cannot ignore if the capital structure is best described under point

28 | R i s k m a n a g e m e n t a n d B S V d u r i n g t u r b u l e n t t i m e s
(b) or (c). A comparison across R Squared (Debt versus equity) is the judgment of Markets on the soundness of capital of the bank, in spite of any regulatory opinion or assessment.
PCA Risk management allows the computation of R Squared coefficients which may lead to further conclusion on the current status of capital structure. Provided at least one of them is higher than 50%, then we find useful to analyze their joint evolution through time. We may thus analyze an evolution in continuous time of balance sheet ratios versus a regulatory world where they are released only on a discrete time schedule and they are dependent on accounting rules/choices. Given the relevance of the R squared coefficients in this work we will refer to
i. R squared obtained by regressing the daily differences of the CDS onto the daily differences of PCR: such coefficient will be denoted as �'()*�
ii. R squared obtained by regressing the daily differences of the stock value of the banks onto the daily differences of PCR: such coefficient will be denoted as �'()��
We will define “Inverted Capital Structure” the event
�'()�� + �'()*�
Regardless from the regulatory compliance of solvency ratios, Inversion of capital structure has a warning power for management: debt is more reactive to equity and therefore signals that Equity may no longer be capable to absorb the risk handled by the bank. #�'()�� and �'()*� represent the PCA Risk Management statistics for capital structure (“PCR Statistics” in the remaining part of this work).
We will compute the PCR Statistics for the banks contained in the 12th series of the Itraxx Index “Senior Financial”.
DATA AND COMPUTATION OF PCR STATISTICS
The data used is the set of daily levels for all “liquid variables” listed at the beginning of this work (and described again in the table below): from running a Principal Components Analysis we derive 3 principal components of risk, or PCR. We then regress the daily differences of CDS onto the daily differences of PCR and we interpret the R square as the degree of the reactiveness of Debt to the variation in value of assets in the sample period.

29 | R i s k m a n a g e m e n t a n d B S V d u r i n g t u r b u l e n t t i m e s
We then run a similar regression where we stock’s price onto the PCR and we interpret the reactiveness of Equity to the change in value
The sample period is the set of daily observations from 330 March 2012 (514 observations). The banexplained in terms of PCR are
1. Banca Monte dei Paschi di Siena SpA 2. Credit Agricole SA 3. Intesa Sanpaolo SpA 4. BNP Paribas SA (BNP)5. Societe Generale SA6. Deutsche Bank AG7. Commerzbank AG 8. Banco Santander SA9. Credit Suisse Group AG10. Ubs AG (UBS)
Hence first we will run a PCA on these variables and then we will regress the daily differences of CDS listed above on the first 2 PCR obtained from the 11 above. Hence we will obtain specific parameters for the CDS equity) of each of the bank in the sample.
R i s k m a n a g e m e n t a n d B S V d u r i n g t u r b u l e n t t i m e s
We then run a similar regression where we regress the daily variations of the stock’s price onto the PCR and we interpret the R square as the degree of the
the change in value of assets in the sample period.
The sample period is the set of daily observations from 3rd of March 2010 until 30 March 2012 (514 observations). The banks whose CDS and equity Priexplained in terms of PCR are
Banca Monte dei Paschi di Siena SpA (Monte) Credit Agricole SA (Calyon) Intesa Sanpaolo SpA (Intesa)
(BNP) Societe Generale SA (SocGen) Deutsche Bank AG (DB)
(CMZB) Banco Santander SA (Santander) Credit Suisse Group AG (CS)
The liquid variables are
Hence first we will run a PCA on these variables and then we will regress the daily differences of CDS (and equity values) of each of the 10 banks listed above on the first 2 PCR obtained from the 11 liquid above. Hence we will obtain specific parameters for the CDS
each of the bank in the sample.
R i s k m a n a g e m e n t a n d B S V d u r i n g t u r b u l e n t t i m e s
the daily variations of the R square as the degree of the
of assets in the sample period.
of March 2010 until ks whose CDS and equity Price are
Hence first we will run a PCA on these variables and then we will regress of each of the 10 banks
liquid variables listed above. Hence we will obtain specific parameters for the CDS (and the

30 | R i s k m a n a g e m e n t a n d B S V d u r i n g t u r b u l e n t t i m e s
We note that within the same country the R squared20 coefficients suggest a comparison on different banks’ capital structure; also the estimated regression parameters show that CDS movements can be better explained via PCR (with respect to equity) when the bank is renowned to be less capitalized (comparison within the nation).
The fact that standard risk management never considers PCR, or the level of the CDS and its volatility, is one of the reasons why the author believes that risk management as run until recent days may have focused primarily on a notion of regulatory capital as opposed to economic capital.
The roles of PCR and CDS are also quite powerful for management in its investment decisions. The most suitable investments are the ones which, ceteris paribus, exhibit a poor correlation with PCR. Risk weight factors (as they are defined today) may be misleading since they provide incentives to invest into assets which require no or little regulatory capital, yet they may prove correlated with PCR. In case of inversion of capital structure, assets may exhibit a strong (positive) correlation with CDS. We will explore this theme in depth below.
SOLVENCY RATIOS: A PROPOSAL TO MERGE PCA WITH ACCOUNTING
We have emphasized the limits and the rationale of the regulatory framework when it defines capital and risk weight factors. On one hand we acknowledge 20 Adjusted R squared

31 | R i s k m a n a g e m e n t a n d B S V d u r i n g t u r b u l e n t t i m e s
the need to build a framework not too market oriented. A limit of the PCA approach is that it derives from a market evaluation of risk. Hence such a risk management could overreact in case the market is stressing some market variables as a result of panic behavior or lack of liquidity21. On the other hand ignoring the market pricing may lead to divergences where the market sees the banking sector as too opaque and too fragile to be a credible market player. Hence this section is dedicated to the proposal of a new solvency ratio which, on one hand considers the accounting input and on the other embeds the most relevant conclusions here drawn in terms of risk management and Principal Factors of risk.
Hence we propose a Solvency Ratio where the numerator is derived from an accounting measure of profits and is identical to the one considered in the Core Tier 1 Ratio. The implicit assumption that we are making is that the numerator, as a measure of available capital, has to reflect a long term measure which, accounting models can provide. Ultimately if management has decided that some assets are not impaired in spite of their loss in value, they deem that they will recover the unrealized losses and therefore the accounting measure will prevail in the long term as a capital measure. On the other hand, to make the measure of Tier 1 Capital credible, the latter cannot be composed of latent losses for a percentage higher than k%, which is the reason why we introduce point (b) below.
On the denominator we will give a different rule of construction, derived from the main concepts exposed in this work.
The denominator will be a sum of the assets multiplied by a risk weight factor, similarly to the approach of risk weights as currently adopted. The only difference derives from the definition of risk weights which will depend, among others, upon the correlation between the yield of the assets and the CDS of the bank (or with respect to the principal risk factors identified by running a PCA on the assets). Such a definition of solvency ratio will encourage management to build a composition of assets aligned with a correct computation of risk reward in the metric of the balance sheet volatility. In this light a low yielding asset, yet poorly (or negatively) correlated with the evolution of the principal component of risk may be selected as a good investment by management.
In line with the reasoning so far exposed, the definition of risk weights will be dependent on asset specific factors and bank specific factors. The considerations to be blended for the purpose of enhancing the significance of capital ratios are 21 The author also believes that PCRs derived from a history of data of 2 years and more do not expose to the risk of running a risk management based on variables biased by panic or overreactions, under the belief that panic cannot last for such a long amount of time.

32 | R i s k m a n a g e m e n t a n d B S V d u r i n g t u r b u l e n t t i m e s
a) The explanatory power of the PCR on the stock of the bank and more importantly its debt (or CDS). If a bank is characterized by very contained Balance sheet variance (relative to its capital structure), then the incentive in adding among its assets a PCR correlated security should be treated differently from the same choice of another bank with high level of PCR Statistics. This point is very financial institution subjective and forces management to keep under control the balance sheet from cumulating too much systemic risk. This point is also asset non specific, since it does not depend on the single asset whose risk weight we are about to determine.
b) The potential (accounting wise) that a large not realized loss is not deducted from Tier 1 Capital. In order to address such issue the bank should not exceed a certain percentage of Tier 1 Capital in terms of latent losses, (hence not deducted from Tier 1 Capital). In simpler terms: unrealized losses not deducted from Tier 1 Capital cannot represent more than k% of the tier 1 capital. If they turn to be higher then the amount in excess has to be deducted from the numerator of the Tier 1 Ratio. This requirement allows market players to believe in the intrinsic amount of published capital by suggesting that a haircut (to the amount of Tier 1 Capital and to the published ratios) higher than k% is too conservative. It also makes different banks comparable since two banks with and without latent losses over k% should reflect such difference. This requirement is also not asset specific. k should be a variable chosen by regulators.
c) Correlation between the asset yield and the level of CDS: this factor is asset specific and encourages management in selecting investments efficient in terms of minimum correlation with the yield of senior debt to be issued. This can be seen as a liquidity requirement blended in the definition of Risk weights. It is important to notice that a negatively correlated asset may generate therefore a negative risk weight, since the correlation would be negative. This would be an important incentive in not looking at the yield only of the asset but to apply a portfolio approach achieving the minimum balance sheet variance. We will denote this factor as ,"� - �./�, i.e. the correlation between the asset yield "� and the CDS of the bank. This point can be seen as a specific implementation of point (a).
d) Historical average 22 in the last 2 years of the implied probability of default derived from the CDS market. When a CDS market does not exist for the specific issuer, then a similar average should be computed in
22 Such hystorical average may be computed over a number of years equivalent to the residual maturity of the assets. For a matter of homogenous treatment of data the author prefers an average over the same history of data used to compute PCRs.

33 | R i s k m a n a g e m e n t a n d B S V d u r i n g t u r b u l e n t t i m e s
terms of the closest comparable by rating and sector. Such average allows smoothing out periods of panic in the market and should be multiplied by (1-r), where r is the recovery value used as input to obtain the probability of default from the historical level of CDS. We will denote the probability thus derived as p.
Hence the risk weight for a specific asset i whose yield is "� would be, according to the criteria listed above:
�'()�� % �'()*�! $ ,"� - �./� $ 0 $ � 1 �0��
ACCOUNTING AND RISK MANAGEMENT: TIME TO USE A UNIQUE LANGUAGE?
Even if the reader agreed with most of the proposals and conclusions contained in this work, the implementation would face a technical difficulty: if management found a hedging technique which could reduce the balance sheet volatility, then what accounting format should be used? Any practitioner is aware that the adoption of derivatives as a hedging instrument is contemplated by IAS within a set of rules defining Hedge Accounting. Hedge Accounting has the ultimate rationale is to preserve the value of the Hedged Item against a designated risk. Even without an in depth analysis a simple introduction to Hedge Accounting is enough to clarify that the notion of risk management introduced in this work is very different from the one known to accountants when applying Hedge Accounting: Risk management as per IAS approach deals with single assets or liabilities. Risk Management in the author’s opinion deals with balance sheet variance. Chances to ultimately address balance sheet variance via addressing the value of single assets are, in the writer’s opinion, very low.
From a pure methodological approach a risk manager should identify principal risk factors and determine risk weight factors, hedging policies and suggestions for management aiming at being countercyclical with respect to the PCR. In a more pragmatic approach, especially when dealing with inverted capital structures, then risk manager may evaluate counter-cyclicality against CDS and not against PCR. Especially if debt is not liquid on the secondary market, then the author believes it may be efficiently approximated by the level of CDS (if quoted).

34 | R i s k m a n a g e m e n t a n d B S V d u r i n g t u r b u l e n t t i m e s
The framework of Hedge accounting is not built for this change in the notion of risk management. Hedge accounting is, in its philosophy, aimed at preserving the accounting value of an asset or, sometimes, even a portfolio (the latter with certain stringent requirements23). Principal components of risk instead strive to find the market risk that matters for the purpose of the value of the bank. In other words, the bank is not an ordinary market player: what is cheap and expensive in market terms (price quoted by the financial markets) has to be filtered via the metric of value of a bank. Principal components of risk alert risk management on the actual engines of volatility of the assets. If too much of this volatility translates into volatility of the senior debt, then a first source of value may derive from a policy of reduction of volatility of the assets, which is likely to produce a volatility reduction of CDS. This is particularly relevant for banks whose capital structure is inverted (as per terminology introduced in this work).
Ultimately the management believing in this notion of risk management will face a dilemma. Most of the risk summarized by the principal components of risk derives from assets under an accounting treatment which requires no change of value (accounting wise) unless a specific impairment is made. This is the most relevant contradiction: accounting shows no volatility whereas PCA driven Risk management emphasizes exactly the opposite. If a hedging policy were designed and proved efficient to implement according to PCA Risk management, then such policy would simply add noise to Financials, since it would hedge the value of assets whose accounting representation will instead show no variation.
One of the reasons why the banking sector lost credibility and value is due to communicating to the market a value which is too distorted from an economic measure: positive profits and drop in market capitalization are the sides of a coin where the market assessment of value is at odds with the accounting conclusions of management. Believing to the accounting measurement of value has proved very costly, since it caused, among other effects, that the banking sector was the slowest player in the market either in adjusting its risk, or in deciding not to adjust it at all, in the belief that ultimately capital is to be read through financials and not through market values.
A proposal on how to fill the gap between these 2 measures of value is well beyond the purpose of this work and will be a topic of future publications.
23 An analysis of such requirements is beyond the scope of this work.

35 | R i s k m a n a g e m e n t a n d B S V d u r i n g t u r b u l e n t t i m e s
BASEL 3 FRAMEWORK: INNOVATIONS ANALYZED VIA A PCA DRIVEN RISK MANAGEMENT
"Basel III" is a comprehensive set of reform measures, developed by the Basel Committee on Banking Supervision, to strengthen the regulation, supervision and risk management of the banking sector. These measures aim to:
i. Improve the banking sector's ability to absorb shocks arising from financial and economic stress, whatever the source
ii. Improve risk management and governance iii. Strengthen banks' transparency and disclosures.
The reforms target:
a) bank-level, or microprudential, regulation, which will help raise the resilience of individual banking institutions to periods of stress.
b) macroprudential, system wide risks that can build up across the banking sector as well as the procyclical amplification of these risks over time.
c) These two approaches to supervision are complementary as greater resilience at the individual bank level reduces the risk of system wide shocks24.
The purpose of this work is not to give a comprehensive analysis of the Basel III framework: yet we write this section to analyze if a PCA driven risk management is flexible enough to address some of the main innovations introduced by the regulatory changes introduced under the Basel III regulatory reforms.
We will discuss here two aspects: the introduction of liquidity requirements and the new definition of regulatory capital.
These requirements are subject to a “transition period”, hence they are gradually being implemented, since their immediate adoption was not compatible with the balance sheet structure of the banking sector at the moment of relaease. In a nutshell, the liability side of the balance sheet will have to be modified with a new definition of subordinated debt and the equity component will be the main foundation when computing the definition of regulatory capital (when computing, for example, the Tier1 Ratio).
On the asset side, liquidity is addressed by the introduction of two ratios, the LCR (Liquidity Cover Ratio) and the NSFR (Net stable Funding Ratio).
24 From the web site of the Bank for International Settlement, http://www.bis.org/bcbs/basel3.htm
36 | R i s k m a n a g e m e n t a n d B S V d u r i n g t u r b u l e n t t i m e s
We will dedicate a different section of this work to the role of subordinated debt. We will focus now on liquidity and the possibility to address this risk from a risk management point of view. Basel III deals with it by imposing that liquidity be structurally addressed with a short term horizon (LCR) and a long term horizon (NSFR). The first one is based on an assumption of net cash outflows in the next 30 calendar days; it thus requires an allocation of assets, at least for the amount of the net cash outflows, into assets defined as “high quality liquid assets”. If we believed in a PCA approach to risk management, then we would require a poor correlation between the principal components of risk and such assets. The regulatory requirements do provide some qualitative requirements in line with the main intuitions of this work, since they include, among the “Fundamental characteristics”
Low correlation with risky assets: the stock of high-quality liquid assets should not be subject to wrong-way (highly correlated) risk. For example, assets issued by financial institutions are more likely to be illiquid in times of liquidity stress in the banking sector25.
Yet, when providing stringent criteria of the assets eligible for fulfilling this requirement, the document lists
marketable securities representing claims on or claims guaranteed by sovereigns, central banks, non-central government PSEs, the Bank for International Settlements, the International Monetary Fund, the European Commission, or multilateral development banks and satisfying all of the following conditions:
• assigned a 0% risk-weight under the Basel II Standardised Approach; • traded in large, deep and active repo or cash markets characterised by a
low level of concentration; • proven record as a reliable source of liquidity in the markets (repo or
sale) even during stressed market conditions; and • not an obligation of a financial institution or any of its affiliated
entities.26
It is not difficult to imagine securities which may satisfy all these requirements, yet show a strong level of correlation with the CDS of the issuer. In such scenario it is very likely then that a period of funding stress for the bank may also be a period of (economic) loss on the securities selected to satisfy the requirement of the LCR. An example is given by securities issued by a
25 Page 5 of “Basel III: international framework for liquidity risk measurement 26 Page 8 of the document

37 | R i s k m a n a g e m e n t a n d B S V d u r i n g t u r b u l e n t t i m e s
government experiencing a period of difficulty in its funding program: it would fulfill the requirements here listed, yet be a poor source of liquidity during a liquidity crunch.
The rationale of the NSFR, instead, is summarized by requesting that available resources exist (“Available amount of stable funding”) to face the “Required amount of stable funding”. It is a longer term requirement (with respect to the LCR) which provides a weight to every liability in the balance sheet reflecting how stable such liability may be considered in providing funding. It also assigns a liquidity weight factor to every component of the asset to summarize in what extent such asset require stable funding. The author believes that a low liquidity factor should be associated to assets inversely correlated with the CDS of the bank or with its principal component of risk.
How would a PCA driven risk management address the liquidity risk?
So far we have analyzed the regulatory framework imposing a solution ultimately made of an allocation, on the asset side, contemplating a short term stress in liquidity (LCR). Also the NSFR addresses the composition of liabilities so that there is consistency between assets and the stability of funding they require. What would a PCA driven risk management also suggest? Clearly this question is equivalent to also testing if the idea of risk management introduced in this work is robust enough to handle the most difficult problem of the financial crisis: liquidity
When analyzing the level of CDS and its level, the market embeds a liquidity risk related to the Bank (i.e. the probability of default, as expressed by the CDS market, reflects not only the event of insolvency, but also an event of liquidity scarcity). Hence a PCA driven risk management would encourage a search for variables, explanatory of the liquidity of a bank, that are inversely correlated with the CDS. In doing so, we will find that some requirements imposed by the LCR will be a subset of those variables that a PCA driven risk management would use to address a balance sheet structure less vulnerable to liquidity crunches.
The author will use some of the conclusions drawn in a previous work where the problem of liquidity is addressed not with respect to a specific bank, but with respect to a set of financial institutions as per composition of the index Itraxx Financial Senior. The conclusion of such work27 points at the role of the following variables and their explanatory power on financial CDS:
27 We invite the interested reader to explore the content of the work “CDS: Liquidity shortage or structural insolvency?”

38 | R i s k m a n a g e m e n t a n d B S V d u r i n g t u r b u l e n t t i m e s
a) The difference between Euribor and Eonia b) The difference between the yield of a German Government Bond and a
government bond for the same maturity issued by a country experiencing a sovereign crisis
c) The level of the cross currency EUR/USD, for a maturity below 5 years d) The difference between the level of the CDS and the yield of the
government bond for a maturity of 5 years (such difference, named government basis, is particularly relevant in last 2 years, when liquidity has worsened up to the point that monetary policy have addressed it via non standard monetary quantitative measure).
We will not offer a detailed description of the reasons why this empirical finding is justified, since the interested reader may explore the theme in depth by reading the aforementioned work. What is crucial to emphasize is that PCA Risk Management should assess the explanatory power of these variables on the CDS and the stock of the bank: based on the results then the bank can address how much of the volatility of CDS (and of the stock) can be justified mainly by the liquidity risk. If the stock and the debt of the bank are not reactive to these variables, then the market is pricing that the bank is robust enough against liquidity shocks. Hence liquidity requirements should be addressed with different degrees, depending on the specific situation of the bank: a unique standard is understandably imposed for the sake of clarity, yet the measures imposed are not the only way to address liquidity, which, alternatively, can be addressed also by hedging policies whose outcomes are countercyclical, on a statistical basis, with the evolution of CDS (and of the stock). Such hedging policies involve, among others, the variables here mentioned at point (a), (b), (c), (d).
We conclude this section by noting that the main idea of risk, being summarized by the principal components of risks appears robust enough as to provide a unifying framework for all risks even if a regulatory approach may address them separately. When analyzing PCR at the beginning of this work, one of the variables negatively correlated with the evolution of the CDS is the difference in yield between “Core” government bonds and “peripheral” government bonds: this is consistent, for example, with the “Market related characteristics” of the securities which may be considered “high-quality liquid assets” in the context of the definition of LCR:

39 | R i s k m a n a g e m e n t a n d B S V d u r i n g t u r b u l e n t t i m e s
Flight to quality: historically, the market has shown tendencies to move into these types of assets in a systemic crisis28.
Hence PCA driven risk management and some requirements of LCR are proposing a common rationale in the choice of variables.
SUBORDINATED DEBT: CAN IT HELP IN REDUCING BALANCE SHEET VARIANCE?
In this section we provide the terms of a subordinated debt which may achieve the goal of reducing the balance sheet variance. We do emphasize that such idea was never shared with a regulator: therefore some readers may find it misleading that we adopt the terminology “subordinated”, since capital management typically associates a regulatory benefit in issuing a subordinated debt. Once more, no opinion was expressed by a regulator on the liability features contained below, both in terms of regulatory impact nor in terms of legal feasibility.
We use the terminology “subordinated” since we see this as a new liability of the banking sector with a purpose different from standard senior issuance. Whereas senior issuance has the aim of securing liquidity for a certain maturity, the subordinated debt has the purpose to provide liabilities which rank lower than senior debt and whose purpose is a benefit on regulatory capital. In what we will describe below we do envision a benefit for the economic capital, since the balance sheet variance should decrease after the issuance of this typology of debt. Hence we may achieve a benefit in reduction of balance sheet variance, but no conclusions can be drawn in terms of regulatory capital.
In an ideal world, PCA driven Risk Management would see the purchase of long term options on the Principal Components of Risk as beneficial for the purpose of reduction of balance sheet variance. Indeed, if the variance of the balance sheet is ultimately decomposed into Principal Components of Risk, then buying options on what explains variance is ultimately variance reductive.
Led by this intuition, we seek to translate this idea into a practical example of a liability whose role is not to address liquidity, but the reduction of balance sheet variance. Clearly the market may not be liquid enough in pricing an option on PCR, hence we look at the variables composing PCR selecting the few where an option market has developed. We will then embed such option within a newly 28 Page 5, 22b in the document Basel III: International framework for liquidity risk measurement, standards and monitoring.

40 | R i s k m a n a g e m e n t a n d B S V d u r i n g t u r b u l e n t t i m e s
conceived liability, which we will call “PCR redemption linked note”. Such note may redeem, upon the discretion of the issuer
i. In cash for an amount equal to the notional amount or ii. In terms of other securities (or payout29) which are closely related to
PCR.
The reader may have already noticed the similarity with the construction of an ordinary convertible security. A description of the latter is beyond the scope of this work, but in essence the issuer of a convertible security may convert the amount borrowed into another instrument of the capital structure, typically equity (via a conversion factor).
The analogy is useful since the subordinated debt here presented gives the the issuer the optionality to choose, at a certain date, between a redemption at 100% (or nominal value) or by delivering specified securities.
In essence, such subordinated debt can be decomposed into a standard nominal liability (i.e. a liability whereby the issuer commits to redeeming at 100% of the notional amount) and a put option on one or more securities.
The balance sheet variance will reduce simply because the bank is implicitly buying volatility on underlyings strongly related with PCR.
The success of this idea depends on the existence of market players whose balance sheet soundness does not depend from the PCR that matter for the banking sector. Such players may be
i. Capable to manage such volatility since their balance sheet is not so correlated to the PCR or securities the liability instrument may convert into.
ii. Long term buyers of the asset class represented by the securities which can be delivered as a result of the conversion and therefore they are not so sensitive to adverse movements of mark to market.
Such market players then obtain a significant yield enhancement from the premium obtained from selling a put option on securities which they would have purchased anyway.
A practical example of such liability can be designed for the banking sector: it would provide a benefit especially when the funding pressure for sovereigns and local banks reaches its peak.
29 The terminology established in the option market would then refer respectively to Physical or Cash delivery upon exercise.

41 | R i s k m a n a g e m e n t a n d B S V d u r i n g t u r b u l e n t t i m e s
At certain stages volatility of CDS has reached levels of panic and has raised, both in the industry and in the academic environment, the need of addressing systemic risk. We will not need to run a PCA to guess that during such turbulent times one of the most important variables in the definition of the PCR is the yield of the government securities.
Hence, a PCR redemption linked note could be designed as per following characteristics:
a) 10 years maturity b) After 5 years (Exercise date ) the issuer has an option to
o redeem the note at 100% of the notional amount o Deliver government securities (specified at the time of the issuance
of the PCR redemption linked note) with 5 years maturity (from Exercise Date)
c) Amount of securities to deliver: § 23��34��#�5364� $ #�34 ����34#7���3�#
d) Conversion factor = 100% / Forward price e) Forward Price : the price for forward purchase on the securities; tenor is
equal to the Exercise Date f) Price of the PCR redemption note, which we will denote as “Offer Price”:
§ �889 1 06�#0���� $ �34 ����34#7���3� § Put price: to be derived via standard literature models where
the key input is the realized volatility or the deliverable securities, if quoted in the market.
g) Coupon of the note prior to Exercise Date: § :77��#0����#;#�6���3� % �./�
h) CDS: The CDS level of the bank issuing the PCR Redemption linked note, fixed once, at issuance date.
We will explore below the consistency of the PCR redemption linked note with the new Basel III framework.
SUBORDINATED DEBT AND BASEL III: THE ROLE OF COCOS.
Once again, we test if the intuition of the PCA driven Risk Management is consistent with one of the main innovations introduced in the world of subordinated debt30 , mainly by Basel III. Basel III proposes a definition of the
30 This time subordinated even according to a regulatory meaning
42 | R i s k m a n a g e m e n t a n d B S V d u r i n g t u r b u l e n t t i m e s
components of regulatory capital31 by introducing various layers of capital such as
i. Common Equity Tier 1 ii. Additional Tier 1 Capital
iii. Tier 2 Capital
We do not mean to provide a definition of the components of regulatory capital: we will focus on a particular requirement established for issued securities so that they may classify as liabilities: the debt eligible for the purpose of computation as Additional Tier 1 Capital must satisfy, among the many requirements, the condition
Instruments classified as liabilities for accounting purposes must have principal loss absorption through either
(i) conversion to common shares at an objective pre-specified trigger point or (ii) a write-down mechanism which allocates losses to the instrument at a pre-specified trigger point. The write-down will have the following effects:
a. Reduce the claim of the instrument in liquidation;
b. Reduce the amount re-paid when a call is exercised; and
c. Partially or fully reduce coupon/dividend payments on the instrument.32
Do PCA Risk Management and Basel III provide a definition of capital consistent with each other? In the section above we have identified the terms of a “subordinated” debt with the purpose of decreasing the balance sheet variance. The rational is simple enough: the conversion of a liability into variables closely related to Principal Components of Risk.
Such optionality of conversion reduces the Balance sheet variance (the bank is long volatility on one or more components of the Principal Components of Risk).
Hence Basel III and PCA Risk Management both rely on the optionality of Conversion. The differences we emphasize in this section are
a. The trigger mechanism and the loss absorption: both terms intuitively recall an accounting language describing the clauses of conversion. Some bonds eligible for computation within Additional Tier1 Capital convert
31 Readers interested in the theme should refer to the wide literature and FAQ documents published by the bank for international settlement. 32 Page 17, paragraph 55, number 11.

43 | R i s k m a n a g e m e n t a n d B S V d u r i n g t u r b u l e n t t i m e s
into equity once the core Tier 1 Ratio falls below a certain minimum threshold. Some others, instead, simply deduct a certain amount from principal in case the event of fall of Core Tier 1 ratio materializes. The author has emphasized that accounting allows for “latent” losses ( not yet realized). Hence this conversion is not guaranteed to be triggered when most required, i.e., when balance sheet volatility increases: the economic value of conversion would be maximized if it could be determined on a pure economic ground. A management experiencing exceptional turbulence may not attempt to reduce balance sheet volatility, by retaining as many losses as possible, hoping for a normalization process. In such a scenario, losses would not be realized and the conversion mechanism would not trigger, thus providing little economic benefit. A conversion mechanism not defined in terms of accounting losses is therefore to be preferred, in the author’s opinion.
b. The converted securities: this is the main point of difference between PCR Risk Management and Basel III. Basel III disposes that the converted securities should be common shares: certainly adding equity to the bank reduces leverage, and there could be no more efficient measure to address a moment of stress. Yet the author believes that contingent convertibles33 should be available to all banks and mainly to the poorest in capital, i.e. the ones that, above all, need to address the balance sheet volatility and cannot afford an extremely dilutive rights issuance. Only few banks may have the balance sheet strength to place in the market a liability potentially converting into shares; even fewer could, by issuing such liability, offer yields which are not too detrimental for the profitability of the bank. This is the reason why Contingent Convertibles, as defined by Basel III framework, have been issued only by the soundest financial institutions and such issuance cannot be even considered by the weakest ones. More importantly the market will judge the potential volatility of profits and balance sheet to judge the probability of conversion. Hence banks operating into fragile economies are automatically deprived of this important instrument. The author then believes that a conversion into the Principal component of risks, or some of them, is the most affordable tool to decrease balance sheet volatility.
CONCLUSIONS
This work presents a model to address risk management and Capital Management by the adoption of principal Component Analysis: we thus define
33 Conversion not necessarily into common shares

44 | R i s k m a n a g e m e n t a n d B S V d u r i n g t u r b u l e n t t i m e s
the Principal Components of Risk. The latter are not only a decomposition of risk by means of liquid variables, but also the regressors to evaluate the sensitivity of the capital structure of a bank to a modern and market implied definition of risk. A bank exhibits an Inverted Capital Structure when its debt is more reactive than equity to the evolution of Principal Risk Factors. We then revisit the concept of risk weight adopted in the definition of Core Tier 1 Ratio to provide a measure more adherent to an economic concept of Capital. In dealing with Balance Sheet Variance we revisit the role of subordinated debt and define a new liability which reduces balance sheet variance and appears to be more affordable than standard securities which may be admissible for computation within the “Additional Tier 1 Capital”. We also adopt the PCA Risk management to explore the liquidity requirements imposed by Basel III.

45 | R i s k m a n a g e m e n t a n d B S V d u r i n g t u r b u l e n t t i m e s
APPENDIX
Results of the PCA
Composition of Itraxx Indices (Series 12): Index Itraxx Europe.
The index, also known simply as 'The Main', is composed of the most liquid 125 CDS referencing European investment grade credits, subject to certain sector rules as determined by the IIC and also as determined by the SEC. More specifically, The iTraxx® Europe index comprises 125 investment grade rated European entities selected from the Liquidity List . All entities must satisfy the membership determination criteria . Among such criteria it is disposed that the final index comprises 125 entities and is constructed by selecting the highest ranking entities in each sector on the Liquidity List, subject to the following sector restrictions:
a. – 30 Autos & Industrials
b. – 30 Consumers
c. – 20 Energy
d. – 20 TMT
e. – 25 Financials (separate Senior & Subordinated indices)
The levels of the index Financial Senior (more properly iTraxx Europe Senior Financials), with tenor 5y maturity, intuitively includes all financial senior CDS of financial reference entities. More specifically, this index is the weighted average of the 25 names belonging to the Financial sector and included in the index Itraxx Europe (as per description above, point e).

46 | R i s k m a n a g e m e n t a n d B S V d u r i n g t u r b u l e n t t i m e s

47 | R i s k m a n a g e m e n t a n d B S V d u r i n g t u r b u l e n t t i m e s

48 | R i s k m a n a g e m e n t a n d B S V d u r i n g t u r b u l e n t t i m e s
REFERENCES
Basel Committee on Banking Supervision, The management of liquidity risk in financial groups, Bank for International Settlement, May 2006.
Basel Committee on Banking Supervision, Principles for Sound Liquidity Risk Management and Supervision, June 2008 (draft for consultation).
Bruder B., Hereil P. and Roncalli T. (2011), Managing Sovereign Credit Risk, Journal of Indexes Europe, 1(4), pp. 20-27.
Duffie, Darrell, and David Lando, 2001, “Term Structures of Credit Spreads with Incomplete Accounting Information,” Econometrica, Vol. 69 (3), pp. 633–64.
Gianfrancesco, I., “Il rischio di liquidità nel Secondo Pilastro di Basilea 2”, Banche e Banchieri, n. 2, March – April 2008.
Hart, O., and Zingales, L., 2009. A new capital regulation for large financial institutions. Harvard University and University of Chicago working paper.
Iannotta G., 2006. Testing for opaqueness in the European banking industry: Evidence from bond credit ratings. Journal of Financial Services Research 30, 287-309.
Institute of International Finance, Principles of Liquidity Risk Management, March 2007.
Merton, R., 1977. An analytic derivation of the cost of deposit insurance and loan guarantees: An application of modern option pricing theory. Journal of Banking and Finance 1, 3-11.
Mottura, P., “La Northen Rock e la sua crisi di liquidità”, Bancaria, n. 6, 3-19, June, 2008.
Neu P., “Liquidity Risk Measurement”, in Matz L., Neu P., Liquidity Risk. Measurement and Management. A Pratictioner’s Guide to Global Best Practices, John Wiley & Sons, Chichester,2007.
Panetta, I.C., P. Porretta, Il rischio di liquidità: regolamentazione e best practice per allontanare le crisi sistemiche, paper presented at the ADEIMF Annual Conference in Capri,June 2008.

49 | R i s k m a n a g e m e n t a n d B S V d u r i n g t u r b u l e n t t i m e s
Pennacchi, G., 1999. The effects of setting deposit insurance premia to target insurance fund reserves. Journal of Financial Services Research 16, 63-90.
Pennacchi, G., 2006. Deposit insurance, bank regulation, and financial system risk. Journal of Monetary Economics 53, 1–30.
[82] Resti A., Sironi A., “Comprendere e misurare il rischio di liquidità”, Bancaria, novembre 2007.
[85] Tarantola, A.M., Crisi di liquidità e futuro dei mercati. Aspetti operativi e regolamentari, paper presented at AIAF, ASSIOM, ATIC FOREX in Bari, January 2008.
Vento, G.A., “Eurosystem’s operational framework, use of collateral and liquidity distribution in the euro area: towards a single interbank market?”, BNL Quarterly Review, n.228, 2004.