risk and reliability evaluation of gas connector systems ... · page 1 of 19 materials engineering...
TRANSCRIPT

Page 1 of 19
MATERIALS ENGINEERING | RESEARCH ARTICLE
Risk and reliability evaluation of gas connector systems using fuzzy theory and expert elicitationRichard Olawoyin
Cogent Engineering (2017), 4: 1372731

Olawoyin, Cogent Engineering (2017), 4: 1372731https://doi.org/10.1080/23311916.2017.1372731
MATERIALS ENGINEERING | RESEARCH ARTICLE
Risk and reliability evaluation of gas connector systems using fuzzy theory and expert elicitationRichard Olawoyin1*
Abstract: Gas connectors are installed in almost every home in the United States and around the world. The reliability of these connectors is quintessential in pro-tecting people, property and the environment. The critical heuristic analysis model presented in this study assessed the reliability of fuel gas connectors (FGC), the likelihood of FGC failure, potential hazards, causes and consequences in a common perspective. The “Bow-tie” method was introduced to integrate the fault tree analy-sis (FTA) and the event tree analysis (ETA). 31 minimal cut sets and 33 basic events (BEs) of the FTA were determined from qualitative analysis, while the important measures analyses of BEs and the failure probability of the top event Pr(TE) were analyzed quantitatively. Traditional risk assessment techniques (RAT) considered the probabilities of basic events (BEs) as accurate values without accounting for uncer-tainty and impression with some BEs. This study improved on the traditional RAT by integrating expert elicitation technique and fuzzy set theories (FST) for the evalu-ation of these events. FST minimized the uncertainty and fuzziness of the events, thePr(TE) = 5.138 × 10⁻² and flexible gas connectors were determined to be safer for use and have the lowest failure risk compared to black iron pipe. The approach used in this study considered multi-dimensional approach for effectively analyzing fuzzy
*Corresponding author: Richard Olawoyin, Environmental Health and Safety, School of Health Sciences, Oakland University, Rochester, MI, USA E-mail: [email protected]
Reviewing editor:Amir H. Alavi, Michigan State University, USA
Additional information is available at the end of the article
ABOUT THE AUTHORRichard Olawoyin worked in the petroleum industry as a geologist, geophysicist, petroleum engineer, safety and environmental health scientist, both in the upstream and downstream. His research interests emphasize on: Advanced Energy Production, Human Health Exposure Risk Assessment, NanoEHS (nanotechnology), Gas Materials Engineering etc. He has won numerous awards and honors as an academic and professional. He is a Certified Environmental Professional (CEP) and also certified by the Board of Certified Safety Professionals as a Certified Safety Professional (CSP) and Associate Safety Professional (ASP). He is a Book chief editor and has authored numerous publications on; Environmental Health and Safety, Energy, Petroleum & Mining Engineering, Environmental Engineering, Drilling Innovation and Environmental Health Sciences. He is an ABET Commissioner, faculty research adviser in the School of Engineering and NSF Panel Reviewer on Chemical Imaging. He has presented at several international & national conferences on petroleum technology, environmental-health, safety, and geosciences.
PUBLIC INTEREST STATEMENTMost residential or commercial buildings utilize fuel gas connectors (FGC) to supply gas to compatible appliances. Due to the volatility of the transported gas, inherent risks exist for the use of the FGC. This study assessed the potential FGC risks, by integrating qualitative and quantitative analysis to determine the relative reliability of the FGC. An effective framework was developed for calculating the basic risk events (BE) of the fault tree analysis. The intrinsic societal benefits of the proposed framework include: (i) ability to evaluate BE failure probabilities (FPr); (ii) ability to determine influences of subjectivity and fuzziness of experts’ linguistic expressions of the depiction of the BE-FPr. The multi-dimensional approach introduced in this study will help to effectively analyze fuzzy FGC events and the outcomes are helpful to professionals in making decisions on the preventive, protective and corrective actions necessary in the risk management process.
Received: 21 July 2017Accepted: 24 August 2017First Published: 30 August 2017
© 2017 The Author(s). This open access article is distributed under a Creative Commons Attribution (CC-BY) 4.0 license.
Page 2 of 19
Richard Olawoyin
Page 3 of 19
Olawoyin, Cogent Engineering (2017), 4: 1372731https://doi.org/10.1080/23311916.2017.1372731
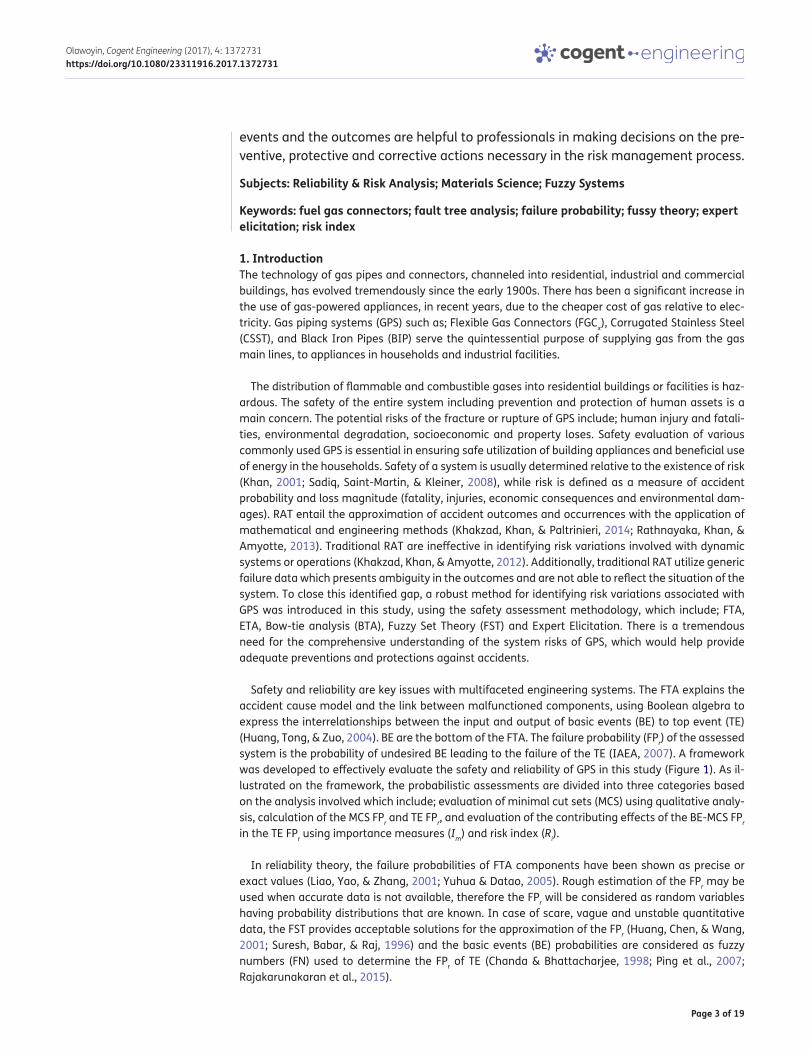
events and the outcomes are helpful to professionals in making decisions on the pre-ventive, protective and corrective actions necessary in the risk management process.
Subjects: Reliability & Risk Analysis; Materials Science; Fuzzy Systems
Keywords: fuel gas connectors; fault tree analysis; failure probability; fussy theory; expert elicitation; risk index
1. IntroductionThe technology of gas pipes and connectors, channeled into residential, industrial and commercial buildings, has evolved tremendously since the early 1900s. There has been a significant increase in the use of gas-powered appliances, in recent years, due to the cheaper cost of gas relative to elec-tricity. Gas piping systems (GPS) such as; Flexible Gas Connectors (FGCx), Corrugated Stainless Steel (CSST), and Black Iron Pipes (BIP) serve the quintessential purpose of supplying gas from the gas main lines, to appliances in households and industrial facilities.
The distribution of flammable and combustible gases into residential buildings or facilities is haz-ardous. The safety of the entire system including prevention and protection of human assets is a main concern. The potential risks of the fracture or rupture of GPS include; human injury and fatali-ties, environmental degradation, socioeconomic and property loses. Safety evaluation of various commonly used GPS is essential in ensuring safe utilization of building appliances and beneficial use of energy in the households. Safety of a system is usually determined relative to the existence of risk (Khan, 2001; Sadiq, Saint-Martin, & Kleiner, 2008), while risk is defined as a measure of accident probability and loss magnitude (fatality, injuries, economic consequences and environmental dam-ages). RAT entail the approximation of accident outcomes and occurrences with the application of mathematical and engineering methods (Khakzad, Khan, & Paltrinieri, 2014; Rathnayaka, Khan, & Amyotte, 2013). Traditional RAT are ineffective in identifying risk variations involved with dynamic systems or operations (Khakzad, Khan, & Amyotte, 2012). Additionally, traditional RAT utilize generic failure data which presents ambiguity in the outcomes and are not able to reflect the situation of the system. To close this identified gap, a robust method for identifying risk variations associated with GPS was introduced in this study, using the safety assessment methodology, which include; FTA, ETA, Bow-tie analysis (BTA), Fuzzy Set Theory (FST) and Expert Elicitation. There is a tremendous need for the comprehensive understanding of the system risks of GPS, which would help provide adequate preventions and protections against accidents.
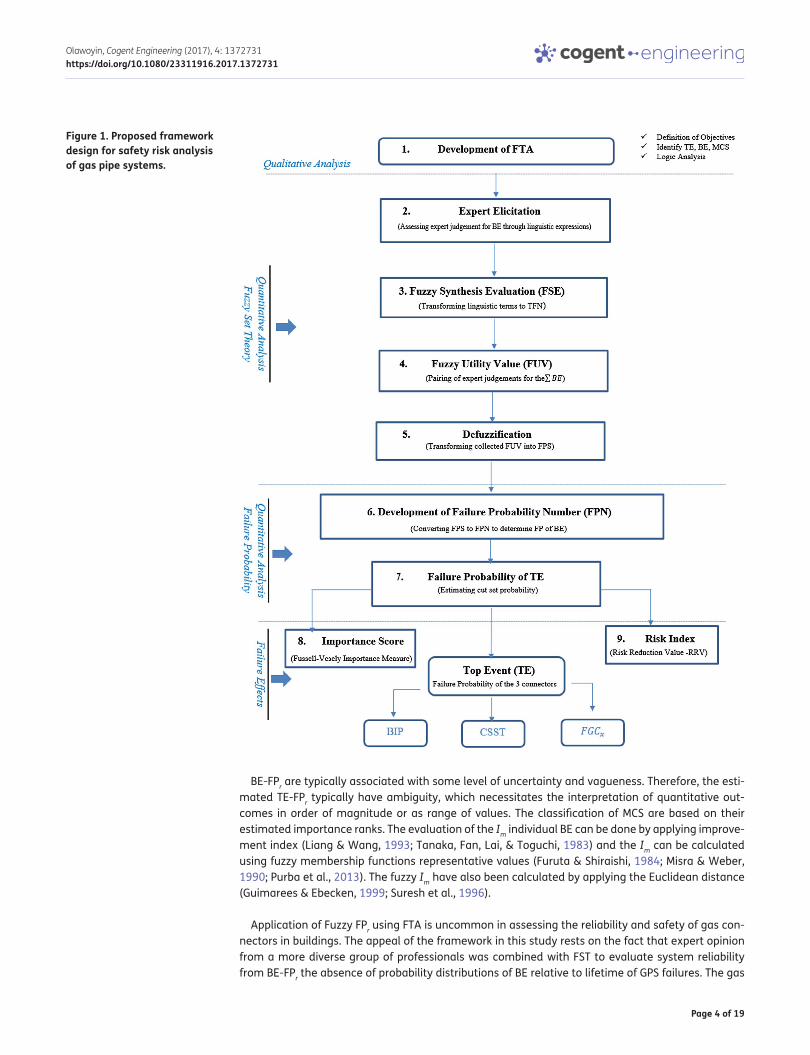
Safety and reliability are key issues with multifaceted engineering systems. The FTA explains the accident cause model and the link between malfunctioned components, using Boolean algebra to express the interrelationships between the input and output of basic events (BE) to top event (TE) (Huang, Tong, & Zuo, 2004). BE are the bottom of the FTA. The failure probability (FPr) of the assessed system is the probability of undesired BE leading to the failure of the TE (IAEA, 2007). A framework was developed to effectively evaluate the safety and reliability of GPS in this study (Figure 1). As il-lustrated on the framework, the probabilistic assessments are divided into three categories based on the analysis involved which include; evaluation of minimal cut sets (MCS) using qualitative analy-sis, calculation of the MCS FPr and TE FPr, and evaluation of the contributing effects of the BE-MCS FPr in the TE FPr using importance measures (Im) and risk index (Ri).
In reliability theory, the failure probabilities of FTA components have been shown as precise or exact values (Liao, Yao, & Zhang, 2001; Yuhua & Datao, 2005). Rough estimation of the FPr may be used when accurate data is not available, therefore the FPr will be considered as random variables having probability distributions that are known. In case of scare, vague and unstable quantitative data, the FST provides acceptable solutions for the approximation of the FPr (Huang, Chen, & Wang, 2001; Suresh, Babar, & Raj, 1996) and the basic events (BE) probabilities are considered as fuzzy numbers (FN) used to determine the FPr of TE (Chanda & Bhattacharjee, 1998; Ping et al., 2007; Rajakarunakaran et al., 2015).
Page 4 of 19
Olawoyin, Cogent Engineering (2017), 4: 1372731https://doi.org/10.1080/23311916.2017.1372731
BE-FPr are typically associated with some level of uncertainty and vagueness. Therefore, the esti-mated TE-FPr typically have ambiguity, which necessitates the interpretation of quantitative out-comes in order of magnitude or as range of values. The classification of MCS are based on their estimated importance ranks. The evaluation of the Im individual BE can be done by applying improve-ment index (Liang & Wang, 1993; Tanaka, Fan, Lai, & Toguchi, 1983) and the Im can be calculated using fuzzy membership functions representative values (Furuta & Shiraishi, 1984; Misra & Weber, 1990; Purba et al., 2013). The fuzzy Im have also been calculated by applying the Euclidean distance (Guimarees & Ebecken, 1999; Suresh et al., 1996).
Application of Fuzzy FPr using FTA is uncommon in assessing the reliability and safety of gas con-nectors in buildings. The appeal of the framework in this study rests on the fact that expert opinion from a more diverse group of professionals was combined with FST to evaluate system reliability from BE-FPr the absence of probability distributions of BE relative to lifetime of GPS failures. The gas
Figure 1. Proposed framework design for safety risk analysis of gas pipe systems.

Page 5 of 19
Olawoyin, Cogent Engineering (2017), 4: 1372731https://doi.org/10.1080/23311916.2017.1372731
connector data is characterized by vagueness and imprecision, hence an effective FST integrated reliability model has been developed to assess BE FPr through the processing of qualitative linguistic expressions into FN. The purpose of the proposed framework using applied fuzzy reliability FTA mod-el is to transform qualitative data of BE given as FPr (which are based on subject assessment by ex-perts), into effective FN, after which the FN are converted into scalar measure subsequently used to form the BE-FPr towards advanced assessment of the TE incidence as the outcome of the model. The application of FN in the model is quintessential for characterizing the possibility of BE to occur, while the quantitative outcomes representing the possibility of TE incidence are generated using the FST-FTA. Im determined by classifying different BE.
2. Characteristics of the investigated FGCThe latest generation of FGC come with a protective coating on the outside of the tube to prevent the material. Currently, there are three FGC in use which include the coated brass, stainless steel, and the coated stainless steel connectors (Olawoyin & McGlothlin, 2015). One of the leading corrosion prob-lems of this type of FGC is the accelerated stress corrosion cracking from exposure to ammonia.
2.1. Stainless steel FGCThe leading advantages of the stainless steel FGC over the coated brass connectors include: ability to be used outdoors or in places where appliances are subject to vibration during normal use; ability to withstand the torsion and bend tests; and ability to offer more resistance to corrosion from air, petroleum products, ammonia, fatty oils, grease, household chemicals, and liquid petroleum and natural gases with high sulfur content (Oster, 1998). The stainless steel FGC supply gas to residential, commercial, and industrial structures, installed underground. This creates susceptibility for corro-sion; thus contributing to leaks, rupture, or puncture (Shahriar, Sadiq, & Tesfamariam, 2012; Yuhua & Datao, 2005). Failure rates in stainless steel FGC depend on various mechanisms such as: construc-tion conditions, design factors, maintenance techniques, and environmental conditions (Shahriar et al., 2012). Such failures lead to loss of life, environmental damage, and economic loss (Olawoyin & McGlothlin, 2015).
2.2. Corrugated stainless steel tubeCSST is a flexible, polyethylene-covered tubing product which performs the same function as BIP and copper tubing. It is used to supply natural gas or propane to residents or facilities. It is generally covered in yellow or black plastic coating. This product was initially developed in Japan in an effort to reduce the frequency of gas leaks in rigid piping that came with seismic activity. Japan is located in the ring of fire, an area of the world where there is high probability for earthquakes, hence and so building fixtures needed to be adjusted in their construction to allow for movement in those situa-tions. A major safety factor for CSST is the “safe-system approach” which is in place for the ANSI-recognized certification under ANSI/IAS LC-1. Under this standard, each manufacturer of CSST must certify the tubing and matching fittings. Flexible CSST systems had approximately 75% fewer thread fitting joints than the BIP. The reduction of threaded fitting joints is the result of the long length of the reels and elimination of elbows. By threading a cut length of pipe there is a reduction in wall thickness of up to 50%. Since 1990, more than 800 million feet of CSST gas piping in about 6 million homes have been installed in the United States (Olawoyin & McGlothlin, 2015).
The key difference between FGCx and CSST is the connection location, size and length. While both provide natural gas within a home, FGCx are attached to moveable appliances, such as dryers and ranges and CSSTs are attached to fixed appliances such as a furnace or hot water heater (Olawoyin & McGlothlin, 2015). Compared to other GPS, CSST can be used at higher pressure; while FGCx generally use a pressure at less than 1 lb per square inch (psi); CSST can be used at typically 2 psi. This results in smaller tubing and thus reduction in materials and installation costs and time. CSST can be connected to an appliance directly or adapted to a FGCx or final connection to the appliance. The flexibility of CSST makes it more resistant to damage from seismic events. While FGCx are at a maximum 6 feet, the CSSTs are longer in length; this characteristic is a disadvantage because of its propensity to be damaged by lightning when it is installed near conductive materials. Due to lightning’s unpredictable
Page 6 of 19
Olawoyin, Cogent Engineering (2017), 4: 1372731https://doi.org/10.1080/23311916.2017.1372731
strength at any given strike, there is no evidence to confirm that wall thickness equal to that of a steel pipe will prevent gas leakage when a pipe is struck by lightning. It is also important to note that there have been reports of steel pipes being penetrated by lightning strikes (Barker, 2014).
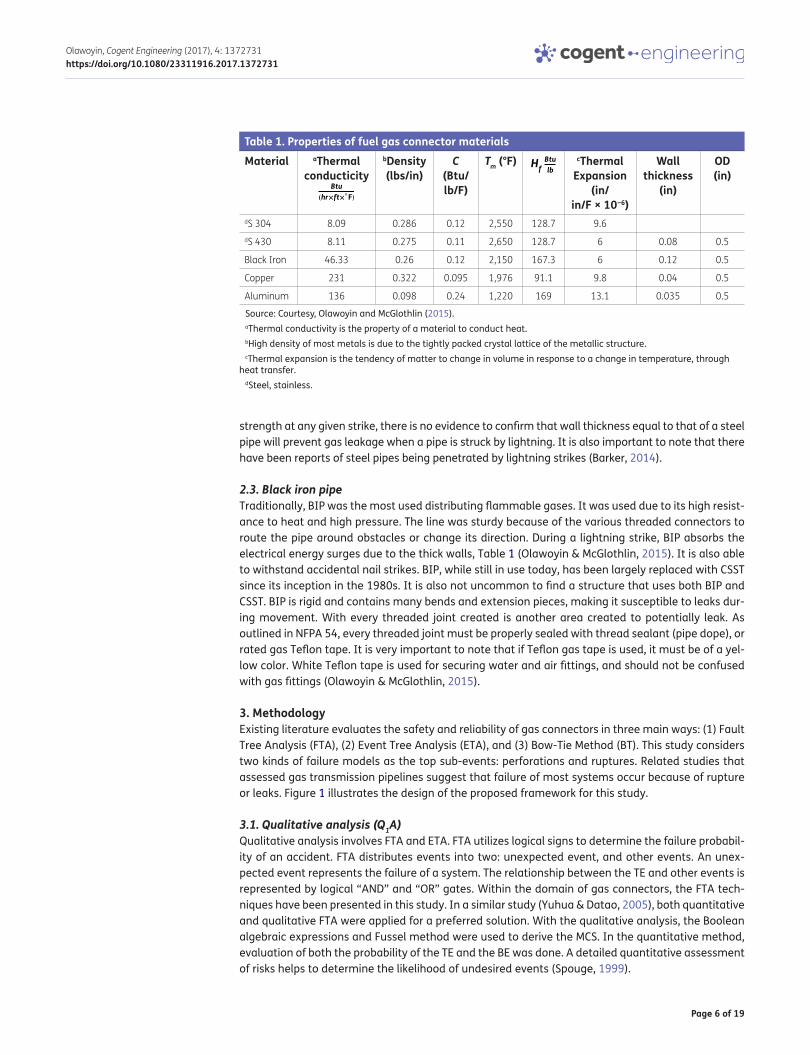
2.3. Black iron pipeTraditionally, BIP was the most used distributing flammable gases. It was used due to its high resist-ance to heat and high pressure. The line was sturdy because of the various threaded connectors to route the pipe around obstacles or change its direction. During a lightning strike, BIP absorbs the electrical energy surges due to the thick walls, Table 1 (Olawoyin & McGlothlin, 2015). It is also able to withstand accidental nail strikes. BIP, while still in use today, has been largely replaced with CSST since its inception in the 1980s. It is also not uncommon to find a structure that uses both BIP and CSST. BIP is rigid and contains many bends and extension pieces, making it susceptible to leaks dur-ing movement. With every threaded joint created is another area created to potentially leak. As outlined in NFPA 54, every threaded joint must be properly sealed with thread sealant (pipe dope), or rated gas Teflon tape. It is very important to note that if Teflon gas tape is used, it must be of a yel-low color. White Teflon tape is used for securing water and air fittings, and should not be confused with gas fittings (Olawoyin & McGlothlin, 2015).
3. MethodologyExisting literature evaluates the safety and reliability of gas connectors in three main ways: (1) Fault Tree Analysis (FTA), (2) Event Tree Analysis (ETA), and (3) Bow-Tie Method (BT). This study considers two kinds of failure models as the top sub-events: perforations and ruptures. Related studies that assessed gas transmission pipelines suggest that failure of most systems occur because of rupture or leaks. Figure 1 illustrates the design of the proposed framework for this study.
3.1. Qualitative analysis (Q1A)Qualitative analysis involves FTA and ETA. FTA utilizes logical signs to determine the failure probabil-ity of an accident. FTA distributes events into two: unexpected event, and other events. An unex-pected event represents the failure of a system. The relationship between the TE and other events is represented by logical “AND” and “OR” gates. Within the domain of gas connectors, the FTA tech-niques have been presented in this study. In a similar study (Yuhua & Datao, 2005), both quantitative and qualitative FTA were applied for a preferred solution. With the qualitative analysis, the Boolean algebraic expressions and Fussel method were used to derive the MCS. In the quantitative method, evaluation of both the probability of the TE and the BE was done. A detailed quantitative assessment of risks helps to determine the likelihood of undesired events (Spouge, 1999).
Table 1. Properties of fuel gas connector materials
Source: Courtesy, Olawoyin and McGlothlin (2015).aThermal conductivity is the property of a material to conduct heat.bHigh density of most metals is due to the tightly packed crystal lattice of the metallic structure.cThermal expansion is the tendency of matter to change in volume in response to a change in temperature, through
heat transfer.dSteel, stainless.
Material aThermal conducticity
Btu
(hr×ft×◦
F)
bDensity (lbs/in)
C (Btu/lb/F)
Tm (°F) Hf
Btu
lb
cThermal Expansion
(in/in/F × 10−6)
Wall thickness
(in)
OD (in)
dS 304 8.09 0.286 0.12 2,550 128.7 9.6dS 430 8.11 0.275 0.11 2,650 128.7 6 0.08 0.5
Black Iron 46.33 0.26 0.12 2,150 167.3 6 0.12 0.5
Copper 231 0.322 0.095 1,976 91.1 9.8 0.04 0.5
Aluminum 136 0.098 0.24 1,220 169 13.1 0.035 0.5
Page 7 of 19
Olawoyin, Cogent Engineering (2017), 4: 1372731https://doi.org/10.1080/23311916.2017.1372731
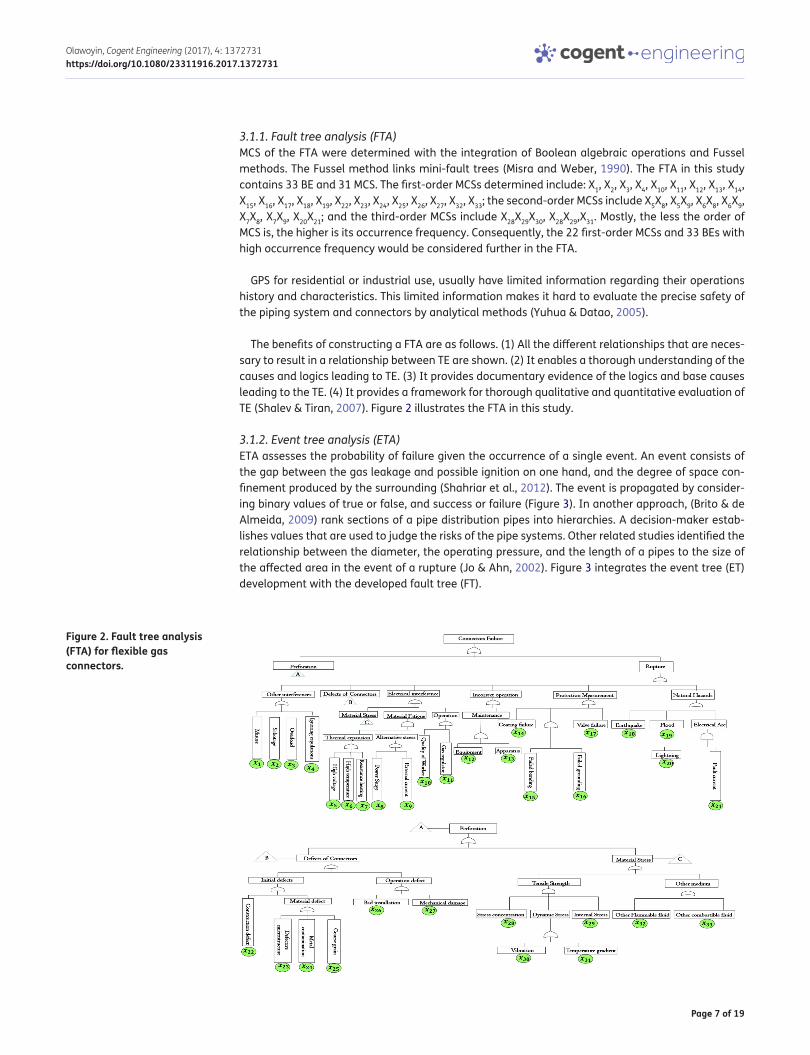
3.1.1. Fault tree analysis (FTA)MCS of the FTA were determined with the integration of Boolean algebraic operations and Fussel methods. The Fussel method links mini-fault trees (Misra and Weber, 1990). The FTA in this study contains 33 BE and 31 MCS. The first-order MCSs determined include: X1, X2, X3, X4, X10, X11, X12, X13, X14, X15, X16, X17, X18, X19, X22, X23, X24, X25, X26, X27, X32, X33; the second-order MCSs include X5X8, X5X9, X6X8, X6X9, X7X8, X7X9, X20X21; and the third-order MCSs include X28X29X30, X28X29,X31. Mostly, the less the order of MCS is, the higher is its occurrence frequency. Consequently, the 22 first-order MCSs and 33 BEs with high occurrence frequency would be considered further in the FTA.
GPS for residential or industrial use, usually have limited information regarding their operations history and characteristics. This limited information makes it hard to evaluate the precise safety of the piping system and connectors by analytical methods (Yuhua & Datao, 2005).
The benefits of constructing a FTA are as follows. (1) All the different relationships that are neces-sary to result in a relationship between TE are shown. (2) It enables a thorough understanding of the causes and logics leading to TE. (3) It provides documentary evidence of the logics and base causes leading to the TE. (4) It provides a framework for thorough qualitative and quantitative evaluation of TE (Shalev & Tiran, 2007). Figure 2 illustrates the FTA in this study.
3.1.2. Event tree analysis (ETA)ETA assesses the probability of failure given the occurrence of a single event. An event consists of the gap between the gas leakage and possible ignition on one hand, and the degree of space con-finement produced by the surrounding (Shahriar et al., 2012). The event is propagated by consider-ing binary values of true or false, and success or failure (Figure 3). In another approach, (Brito & de Almeida, 2009) rank sections of a pipe distribution pipes into hierarchies. A decision-maker estab-lishes values that are used to judge the risks of the pipe systems. Other related studies identified the relationship between the diameter, the operating pressure, and the length of a pipes to the size of the affected area in the event of a rupture (Jo & Ahn, 2002). Figure 3 integrates the event tree (ET) development with the developed fault tree (FT).
Figure 2. Fault tree analysis (FTA) for flexible gas connectors.

Page 8 of 19
Olawoyin, Cogent Engineering (2017), 4: 1372731https://doi.org/10.1080/23311916.2017.1372731
3.2. Quantitative analysisDue to insufficient data, it is difficult to estimate failure probabilities in FTA. Consequently, it is advis-able to treat rough estimates of probabilities and FPr as random variables. The qualitative arrange-ment of FTA and ETA in the form of a simple qualitative bow tie BT scheme allows to identify and analyze the different accident scenarios.
3.2.1. Bow-tie analysisBow-tie analysis (BTA) combines FTA and ETA to provide clearer understanding of the risk potentials involved with certain events (Figure 3).
This is done by developing a logical relationship between causes of an event and the consequenc-es thereof (Dedianous & Fiévez, 2006). This relationship is developed by probabilistic techniques that assess the possibility of accident events (Duijm, 2009). The five basic elements of BTA are: BE, fault tree (FT), TE, event tree (ET), and output event (Shahriar et al., 2012). The central idea is to develop FTA that begins from a pre-event side, and takes into account the post-event for the purpose of predicting GPS risks. While the traditional BTA assumes independence among FTA and ETA, such as-sumptions are error-prone (Ferdous, Khan, Sadiq, Amyotte, & Veitch, 2011; Markowski, Mannan, & Bigoszewska, 2009). Consequently, (Shahriar et al., 2012) utilized a Pearson correlation index to de-note the interdependence of two events, which is also adopted in this study.
In quantitative analysis, TE-FPr is evaluated, and Im analysis is done for the BE (Yuhua & Datao, 2005). In this study, the total number of MCS and the probability of BE are utilized to evaluate the FPr of GPS. Once all the MCSs and probabilities of the basic events have been obtained, then the TE-FPr are determined using Equation (1) as proposed by (Zhang & Lu, 1990). Therefore, triangular fN (Cheng & Mon, 1993) was utilized to represent the deviations of the failure or events of the system. Bow-tie analysis thus utilizes failure probabilities and associated probabilities instead of crisp probabilities.
(1)
Pr(TE) = P
(
n⋃
j=1
Kj
)
=
n∑
i=1
P(Kj) −
n∑
i<j=2
P(KiKj) +
n∑
i<j<k=3
P(KiKjKk) +⋯ + (−1)n−1P(K
1K2…Kn)P(Kj)
=∏
i𝜀Kj
Fi(t)
Figure 3. Bow-tie analysis diagram of gas pipe system failure.

Page 9 of 19
Olawoyin, Cogent Engineering (2017), 4: 1372731https://doi.org/10.1080/23311916.2017.1372731
where K1, K2, …, Kn represent MCS, n is the total number of MCS (n = 18), and Fi(t) is probability of BE Xi.
As a consequence of the low occurrence of BE, the probability of the TE can be approximated by the first half of Equation (1). This calculation enables experts to provide a more accurate opinion about the failure risk of gas connectors.
3.3. Calculating the probability of BE
3.3.1. Expert elicitationExpert elicitation is the method of synthesizing and integrating expert judgement, as a critical piece of risk assessment modeling, especially in areas with insufficient or implicit information, (van der Sluijs et al., 2005). It can be effectively used for information acquisition (Krueger, Page, Hubacek, Smith, & Hiscock, 2012; Rai, 2013) that aids the decision-making process in reliability analysis. These expert opinions can be applied for; the interpretation of scientific evidence collected at various spa-tial and temporal dimensions, development of empirical evidence from inadequate knowledge (Ahmadi-Nedushan, St-Hilaire, Bérubé, Ouarda, & Robichaud, 2008), specification of parameter val-ues to describe the purpose and constraints of collected information (Knol, Slottje, van der Sluijs, & Lebret, 2010). These opinions can be synthesized from different formats, including; qualitative ex-pressions (description with words to explain causal relationships or potential origin of data uncer-tainty), quantitative numeration (relative or absolute numbers, such as point estimates or data distribution) and graphical data display (e.g. conceptual models and influence figures). Therefore certain factors must be considered, if the study design involves the elicitation of experts, such as; the type and objective of the information acquired and effects of these on the quality of information collected, choice and availability of experts, level of expert interactions, study costs and other viable constraints.
This study primarily evaluated the probability of BE relative to gas connectors from elicited ex-perts. This method provides valuable information for assessing the potential risks involved with gas connector failures and for making good decisions on the best alternative. The Delphi method was chosen for this study, since it allows for indirect interaction among different experts and enables experts to give their opinion on the reliability of the gas connectors.
Delphi method is significant to this study because it allows a diverse group of experts with differ-ent experience and levels of education to give their opinion on risk assessment of gas connectors. The investigator in this study designed an IRB approved (No. 743547) survey which was electroni-cally administered. Experts were categorized based on three criteria; level of education, job title, and service time. Experts in different fields made judgements about probability of events based on their expertise in the field and relative familiarity with the gas connectors. Since expert opinion about the probability of events tend to vary and may sometimes be vague, natural linguistic expressions were applied to characterize the risk associated with events as follows: Very Low (VL), Low (L), Medium (M), High (H), and Very High (VH). However, since natural linguistic expressions cannot be handled by common mathematics due to their ambiguity, FST was introduced as a possible solution. TfN are used as values to represent the linguistic expressions.
3.3.2. Expert selectionExperts were selected from a broad spectrum of fields such as higher education institutions, manu-facturing, construction, regulatory agencies, maintenance, operations, and management to provide risk assessment of gas connectors. Considering the diverse expert opinions on the reliability of the different gas connectors, a weighting score is introduced to characterize the relative quality of the different experts as shown in Table 2. The quality of the expert’s judgement determined the relative importance of the weight given to such expert. Table 2 was incorporated in the survey sent to all the experts. The weighting factors of 10 categorized experts were determined as shown in Table 3.

Page 10 of 19
Olawoyin, Cogent Engineering (2017), 4: 1372731https://doi.org/10.1080/23311916.2017.1372731
The linguistic expressions of the 10 expert categories on the probability of failure of gas connec-tors are: very low (VL), low (L), medium (M), high (H), and very high (VH).
Table 2. Weighted score and composition of the expertsComposition Classification ScoreJob title CEO/President 5
Director/Manager 4
Technical trainer 3
Specialist 2
Worker 1
Service year >40 years 5
30–40 years 4
20–30 years 3
10–20 years 2
5–10 years 1
Education level Doctoral/Professional Degree 5
Master’s degree 4
Bachelor’s degree 3
Associate degree/Trade school 2
Informal education 1
Age >60 years 5
50–59 years 4
40–49 years 3
30–39 years 2
<30 years 1
Table 3. Weighting factors of 10 expert elicited
Notes: For expert i, weighting score = title + service year + educational level + age; scores. For example, for expert 1, his\her title score is 5, service year score is 5, educational level score is 3, and age score is 5, therefore the experts’ weighting score is 5 + 5 + 3 + 5 = 18. The weighting factor is calculated by dividing the weighting score of each expert by the sum of the weighting scores.
∑
weighting score = 151. Therefore, the weighting score of expert 1 is 18151
= 0.1192. The sum of the weighting factors is 1.
No. Title Service year Education level
Age Weighting score
Weighting factor
1 CEO/President ≥40 Bachelor ≥60 18 0.1192
2 Director 20–29 Master 40–49 14 0.0927
3 Director ≥ 40 Bachelor ≥60 17 0.1126
4 Director 20–29 Doctoral 40–49 15 0.0993
5 Director 30–39 Bachelor 50–59 15 0.0993
6 Technical Trainer 10–19 Master 40–49 12 0.0795
7 Specialist 30–39 Master 50–59 14 0.0927
8 Technical Trainer 20–29 Bachelors ≥60 14 0.0927
9 Director 10–19 Master 30–39 12 0.0795
10 CEO/President ≥40 Doctoral ≥60 20 0.1325

Page 11 of 19
Olawoyin, Cogent Engineering (2017), 4: 1372731https://doi.org/10.1080/23311916.2017.1372731
The experts were grouped into five distinct groups for simplification. Experts with same character-istics were grouped together. For example, CEOs with service time greater than 40 years with the same or similar level of education and age were put in one group.
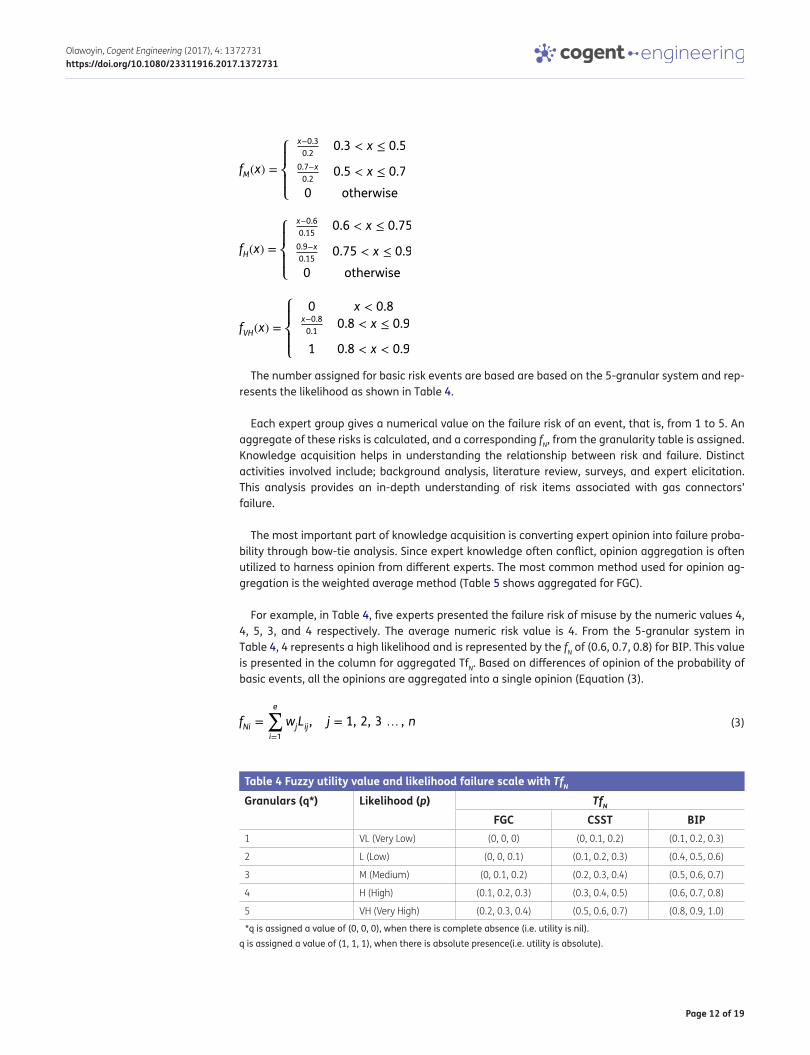
3.3.3. Linguistic terms conversion to fuzzy numbersThe output of the expert elicitation process involves linguistic terms used by the experts to judge the failure probability of the gas connectors. A mathematical estimation system (Chen & Hwang, 1990) is used to systematically convert linguistic terms to their corresponding fN. The conversion scale shown in Figure 4 was used to represent the expert assessment and the membership functions (f(x)) of various linguistic terms, i.e. VL, L, M, H, and VH.
When probability theory is inadequate to represent all types of uncertainties, the FST introduced by (Zadeh, 1965) has recently been applied by researchers. In this approach, A = {x, μx) is a fuzzy collection of an ordered pair that models the relationship between an uncertain quantity x and the membership function μx within the range of 0 and 1. The main difference between FST and tradi-tional set theory is that in the traditional set theory, x is either a member of the set A or not. In FST, x can be a member of set A with a degree of membership μx (Eierdanz, Alcamo, Acosta-Michlik, Krömker, & Tänzler, 2008). This study utilizes TfN to determine the likelihood of occurrence of a risk and to provide quantitative values to uncertainty in expert opinion.
The method of converting expert opinion and respective membership functions is as shown in Equation (2).
fVL(x) =
⎧
⎪
⎨
⎪
⎩
0 0 < x0.2−X
0.10.1 < x ≤ 0.2
0 otherwise
fL(x) =
⎧
⎪
⎨
⎪
⎩
X−0.1
0.150.1 < x ≤ 0.25
0.4−X
0.150.25 < x ≤ 0.4
0 otherwise
Figure 4. Scale function schematic of membership function vs. the fuzzy number.
Page 12 of 19
Olawoyin, Cogent Engineering (2017), 4: 1372731https://doi.org/10.1080/23311916.2017.1372731
The number assigned for basic risk events are based are based on the 5-granular system and rep-resents the likelihood as shown in Table 4.
Each expert group gives a numerical value on the failure risk of an event, that is, from 1 to 5. An aggregate of these risks is calculated, and a corresponding fN, from the granularity table is assigned. Knowledge acquisition helps in understanding the relationship between risk and failure. Distinct activities involved include; background analysis, literature review, surveys, and expert elicitation. This analysis provides an in-depth understanding of risk items associated with gas connectors’ failure.
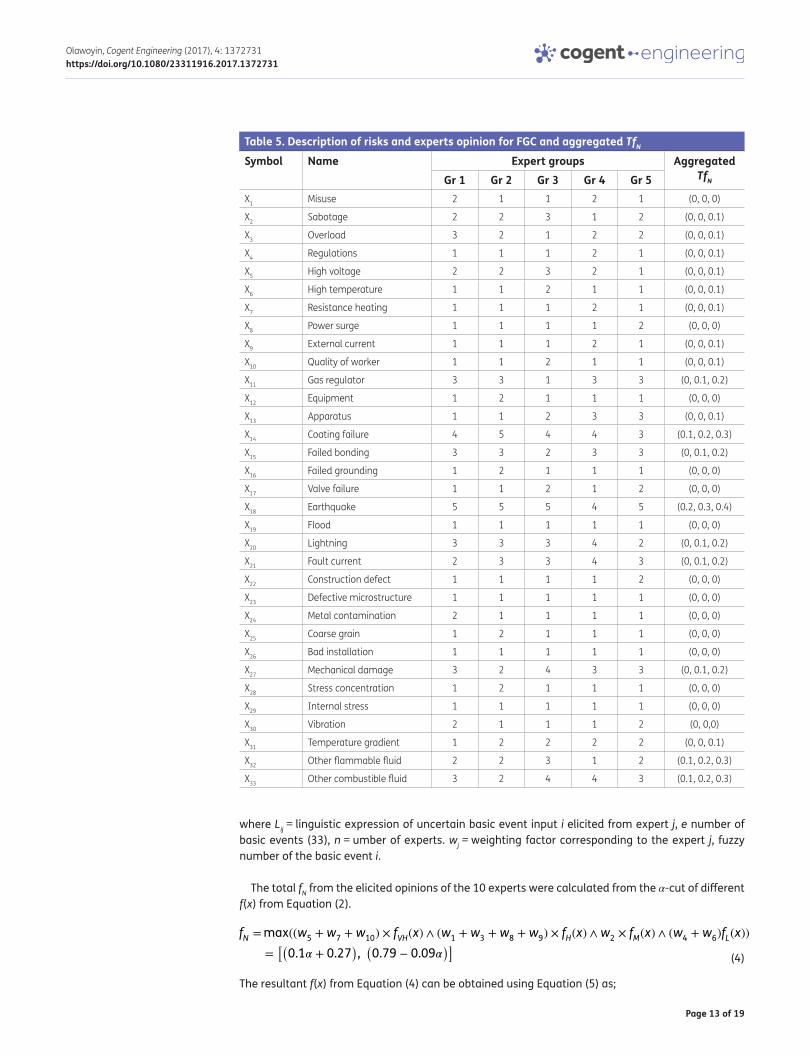
The most important part of knowledge acquisition is converting expert opinion into failure proba-bility through bow-tie analysis. Since expert knowledge often conflict, opinion aggregation is often utilized to harness opinion from different experts. The most common method used for opinion ag-gregation is the weighted average method (Table 5 shows aggregated for FGC).
For example, in Table 4, five experts presented the failure risk of misuse by the numeric values 4, 4, 5, 3, and 4 respectively. The average numeric risk value is 4. From the 5-granular system in Table 4, 4 represents a high likelihood and is represented by the fN of (0.6, 0.7, 0.8) for BIP. This value is presented in the column for aggregated TfN. Based on differences of opinion of the probability of basic events, all the opinions are aggregated into a single opinion (Equation (3).
fM(x) =
⎧
⎪
⎨
⎪
⎩
x−0.3
0.20.3 < x ≤ 0.5
0.7−x
0.20.5 < x ≤ 0.7
0 otherwise
fH(x) =
⎧
⎪
⎨
⎪
⎩
x−0.6
0.150.6 < x ≤ 0.75
0.9−x
0.150.75 < x ≤ 0.9
0 otherwise
fVH(x) =
⎧
⎪
⎨
⎪
⎩
0 x < 0.8x−0.8
0.10.8 < x ≤ 0.9
1 0.8 < x < 0.9
(3)fNi =
e∑
i=1
wjLij , j = 1, 2, 3 … , n
Table 4 Fuzzy utility value and likelihood failure scale with TfN
*q is assigned a value of (0, 0, 0), when there is complete absence (i.e. utility is nil).q is assigned a value of (1, 1, 1), when there is absolute presence(i.e. utility is absolute).
Granulars (q*) Likelihood (p) TfN
FGC CSST BIP1 VL (Very Low) (0, 0, 0) (0, 0.1, 0.2) (0.1, 0.2, 0.3)
2 L (Low) (0, 0, 0.1) (0.1, 0.2, 0.3) (0.4, 0.5, 0.6)
3 M (Medium) (0, 0.1, 0.2) (0.2, 0.3, 0.4) (0.5, 0.6, 0.7)
4 H (High) (0.1, 0.2, 0.3) (0.3, 0.4, 0.5) (0.6, 0.7, 0.8)
5 VH (Very High) (0.2, 0.3, 0.4) (0.5, 0.6, 0.7) (0.8, 0.9, 1.0)
Page 13 of 19
Olawoyin, Cogent Engineering (2017), 4: 1372731https://doi.org/10.1080/23311916.2017.1372731
where Lij = linguistic expression of uncertain basic event input i elicited from expert j, e number of basic events (33), n = umber of experts. wj = weighting factor corresponding to the expert j, fuzzy number of the basic event i.
The total fN from the elicited opinions of the 10 experts were calculated from the α-cut of different f(x) from Equation (2).
The resultant f(x) from Equation (4) can be obtained using Equation (5) as;
(4)
fN =max((w5+w
7+w
10) × fVH(x) ∧ (w
1+w
3+w
8+w
9) × fH(x) ∧w2
× fM(x) ∧ (w4+w
6)fL(x))
=[(
0.1� + 0.27)
,(
0.79 − 0.09�)]
Table 5. Description of risks and experts opinion for FGC and aggregated TfN
Symbol Name Expert groups Aggregated TfNGr 1 Gr 2 Gr 3 Gr 4 Gr 5
X1 Misuse 2 1 1 2 1 (0, 0, 0)
X2 Sabotage 2 2 3 1 2 (0, 0, 0.1)
X3 Overload 3 2 1 2 2 (0, 0, 0.1)
X4 Regulations 1 1 1 2 1 (0, 0, 0.1)
X5 High voltage 2 2 3 2 1 (0, 0, 0.1)
X6 High temperature 1 1 2 1 1 (0, 0, 0.1)
X7 Resistance heating 1 1 1 2 1 (0, 0, 0.1)
X8 Power surge 1 1 1 1 2 (0, 0, 0)
X9 External current 1 1 1 2 1 (0, 0, 0.1)
X10 Quality of worker 1 1 2 1 1 (0, 0, 0.1)
X11 Gas regulator 3 3 1 3 3 (0, 0.1, 0.2)
X12 Equipment 1 2 1 1 1 (0, 0, 0)
X13 Apparatus 1 1 2 3 3 (0, 0, 0.1)
X14 Coating failure 4 5 4 4 3 (0.1, 0.2, 0.3)
X15 Failed bonding 3 3 2 3 3 (0, 0.1, 0.2)
X16 Failed grounding 1 2 1 1 1 (0, 0, 0)
X17 Valve failure 1 1 2 1 2 (0, 0, 0)
X18 Earthquake 5 5 5 4 5 (0.2, 0.3, 0.4)
X19 Flood 1 1 1 1 1 (0, 0, 0)
X20 Lightning 3 3 3 4 2 (0, 0.1, 0.2)
X21 Fault current 2 3 3 4 3 (0, 0.1, 0.2)
X22 Construction defect 1 1 1 1 2 (0, 0, 0)
X23 Defective microstructure 1 1 1 1 1 (0, 0, 0)
X24 Metal contamination 2 1 1 1 1 (0, 0, 0)
X25 Coarse grain 1 2 1 1 1 (0, 0, 0)
X26 Bad installation 1 1 1 1 1 (0, 0, 0)
X27 Mechanical damage 3 2 4 3 3 (0, 0.1, 0.2)
X28 Stress concentration 1 2 1 1 1 (0, 0, 0)
X29 Internal stress 1 1 1 1 1 (0, 0, 0)
X30 Vibration 2 1 1 1 2 (0, 0,0)
X31 Temperature gradient 1 2 2 2 2 (0, 0, 0.1)
X32 Other flammable fluid 2 2 3 1 2 (0.1, 0.2, 0.3)
X33 Other combustible fluid 3 2 4 4 3 (0.1, 0.2, 0.3)

Page 14 of 19
Olawoyin, Cogent Engineering (2017), 4: 1372731https://doi.org/10.1080/23311916.2017.1372731
3.3.4. DefuzzificationThe outcome of incorporating fuzzy ratings in FTA yields fN and for the relationship between them to be clearly defined, the process of defuzzification is used to convert fN into a crisp real score Q, which is the Fuzzy Possibility Score (Fps). The Fps characterizes the highest potential confidence an expert can express about a basic event occurring. The fuzzy ranking system proposed by Chen and Hwang (1990) (shown in Equation (6)) was used in this study, with the definition of the minimum (fmin(x)) and maximum (fmin(x)) sets.
Note; x = fN.
Therefore, the two- sided utility score of fuzzy number Q can be calculated from Equations (7)–(8).
Since the two-sided scores have been obtained, the Fps the fuzzy number Q, can then be repre-sented by Equation (9):
3.3.5. Transforming Fps to fuzzy failure probability (Ffp)Using the thermal conductivity (property of a material to conduct heat), density (property of metals due to the tightly packed crystal lattice of the metallic structure), thermal expansion (tendency of matter to change in volume in response to a change in temperature, through heat transfer), tem-perature, wall thickness, and malleability factors, the probabilities (real numbers) of the basic events were determined in the FTA. Other probabilities for the gas connector failures were obtained through the expert elicitation method. For consistency, the FTA probabilities and the Fpsere integrated follow-ing the Ffp defined in Equation 10 (Onisawa, 1990). The probability of lightning events damaging the BIP, CSST and FGC are; 9.22 × 10⁻¹, 3.64 × 10⁻³, 1.74 × 10⁻⁵ respectively. The failure probability of other fuzzy events were determined in the same way. When all the probabilities of the basic events were included, the calculated Pr(TE) from Equation (1) is 5.138 × 10⁻².
3.3.6. Important analysis of basic event (BE)An important analysis of BE determines Im for the overall analysis and it is a critical process in the quantitative analysis of gas connector failures. The value of Im idicates the importance of a BE in a failure occurrence of the TE. The higher the value of Im the more important the role of the BE is in caus-ing the TE failure. The summarized expression of the TE-FPr is expressed as shown in Equation (11).
In this study, a combination of failure probabilities and expert opinions were integrated to determine the failure risks of the TE of gas connectors. The Im of the BEs (Xi) are obtained from Equation (12):
(5)𝜇N(x) =
⎧
⎪
⎪
⎨
⎪
⎪
⎩
x−0.27
0.10.27 < x ≤ 0.37
1 0.37 < x ≤ 0.90.79−x
0.090.9 < x < 0.79
0 otherwise
(6)fmin
(x)
{
1 − x 0 ≤ x ≤ 1;
0 otherwisefmax
(x)
{
x 0 ≤ x ≤ 1
0 otherwise
(7)�L(Q) = sup[�N(x) ∧ fmin(x)] = 0.6458
(8)�R(Q) = sup[�N(x) ∧ fmax(x)] = 0.7198
(9)�T
(
Q)
= Fps =
{(
1 − �L(N))
+ �R(N)
2
}
= 0.5377
(10)Ffp =
{
1
10kFPS ≠ 0
0 FPS = 0where k =
[
1 − FPS
FPS
]1
3
× 2.301
(11)P(T) = g(
F1, F2, … , Fn)

Page 15 of 19
Olawoyin, Cogent Engineering (2017), 4: 1372731https://doi.org/10.1080/23311916.2017.1372731
The influence of BEs on the probability of TE could be assessed quantitatively, since the failure prob-abilities of BEs are known. The important analysis of BEs determined for the gas connectors and presented in Table 6. The importance measure for lightning hazard (X20) was determined as 1.47 × 10⁻², while the importance measure for bad installation (X26) was 1.03 × 10⁻¹.
3.4. Risk Index calculation for gas connectorsIt is important for risk management systems to include risk analysis of the system components. In quantitative risk analysis, risk to a component (Ri) is measured as the product of likelihood of the occurrence of any undesired event (Li) and the consequence of the corresponding undesirable event (Ci), as shown in Equation (13).
This method is also incorporated in calculating the failure risks of the three types of gas connec-tors studied, based on the quantitative probabilities and the elicited expert opinions. The likelihood of the occurrence of an event is given by experts. The Fuzzy-based bow-tie analysis is used to obtain the likelihood of each output event. Fuzzy synthetic evaluation that utilizes a linearized weighting scheme for evaluation is applied to determine the fuzzy risk. The Fuzzy-rule-base (FRB) technique (Mamdani, 1977) combines fuzzy likelihood and consequences to determine the fuzzy risk, Ri: If L is Ai and C is Bi then Risk is Zi; i = 1, 2, 3, &, k; where the antecedent (likelihood, L and consequences, C) and the consequent (Ri) are linguistic variables, whereas Ai and Zi are linguistic constants. A new fuzzy likelihood scale consisting of five linguistic constants as shown in Table 4 is a result of the transformation of the likelihood functions obtained from the bow-tie analysis.
(12)Imi =�g
[
F(t)]
�Fi(t)
Fi(t)
g[
F(t)]
(13)Ri == Li × Ci
Table 6. Importance analyses of BEs of gas connectorsBasic events (BEs) Importance measure (Im) Basic events (BEs) Importance measure (Im)X22 1.28 × 10
−1 X23 1.27 × 10−5
X26 1.03 × 10−1 X28 6.59 × 10
−6
X25 8.46 × 10−2 X3 5.22 × 10
−6
X29 6.01 × 10−2 X13 4.11 × 10
−6
X10 5.78 × 10−2 X32 3.96 × 10
−6
X2 5.24 × 10−2 X33 8.62 × 10
−8
X27 5.78 × 10−2 X30 7.58 × 10
−8
X1 4.63 × 10−2 X8 5.14 × 10
−8
X12 3.88 × 10−2 X31 3.06 × 10
−8
X4 3.52 × 10−2 X9 2.19 × 10
−8
X24 3.06 × 10−2 X16 1.66 × 10
−8
X21 2.54 × 10−2 X14 6.75 × 10
−9
X5 2.02 × 10−2 X15 4.48 × 10
−9
X20 1.47 × 10−2 X18 3.33 × 10
−9
X7 1.31 × 10−2 X17 1.53 × ×10
−9
X19 9.65 × 10−3 X11 1.09 × 10
−9
X18 1.44 × 10⁻⁵

Page 16 of 19
Olawoyin, Cogent Engineering (2017), 4: 1372731https://doi.org/10.1080/23311916.2017.1372731
3.4.1. Consequence of output eventGas connector damages can result in a number of consequences such as: environmental damage, property damage, social damages, and economic damages. The magnitude of these consequences is influenced by factors such as perforation, rupture, mechanical forces, and operational character-istics. Figure 5 shows the hierarchical structure for consequences of each output event.
The leading path is significant for determining the likelihood of each output event if the likelihood of the critical event is known. Upon failure of the connector, the gas released in a confined space will result to detonation (output event—OE1), if an ignition source is present.
From the TfN determined from the elicited experts, the likelihood of ignition source and confined space to be present after the failure of the gas connectors are “0.95, 1.0, 1.0 and 0.90, 0.95, 1.0” respectively.
The summary of the total risk (risk index) from OE were calculated based on the extant study by Tesfamaraim and Saatcioglu (2008) and presented in Table 7. The fuzzy consequence of OE for hu-man, societal and the economic facts were determined using assigned weights from the FTA. The individual risk index for BIP, CSST and FGC were determined as 3.04, 1.12 and 0.86 respectively. Risk index above unity indicates quantifiable risk and enhanced precautions are needed for the safety of people, property and the environment.
Figure 5. Consequence analysis of failures to gas connectors in residential buildings.
Table 7. Fuzzy consequence for OE
Notes: F = Fatality, I&I = Injuries and Illnesses, SAR = Societal anxiety and response, MUA = Material use and acceptability, RC = Repair cost, PTPD = Property and third party damages, IL = Insurance and liabilities, MRL = Materials and relocation losses.
Generation 3 Generation 2 Generation 1Factor Weight Utility Fuzzy value Factor (weight) Individual Overall Risk index
Consequence ConsequenceF 0.70 High (0, 0, 0.5, 1.0, 0.5) Human (0.50) (0, 0.05, 0.30, 0.45, 0.20) (0, 0.06, 0.33, 0.44, 0.18) 4.63
I&I 0.30 High (0, 0, 0.5, 1.0, 0.5)
SAR 0.60 High (0, 0, 0.5, 1.0, 0.5) Societal (0.30) (0, 0.10, 0.35, 0.40, 0.15) 3.15
MUA 0.40 High (0, 0, 0.5, 1.0, 0.5)
RC 0.20 Medium (0, 0.5, 1.0, 0.5, 0) Economical (0.20) (0, 0.05, 0.30, 0.45, 0.20) 1.28
PTPD 0.30 High (0, 0, 0.5, 1.0, 0.5)
IL 0.20 Medium (0, 0.5, 1.0, 0.5, 0)
MRL 0.30 High (0, 0, 0.5, 1.0, 0.5)

Page 17 of 19
Olawoyin, Cogent Engineering (2017), 4: 1372731https://doi.org/10.1080/23311916.2017.1372731
The outcomes of this study are important and would provide further insight to; risk evaluators, investigators and professionals in effectively managing the risks associated with gas connectors, especially in deciding on the choice of materials for utilities and determining appropriate preventive, protective and corrective measures for the overall risk reduction of gas connector failures.
3.4.2. Sensitivity analysis for the bow-tie and consequence analysesFuzziness or data uncertainties are characteristically present in diverse factors, affecting the out-come of an analysis. Bow-tie analysis, integrating the elicitation of experts to provide a quantitative estimation of the possibility of the TE to occur as OE, may be used without categorizing most sub-stantial input events. By introducing a sensitivity analysis (SA), this study systematically evaluated quantitative information for the purpose of identifying sources of uncertainty, variability and areas of weakness in the risk analysis process for the gas connectors. The SA bow-tie analysis was done by calculating the contributions of each BE, resulting to the TE (as OE). As shown, this study identified 33 BEs as presented in Figure 2 with the importance measures, presented in Table 6. Iteration trials were modeled for several scenarios, to approximate the likelihood of events that may lead to out-come events and the associated uncertainties were accounted for in the models by assigning fuzzy probability distribution to the BEs. Assumptions were made for each factor as a quarter of the mean, based on the standard deviation, observed and estimated values. From the SA, misuse, manufactur-ing defect, installation problems and critical temperature (such as from arching from lightning) were identified as the most contributing impact factors to the likelihood of OE1’s occurrence. It was also observed the contributions of each of these input events varied based on the dependency relation-ship, as compared to other factors. With assumption of independent factors relation, the mean ab-solute percentage error for the different groups of BEs modeled, varied from 19.4 to 28.2%, however, for perfect dependencies, the failure BEs varied from 6.5 to 22.7%.
4. ConclusionThe multi-dimensional risk model from complex risk scenarios and outcomes were synthesized with the integration of fuzzy synthetic evaluation (FSE) and fuzzy rule base (FRB) techniques in this study. This is effective for the assessment and quantification of both individual risk and the overall risk of failure events on gas connectors, with the goal of understanding the failure activities and planning for the minimization of the potential risks. The analysis of feedback from the expert elicitation method, incorporated with fuzzy set theories (FST) minimized the uncertainty and fuzziness of the potential failure events. The probability of lightning damaging the BIP, CSST and FGC materials were determined as; 9.2 × 10⁻¹, 3.6 × 10⁻³ and 1.7 × 10⁻⁵ respectively. The failure probability of other fuzzy events were determined in the same way. The calculated Pr(TE) was determined as 5.1 × 10⁻². Based on experts suggestions and analysis, the FGCx is safer for use and have the lowest failure risk compared to BIP.
The ingenuity of this study include; application of qualitative linguistic terms converted into FPr collating experts’ judgements for BE with vague and imprecise data, integrating the proposed framework into the calculation of the Im for BE of the FTA and lastly, determining the systems relia-bility measures by defining the TE-FPr and MCS ranking. The intrinsic benefits of the proposed frame-work include: (i) ability to evaluate BE-FPr of different engineering systems by applying expert judgements conveyed in linguistic expressions; (ii) ability to determine influences of subjectivity and fuzziness of experts’ linguistic expressions of the depiction of the BE-FPr. To establish the viability of the framework proposed in this study, the model outputs are representative only of experts’ opin-ions with keen knowledge of the operability of gas connectors in buildings.
The outcome of this study will be improved on in future research by collecting actual data from gas connectors by type, usage, age, risk factors and condition, to show the applicability of the method used in this study. The future study will also involve comprehensive sensitivity analysis that will consider the operator aggregates and weights effects as model predictors and integrate the effect of the individual risk events on the overall gas connector system. The fuzzy risk assessment method is effective for the purpose of this study, however, it is financially expensive and time consuming. It is recommended that its use should be limited to the major accident scenarios requiring high level of details and precision.

Page 18 of 19
Olawoyin, Cogent Engineering (2017), 4: 1372731https://doi.org/10.1080/23311916.2017.1372731
FundingThe author received no direct funding for this research.
Author detailsRichard Olawoyin1
E-mail: [email protected] ID: http://orcid.org/0000-0002-3310-59981 Environmental Health and Safety, School of Health Sciences,
Oakland University, Rochester, MI, USA.
Citation informationCite this article as: Risk and reliability evaluation of gas connector systems using fuzzy theory and expert elicitation, Richard Olawoyin, Cogent Engineering (2017), 4: 1372731.
Cover imageSource: Open source images.
ReferencesAhmadi-Nedushan, B., St-Hilaire, A., Bérubé, M., Ouarda, T., &
Robichaud, É. (2008). Instream flow determination using a multiple input fuzzy-based rule system: A case study. River Research and Applications, 24, 279–292. https://doi.org/10.1002/(ISSN)1535-1467
Barker, B. (2014). Corrugated stainless steel tubing & flexible appliance connectors. Retrieved June 4, 2016 from http://www.ashireporter.org/HomeInspection/Articles/Corrugated-Stainless-Steel-Tubing-Flexible-Appliance-Connectors/13613
Brito, A. J., & de Almeida, A. T. (2009). Multi-attribute risk assessment for risk ranking of natural gas pipelines. Reliability Engineering & System Safety, 94, 187–198. https://doi.org/10.1016/j.ress.2008.02.014
Chanda, R. S., & Bhattacharjee, P. K. (1998). A reliability approach to transmission expansion planning using fuzzy fault tree model. Electric Power Systems Research, 45, 101–108. https://doi.org/10.1016/S0378-7796(97)01226-1
Chen, Sh. J., & Hwang, Ch. L. (1990). Fuzzy multiple attribute decision making methods and applications (pp. 138–150). Berlin: Springer.
Cheng, C. H., & Mon, D. L. (1993). Fuzzy system reliability analysis by interval of confidence. Fuzzy Sets and Systems, 56, 29–35. https://doi.org/10.1016/0165-0114(93)90182-H
Dedianous, V., & Fiévez, C. (2006). ARAMIS project: A more explicit demonstration of risk control through the use of bow–tie diagrams and the evaluation of safety barrier performance. Journal of Hazardous Materials, 130, 220–233. https://doi.org/10.1016/j.jhazmat.2005.07.010
Duijm, N. J. (2009). Safety-barrier diagrams as a safety management tool. Reliability Engineering & System Safety, 94, 332–341. https://doi.org/10.1016/j.ress.2008.03.031
Eierdanz, F., Alcamo, J., Acosta-Michlik, L., Krömker, D., & Tänzler, D. (2008). Using fuzzy set theory to address the uncertainty of susceptibility to drought. Regional Environmental Change, 8, 197–205. https://doi.org/10.1007/s10113-008-0069-1
Ferdous, R., Khan, F., Sadiq, R., Amyotte, P., & Veitch, B. (2011). Fault and event tree analyses for process systems risk analysis: Uncertainty handling formulations. Risk Analysis, 31, 86–107. https://doi.org/10.1111/j.1539-6924.2010.01475.x
Furuta, H., & Shiraishi, N. (1984). Fuzzy importance in fault tree analysis. Fuzzy Sets and Systems, 12, 205–213. https://doi.org/10.1016/0165-0114(84)90068-X
Guimarees, A. C., & Ebecken, N. (1999). Fuzzy FTA: A fuzzy fault tree system for uncertainty analysis. Annals of Nuclear Energy, 26, 523–532. https://doi.org/10.1016/S0306-4549(98)00070-X
Huang, D., Chen, T., & Wang, J. M. (2001). A fuzzy set approach for event tree analysis. Fuzzy Sets and Systems, 118, 153–165. https://doi.org/10.1016/S0165-0114(98)00288-7
Huang, H. Z., Tong, X., & Zuo, M. J. (2004). Posbist fault tree analysis of coherent systems. Reliability Engineering & System Safety, 84, 141–148. https://doi.org/10.1016/j.ress.2003.11.002
IAEA. (2007). IAEA safety glossary, terminology used in nuclear safety and radiation protection. Vienna: Author.
Jo, Y. D., & Ahn, B. J. (2002). Analysis of hazard areas associated with high-pressure natural-gas pipelines. Journal of Loss Prevention in the Process Industries, 15, 179–188. https://doi.org/10.1016/S0950-4230(02)00007-4
Khakzad, N., Khan, F., & Amyotte, P. (2012). Dynamic risk analysis using bow-tie approach. Reliability Engineering & System Safety, 104, 36–44. https://doi.org/10.1016/j.ress.2012.04.003
Khakzad, N., Khan, F., & Paltrinieri, N. (2014). On the application of near accident data to risk analysis of major accidents. Reliability Engineering & System Safety, 126, 116–125. https://doi.org/10.1016/j.ress.2014.01.015
Khan, F. (2001). Use of maximum credible accident scenarios for realistic and reliable risk assessment. Chemical Engineering Progress, 11, 56–64.
Knol, A. B., Slottje, P., van der Sluijs, J. P., & Lebret, E. (2010). The use of expert elicitation in environmental health impact assessment: A seven step procedure. Environmental Health, 9(19). doi:10.1186/1476-069X-9-19
Krueger, T., Page, T., Hubacek, K., Smith, L., & Hiscock, K. (2012). The role of expert opinion in environmental modelling. Environmental Modelling & Software, 36, 4–18. doi:10.1016/j.envsoft.2012.01.011
Liang, G. S., & Wang, M. J. (1993). Fuzzy fault-tree analysis using failure possibility. Microelectronics Reliability, 33, 583–597. https://doi.org/10.1016/0026-2714(93)90326-T
Liao, K. X., Yao, A. L., & Zhang, H. X. (2001). Fault tree analysis of pipelines. Oil and Gas Transmission, 20, 27–30.
Mamdani, E. H. (1977). Application of fuzzy logic to approximate reasoning using linguistic synthesis. IEEE Transactions on Computers, C-26, 1182–1191. https://doi.org/10.1109/TC.1977.1674779
Markowski, A. S., Mannan, M. S., & Bigoszewska, A. (2009). Fuzzy logic for process safety analysis. Journal of Loss Prevention in the Process Industries, 22, 695–702. https://doi.org/10.1016/j.jlp.2008.11.011
Misra, K. B., & Weber, G. G. (1990). Use of fuzzy set theory for level-I studies in probabilistic risk assessment. Fuzzy Sets and Systems, 37, 139–160. https://doi.org/10.1016/0165-0114(90)90038-8
Olawoyin, R., & McGlothlin, C. W. (2015). Explorative history of fuel gas connectors’ development and related regulatory standards. Journal of Natural Gas Science and Engineering, 27, 1470–1481. https://doi.org/10.1016/j.jngse.2015.10.014
Onisawa, T. (1990). An application of fuzzy concepts to modelling of reliability analysis. Fuzzy Sets and Systems, 37, 267–286. https://doi.org/10.1016/0165-0114(90)90026-3
Oster, H. J. (1998). Gas connectors: An explosive problem. Fire Engineering, 151, 101–106.
Ping, H., Zhang, H., & Zuo, M. J. (2007). Fault tree analysis based on fuzzy logic. Annual Reliability and Maintainability Symposium, 10, 77–82.
Purba, J. H., Lu, Jie, Zhang, G., & Pedrycz, W. (2013). A fuzzy reliability assessment of basic events of fault trees through qualitative data processing. Fuzzy Sets and Systems, 243, 50–69.
Rai, V. (2013). Expert elicitation methods for studying technological change under uncertainty. Environmental Research Letters, 8, 041003.

Page 19 of 19
Olawoyin, Cogent Engineering (2017), 4: 1372731https://doi.org/10.1080/23311916.2017.1372731
© 2017 The Author(s). This open access article is distributed under a Creative Commons Attribution (CC-BY) 4.0 license.You are free to: Share — copy and redistribute the material in any medium or format Adapt — remix, transform, and build upon the material for any purpose, even commercially.The licensor cannot revoke these freedoms as long as you follow the license terms.
Under the following terms:Attribution — You must give appropriate credit, provide a link to the license, and indicate if changes were made. You may do so in any reasonable manner, but not in any way that suggests the licensor endorses you or your use. No additional restrictions You may not apply legal terms or technological measures that legally restrict others from doing anything the license permits.
Cogent Engineering (ISSN: 2331-1916) is published by Cogent OA, part of Taylor & Francis Group. Publishing with Cogent OA ensures:• Immediate, universal access to your article on publication• High visibility and discoverability via the Cogent OA website as well as Taylor & Francis Online• Download and citation statistics for your article• Rapid online publication• Input from, and dialog with, expert editors and editorial boards• Retention of full copyright of your article• Guaranteed legacy preservation of your article• Discounts and waivers for authors in developing regionsSubmit your manuscript to a Cogent OA journal at www.CogentOA.com
Rajakarunakaran, S., Kumar, A. M., & Prabhu, V. A. (2015). Applications of fuzzy faulty tree analysis and expert elicitation for evaluation of risks in LPG refueling station. Journal of Loss Prevention in the Process Industries, 33, 109–123. https://doi.org/10.1016/j.jlp.2014.11.016
Rathnayaka, S., Khan, F., & Amyotte, P. (2013). Accident modeling and risk assessment framework for safety critical decision-making: Application to deep-water drilling operation. Proceedings of the Institution of Mechanical Engineers, Part O: Journal of Risk and Reliability, 227, 86–105.
Sadiq, R., Saint-Martin, E., & Kleiner, Y. (2008). Predicting risk of water quality failures in distribution networks under uncertainties using fault-tree analysis. Urban Water Journal, 5, 287–304. https://doi.org/10.1080/15730620802213504
Shahriar, A., Sadiq, R., & Tesfamariam, S. (2012). Risk analysis for oil & gas pipelines: A sustainability assessment approach using fuzzy based bow-tie analysis. Journal of Loss Prevention in the Process Industries, 25, 505–523. https://doi.org/10.1016/j.jlp.2011.12.007
Shalev, D. M., & Tiran, J. (2007). Conditioned-based fault tree analysis (CBTFA): A new method for improved fault tree analysis (FTA), reliability and safety calculations. Reliability Engineering & System Safety, 92, 1231–1241. https://doi.org/10.1016/j.ress.2006.05.015
Spouge, J. (1999). A guide to quantitative risk assessment for offshore installations. Centre for Marine and Petroleum
Technology CMPT, Publication 99/100a, DNV Technica. ISBN I 870553 365.
Suresh, P. V., Babar, A. K., & Raj, V. V. (1996). Uncertainty in fault tree analysis: A fuzzy approach. Fuzzy Sets and Systems, 83, 135–141. https://doi.org/10.1016/0165-0114(95)00386-X
Tanaka, H., Fan, L., Lai, F. S., & Toguchi, K. (1983). Fault-tree analysis by fuzzy probability. IEEE Transactions on Reliability, R-32, 453–457. https://doi.org/10.1109/TR.1983.5221727
Tesfamaraim, S., & Saatcioglu, M. (2008). Seismic risk assessment of RC buildings using fuzzy synthetic evaluation. Journal of Earthquake Engineering, 12, 1157–1184. https://doi.org/10.1080/13632460802003785
van der Sluijs, J. P., Craye, M., Funtowicz, S., Kloprogge, P., Ravetz, J., & Risbey, J. (2005). Combining quantitative and qualitative measures of uncertainty in model-based environmental assessment: The NUSAP system. Risk Analysis, 25, 2005.
Yuhua, D., & Datao, Y. (2005). Estimation of failure probability of oil and gas transmission pipelines by fuzzy fault tree analysis. Journal of Loss Prevention in the Process Industries, 18, 83–88. https://doi.org/10.1016/j.jlp.2004.12.003
Zadeh, L. A. (1965). Fuzzy sets. Information and Control, 8, 338–353. https://doi.org/10.1016/S0019-9958(65)90241-X
Zhang, G. D., & Lu, Y. X. (1990). Analysis and design of reliability and maintenance of system (pp. 120–125). Beijing: Beijing Aeronautics and Astronautics University Press.
AQ21
AQ21