rieti bbl seminar handout
TRANSCRIPT

RIETI BBL Seminar Handout
February 17, 2016
Speaker: Dr. Randall S. JONES Senior Economist and Head of Japan/Korea Desk,
Economics Department, OECD
http://www.rieti.go.jp/jp/index.html
Research Institute of Economy, Trade and Industry (RIETI)
*Please specify that the source is OECD if you quote this handout.

PRODUCTIVITY: THE MAIN DRIVER OF ECONOMIC GROWTH FOR JAPAN
Randall S. Jones Head, Japan/Korea Desk OECD
Research Institute of Economy, Trade and Industry 17 February 2016

… productivity isn't everything, but in the long run it is almost everything. Paul Krugman,1994
2
I. Overview of recent productivity trends
II. What is causing the productivity slowdown?
III. How to revive productivity growth?
A. Enhancing innovation
B. Strengthening diffusion
C. Improving resource allocation
D. Encouraging risk-taking
IV. Conclusions
3
Outline

I. Overview of Recent Productivity Trends
4
5
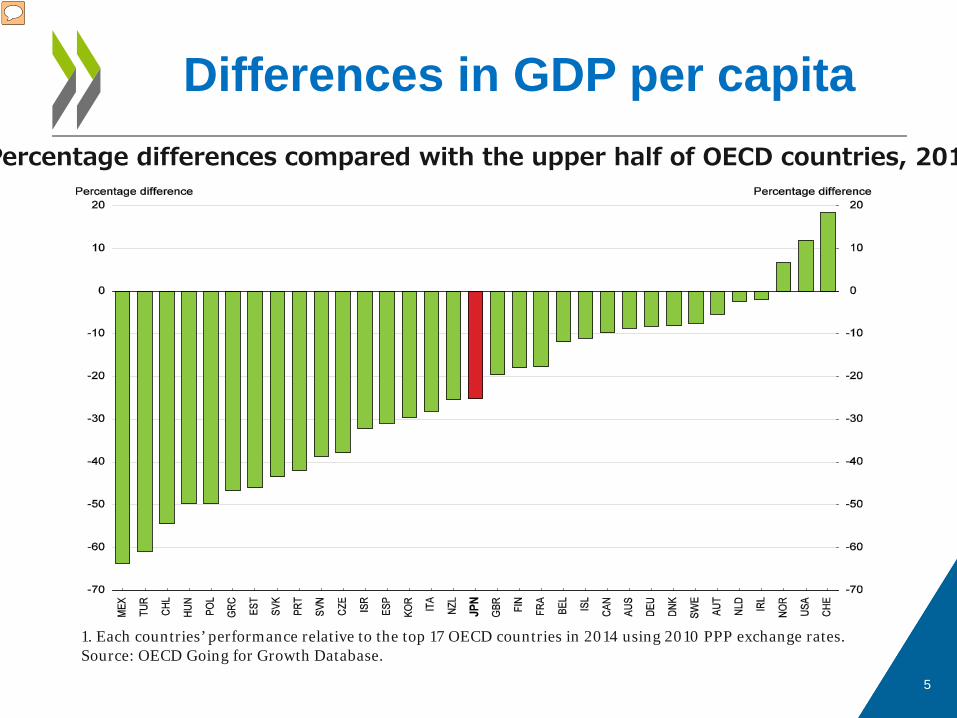
Differences in GDP per capita Percentage differences compared with the upper half of OECD countries, 201
1. Each countries’ performance relative to the top 17 OECD countries in 2014 using 2010 PPP exchange rates. Source: OECD Going for Growth Database.
6
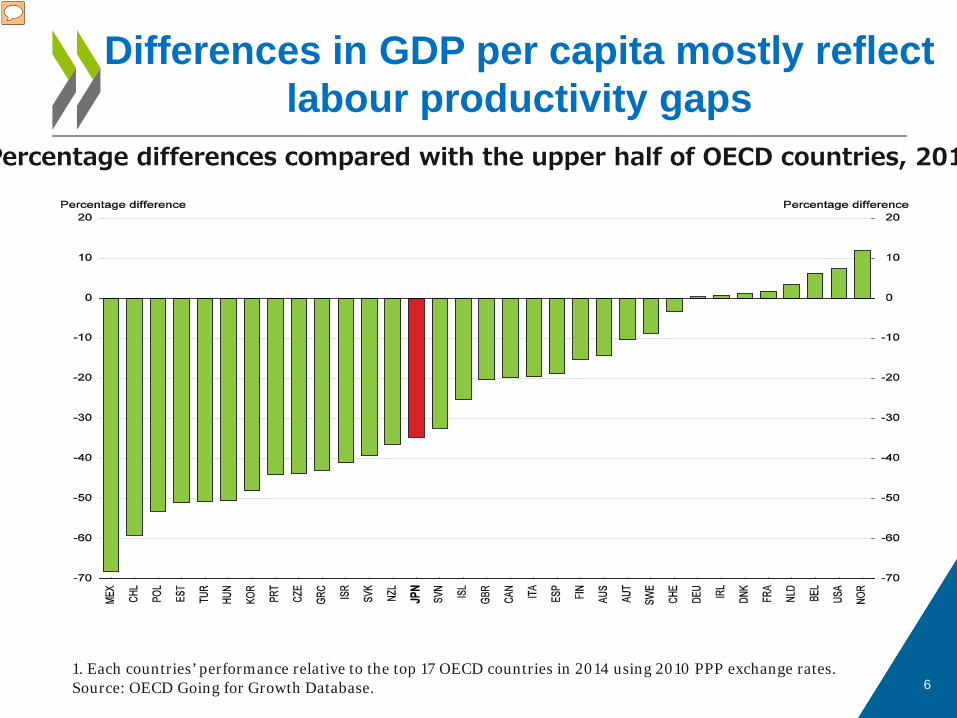
Differences in GDP per capita mostly reflect labour productivity gaps
Percentage differences compared with the upper half of OECD countries, 201
1. Each countries’ performance relative to the top 17 OECD countries in 2014 using 2010 PPP exchange rates. Source: OECD Going for Growth Database.
7
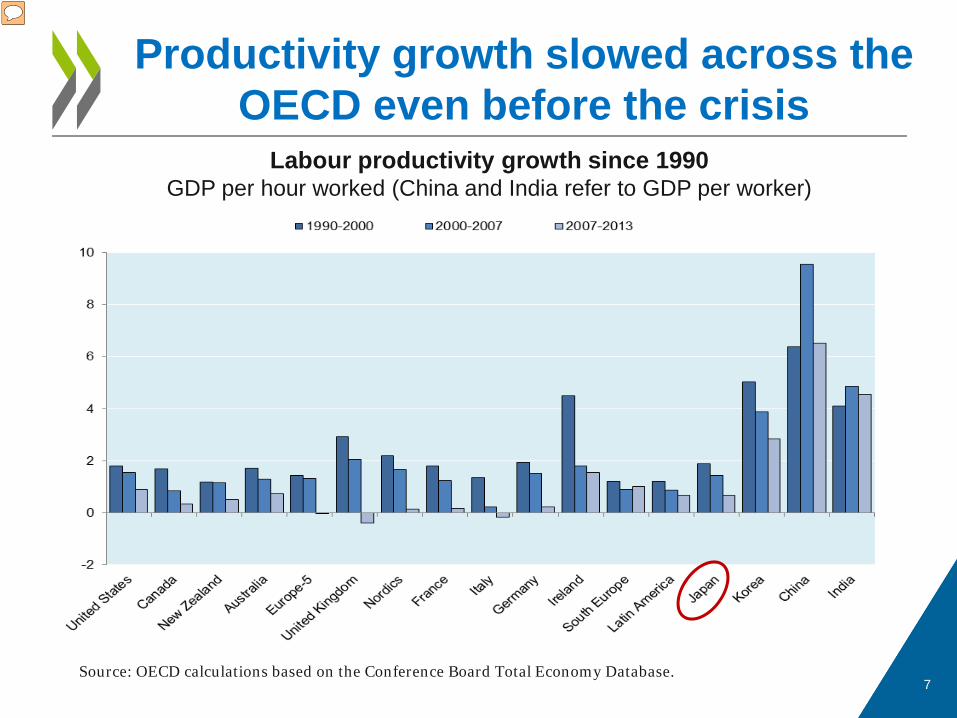
Productivity growth slowed across the OECD even before the crisis
Labour productivity growth since 1990 GDP per hour worked (China and India refer to GDP per worker)
Source: OECD calculations based on the Conference Board Total Economy Database.
80
90
100
110
120
130
140
150
80
90
100
110
120
130
140
150
t 2 4 6 8 10 12 14 16 18 20 22 24 26 28
t=1973Q4 t=1981Q4
t=2000Q3 t=2008Q1
Quarters since the peak
8
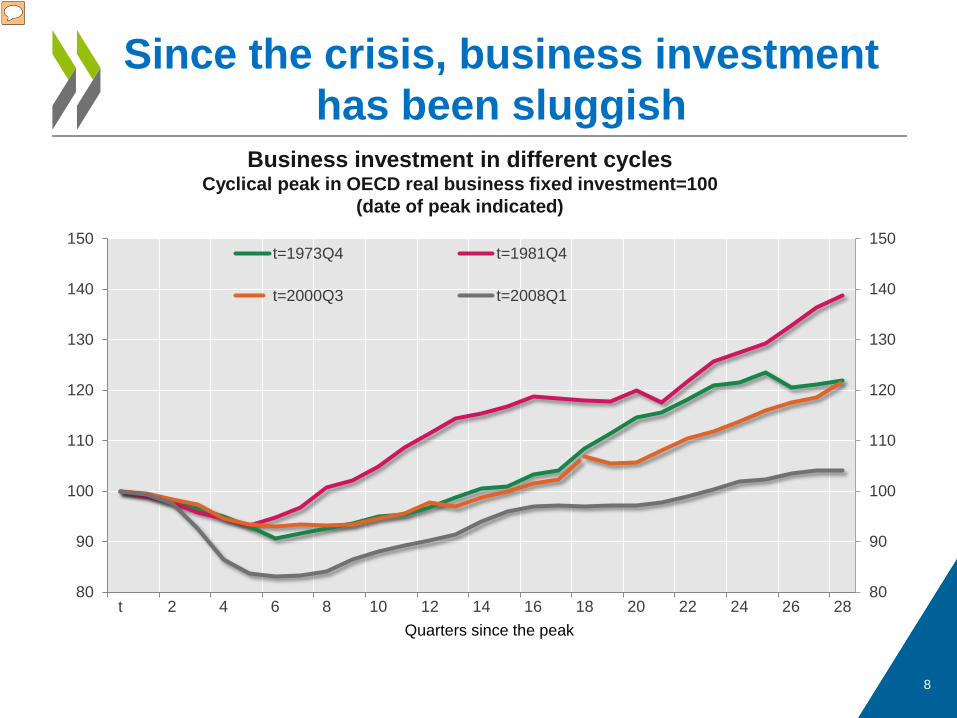
Since the crisis, business investment has been sluggish
Business investment in different cycles Cyclical peak in OECD real business fixed investment=100
(date of peak indicated)
9
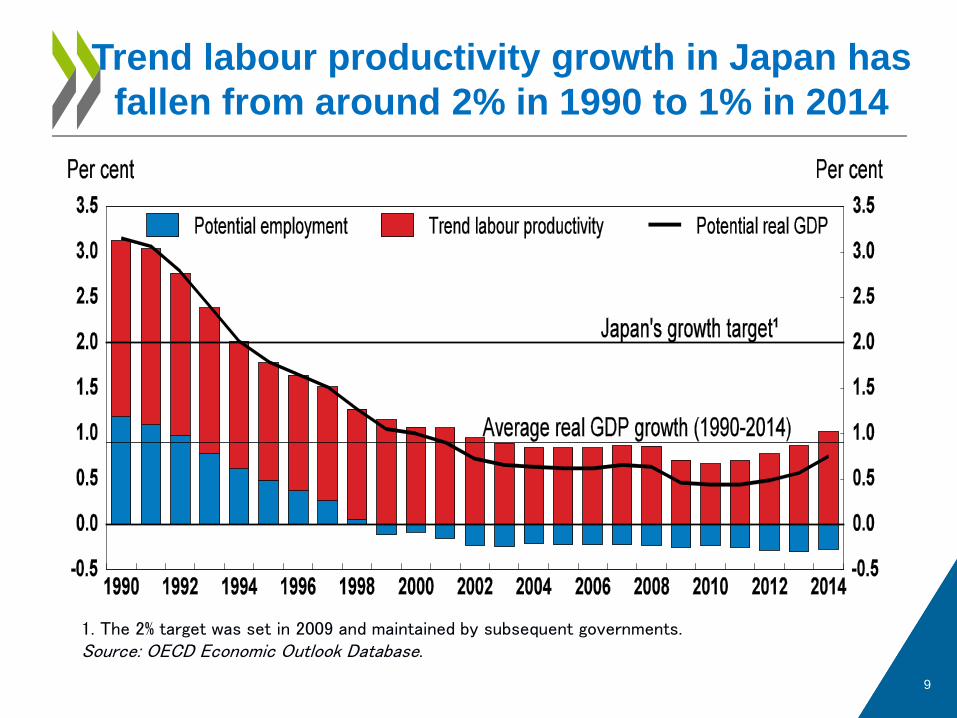
Trend labour productivity growth in Japan has fallen from around 2% in 1990 to 1% in 2014
1. The 2% target was set in 2009 and maintained by subsequent governments. Source: OECD Economic Outlook Database.
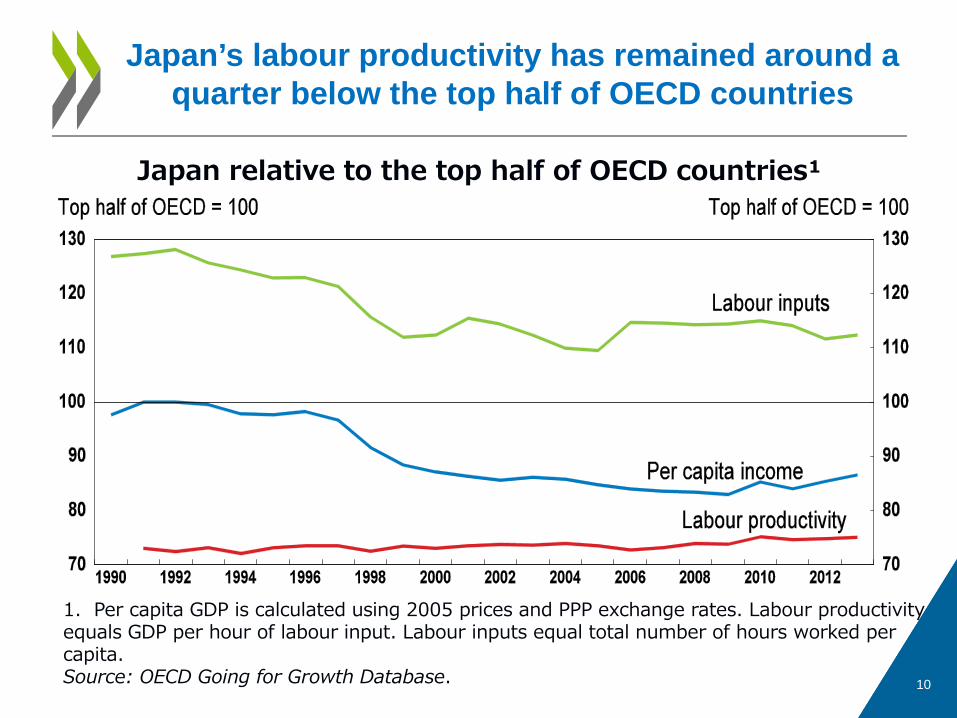
Japan relative to the top half of OECD countries¹
10
Japan’s labour productivity has remained around a quarter below the top half of OECD countries
1. Per capita GDP is calculated using 2005 prices and PPP exchange rates. Labour productivity equals GDP per hour of labour input. Labour inputs equal total number of hours worked per capita. Source: OECD Going for Growth Database.
11
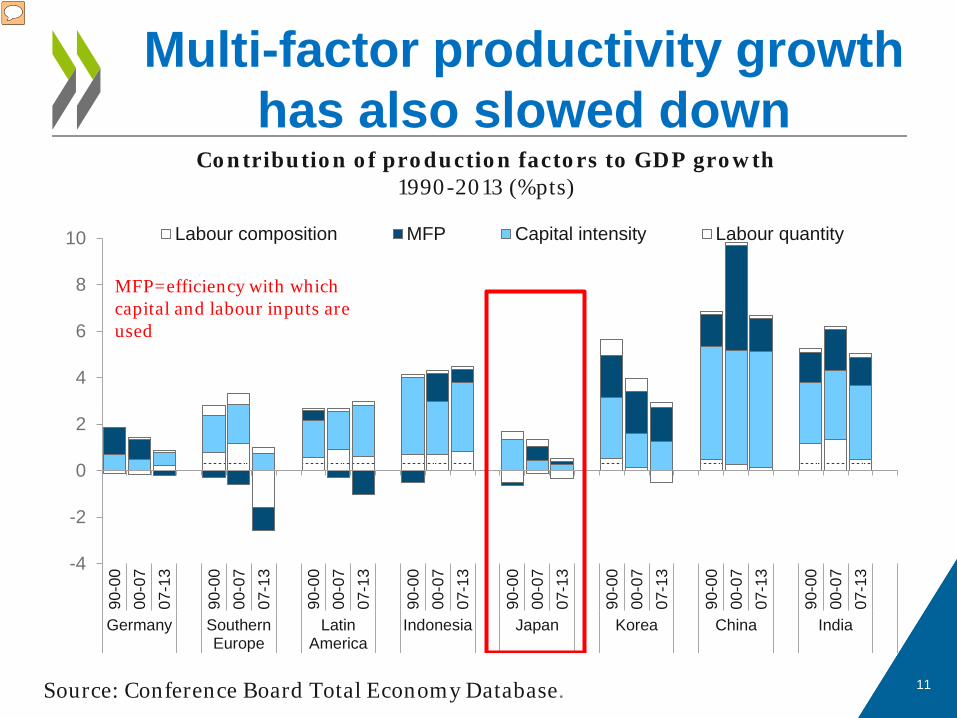
Multi-factor productivity growth has also slowed down
Source: Conference Board Total Economy Database.
Contribution of production factors to GDP growth 1990-2013 (%pts)
-4
-2
0
2
4
6
8
10
90-0
000
-07
07-1
3
90-0
000
-07
07-1
3
90-0
000
-07
07-1
3
90-0
000
-07
07-1
3
90-0
000
-07
07-1
3
90-0
000
-07
07-1
3
90-0
000
-07
07-1
3
90-0
000
-07
07-1
3
Germany SouthernEurope
LatinAmerica
Indonesia Japan Korea China India
Labour composition MFP Capital intensity Labour quantity
MFP=efficiency with which capital and labour inputs are used

II. What is Causing the Productivity
Slowdown?
12
13
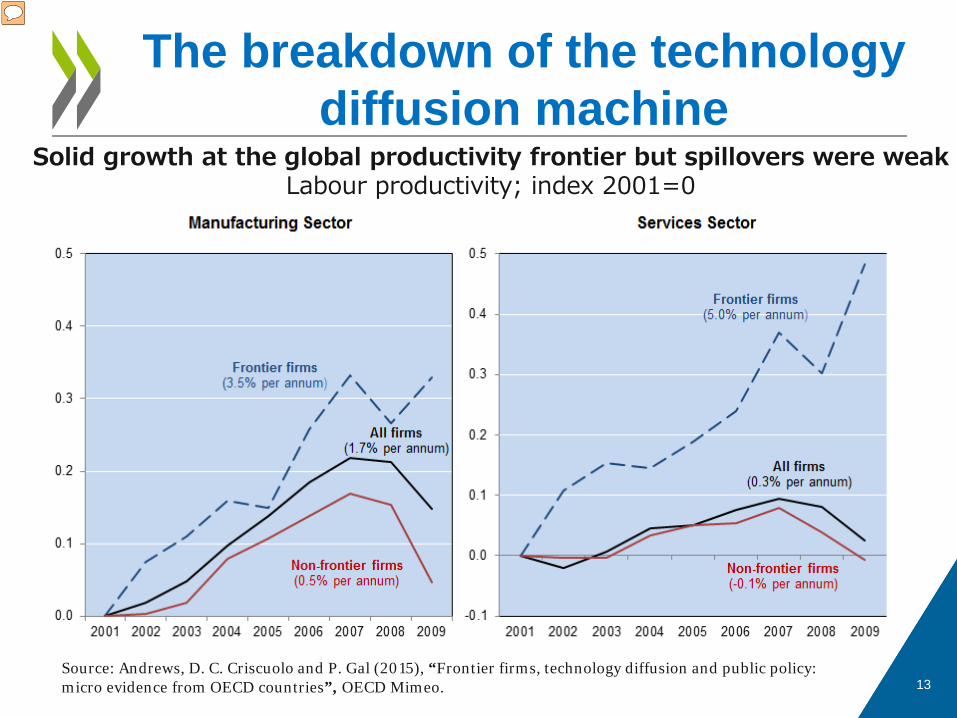
The breakdown of the technology diffusion machine
Solid growth at the global productivity frontier but spillovers were weak Labour productivity; index 2001=0
Source: Andrews, D. C. Criscuolo and P. Gal (2015), “Frontier firms, technology diffusion and public policy: micro evidence from OECD countries”, OECD Mimeo.
14
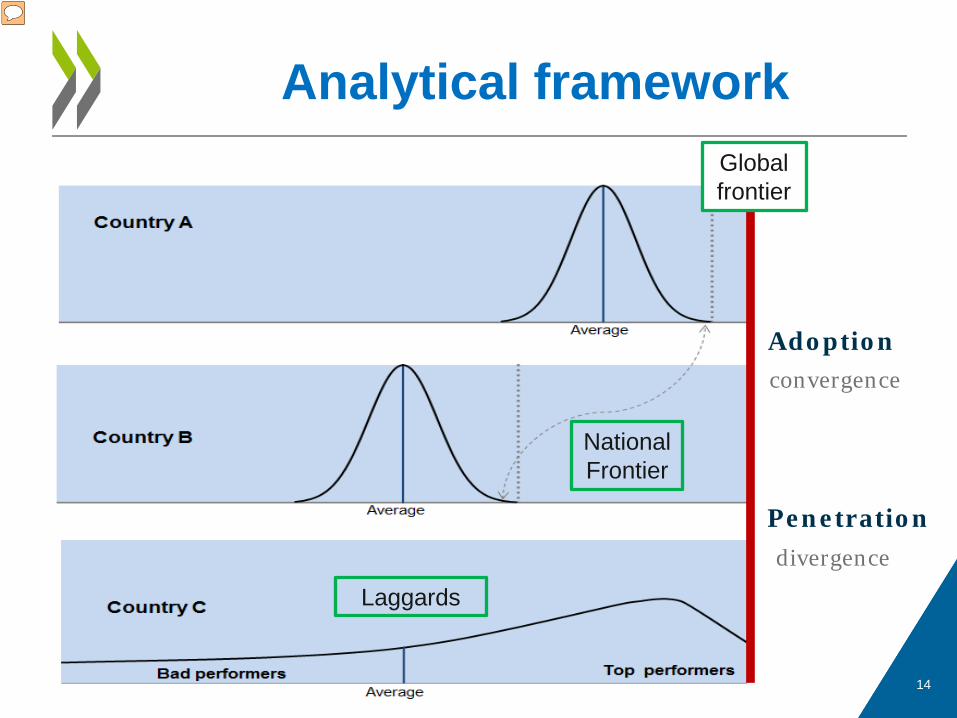
Analytical framework Global frontier
National Frontier
Laggards
Adoption convergence
Penetration divergence
15
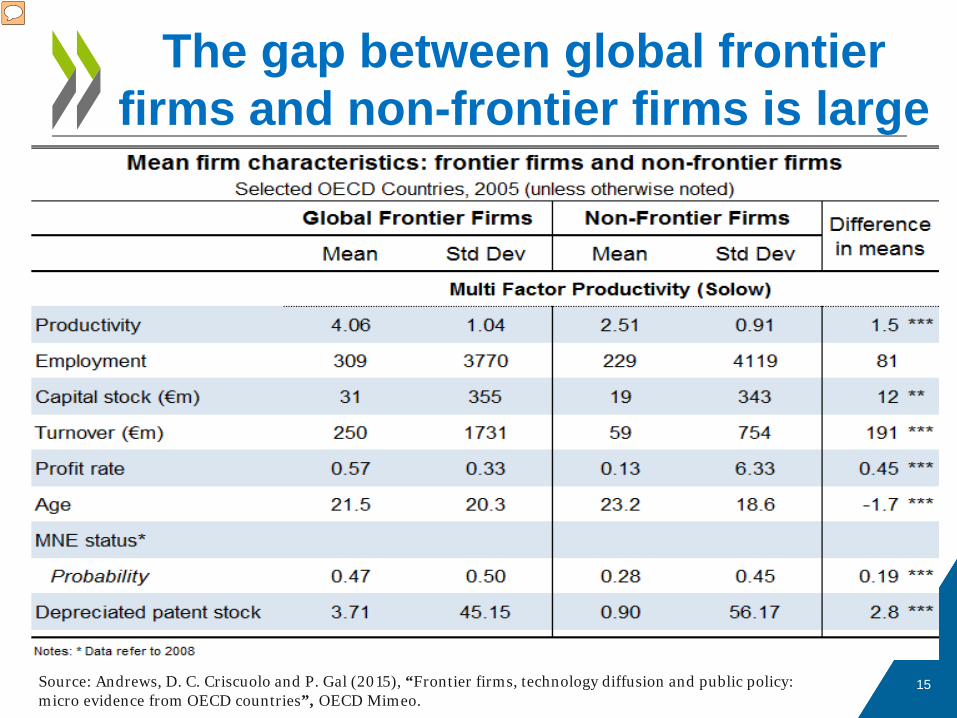
The gap between global frontier firms and non-frontier firms is large
Source: Andrews, D. C. Criscuolo and P. Gal (2015), “Frontier firms, technology diffusion and public policy: micro evidence from OECD countries”, OECD Mimeo.
16
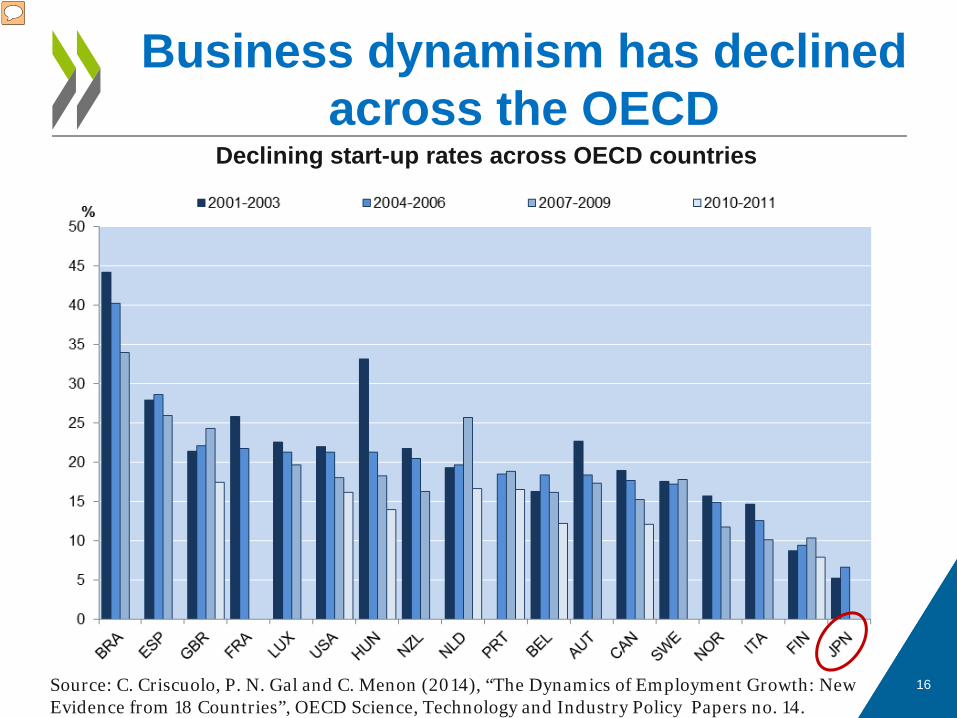
Business dynamism has declined across the OECD
Declining start-up rates across OECD countries
Source: C. Criscuolo, P. N. Gal and C. Menon (2014), “The Dynamics of Employment Growth: New Evidence from 18 Countries”, OECD Science, Technology and Industry Policy Papers no. 14.
17
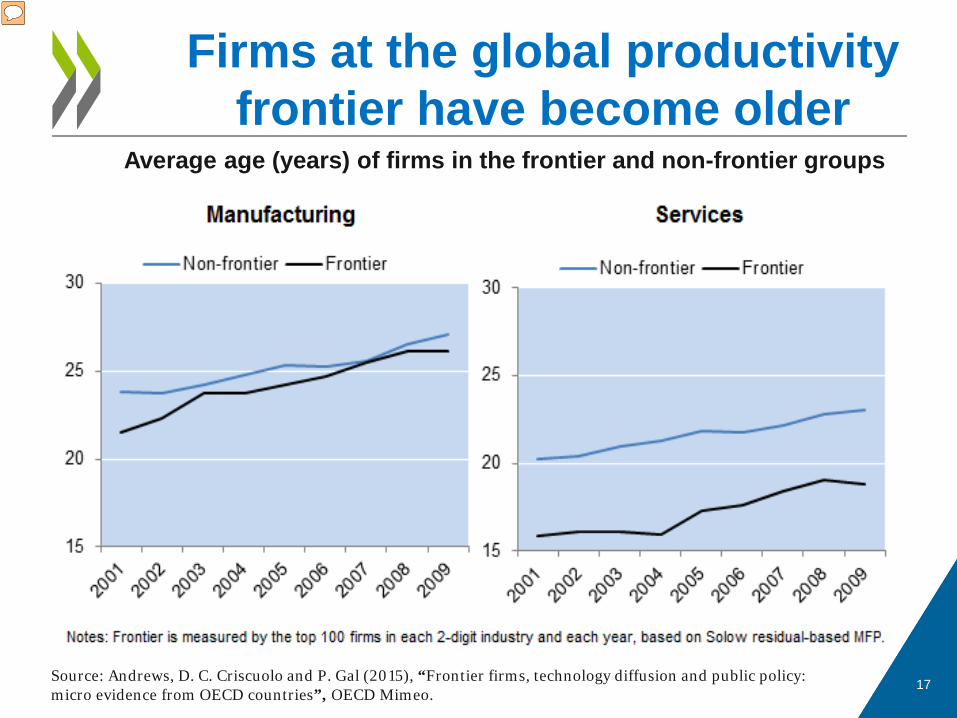
Firms at the global productivity frontier have become older
Average age (years) of firms in the frontier and non-frontier groups
Source: Andrews, D. C. Criscuolo and P. Gal (2015), “Frontier firms, technology diffusion and public policy: micro evidence from OECD countries”, OECD Mimeo.
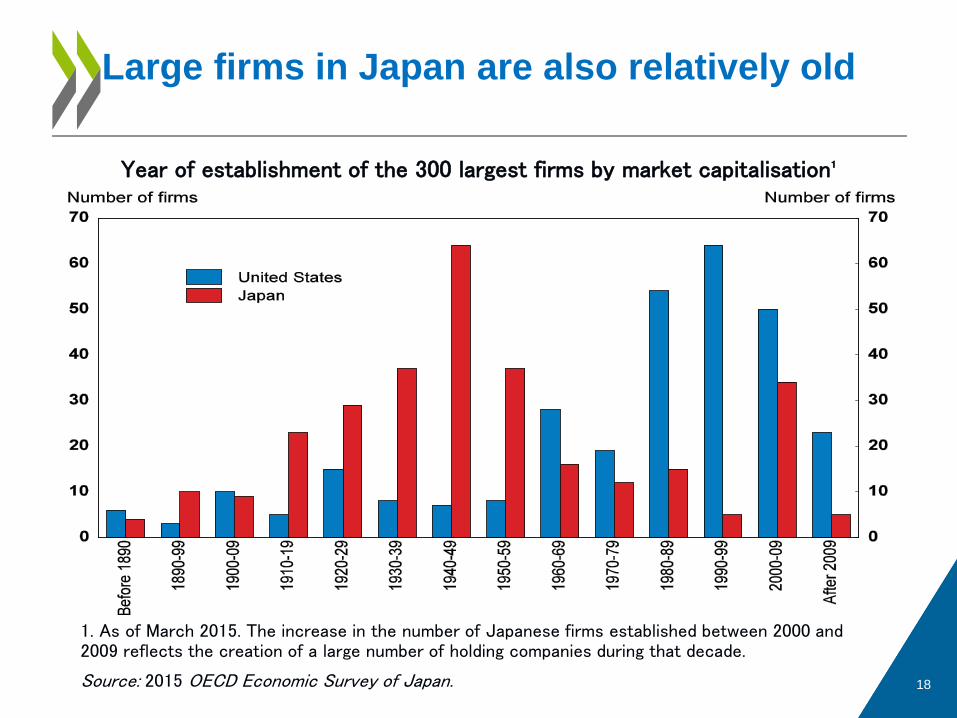
1. As of March 2015. The increase in the number of Japanese firms established between 2000 and 2009 reflects the creation of a large number of holding companies during that decade.
Source: 2015 OECD Economic Survey of Japan. 18
Large firms in Japan are also relatively old
Year of establishment of the 300 largest firms by market capitalisation¹
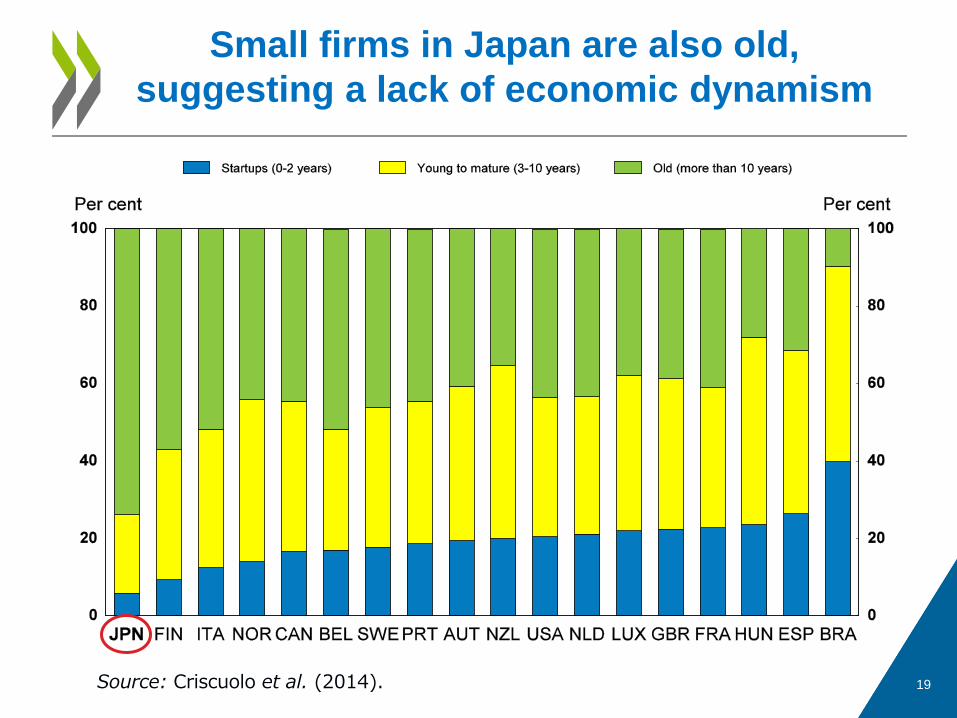
Source: Criscuolo et al. (2014). 19
Small firms in Japan are also old, suggesting a lack of economic dynamism

III.A How to Revive Productivity?
Promoting Innovation
20
21
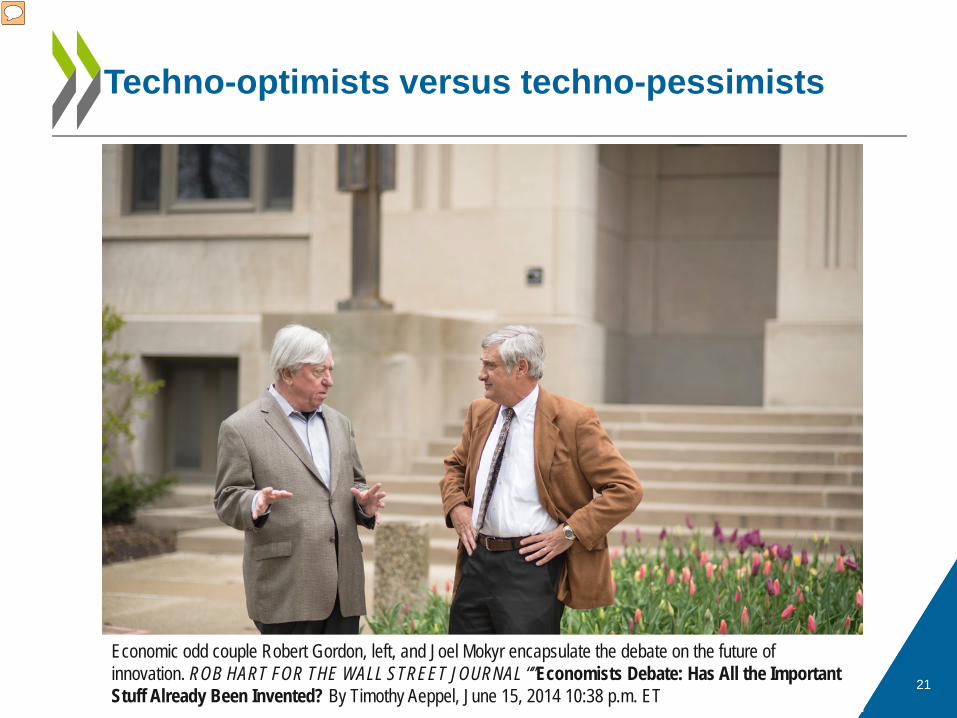
Techno-optimists versus techno-pessimists
Economic odd couple Robert Gordon, left, and Joel Mokyr encapsulate the debate on the future of innovation. ROB HART FOR THE WALL STREET JOURNAL “”Economists Debate: Has All the Important Stuff Already Been Invented? By Timothy Aeppel, June 15, 2014 10:38 p.m. ET
Source: 2015 OECD Economic Survey of Japan.
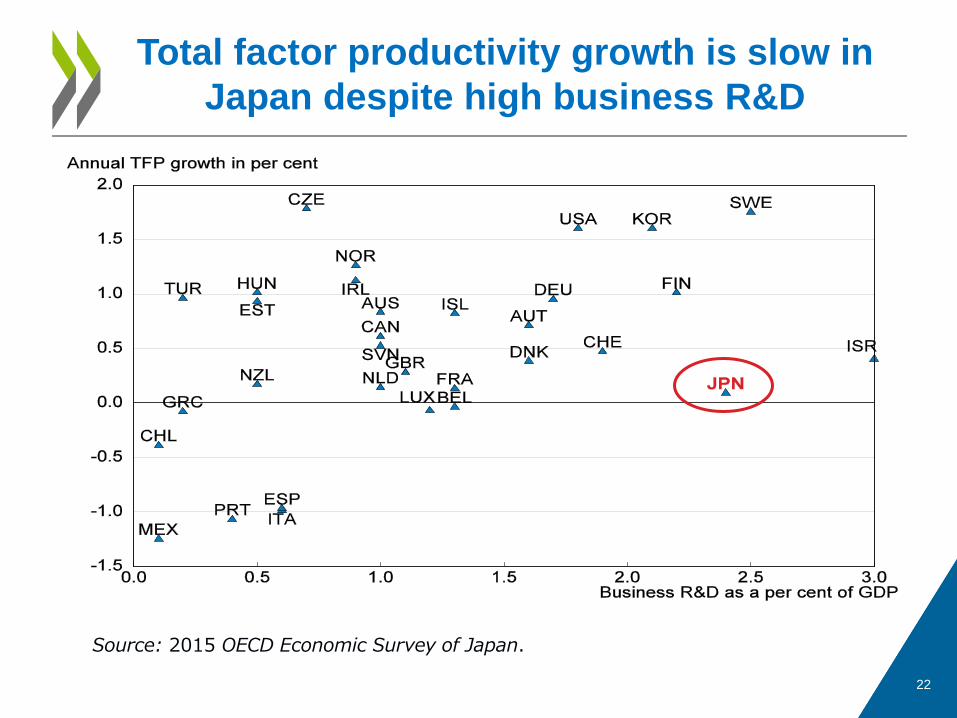
22
Total factor productivity growth is slow in Japan despite high business R&D
23
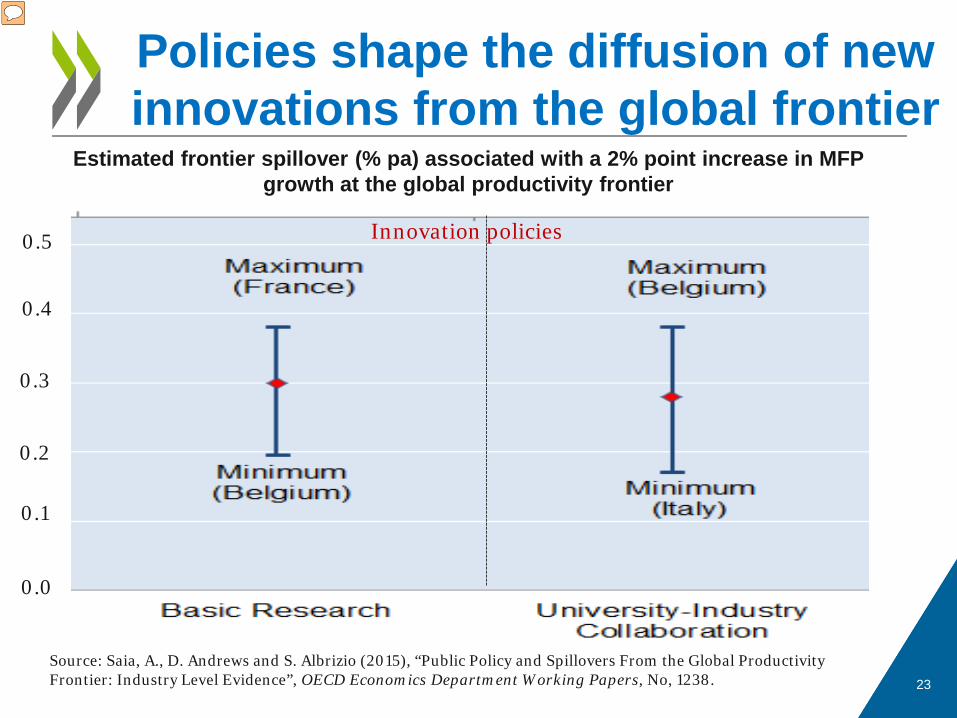
Policies shape the diffusion of new innovations from the global frontier
Estimated frontier spillover (% pa) associated with a 2% point increase in MFP growth at the global productivity frontier
Source: Saia, A., D. Andrews and S. Albrizio (2015), “Public Policy and Spillovers From the Global Productivity Frontier: Industry Level Evidence”, OECD Economics Department Working Papers, No, 1238.
Innovation policies 0.5
0.4
0.3
0.2
0.1
0.0
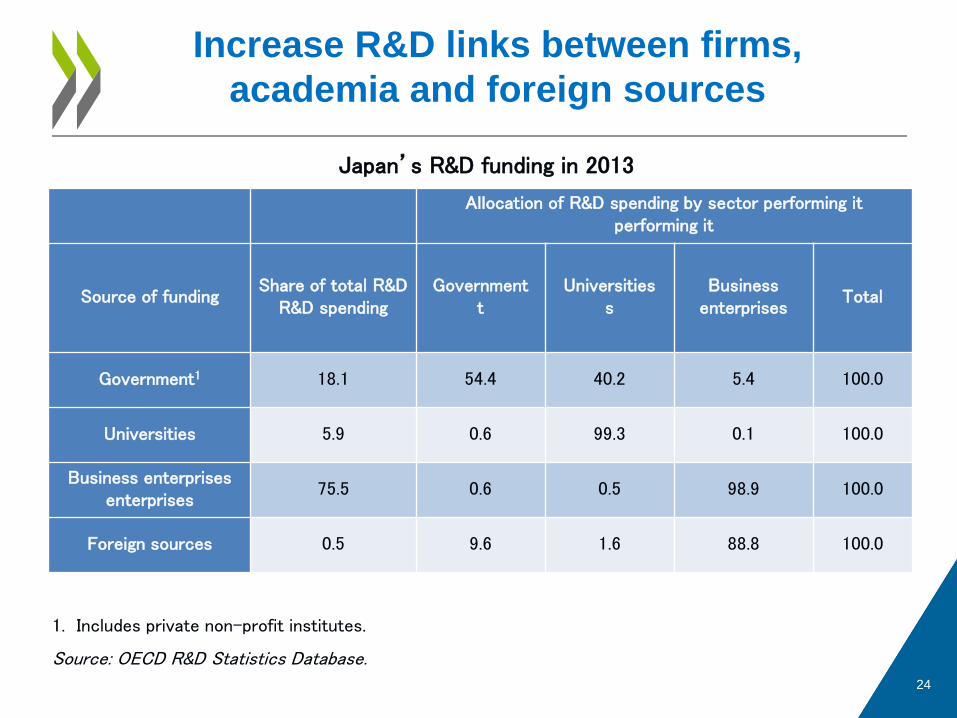
1. Includes private non-profit institutes.
Source: OECD R&D Statistics Database. 24
Increase R&D links between firms, academia and foreign sources
Allocation of R&D spending by sector performing it
performing it
Source of funding Share of total R&D
R&D spending Government
t Universities
s Business
enterprises Total
Government1 18.1 54.4 40.2 5.4 100.0
Universities 5.9 0.6 99.3 0.1 100.0
Business enterprises enterprises
75.5 0.6 0.5 98.9 100.0
Foreign sources 0.5 9.6 1.6 88.8 100.0
Japan’s R&D funding in 2013
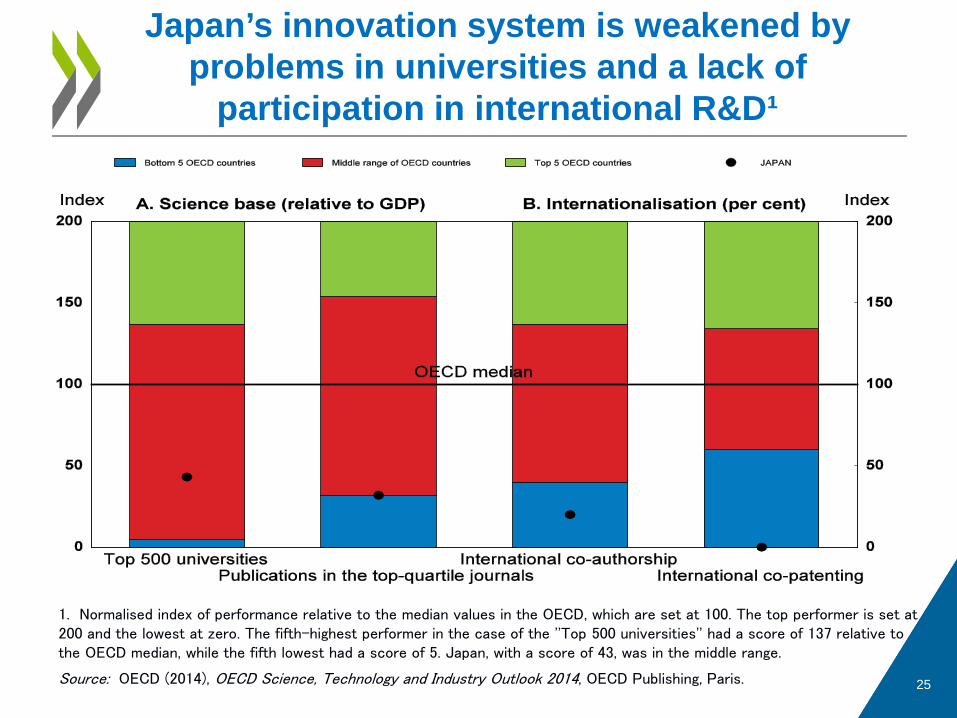
1. Normalised index of performance relative to the median values in the OECD, which are set at 100. The top performer is set at 200 and the lowest at zero. The fifth-highest performer in the case of the ''Top 500 universities'' had a score of 137 relative to the OECD median, while the fifth lowest had a score of 5. Japan, with a score of 43, was in the middle range.
Source: OECD (2014), OECD Science, Technology and Industry Outlook 2014, OECD Publishing, Paris. 25
Japan’s innovation system is weakened by problems in universities and a lack of
participation in international R&D¹
• There is considerable uncertainty about the outlook for innovation and technology.
• Given this uncertainty, we need to find sources of productivity growth that are certain to provide large scope for improvement.
• Three key sources of growth emerge:
1. Effective diffusion
2. Efficient resource allocation
3. Promoting risk-taking
26
Future growth depends on productivity but its outlook is uncertain

III.B How to Revive Productivity?
Accelerating Diffusion
27
28
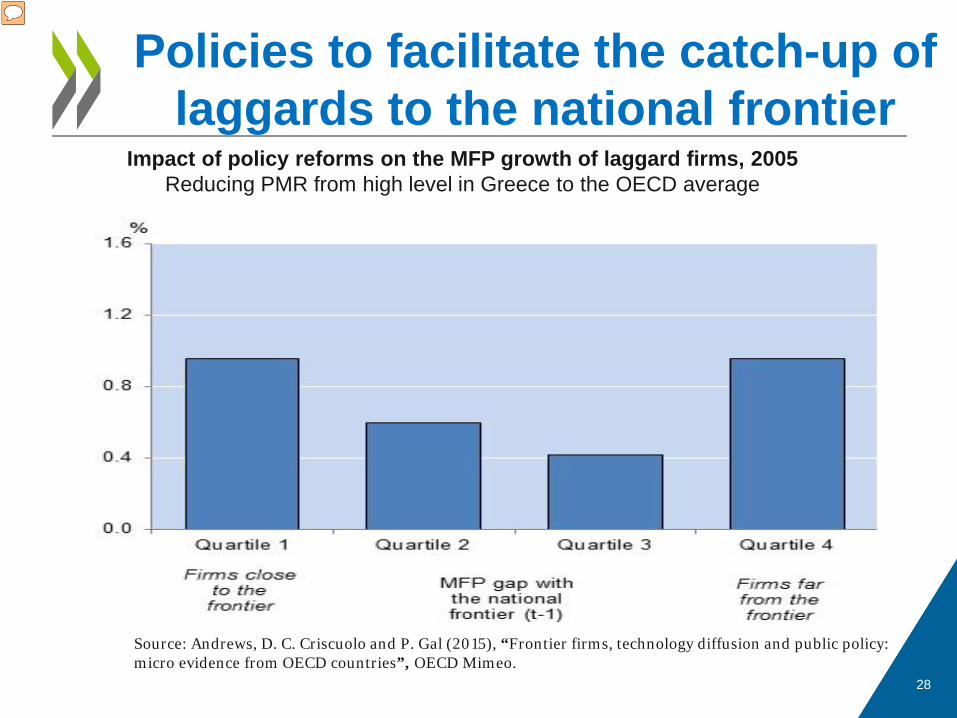
Policies to facilitate the catch-up of laggards to the national frontier
Impact of policy reforms on the MFP growth of laggard firms, 2005 Reducing PMR from high level in Greece to the OECD average
Source: Andrews, D. C. Criscuolo and P. Gal (2015), “Frontier firms, technology diffusion and public policy: micro evidence from OECD countries”, OECD Mimeo.
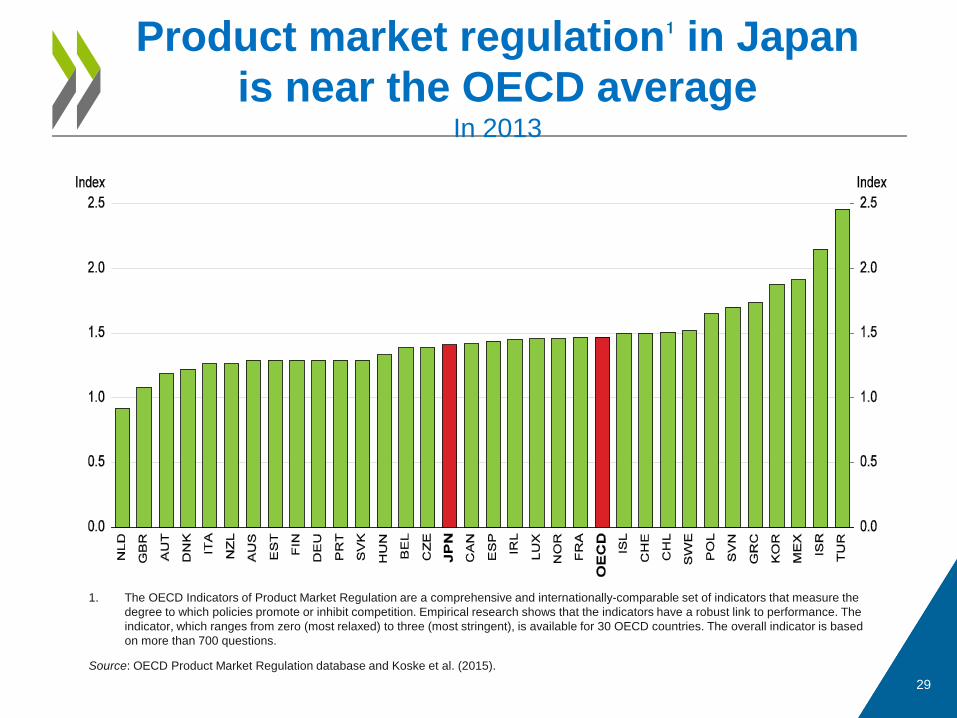
1. The OECD Indicators of Product Market Regulation are a comprehensive and internationally-comparable set of indicators that measure the degree to which policies promote or inhibit competition. Empirical research shows that the indicators have a robust link to performance. The indicator, which ranges from zero (most relaxed) to three (most stringent), is available for 30 OECD countries. The overall indicator is based on more than 700 questions.
Source: OECD Product Market Regulation database and Koske et al. (2015).
29
Product market regulation¹ in Japan is near the OECD average
In 2013
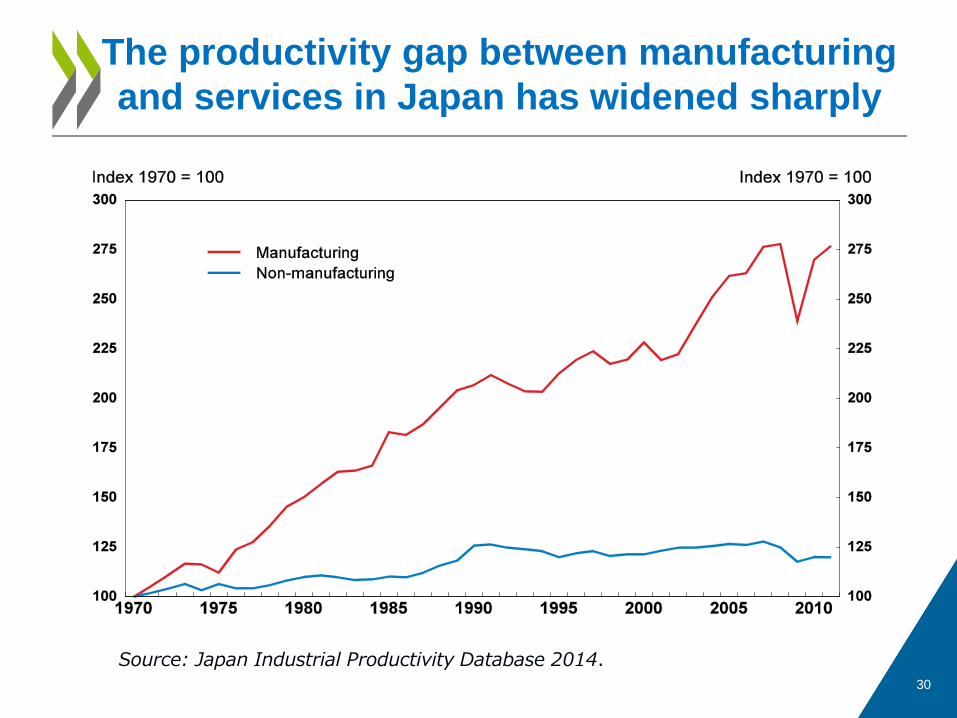
Source: Japan Industrial Productivity Database 2014. 30
The productivity gap between manufacturing and services in Japan has widened sharply
31
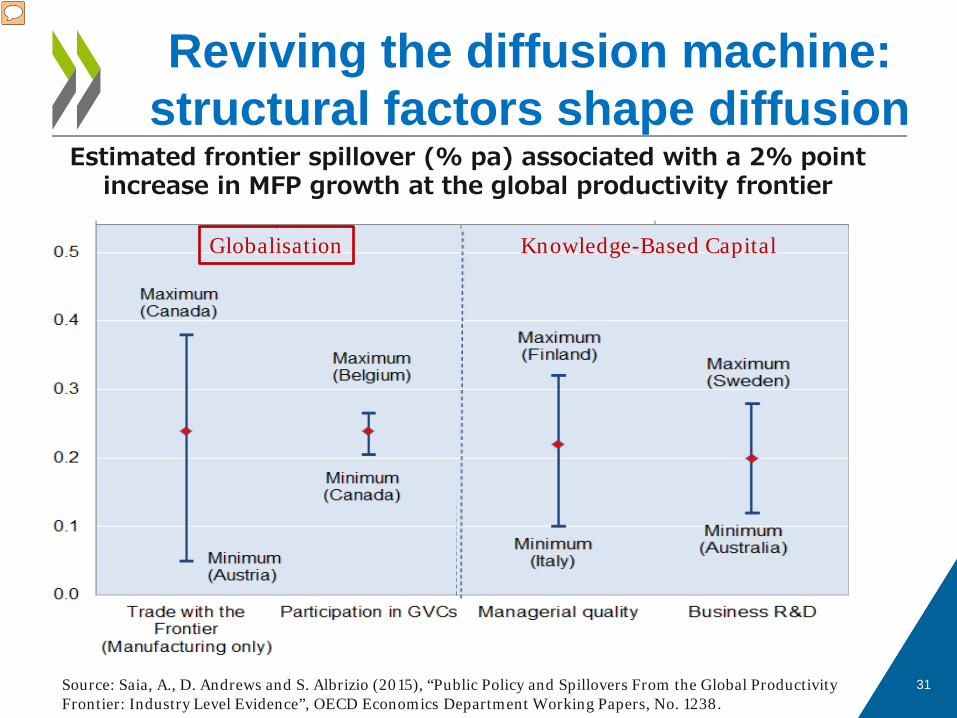
Reviving the diffusion machine: structural factors shape diffusion
Estimated frontier spillover (% pa) associated with a 2% point increase in MFP growth at the global productivity frontier
Source: Saia, A., D. Andrews and S. Albrizio (2015), “Public Policy and Spillovers From the Global Productivity Frontier: Industry Level Evidence”, OECD Economics Department Working Papers, No. 1238.
Globalisation Knowledge-Based Capital
1. The OECD Indicators of Product Market Regulation are a comprehensive and internationally-comparable set of indicators that measure the degree to which policies promote or inhibit competition. Empirical research shows that the indicators have a robust link to performance. The indicator, which ranges from zero (most relaxed) to three (most stringent), is available for 30 OECD countries. The overall indicator is based on more than 700 questions.
Source: OECD Product Market Regulation database and Koske et al. (2015).
32
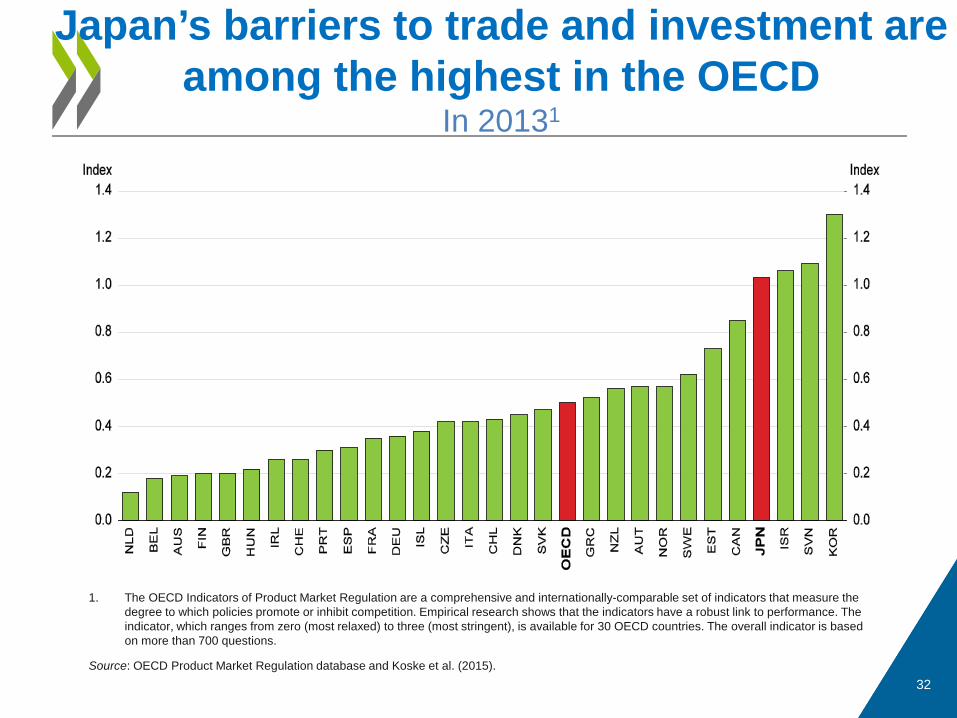
Japan’s barriers to trade and investment are among the highest in the OECD
In 20131
1. Belgium (189,200), Ireland (231,173), Luxembourg (301,234), The Netherlands (134,83.7) and Switzerland (194,115).
Source: OECD (2014), Economic Globalisation Indicators 2014, OECD, Paris. 33
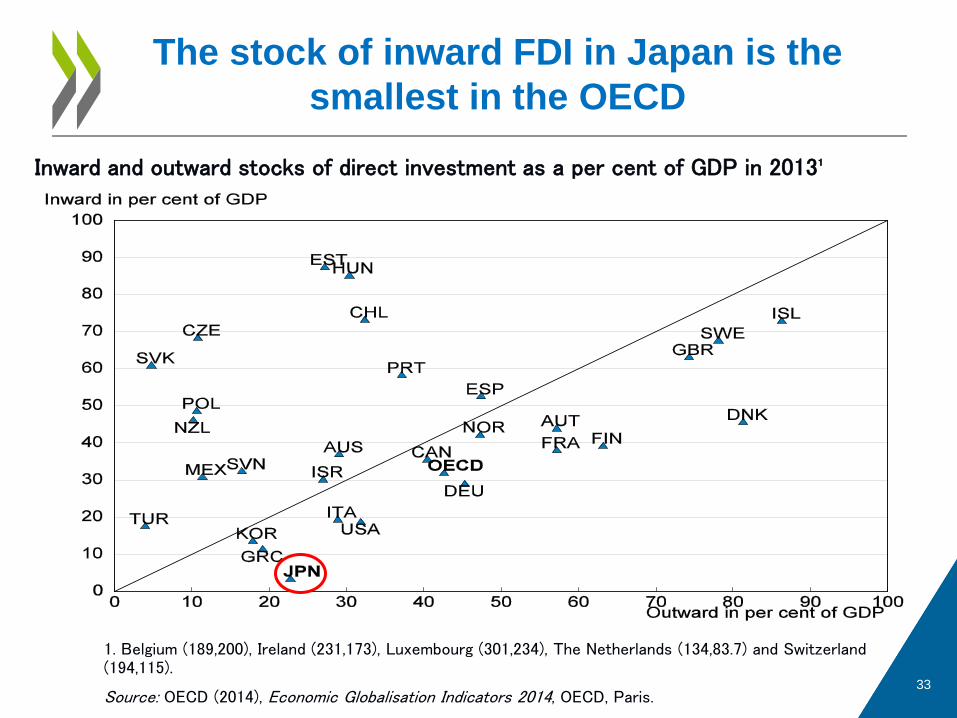
The stock of inward FDI in Japan is the smallest in the OECD
Inward and outward stocks of direct investment as a per cent of GDP in 2013¹
34
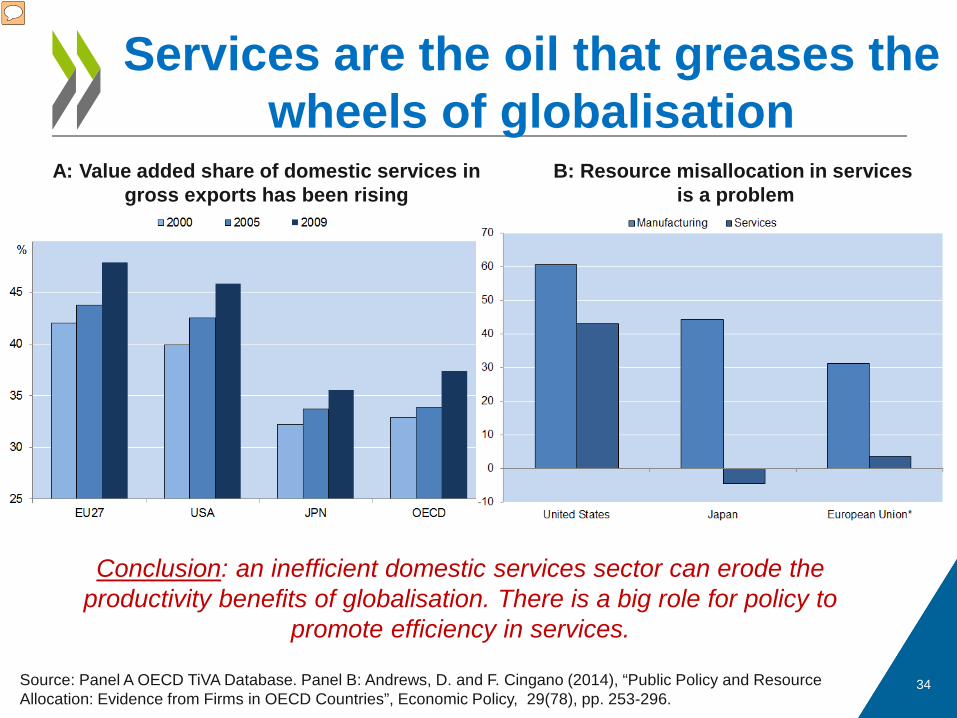
Services are the oil that greases the wheels of globalisation
A: Value added share of domestic services in gross exports has been rising
Conclusion: an inefficient domestic services sector can erode the productivity benefits of globalisation. There is a big role for policy to
promote efficiency in services.
B: Resource misallocation in services is a problem
Source: Panel A OECD TiVA Database. Panel B: Andrews, D. and F. Cingano (2014), “Public Policy and Resource Allocation: Evidence from Firms in OECD Countries”, Economic Policy, 29(78), pp. 253-296.
35
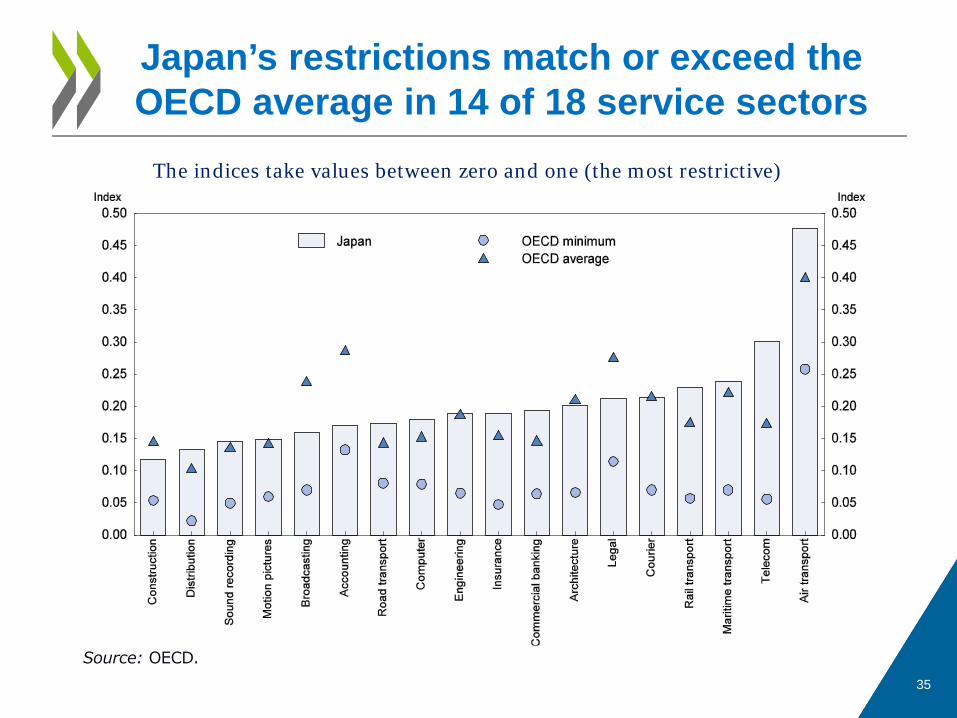
Japan’s restrictions match or exceed the OECD average in 14 of 18 service sectors
The indices take values between zero and one (the most restrictive)
Source: OECD.

III.C How to Revive Productivity?
Resource Reallocation
36
37
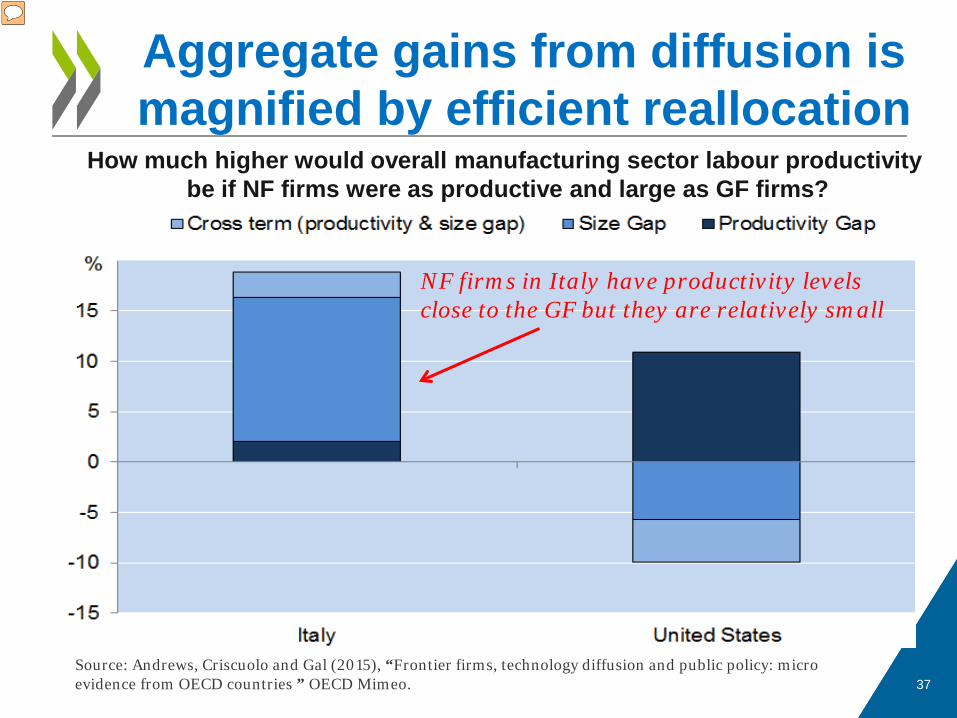
Aggregate gains from diffusion is magnified by efficient reallocation
Source: Andrews, Criscuolo and Gal (2015), “Frontier firms, technology diffusion and public policy: micro evidence from OECD countries ” OECD Mimeo.
How much higher would overall manufacturing sector labour productivity be if NF firms were as productive and large as GF firms?
NF firms in Italy have productivity levels close to the GF but they are relatively small
38
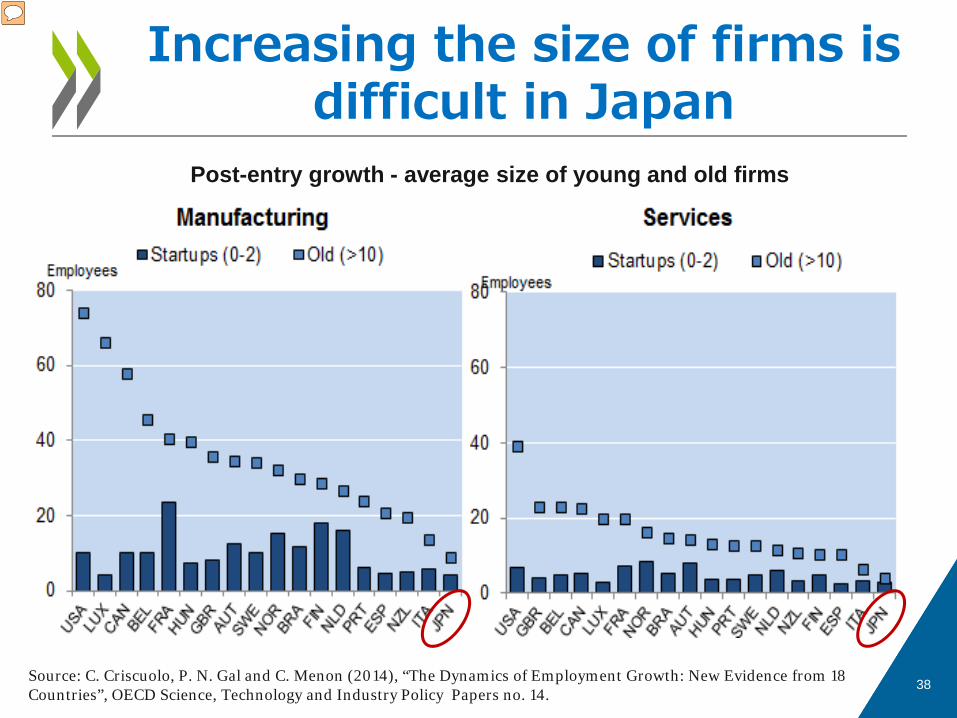
Increasing the size of firms is difficult in Japan
Post-entry growth - average size of young and old firms
Source: C. Criscuolo, P. N. Gal and C. Menon (2014), “The Dynamics of Employment Growth: New Evidence from 18 Countries”, OECD Science, Technology and Industry Policy Papers no. 14.
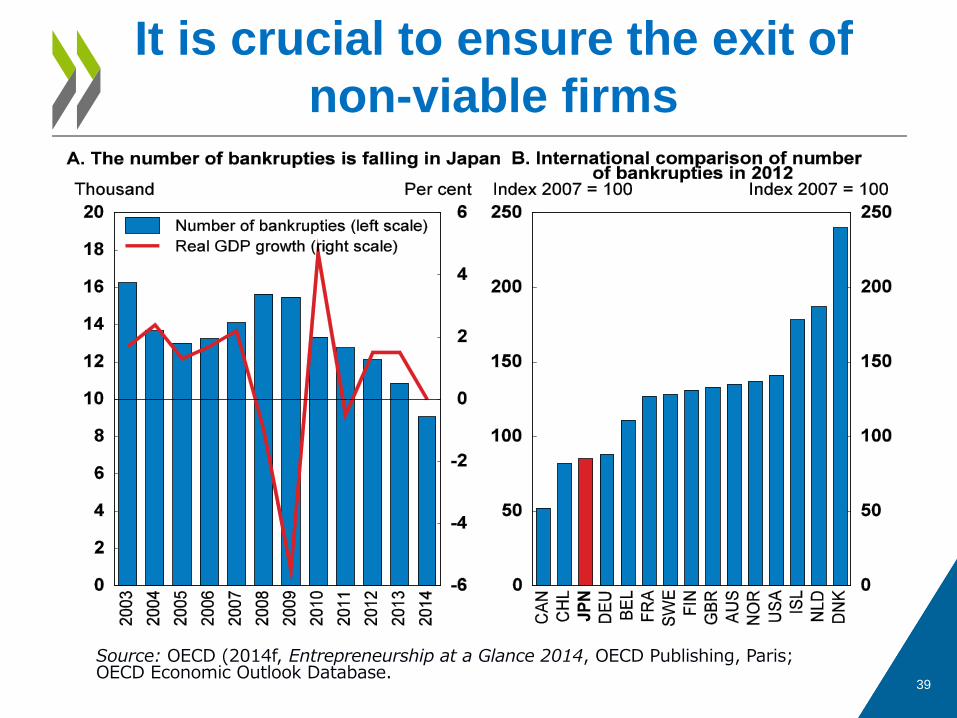
Source: OECD (2014f, Entrepreneurship at a Glance 2014, OECD Publishing, Paris; OECD Economic Outlook Database.
39
It is crucial to ensure the exit of non-viable firms
40
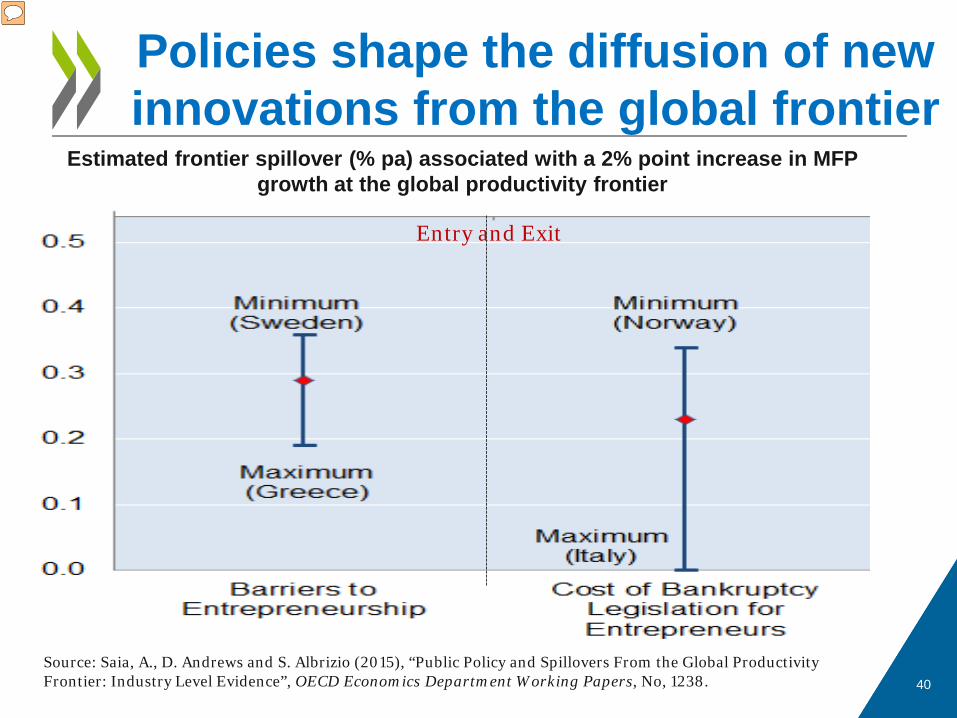
Policies shape the diffusion of new innovations from the global frontier
Estimated frontier spillover (% pa) associated with a 2% point increase in MFP growth at the global productivity frontier
Source: Saia, A., D. Andrews and S. Albrizio (2015), “Public Policy and Spillovers From the Global Productivity Frontier: Industry Level Evidence”, OECD Economics Department Working Papers, No, 1238.
Entry and Exit
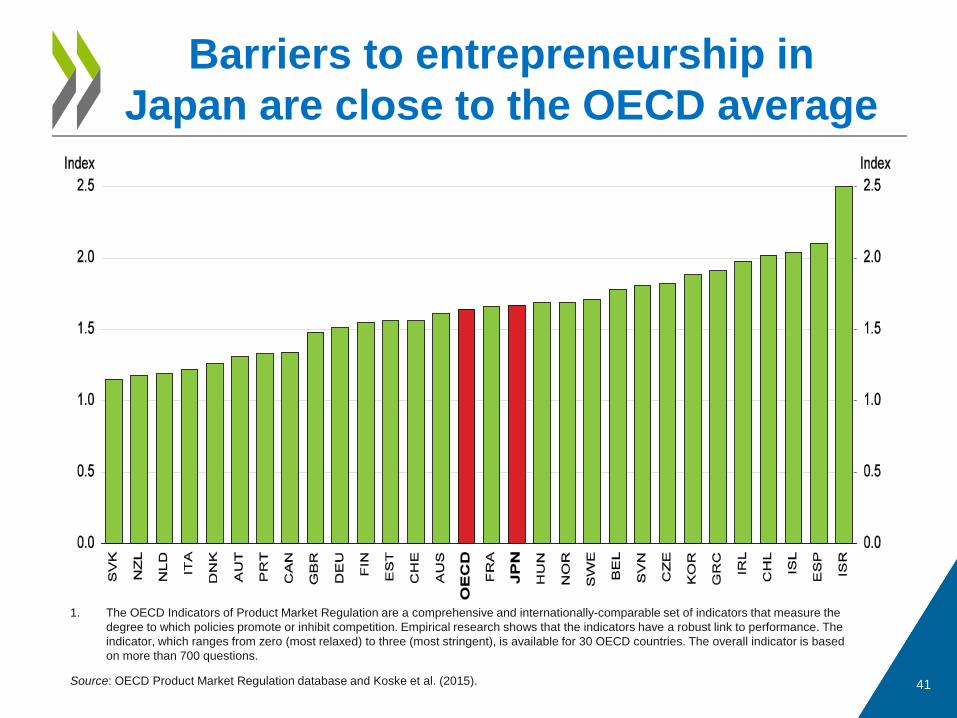
1. The OECD Indicators of Product Market Regulation are a comprehensive and internationally-comparable set of indicators that measure the degree to which policies promote or inhibit competition. Empirical research shows that the indicators have a robust link to performance. The indicator, which ranges from zero (most relaxed) to three (most stringent), is available for 30 OECD countries. The overall indicator is based on more than 700 questions.
Source: OECD Product Market Regulation database and Koske et al. (2015).
41
Barriers to entrepreneurship in Japan are close to the OECD average
42
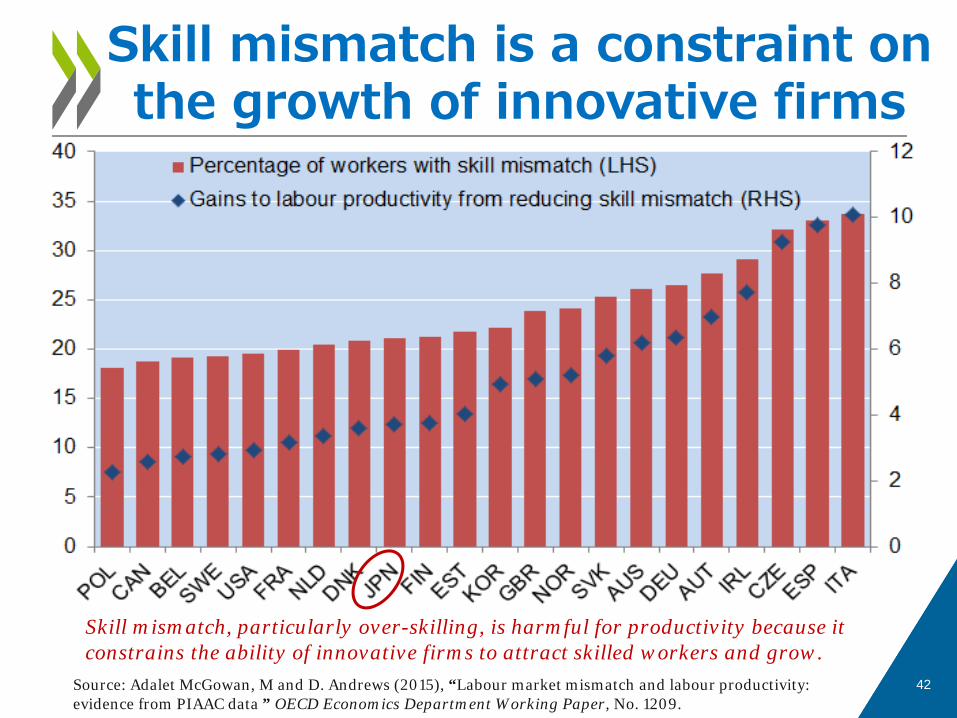
Skill mismatch is a constraint on the growth of innovative firms
Source: Adalet McGowan, M and D. Andrews (2015), “Labour market mismatch and labour productivity: evidence from PIAAC data ” OECD Economics Department Working Paper, No. 1209.
Skill mismatch, particularly over-skilling, is harmful for productivity because it constrains the ability of innovative firms to attract skilled workers and grow.
43
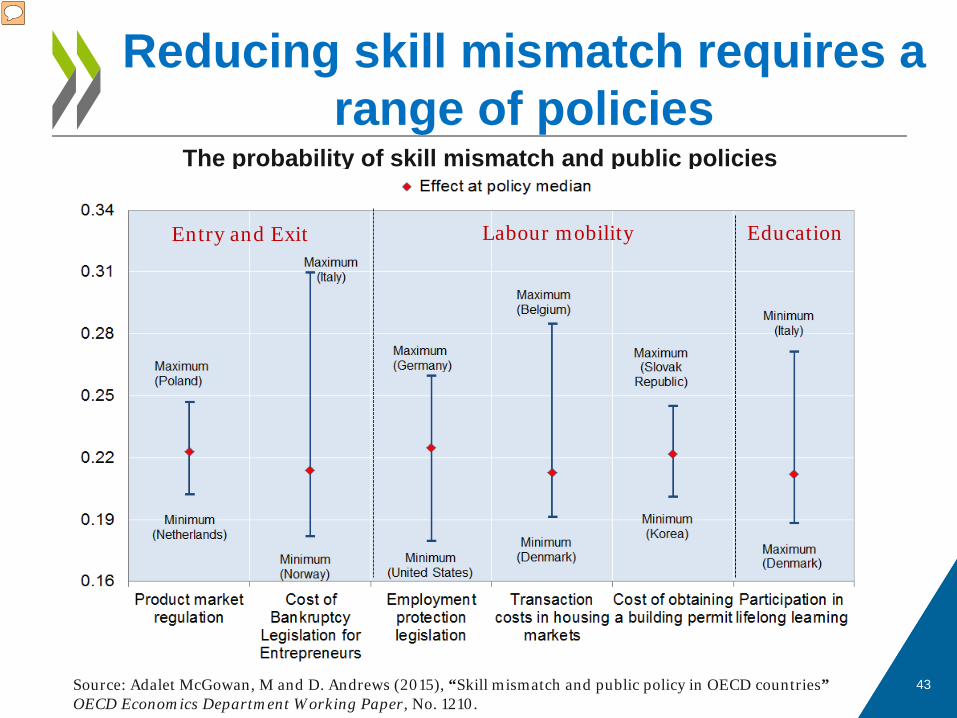
Reducing skill mismatch requires a range of policies
The probability of skill mismatch and public policies
Source: Adalet McGowan, M and D. Andrews (2015), “Skill mismatch and public policy in OECD countries” OECD Economics Department Working Paper, No. 1210.
Entry and Exit Labour mobility Education
44
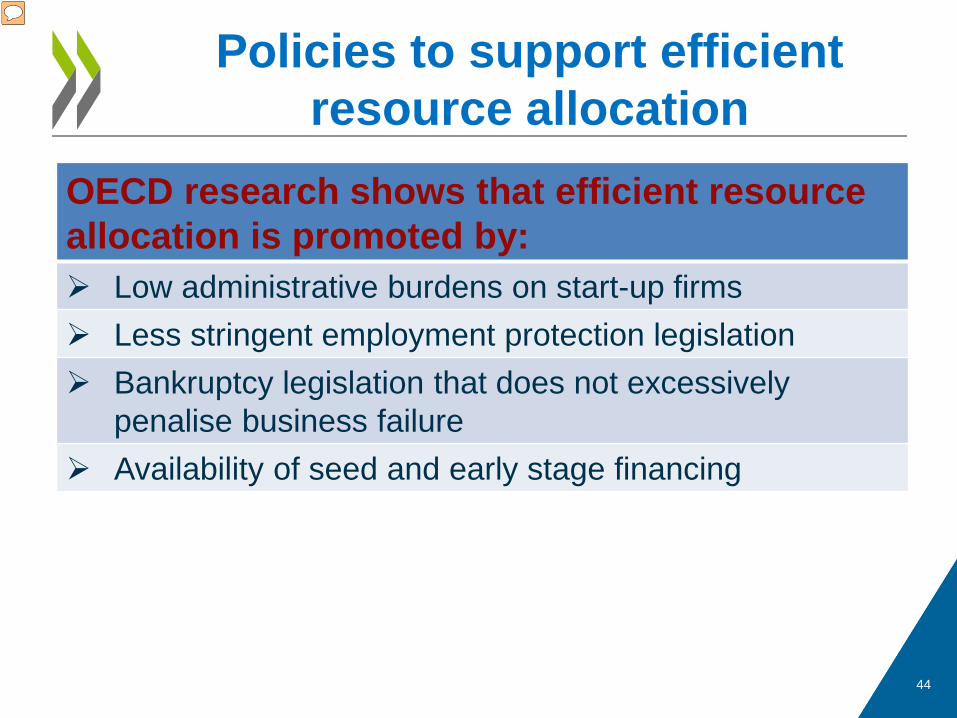
Policies to support efficient resource allocation
OECD research shows that efficient resource allocation is promoted by: Low administrative burdens on start-up firms Less stringent employment protection legislation Bankruptcy legislation that does not excessively
penalise business failure Availability of seed and early stage financing

III.D How to Revive Productivity?
Encouraging Risk-taking
45
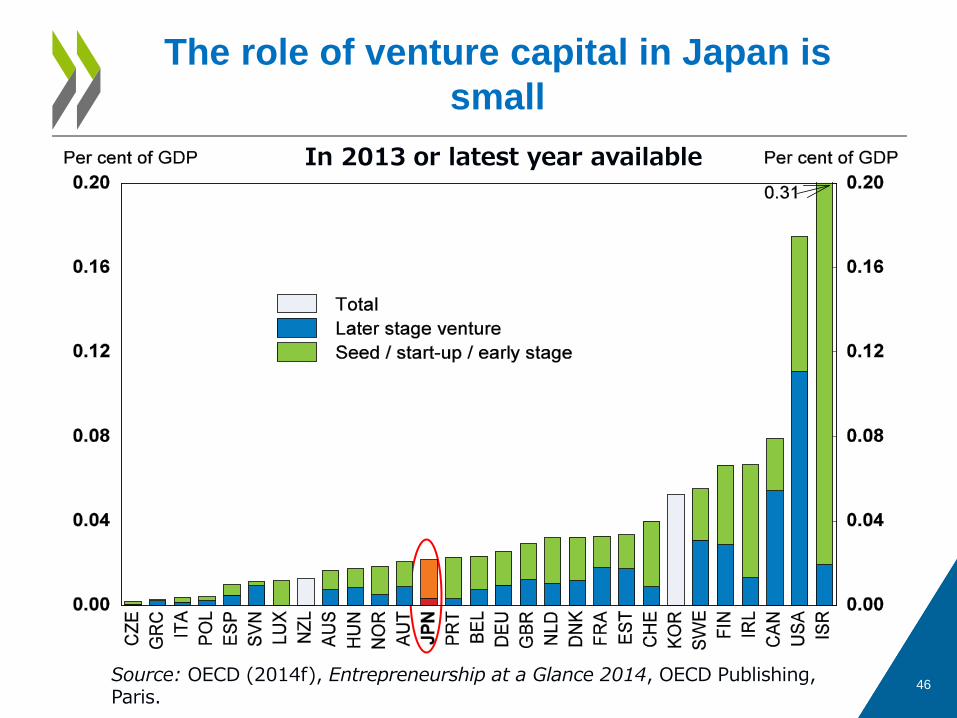
Source: OECD (2014f), Entrepreneurship at a Glance 2014, OECD Publishing, Paris.
46
The role of venture capital in Japan is small
In 2013 or latest year available

Source: Global Entrepreneurship Monitor (2015). 47
It is important to improve the perception of entrepreneurship in Japan
Share of the population that views entrepreneurship as a good career choice
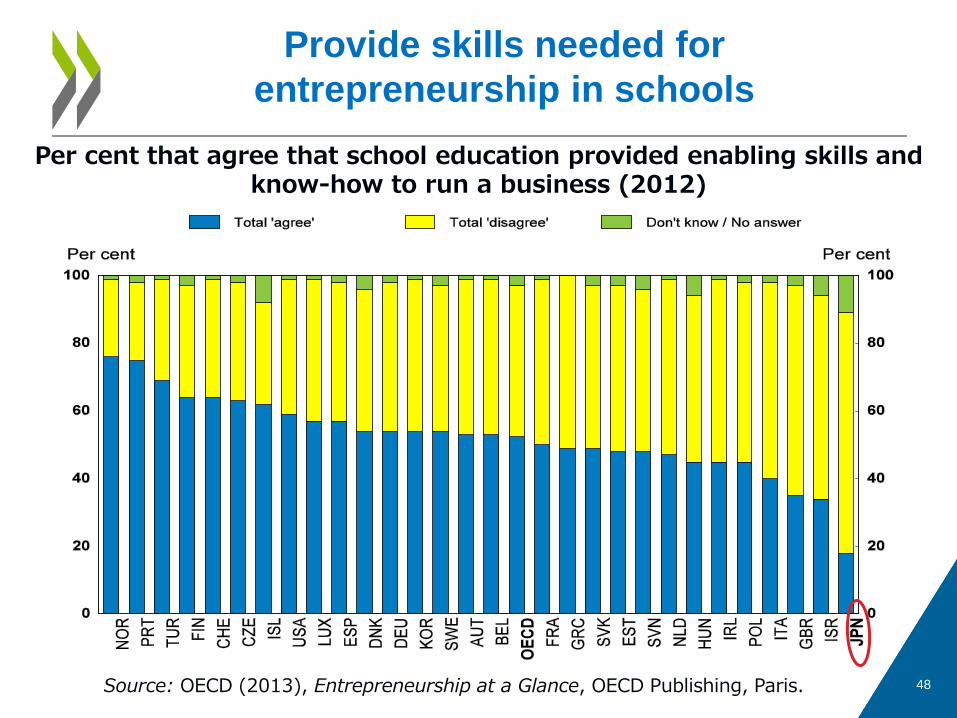
Source: OECD (2013), Entrepreneurship at a Glance, OECD Publishing, Paris. 48
Provide skills needed for entrepreneurship in schools
Per cent that agree that school education provided enabling skills and know-how to run a business (2012)

IV. Conclusions
49
Four areas for policy: 1. Enhancing innovation to pushing out
the global frontier 2. Strengthening the diffusion machine 3. Improving resource allocation 4. Encouraging risk-taking
50
How to revive productivity growth?

Framework policies 1. Pro-competition product market reforms, especially in services
2. Remove entry barriers and promote entrepreneurship
3. Exit matters: bankruptcy legislation that does not excessively penalise failure
4. Avoid policies that inhibit labour and residential mobility
5. Promote international openness by reducing barriers to trade and investment.
6. Education & social policies to help workers adapt to technological change and the costs of reallocation
Innovation policies 1. Public investment in basic research
2. Collaboration between firms and universities
51
Policies to revive productivity growth

• OECD (2015), “The Future of Productivity”. OECD, Paris • Adalet McGowan, M. and D. Andrews (2015a), “Labour Market Mismatch and
Labour Productivity: Evidence from PIAAC Data”, OECD Economics Department Working Papers, No. 1209.
• Adalet McGowan, M. and D. Andrews (2015b), “Skill Mismatch and Public Policy in OECD Countries”, OECD Economics Department Working Papers, No. 1210.
• Andrews, D., C. Criscuolo and P. Gal (2015), “Frontier Firms, Technology Diffusion and Public Policy: Micro Evidence from OECD Countries”, OECD Mimeo, forthcoming.
• Calvino, F., C. Criscuolo and C. Menon (2015), “Cross-country Evidence of Start-Up Dynamics”, OECD Science, Technology and Industry Working Paper.
• Criscuolo, C., P. Gal and C. Menon (2014), “The Dynamics of Employment Growth: New Evidence from 18 Countries”, OECD Science, Technology and Industry Policy Papers, No. 14.
• Saia, A., D. Andrews and S. Albrizio (2015), “Public Policy and Spillovers From the Global Productivity Frontier: Industry Level Evidence”, OECD Economics Department Working Papers, No. 1238.
52
The following reports detail the results:

53
More information…
www.oecd.org/eco/surveys/economic-survey-japan.htm
OECD OECD Economics
Disclaimers: The statistical data for Israel are supplied by and under the responsibility of the relevant Israeli authorities. The use of such data by the OECD is without prejudice to the status of the Golan Heights, East Jerusalem and Israeli settlements in the West Bank under the terms of international law. This document and any map included herein are without prejudice to the status of or sovereignty over any territory, to the delimitation of international frontiers and boundaries and to the name of any territory, city or area.