rieti bbl seminar handout · rieti bbl seminar handout speaker: ... harshness of judicial sentences...
TRANSCRIPT

RIETI BBL Seminar Handout
Speaker: Prof. Giovanni FACCHINI
http://www.rieti.go.jp/jp/index.html
July 10, 2015
Research Institute of Economy, Trade and Industry (RIETI)

Mind what your voters read: Media exposure and international
economic policy making
Giovanni Facchini University of Nottingham and CEPR
Tommaso Frattini University of Milan
Cora Signorotto University of Milan
MOTIVATION
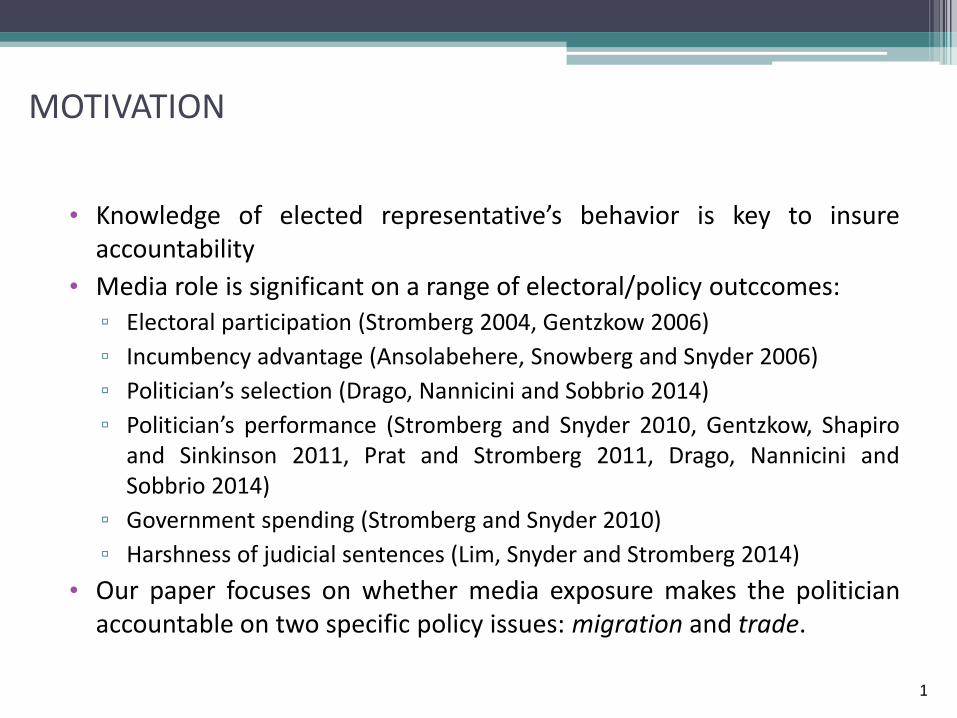
• Knowledge of elected representative’s behavior is key to insure accountability
• Media role is significant on a range of electoral/policy outccomes: ▫ Electoral participation (Stromberg 2004, Gentzkow 2006) ▫ Incumbency advantage (Ansolabehere, Snowberg and Snyder 2006) ▫ Politician’s selection (Drago, Nannicini and Sobbrio 2014) ▫ Politician’s performance (Stromberg and Snyder 2010, Gentzkow, Shapiro
and Sinkinson 2011, Prat and Stromberg 2011, Drago, Nannicini and Sobbrio 2014)
▫ Government spending (Stromberg and Snyder 2010) ▫ Harshness of judicial sentences (Lim, Snyder and Stromberg 2014)
• Our paper focuses on whether media exposure makes the politician accountable on two specific policy issues: migration and trade.
1

MOTIVATION
• Why focusing on migration and trade?
• Standard economic theory predicts similar effects of trade and immigration on
labor market outcomes of workers in the destination country. Economic drivers play an important role in shaping individual preferences towards globalization (Conconi et al. 2014).
• Nonetheless, important differences exist between the determinants of
preferences towards trade and migration (e.g. welfare state considerations and non-economic factors)
• More generally, migration and trade might not be perceived as equally salient
by the electorate
• The disciplining effect of media exposure on politicians’ behavior may vary according to the saliency of the issue at stake.
2

OUTLINE
• Measuring media coverage
• Data and Facts
• Empirical analysis
• Conclusions
3

MEASURING MEDIA EXPOSURE
• Ashworth (2012): the key challenge when studying the effect of media exposure is identifying plausible exogenous variation on features that affect the responsiveness of the politician to the electorate.
• Snyder and Strömberg (2010) focus on the market for local newspapers, as they devote more coverage to Congress than local television.
• Idea: «economic-geography» factors shaping the market for local newspapers are different from the «political geography» factors that determine congressional district boundaries:
▫ «economic-geography» factors: local newspapers typically based in urban areas; sales in
the surrounding areas depend on the distance between the suburb and the newspaper’s headquarters and on the socio–economic characteristics of the area’s residents
▫ «political geography» factors: congressional districts boundaries are drawn so that all districts in each state have the same population, representation is guaranteed to different racial groups etc.
▫ Overlap between congressional districts and locals newspaper markets exhibit substantial variation across space and over time.
4

MEASURING MEDIA EXPOSURE
• Snyder and Strömberg (2010) build a «congruence» measure of congressional districts and local newspaper markets to identify an effect of media coverage on voters, politicians, and policy outcomes
• Formally: 𝐶𝐶𝐶𝐶𝐶𝐶𝐶𝐶𝐶𝐶𝑑= ∑ 𝑀𝑀𝐶𝑀𝐶𝑀𝑀𝑀𝑀𝐶𝐶𝐶𝑑𝑛 𝑅𝐶𝑀𝑑𝐶𝐶𝑀𝑀𝑀𝐶𝐶𝐶𝑑
• where 𝑀𝑀𝐶𝑀𝐶𝑀𝑀𝑀𝑀𝐶𝐶𝐶𝑑 is the newspaper n share of total newspaper sales
in district d; 𝑅𝐶𝑀𝑑𝐶𝐶𝑀𝑀𝑀𝐶𝐶𝐶𝑑 is the share of newspaper n sales that are in district d.
• Note: since congruence is defined using mkt share, it does not depend upon total mkt penetration, which depends on education, income etc.
5

MEASURING MEDIA EXPOSURE
District 1 District 2 District 3
New
spap
er1
New
spap
er2
New
spap
er3
District 1 District 2 District 3 District 1 District 2 District 3
New
spap
er1
Newspaper 2
Newspaper 3Newspaper 3
Newspaper 2
Newspaper 1
Figure 1: Congruence
6
MEASURING MEDIA EXPOSURE
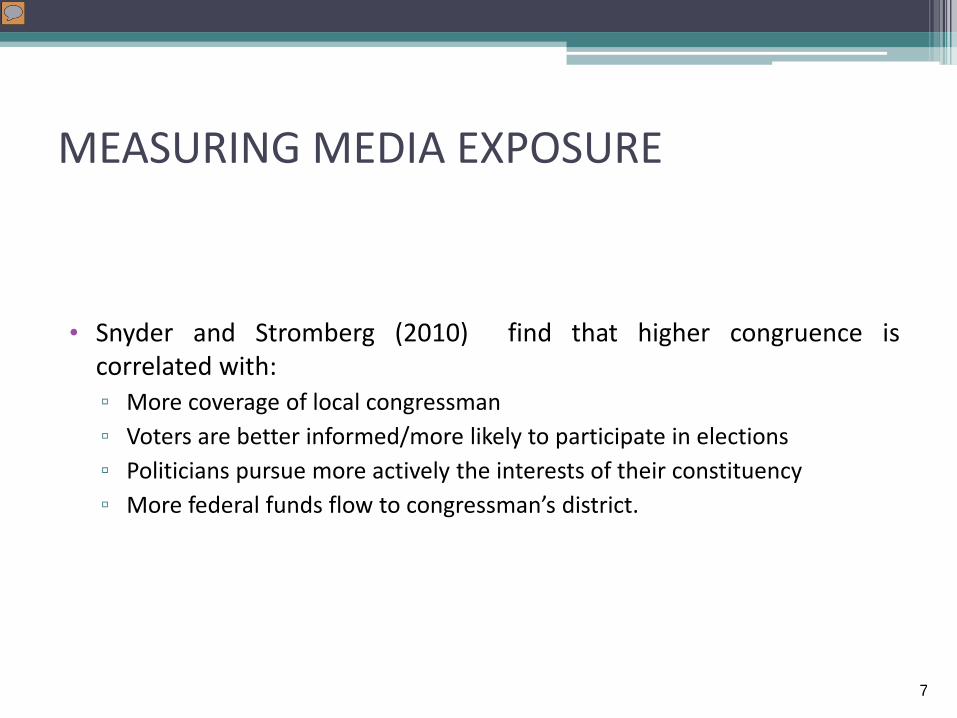
• Snyder and Stromberg (2010) find that higher congruence is correlated with: ▫ More coverage of local congressman ▫ Voters are better informed/more likely to participate in elections ▫ Politicians pursue more actively the interests of their constituency ▫ More federal funds flow to congressman’s district.
7
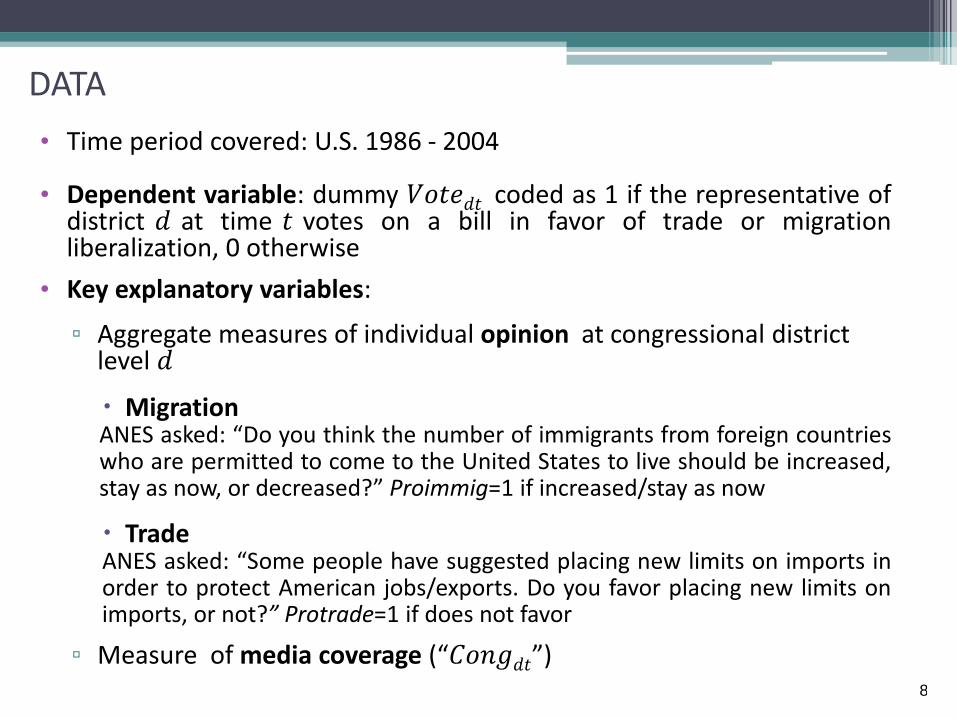
DATA • Time period covered: U.S. 1986 - 2004
• Dependent variable: dummy 𝑉𝐶𝑀𝐶𝑑𝑀 coded as 1 if the representative of
district 𝑑 at time 𝑀 votes on a bill in favor of trade or migration liberalization, 0 otherwise
• Key explanatory variables: ▫ Aggregate measures of individual opinion at congressional district
level 𝑑
Migration ANES asked: “Do you think the number of immigrants from foreign countries who are permitted to come to the United States to live should be increased, stay as now, or decreased?” Proimmig=1 if increased/stay as now Trade ANES asked: “Some people have suggested placing new limits on imports in order to protect American jobs/exports. Do you favor placing new limits on imports, or not?” Protrade=1 if does not favor
▫ Measure of media coverage (“𝐶𝐶𝐶𝐶𝑑𝑀”)
8

DISTRICT-LEVEL AND INDIVIDUAL-LEVEL CONTROLS
• District-level characteristics: economic characteristics, industry of employment, socio-demographic characteristics
• Individual-level characteristics: politician’s characteristics (e.g. age, gender, ideology)
9

INTUITION
Figure 2: Individual opinions on migration, congruence and voting behavior on HR 3736 (1998)
Figure 2.1: Florida – Congressional Districts Map Figure 2.2: Florida - Districts 3 and 15 - Opinions on migration
Figure 2.3: Florida - Districts 3 and 15 - Congruence
Figure 2.4: Florida - Districts 3 and 15 – Vote on migration
Figure 3: Individual opinions on trade, congruence and voting behavior on HR 2621 (1998)
Figure 3.1: Texas – Congressional Districts Map
Figure 3.2: Texas - Districts 7 and 9 - Opinions on trade
Figure 3.3: Texas - Districts 7 and 9 - Congruence
Figure 3.4: Texas - Districts 7 and 9 – Vote on trade
10

EMPIRICAL ANALYSIS
• We estimate a linear probability model : 𝑉𝐶𝑀𝐶𝑀𝑑𝑑 = 𝛼1𝑀𝑀𝐶𝑀𝑀𝑑𝑑 + 𝛽1𝐶𝐶𝐶𝐶𝑑𝑑 + 𝛾1𝑀𝑀𝐶𝑀𝑀𝑑𝑑 × 𝐶𝐶𝐶𝐶𝑑𝑑 + 𝑋𝑑𝑑𝛿 + 𝐼𝑠𝑑+ 𝐶𝑑𝑑 𝑉𝐶𝑀𝐶𝑇𝑑𝑑 = 𝛼2𝑇𝐶𝑑𝑀𝑀𝑑𝑑 + 𝛽2𝐶𝐶𝐶𝐶𝑑𝑑 + 𝛾2𝑇𝐶𝑑𝑀𝑀𝑑𝑑 × 𝐶𝐶𝐶𝐶𝑑𝑑 + 𝑋𝑑𝑑𝛿 + 𝐼𝑠𝑑+ 𝐶𝑑𝑑
• The key parameters are the coefficients 𝛾1 and 𝛾2
• If 𝜸 is positive and significant the elected official’s behavior becomes more in line with the prevailing opinion of her electorate as congruence rises
• A lack of significance would instead indicate the absence of any disciplining effect of press coverage on the policy maker’s behavior
11

ESTIMATION RESULTS
• Estimates of the coefficients of the interaction term between opinion and congruence differ between immigration and trade:
• Migration regression 𝛾1 positive and highly significant in all
specifications • Trade regression 𝛾2 not different from zero in all specifications
Table 3: Baseline specification (1) (2) (3) (4) (5) Migration Trade Migration Trade Migration Trade Migration Trade Migration Trade
Opiniondt 0.294 0.0426 -0.236 -0.0777 -0.316 -0.142 -0.447 -0.159 -0.428 -0.0520 (0.153) (0.0916) (0.237) (0.139) (0.231) (0.117) (0.235) (0.117) (0.240) (0.113) Congruencedt -0.775** -0.0374 -0.654 -0.345 -0.447 -0.264 -0.316 -0.207 (0.288) (0.188) (0.343) (0.211) (0.359) (0.233) (0.370) (0.214) Interactiondt 1.694** 0.474 1.663** 0.217 1.781** 0.231 1.665** -0.132 (0.582) (0.416) (0.547) (0.367) (0.549) (0.364) (0.577) (0.355) State*year fixed effect YES YES YES YES YES Economic characteristics NO NO YES YES YES Socio-demographic characteristics NO NO NO YES YES Politician's characteristics NO NO NO NO YES Observations 265 1,139 265 1,139 265 1,139 265 1,139 265 1,139 R-squared 0.329 0.272 0.350 0.276 0.399 0.368 0.424 0.371 0.439 0.414
Standard errors, clustered at the district-decade level are reported in parentheses. **Significant at 1%, * significant at 5%.
12

Marginal effect of district’s migration opinion on Representative’s voting behavior ESTIMATION RESULTS
13

ESTIMATION RESULTS Marginal effect of district’s trade opinion on Representative’s voting behavior
14

• Consider two districts: ▫ Florida’s 4th in 1996. Congruence is slightly above
average at 0.44; a ten percentage points increase in the share of pro-migration individuals in the population leads to a 2.9 percentage point in the probability that the representative will support immigration;
▫ Pennsylvania’s 5th in 1998. Congruence is at 0.7 (90th percentile). A similar increase in the pro-migration electorate leads to a 7.4 percentage point increase in the probability that the representative will support immigration.
QUANTIFYING THE EFFECTS
15

ELECTION COMPETITIVENESS: CLOSENESS OF THE RACE (1) (2) (3) (4)
Migration Trade Migration Trade Migration Trade Migration Trade
Opiniondt -0.323 -0.0764 -0.414 -0.139 -0.390 -0.168 -0.447 -0.0171
(0.283) (0.199) (0.297) (0.163) (0.296) (0.161) (0.309) (0.162)
Congruencedt -0.838* -0.145 -0.762 -0.368 -0.434 -0.290 -0.434 -0.282
(0.368) (0.232) (0.401) (0.244) (0.424) (0.267) (0.439) (0.258) MoVdt 0.0252 -0.158 -0.0491 0.0275 0.0261 0.0341 -0.00403 -0.0321
(0.260) (0.139) (0.273) (0.133) (0.260) (0.132) (0.266) (0.128) Congruencedt*Opiniondt 2.235** 0.405 2.087** 0.274 1.848* 0.315 1.936* -0.186
(0.754) (0.558) (0.737) (0.491) (0.734) (0.486) (0.760) (0.471)
MoVdt*Opiniondt 0.297 0.0484 0.371 -0.000272 -0.0248 0.0281 0.128 -0.0316
(0.490) (0.268) (0.465) (0.228) (0.429) (0.233) (0.445) (0.233) Congruencedt*MoVdt 0.139 0.162 0.108 0.0496 -0.175 0.0461 -0.0816 0.181
(0.554) (0.357) (0.606) (0.328) (0.604) (0.333) (0.612) (0.353) Congruencedt*Opiniondt*MoVdt -2.071 0.121 -2.012 -0.0895 -1.066 -0.174 -1.511 0.0507
(1.220) (0.792) (1.194) (0.700) (1.141) (0.715) (1.182) (0.752)
State*year fixed effect YES YES YES YES
Economic characteristics NO YES YES YES
Socio-demographic characteristics NO NO YES YES
Politician's characteristics NO NO NO YES
Observations 260 1,130 260 1,130 260 1,130 260 1,130
R-squared 0.378 0.279 0.430 0.367 0.458 0.370 0.473 0.412 16
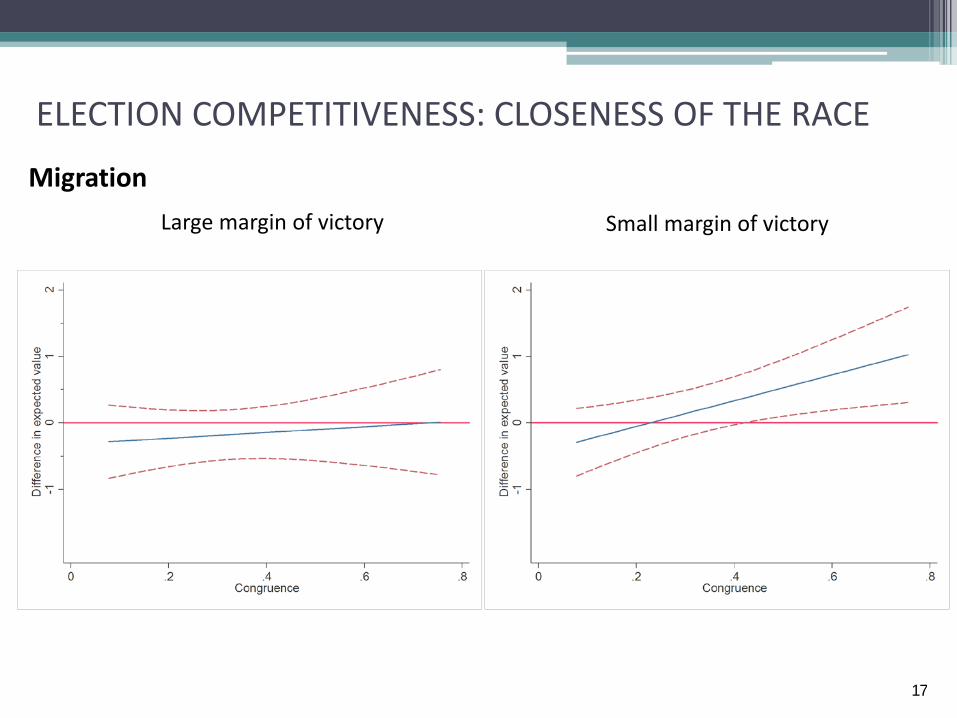
ELECTION COMPETITIVENESS: CLOSENESS OF THE RACE
Migration Large margin of victory Small margin of victory
17

ELECTION COMPETITIVENESS: CLOSENESS OF THE RACE
Trade Large margin of victory Small margin of victory
18

ELECTION COMPETITIVENESS: TURNOUT
Migration Trade
19

ROBUSTNESS CHECKS
• Reverse causality concerns • Years included in the analysis
• Alternative measures and definition of «opinion»
• Alternative district level controls
• Different measures of politician’s characteristics
• Placebo tests 20
REVERSE CAUSALITY
• Politicians could influence individual opinions on trade and migration through the local media; this effect could be greater in those districts where the coverage of local politicians is higher.
• The correlation between congruence and opinions on trade/migration is not statistically significant.
• Still, to further address this concern, we implement an IV strategy that builds upon the literature on the individual level determinants of attitudes towards trade and migration.
21
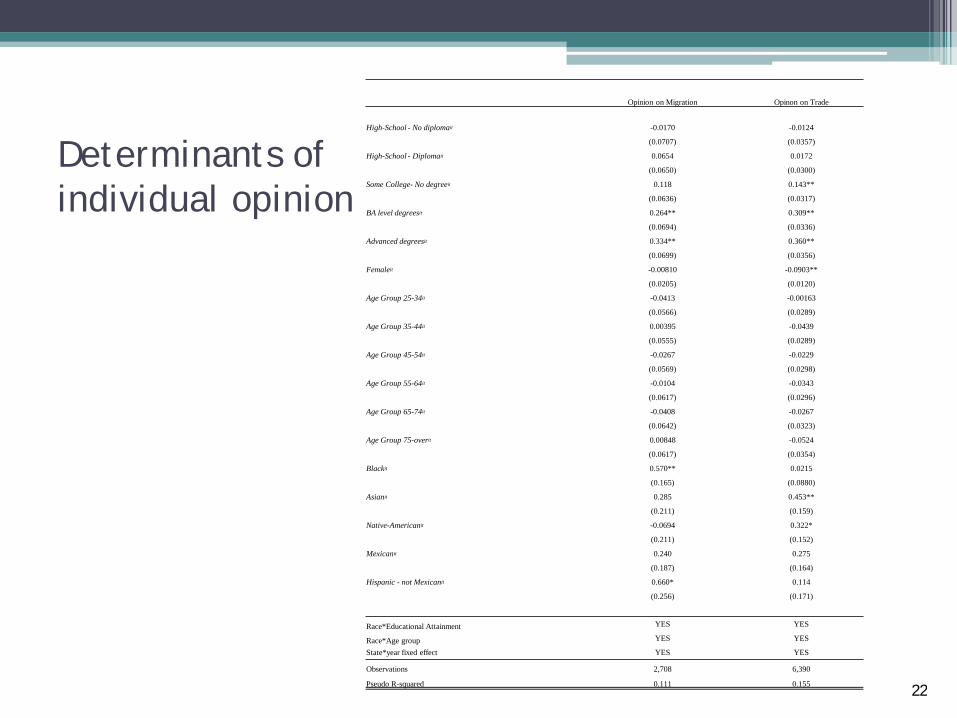
Determinants of individual opinion
Opinion on Migration Opinon on Trade
High-School - No diplomait -0.0170 -0.0124
(0.0707) (0.0357)
High-School - Diplomait 0.0654 0.0172
(0.0650) (0.0300)
Some College- No degreeit 0.118 0.143**
(0.0636) (0.0317)
BA level degreesit 0.264** 0.309**
(0.0694) (0.0336)
Advanced degreesit 0.334** 0.360**
(0.0699) (0.0356)
Femaleit -0.00810 -0.0903**
(0.0205) (0.0120)
Age Group 25-34it -0.0413 -0.00163
(0.0566) (0.0289)
Age Group 35-44it 0.00395 -0.0439
(0.0555) (0.0289)
Age Group 45-54it -0.0267 -0.0229
(0.0569) (0.0298)
Age Group 55-64it -0.0104 -0.0343
(0.0617) (0.0296)
Age Group 65-74it -0.0408 -0.0267
(0.0642) (0.0323)
Age Group 75-overit 0.00848 -0.0524
(0.0617) (0.0354)
Blackit 0.570** 0.0215
(0.165) (0.0880)
Asianit 0.285 0.453**
(0.211) (0.159)
Native-Americanit -0.0694 0.322*
(0.211) (0.152)
Mexicanit 0.240 0.275
(0.187) (0.164)
Hispanic - not Mexicanit 0.660* 0.114
(0.256) (0.171)
Race*Educational Attainment YES YES
Race*Age group YES YES
State*year fixed effect YES YES
Observations 2,708 6,390
Pseudo R-squared 0.111 0.155 22

IV ESTIMATES
(1) (2) (3) (4)
Migration Trade Migration Trade Migration Trade Migration Trade
Opiniondt -1.375* 0.213 -1.737** -0.0385 -2.094** -0.0568 -1.975** -0.0534 (0.611) (0.251) (0.581) (0.230) (0.681) (0.228) (0.672) (0.208)
Congruencedt -2.083** -0.291 -2.029** -0.532* -1.989** -0.487 -1.952** -0.460 (0.607) (0.265) (0.666) (0.254) (0.681) (0.272) (0.699) (0.238)
Interactiondt 4.447** 1.326* 4.775** 0.858 5.056** 0.889 4.972** 0.708 (1.231) (0.639) (1.335) (0.567) (1.353) (0.567) (1.390) (0.525)
State*year fixed effect YES YES YES YES
Economic characteristics NO YES YES YES
Socio-demographic characteristics NO NO YES YES
Politician's characteristics NO NO NO YES
Kleibergen-Paap Wald rk F statistic 12.16 45.58 13.83 30.58 12.37 30.19 11.88 30.23
State*year fixed effect YES YES YES YES
Observations 263 1,118 263 1,118 263 1,118 263 1,118
23

YEARS INCLUDED (1)
Years 94-96-98 (2)
Years 93-94-96-98 (3)
Years 96-98-03 (4)
Years 96-98-03-04
Migration Trade Migration Trade Migration Trade Migration Trade
Opiniondt -0.428 -0.0548 -0.428 0.167 -0.428 -0.0534 -0.428 -0.0403
(0.240) (0.235) (0.240) (0.202) (0.240) (0.208) (0.240) (0.169)
Congruencedt -0.316 0.441 -0.316 -0.372 -0.316 0.338 -0.316 -0.0761
(0.370) (0.484) (0.370) (0.361) (0.370) (0.359) (0.370) (0.320)
Interactiondt 1.665** -0.504 1.665** -0.477 1.665** -0.461 1.665** -0.284
(0.577) (0.653) (0.577) (0.599) (0.577) (0.536) (0.577) (0.459)
State*year fixed effect YES YES YES YES
Economic characteristics YES YES YES YES
Socio-demographic characteristics YES YES YES YES
Politician's characteristics YES YES YES YES
Observations 265 204 265 475 265 298 265 480
R-squared 0.439 0.454 0.439 0.449 0.439 0.635 0.439 0.575 24

MEASURES OF OPINION (1) (2) (3) (4) (5) (6)
Migration Trade Migration Trade Migration Trade Migration Trade Migration Trade Migration Trade
Mean opinion decadedt -0.294 -0.142
(0.393) (0.135)
Mean opiniondt -0.523 -0.0508 -0.495 -0.0686 -0.781 -0.0956 -0.0520
(0.281) (0.118) (0.363) (0.157) (0.444) (0.167) (0.113)
Median opiniondt -0.259 -0.0148
(0.146) (0.0773)
Mean opinion rescaleddt -0.329
(0.170)
Congruencedt -0.642 -0.273 -0.490 -0.205 -0.383 -0.214 -0.652 -0.216 0.157 -0.257 -0.249 -0.207
(0.549) (0.224) (0.425) (0.218) (0.503) (0.237) (0.581) (0.244) (0.336) (0.181) (0.371) (0.214)
Mean opinion decadedt*Congruencedt 2.293* 0.0779
(1.093) (0.417)
Mean opiniondt*Congruencedt 2.068** -0.143 2.064* -0.281 2.553* -0.239 -0.132
(0.685) (0.373) (0.876) (0.481) (1.012) (0.511) (0.355)
Median opiniondt*Congruencedt 0.648 -0.0241
(0.362) (0.207)
Mean opinion rescaleddt*Congruencedt 1.258**
(0.476)
State*year fixed effect YES YES YES YES YES YES
Economic characteristics YES YES YES YES YES YES
Socio-demographic characteristics YES YES YES YES YES YES
Politician's characteristics YES YES YES YES YES YES
Observations 265 1,139 228 1,079 188 908 154 844 265 1,139 265 1,139
R-squared 0.436 0.414 0.454 0.415 0.467 0.435 0.491 0.441 0.434 0.413 0.440 0.414 25

DEFINITIONS OF OPINION
(1) (2)
Opinion pro liberalization includes DK
Opinion against liberalization includes DK
Migration Trade Migration Trade
Opiniondt -0.476 -0.0436 -0.421 -0.138
(0.246) (0.133) (0.243) (0.171)
Congruencedt -0.362 -0.381 -0.294 -0.223
(0.374) (0.270) (0.369) (0.220)
Interactiondt 1.741** 0.256 1.647** -0.111
(0.583) (0.435) (0.578) (0.500)
State*year fixed effect YES YES
Economic characteristics YES YES
Socio-demographic characteristics YES YES
Politician's characteristics YES YES
Observations 265 1,139 265 1,139
R-squared 0.441 0.413 0.438 0.415 26

ALTERNATIVE DISTRICT-LEVEL CHARACTERISTICS (1) (2) (3) (4)
Migration Trade Migration Trade Migration Trade Migration Trade
Opiniondt -0.397 -0.0533 -0.403 -0.0537 -0.418 -0.0547 -0.420 -0.0395
(0.239) (0.113) (0.238) (0.113) (0.241) (0.113) (0.244) (0.113)
Congruencedt -0.325 -0.208 -0.327 -0.211 -0.324 -0.185 -0.350 -0.201
(0.375) (0.214) (0.374) (0.214) (0.370) (0.217) (0.375) (0.214)
Interactiondt 1.616** -0.133 1.625** -0.131 1.633** -0.142 1.716** -0.157
(0.575) (0.355) (0.576) (0.355) (0.581) (0.356) (0.607) (0.353)
SkillRatiodt 3.633* 1.040 3.747* 1.089 3.646* 1.047 3.366 1.289
(1.622) (0.812) (1.741) (0.932) (1.753) (0.917) (1.787) (0.899)
Unemploymentdt 4.296 -2.815 4.401 -2.835 5.204 -2.701 5.066 -2.014
(3.078) (1.538) (3.184) (1.585) (2.976) (1.474) (2.935) (1.492)
Log mean family incomedt -0.602 -0.208 -0.551 -0.173 -0.551 -0.178
(0.511) (0.265) (0.495) (0.263) (0.501) (0.269)
Log median family incomedt -0.566 -0.190
(0.465) (0.234)
Inequalitydt 0.348 0.127 (0.565) (0.352)
Farmerdt 4.026 3.711* 4.188 3.741* 3.685 4.068* 4.720 4.133*
(2.842) (1.674) (3.134) (1.657) (3.221) (1.692) (3.240) (1.671)
Wholesale, Retail and Transportationdt 5.949* -1.628 5.917* -1.643 5.354 -1.817 5.913* -1.007
(2.774) (1.619) (2.794) (1.648) (2.935) (1.622) (2.898) (1.662)
Urbandt 0.0136 0.239 0.0160 0.241 0.136 0.195 0.0254 0.237 (0.207) (0.168) (0.209) (0.168) (0.259) (0.188) (0.215) (0.169)
Log Pop Densitydt -0.0449 0.0175 (0.0497) (0.0316)
Foreign - borndt 1.171* 0.683 1.183* 0.684 1.447** 0.599 1.455* 0.458 (0.452) (0.374) (0.459) (0.368) (0.486) (0.410) (0.627) (0.447)
Foreign - born growthdt -0.0381 -0.0401 -0.0387 -0.0404 -0.0332 -0.0441 -0.0406 -0.0333 (0.0357) (0.0373) (0.0360) (0.0374) (0.0355) (0.0373) (0.0367) (0.0375)
African - Americandt 0.527 -0.223 0.527 -0.223 0.550 -0.245 0.567 -0.320 (0.374) (0.207) (0.375) (0.208) (0.386) (0.211) (0.395) (0.210)
Turnout Rate Previous Electionsdt 0.540 -0.464 (0.702) (0.539)
State*year fixed effect YES YES YES YES
Economic characteristics YES YES YES YES
Politician's characteristics YES YES YES YES
Observations 265 1,139 265 1,139 265 1,139 260 1,128
R-squared 0.440 0.414 0.440 0.414 0.442 0.414 0.432 0.411 27
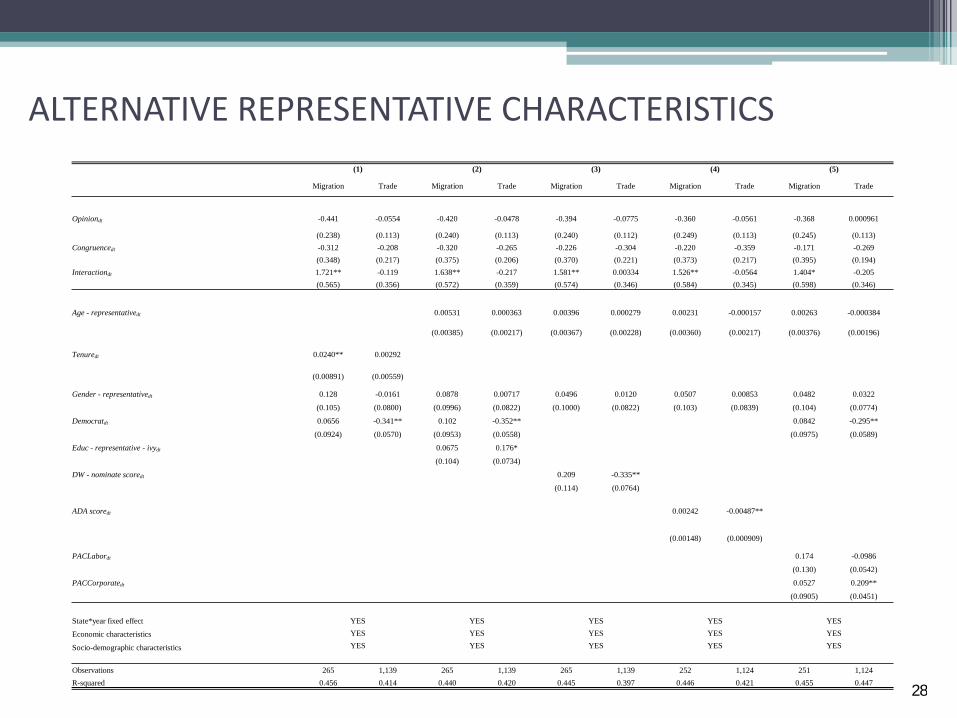
ALTERNATIVE REPRESENTATIVE CHARACTERISTICS (1) (2) (3) (4) (5)
Migration Trade Migration Trade Migration Trade Migration Trade Migration Trade
Opiniondt -0.441 -0.0554 -0.420 -0.0478 -0.394 -0.0775 -0.360 -0.0561 -0.368 0.000961
(0.238) (0.113) (0.240) (0.113) (0.240) (0.112) (0.249) (0.113) (0.245) (0.113) Congruencedt -0.312 -0.208 -0.320 -0.265 -0.226 -0.304 -0.220 -0.359 -0.171 -0.269
(0.348) (0.217) (0.375) (0.206) (0.370) (0.221) (0.373) (0.217) (0.395) (0.194) Interactiondt 1.721** -0.119 1.638** -0.217 1.581** 0.00334 1.526** -0.0564 1.404* -0.205
(0.565) (0.356) (0.572) (0.359) (0.574) (0.346) (0.584) (0.345) (0.598) (0.346)
Age - representativedt 0.00531 0.000363 0.00396 0.000279 0.00231 -0.000157 0.00263 -0.000384
(0.00385) (0.00217) (0.00367) (0.00228) (0.00360) (0.00217) (0.00376) (0.00196)
Tenuredt 0.0240** 0.00292
(0.00891) (0.00559)
Gender - representativedt 0.128 -0.0161 0.0878 0.00717 0.0496 0.0120 0.0507 0.00853 0.0482 0.0322
(0.105) (0.0800) (0.0996) (0.0822) (0.1000) (0.0822) (0.103) (0.0839) (0.104) (0.0774)
Democratdt 0.0656 -0.341** 0.102 -0.352** 0.0842 -0.295**
(0.0924) (0.0570) (0.0953) (0.0558) (0.0975) (0.0589)
Educ - representative - ivydt 0.0675 0.176*
(0.104) (0.0734)
DW - nominate scoredt 0.209 -0.335**
(0.114) (0.0764)
ADA scoredt 0.00242 -0.00487**
(0.00148) (0.000909)
PACLabordt 0.174 -0.0986
(0.130) (0.0542)
PACCorporatedt 0.0527 0.209**
(0.0905) (0.0451)
State*year fixed effect YES YES YES YES YES
Economic characteristics YES YES YES YES YES
Socio-demographic characteristics YES YES YES YES YES
Observations 265 1,139 265 1,139 265 1,139 252 1,124 251 1,124 R-squared 0.456 0.414 0.440 0.420 0.445 0.397 0.446 0.421 0.455 0.447
28

PLACEBO TESTS (1) (2) (3) (4)
Vote on Migration Vote on Trade Vote on
Migration Vote on Trade Vote on Migration Vote on Trade Vote on
Migration Vote on Trade
Opinion on Abortiondt -0.128 -0.0938
(0.233) (0.159)
Opinion on Religiondt 0.0597 -0.0512
(0.353) (0.176)
Opinion on TrustinFedGovdt -0.129 -0.150
(0.301) (0.147)
Opinion on WomenRoledt 0.303 -0.229
(0.247) (0.130)
Congruencedt 0.345 -0.563 0.774 -0.205 0.263 -0.484 0.505 -0.0196
(0.462) (0.333) (0.750) (0.459) (0.391) (0.254) (0.429) (0.299) OpinionAbortiondt*Congruencedt 0.211 0.575
(0.715) (0.500) OpinionReligiondt*Congruencedt -0.407 -0.0491
(0.931) (0.558) OpinionTrustinFedGovdt*Congruencedt 0.676 0.702
(0.857) (0.436) OpinionWomenRoledt*Congruencedt 0.0483 0.413 (0.572) (0.369)
State*year fixed effect YES YES YES YES
Economic characteristics YES YES YES YES
Socio-demographic characteristics YES YES YES YES
Politician's characteristics YES YES YES YES
Observations 265 1,137 265 1,130 264 1,026 264 1,031
R-squared 0.421 0.415 0.421 0.412 0.423 0.396 0.439 0.395 29

ROBUSTNESS CHECKS: PROBIT MODEL
(1) (2) (3) (4) (5)
Migration Trade Migration Trade Migration Trade Migration Trade Migration Trade
Opiniondt 0.939* 0.136 -1.006 -0.271 -1.342 -0.472 -2.083* -0.547 -2.061* -0.211
(0.457) (0.274) (0.716) (0.409) (0.726) (0.399) (0.830) (0.406) (0.827) (0.409)
Congruencedt -3.171** -0.0713 -2.902* -1.402 -1.948 -1.188 -1.264 -1.065
(0.998) (0.591) (1.186) (0.726) (1.293) (0.775) (1.305) (0.751)
Interactiondt 6.572** 1.675 6.925** 0.916 7.912** 0.992 7.592** -0.162
(1.937) (1.286) (1.969) (1.211) (2.094) (1.217) (2.070) (1.241)
State*year fixed effect YES YES YES YES YES
Economic characteristics NO NO YES YES YES
Socio-demographic characteristics NO NO NO YES YES
Politician's characteristics NO NO NO NO YES
Observations 265 1,139 265 1,139 265 1,139 265 1,139 265 1,139
30

DISCUSSION
• Study the direct effect of individual preferences towards globalization on the policy making process
• Focus on the role of the media in making politicians more accountable to their constituencies
• Main findings: ▫ Individual attitudes towards globalization are strongly correlated with
the policy maker’s behavior only when it comes to migration
▫ Media exposure has a significant and positive effect on politicians’ behavior only when it comes to migration
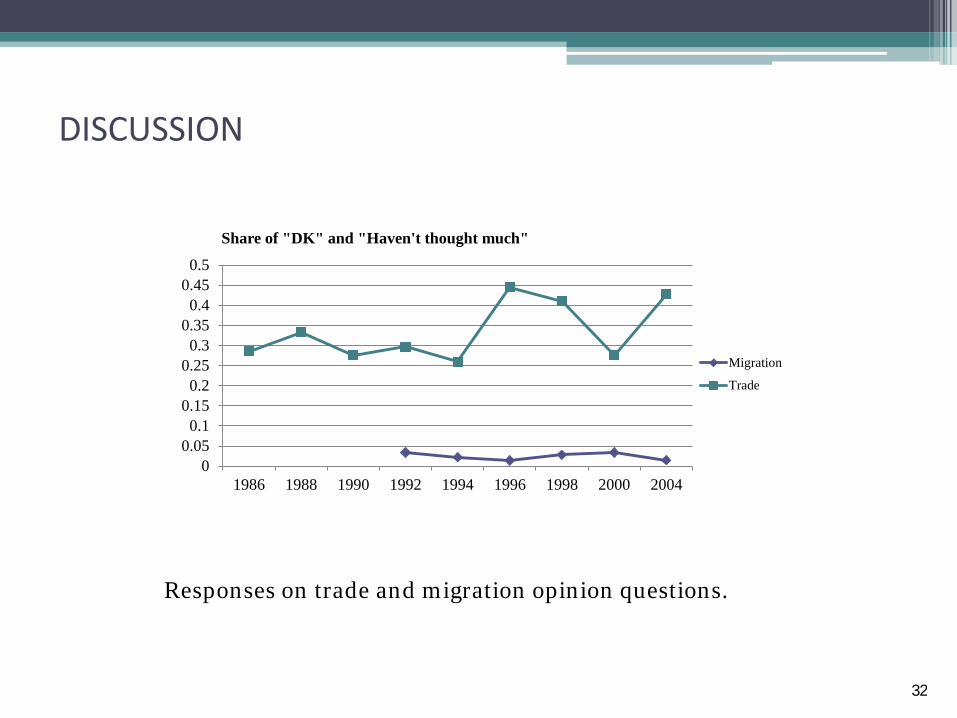
• How can this finding be explained? Previous studies have emphasized the low saliency of trade. This is confirmed in our data
31
DISCUSSION
Responses on trade and migration opinion questions.
00.050.1
0.150.2
0.250.3
0.350.4
0.450.5
1986 1988 1990 1992 1994 1996 1998 2000 2004
Share of "DK" and "Haven't thought much"
Migration
Trade
32