rich magneto-absorption spectra in aab-stacked trilayer
TRANSCRIPT

Rich Magneto-absorption Spectra in AAB-stackedTrilayer Graphene
Thi-Nga Do a, Po-Hsin Shih a, Cheng-Pong Chang b, Chiun-Yan Lina,∗, Ming-Fa Lina,∗
aDepartment of Physics, National Cheng Kung University, Tainan 701, Taiwan
bCenter for General Education, Tainan University of Technology, Tainan 701, Taiwan
October 10, 2018
Abstract
The generalized tight-binding model is developed to investigate the feature-rich
magneto-optical properties of AAB-stacked trilayer graphene. Three intragroup and
six intergroup inter-Landau-level (inter-LL) optical excitations largely enrich the
magneto-absorption peaks. In general, the former are much higher than the latter,
depending on the phases and amplitudes of LL wavefunctions. The absorption spec-
tra exhibit the single- or twin-peak structures which are determined by the quantum
modes, LL energy spectra and Fermion distribution. The splitting LLs, with different
localization centers (2/6 and 4/6 positions in a unit cell), can generate very distinct
absorption spectra. There exist extra single peaks because of LL anti-crossings. AAB,
AAA, ABA, and ABC stackings quite differ from one another in terms of the inter-LL
category, frequency, intensity, and structure of absorption peaks. The main charac-
teristics of LL wavefunctions and energy spectra and the Fermi-Dirac function are
responsible for the configuration-enriched magneto-optical spectra.
Keywords: AAB-stacked trilayer graphene, magneto-absorption spectra, optical se-
lection rules
* Corresponding author. Tel: +886-6-275-7575.
E-mail addresses: [email protected] (C.Y. Lin), [email protected]
(M.F. Lin)
1
arX
iv:1
509.
0225
3v3
[ph
ysic
s.co
mp-
ph]
18
Sep
2015
1. Introduction
Few- and multi-layer graphenes with different stackings have attracted a lot of experi-
mental [1–9] and theoretical [10–20] studies because of the special hexagonal symmetry.
They have been successfully synthesized by experimental methods, such as exfoliation
of highly orientated pyrolytic graphite [1, 2], chemical and electrochemical reduction of
graphene oxide [3, 4], metalorganic chemical vapour deposition (MOCVD) [5–8], and arc
discharge [9]. Graphene shows unusual essential physical properties, including the di-
verse optical selection rules [10],10 rich magnetic quantization [10–15], half-integer Hall
effect [3,16–18], low frequency plasma [19,20], and others. Such properties could be easily
modulated by stacking configurations [14, 21–23], dopping [24, 25], layer number [26, 27],
magnetic field (~B = B0z) [28, 29], electric field [30–32], mechanical strain [33–35], and
temperature [36,37]. To date, four important typical stacking configurations, AAB [1,2,4],
ABA [4–6], AAA [7, 8], and ABC [4, 6], have been discovered. In this work, we develop
the generalized tight-binding model to investigate the magneto-absorption spectra of AAB-
stacked trilayer graphene. A detailed comparison among four stacking trilayer systems is
also made.
The rich magnetic quantization is induced by the distinct stacking configurations. A
N-layer graphene possesses N groups of LLs, where each group consists of valence and
conduction ones [14]. Monolayer graphene has the√B0-dependent inter-LL transition
energies, in which the absorption peaks satisfy the selection rule of ∆n = ±1 [43]. Several
theoretical studies on the magneto-optical properties have been elaborated for the AAA-
and ABC-stacked trilayer graphenes. The AAA stacking presents three pairs of Dirac
cones results in only three intragroup inter-LL transition categories [38, 39]. The above-
2

mentioned√B0 dependence and selection rules are also valid for N-layer AAA graphene.
The ABC stacking has three pairs of energy bands, including the linear, sombrero-shaped,
and parabolic bands, which give rise to nine categories of inter-LL excitations [40,41]. On
the other hand, a thorough systematic study on the magneto-optical properties of the ABA-
stacked trilayer graphene is absent up to now [41,42]. The electronic structure exhibits two
pairs of parabolic bands and a pair of linear ones. This means that the ABA stacking could
be regarded as the combination of monolayer and AB-stacked bilayer graphenes in optical
properties. It is worth mentioning that the AB bilayer system presents four categories of
absorption peaks, in which there is no simple relationship between the inter-LL transition
energies and B0 [43, 44]. The ABA graphene is thus expected to have five categories of
inter-LL excitations, what will be investigated and presented in this work (Figs. 6(a)-6(c)).
The energy dispersions of AAB-stacked trilayer graphene consist of three divergent pairs
of valence and conduction bands, oscillatory (Sc,v1 ), sombrero-shaped (Sc,v
2 ), and parabolic
ones (Sc,v3 ) (Fig. 1(b)) [15]. Significantly, the Sc,v
1 bands (Fig. 1(c)) are first revealed in the
AAB stacking implying that its electronic structure is exclusive among the aforementioned
trilayer systems. How the unique electronic properties reflected in the magneto-absorption
spectra is worthy of a thorough study.
The methods of optical spectroscopies are powerful tools to identify the optical exci-
tations and selection rules in condensed-matter systems. Such experimental techniques,
including absorption, transmission, reflection, Raman scattering and Rayleigh scattering
spectroscopies, have been successfully applied to two-dimensional (2D) materials, concern-
ing a large class of graphene-related systems, such as, few-layer graphenes [45], carbon nan-
otubes [46], graphene nanoribbons [47], graphite and graphite intercalation compound [48];
3

also other few-layer systems, e.g., silicenes [49,50], topological insulators [51], MoS2 [52,53],
and so on. The intra- and inter-LL optical transitions in graphene systems have been ob-
served in infrared spectroscopy. Evidently, the field-dependent frequency and the selection
rule of ∆n = ±1 are identified by transmission and Raman scattering spectroscopy [54–59].
In particular, the square-root and linear B0-dependent frequencies due to the massless and
massive Dirac-fermions, respectively, of the monolayer and AB-stacked bilayer graphenes,
are revealed in the infrared transmission spectra [54–56]. These Dirac-fermions are further
confirmed by the magneto-Raman spectroscopy for the few-layer AB-stacked and ABC-
stacked graphenes [57–59]. It should be noted that the experimental measurements men-
tioned previously are only resolved on the intragroup magneto-absorption spectra due to
the first group of LLs.
The center of interest in this work is to investigate the configuration-enriched magneto-
optical properties of AAB-stacked trilayer graphene using the generalized tight-binding
model. The special electronic properties are directly reflected on the LL energies and
wavefunctions, so that they induce the extraordinary features in the magneto-optical prop-
erties. This study shows that there exist nine categories of absorption peaks, including three
intragroup and six intergroup ones. The intragroup transitions remarkably differ from the
intergroup ones in the intensity, energy spacing, and structure of peaks. The former ex-
hibits very low intensity, while the latter are much higher and comparable with those of
monolayer graphene. Moreover, the splitting LLs, arising from the destruction of inversion
symmetry, can diversify the magneto-absorption spectra. These characteristics are absent
in the other trilayer graphene systems. There are important differences among four typical
stacking trilayer graphenes in the excitation category and the main features of absorption
4

peaks. The predicted results, with regard to nine categories of inter-LL transitions, can be
verified by optical spectroscopies [54–59].
5

2. Method
The generalized tight-binding model is developed to study the magneto-electronic spec-
tra of AAB-stacked trilayer graphene [15]. For the first two layers, shown in Fig. 1(a),
all carbon atoms have the same (x,y) projections while the third layer can be obtained
by shifting the first (or the second) one by a distance of b along the armchair direction.
The parameters of ten intra- and inter-layer atomic interactions are used (γ0 = −2.569
eV, γ1 = −0.263 eV, γ2 = 0.32 eV, γ3 = −0.413 eV, γ4 = −0.177 eV, γ5 = −0.319 eV,
γ6 = −0.013 eV, γ7 = −0.0177 eV, γ8 = −0.0319 eV, and γ9 = −0.012 eV ) to characterize
the special energy bands. A uniform perpendicular magnetic field can induce the Peierls
phase related to the vector potential and thus enlarge the unit cell to become a rectangle
including 12RB carbon atoms (RB = hc/eB0) (Fig. 1(a)). The eigenfunctions of the quite
large Hamiltonian is solved by an exact diagonalization method to be in the arrangement
of 12RB tight-binding functions as follows.
|Ψc,vk 〉 =
3∑l=1
2RB∑m=1
(cAl
m,k
∣∣∣∣Alm,k
⟩+ cBl
m,k
∣∣∣∣Blm,k
⟩),
in which c and v denote, respectively, the conduction and valence states; cAlm,k
(cBlm,k
)
represent the subenvelope functions on the six distinct sublattices. For each LL, the quan-
tum number (nc,vl ) could be determined by the number of zero points in the dominating
subenvelope wavefunctions.
When ABA-stacked trilayer graphene is present in an electromagnetic field with the
electric polarization E ‖ y, an occupied LL will be excited to an unoccupied one. The
6

optical absorption function, according to the Fermi golden rule, is expressed as
A(ω) ∝∑
c,v,m,m′
∫1stBZ
dk
(2π)2
∣∣∣⟨Ψc(k,m′)∣∣∣E ·Pme
∣∣∣Ψv(k,m)⟩∣∣∣2
× Im[ f(Ec(k,m′))− f(Ev(k,m))
Ec(k,m′)− Ev(k,m)− ω − iΓ
], (1)
where P is the momentum operator, f(Ec,v(k,m)) the Fermi-Dirac distribution function;
Γ (≈ 1 meV) the broadening parameter. The absorption spectrum is associated with the
velocity matrix elements (the first term) and the joint density of states (the second term).
The former can determine whether the inter-LL transitions are available. The velocity
matrix elements, as successfully done for carbon-related materials [60], are evaluated under
the gradient approximation in the form of
⟨Ψc(k,m′)
∣∣∣E ·Pme
∣∣∣Ψv(k,m)⟩∼=
∂
∂ky
⟨Ψc(k,m′)
∣∣∣H∣∣∣Ψv(k,m)⟩
=3∑
l,l′=1
2RB∑m,m′=1
(c∗Al
m,kcAl′
m′,k
∂
∂ky
⟨Al
m,k
∣∣∣H∣∣∣Al′
m,k′
⟩+ c∗Al
m,kcBl′
m′,k
∂
∂ky
⟨Al
m,k
∣∣∣H∣∣∣Bl′
m,k′
⟩+ c∗Bl
m,kcAl′
m′,k
∂
∂ky
⟨Bl
m,k
∣∣∣H∣∣∣Al′
m,k′
⟩+ c∗Bl
m,kcBl′
m′,k
∂
∂ky
⟨Bl
m,k
∣∣∣H∣∣∣Bl′
m,k′
⟩).
Since the nearest-neighbor atomic interaction is much larger than the interlayer ones, only
the Hamiltonian elements of the former dominate the velocity matrix elements. On the
same layer, ∂H/∂ky is almost the same for all the nearest neighbors in the enlarged unit
cell. Consequently, the magneto-optical selection rule depends on the relations between
the initial state on the Al (Bl) sublattice and the final state on the Bl (Al) one. That is,
these two states on the different sublattices of the same layer must have the same quantized
mode.
7
3. Magneto-absorption spectra
AAB-stacked trilayer graphene exhibits three groups of LLs, where each group con-
sists of occupied valence and unoccupied conduction ones. Each LL is characterized by
the subenvelope functions on the six sublattices, as indicated in Figs. 2 and 3 for the
(kx = 0, ky = 0) state at 2/6 localization center under B0 = 40 T. The first, second and
third groups are initiated at 0 (0), -0.23 (0.24) and -0.58 (0.55) eV for the valence (con-
duction) states, as indicated by blue, green and red colors, respectively. The valence and
conduction LLs are asymmetric about EF = 0 because of the interlayer atomic interactions.
It is expected to induce the twin-peak structures in the magneto-absorption spectra. The
quantum numbers of the first ( nc,v1 ), second (nc,v
2 ) and third groups (nc,v3 ) are, respectively,
determined by the A1, B2 and A2 sublattices with the dominating subenvelop functions
(Figs. 2 and 3). As to the first group, there exist three LLs near EF , in which the middle
nc,v1 = 0 LL is located right at EF , while the other two are assigned nc,v
1 = 1. The next
LLs nc,v1 = 2, nc,v
1 = 3, ... are in an usual monolayer-like ordering. Distinctly, the quantum
numbers of nc,v2 begin from nc,v
2 = 1, then nc,v2 = 0, nc,v
2 = 2, nc,v2 = 3, and so on. As for
nc,v3 , it normally increases from zero for the higher conduction states, and the lower valence
states.
The stacking configuration of AAB results in the special relationship between the differ-
ent subenvelop functions. All the LL wavefunctions are almost well-behaved in the spatial
distributions at B0 = 40 T, in which the main modes are much stronger than the side ones.
The subenvelope functions of A1 and A2 (B1 and B2) are similar in the number of zero
points since the first and second layers have the same (x,y) projection [15]. That is to say,
the quantum numbers determined by the A1 and A2 sublattices are identical. It should be
8

noted that, for the first and second groups (the third one), the phases of the A1 and A2
sublattices are identical for all the conduction (valence) states but opposite for the valence
(conduction) ones. Moreover, the spatial distribution of certain subenvelope functions are
much smaller compared to the others. For example, for the first group, the amplitude of
the A3 sublattic is much weaker than those of the other sublattices (Fig. 2). The critical
differences in amplitude and phase are expected to induce the unique absorption spectra.
The nine categories of optical excitations, which include three intragroup and six inter-
group ones, are clearly revealed in the magneto-absorption spectrum (Figs. 4(a)-4(e)). The
inter-LL optical excitations between any two groups are available only under the require-
ment of a specific selection rule. The optical absorption peaks corresponding to the first,
second, and third LL groups are respectively indicated by black, green, and red numbers
(underline for valence LLs). The intragroup and intergroup absorption peaks quite differ
from each other in the spectral intensities, peak structures, and energy spacings in twin
peaks. The whole intragroup categories, excluding the threshold peak 01, are twin peaks
with very low intensity. While for the intergroup ones, except for the transitions between
the first and third LL groups, all of peaks show the single-peak structure with monolayer-
like intensity. The intensity difference arises from the special relations of the subenvelope
functions between the Al (Bl) sublattice of the initial states and the Bl (Al) sublattice
of the final ones (discussed later). Regarding the energy spacings in twin peaks, those of
the intergroup excitations are much wider than the intragroup ones, mainly owing to the
asymmetry of LL energy spectra.
The intensities of absorption peaks are determined by the summation of 〈Al|Bl〉 and
〈Bl|Al〉, where l = 1, 2, 3. As to the first and third groups, 〈A3|B3〉 ≈ 0, especially for
9

low-lying LLs because of the very low amplitudes of the A3 and B3 subenvelope functions,
respectively. Besides, the contributions of 〈A2|B2〉 are fainter for higher or deeper LLs due
to the lower amplitudes on two sublattices. Moreover, the peak intensity can be largely
enhanced or reduced depdending on the phase relationship between the two sublattices:
Al (Bl) of the initial states and Bl (Al) of the final ones. In general, the intensities of
the intergroup transition peaks are much higher than those of the intragroup ones. For
example, the intragroup peak 12 at ω ≈ 0.06 eV (marked by blue arrow) is about 1/15
compared with the intergroup one 11 at ω ≈ 0.25 eV (marked by green arrow in Fig. 4(a)).
For the former, the |B1〉 of the nv1 = 1 initial state and the 〈A1| of the nc
1 = 2 final state
have the distinct phases, while |B2〉 and 〈A2| possess the same ones. As a result, 〈A1|B1〉
and 〈A2|B2〉 present the opposite signs which reduce the velocity matrix elements, and
thus lower the absorption peak intensity. On the contrary, the peak intensity of the latter
is enhanced due to the fact that all the dominating subenvelope functions of the nv2 = 1
initial and nc1 = 1 final states on the sublattices, (B1, A1), (B2, A2); (A3, B3), have similar
phase relations. It should be noted that there are a number of extremely low peaks in the
spectra, e.g., 51, 51 (red arrow), and so on, due to the appearance of the side modes. Those
transitions do not satisfy the optical selection rule and thus could be neglected.
The intragroup inter-LL excitations possess a lot of low-intensity absorption peaks, as
shown in Fig. 4(a). The threshold peak of nv1n
c1 = 01, with frequency of ω = 0.01 eV,
possesses an ignorable intensity (inserted in Fig. 4(a)). This is caused by the extremely
weak subenvelope functions of nv1 = 0 LL in the B1, A2 and A3 sublattices. The other low
peaks belong to the twin-peak structures, such as nv1n
c1 = 21 and nv
1nc1 = 12 (ω ≈ 0.05
eV), nv1n
c1 = 32 and nv
1nc1 = 23 (ω ≈ 0.13 eV), and so on. The quantum mode of the
10
nv1 = 2 A1(A2) sublattice is identical to that of the nc
1 = 1 B1(B2) one, so that the 21 peak
satisfies the optical selection rule. However, the same phase between A1 and B1 sublattices
competes with the opposite phases of the A2 and B2 ones, which predominantly reduces
the peak intensity. Concerning the (nv2 → nc
2) and (nv3 → nc
3) excitation channels, the
(nv2n
c2 = 01, nv
2nc2 = 10) and (nv
3nc3 = 01, nv
3nc3 = 10) threshold peaks are, respectively,
revealed at (ω = 0.502 eV; ω = 0.51 eV ) and (ω = 1.205 eV; ω = 1.209 eV). While the
intensities of the latter two are comparable with the other intragroup excitation peaks,
those of the two formers are predominant. This is because all the subenvelope functions
of the nv2 = 0 (1) initial and nc
1 = 1 (0) final states on the Am and Bm sublattices have
the same (opposite) phases. In general, three categories of intragroup inter-LL excitations
exhibit similar characteristics, including peak intensity, twin-peak structure, and selection
rule.
The intergroup inter-LL excitations exhibit single and twin peaks, depending on the
quantum modes and the asymmetry of LL energy spectra. The absorption categories
related to the second group of LLs, the nv1 → nc
2, nv2 → nc
1, nv3 → nc
2, and nv2 → nc
3
transitions, present solely single-peak structures. For the two formers, the initial and final
states of available excitations satisfy nc,v1 = nv,c
2 , e.g., 00, 00, 11, 11, and others (Fig.
4(a)). Especially, their absorption spectra begin, respectively, with the peaks of nv1n
c2 = 11
(ω = 0.25 eV; marked by green arrow) and nv2n
c1 = 11 (ω = 0.245 eV), according to the
unusual ordering of quantum numbers in the second group (Fig. 3). And then the threshold
peaks, nv1n
c2 = 00 and nv
2nc1 = 00, are merged together at ω = 0.265 eV and become a
higher-intensity single peak. Concerning the nv2 → nc
3 and nv3 → nc
2 excitations, the inter-LL
transitions with |nc,v2 −n
v,c3 | = 2 and 0 can induce the single-peak structure. The former are
11

much higher than the latter, mainly owing to the special relations among the subenvelope
functions. For instance, the 20 single peak satisfies the optical selection rule where the
quantum modes in the A1, A2, B3 sublattices of nv2 = 2 are, respectively, identical to those
in the B1, B2, and A3 sublattices of nc3 = 0. Furthermore, the corresponding sublattices
with the same phases are responsible for the predominant peak intensity, compared to the
weak peaks of 00, 11, and so on. On the other hand, the nv3 → nc
1 and nv1 → nc
3 excitations
exhibit the twin-peak structures. This is due to the fact that the inter-LL transitions obey
the selection rule of |nc,v1 −n
v,c3 | = 1, similar to that of the intragroup ones. The twin peaks
possess very different intensities in which one resembles the intragroup peaks while another
is comparable to the intergroup ones. For example, the 21 and 12 peaks are, respectively,
weak and strong as indicated by red arrows in Fig. 4(b). Exceptionally, the threshold
peak 01 is a single one since the 10 transition is forbidden by the Fermi-Dirac distribution
function.
The splitting of LLs results in critical differences between magneto-optical absorption
spectra corresponding to 4/6 (Figs. 5(a)-5(e)) and 2/6 localization centers in terms of in-
tensity, frequency, and structure of peaks. This is mainly owing to the abnormal quantum
number ordering and the significant side modes during the LL anti-crossings [15]. Ac-
cordingly, the dissimilarities of two spectra are clearly revealed in the inter-LL excitations
related to the low-lying LLs. For the threshold peak 01, that of the former has much higher
intensity and frequency (ω ≈ 0.15 eV) (Fig. 5(a)). There are a lot of low-frequency single
peaks when the magnetic field is within the range of LL anti-crossings. For example, the
nc,v1 = 0 LL also has the non-negligible side mode of three zero points, being responsible
for the anti-crossing of the nc,v1 = 0 and nc,v
1 = 3 LLs and the appearance of the single
12

peaks 02 and 04. Furthermore, many pairs of LLs in the anti-crossings such as (nc,v1 = 1,
nc,v1 = 4), (nc,v
1 = 2, nc,v1 = 5), and so on, will present several extra single peaks. Conse-
quently, similar characteristics also occur in the initial absorption peaks of the intergroup
transitions between the first LL group and others. Different from the spectrum at 2/6
center, the nv2 → nc
3 and nv3 → nc
2 excitations only present the inter-LL transitions with
|nc,v2 − n
v,c3 | = 0. In short, the LL anti-crossings play an important role in distinguishing
the magneto-absorption spectra due to the splitting LLs.
Specially, the magneto-absorption spectrum of ABA-stacked trilayer graphene is worthy
of a detailed consideration for the wide-frequency range. Since LLs are four-fold degenerate,
the inter-LL excitations at 4 different localization centers, 1/6, 2/6, 4/6, and 5/6, are
identical. Only five categories of absorption peaks are revealed in the absorption spectrum,
as shown in Figs. 6(a)-6(c). They correspond to those of AB-stacked bilayer [43, 44] and
monolayer graphenes [43], mainly owing to the absence of the inter-LL transitions related
to a pair of linear bands and two pairs of parabolic ones. Two categories of intergroup
excitations, 2v → 3c and 3v → 2c, exhibit twin peaks due to the asymmetric LL energy
spectrum. The intragroup inter-LL excitations of the second and third LL groups are
mostly present in twin-peak structures except for the threshold 01 peak. The absence of
10 transition is due to the fact that the n = 0 LL is occupied. Especially, the category
of 1v → 1c transitions generally displays single peaks with dominant uniform intensity
because of the symmetric LL energy spectrum of the quantized linear bands. There is only
a twin-peak structure for 21 and 12 (red arrows in Fig. 6(b)), reflecting the distortion of
the linear bands near the Dirac points. Moreover, the peak frequencies are proportional to
√B0, similar to those in three absorption categories of the AAA stacking. On the other
13

hand, there is no simple relationship in the other inter-LL excitations of the ABA, ABC
and AAB stackings.
The stacking configurations can diversify the magnetic quantization and thus the magneto-
absorption spectra. Four typical trilayer graphenes, AAB, AAA, ABC, and ABA stack-
ings, are quite different from one another in the excitation category, structure, intensity,
and number of absorption peaks. The differences mainly come from the special relations
among the subenvelope functions on the six sublattices. The AAA trilayer graphene, being
regarded as three separated monolayer graphenes, only has three categories of intragroup
absorption peaks [38, 39]. The main reason for the absence of the intergroup excitations
is that all the LL wavefunctions are the linear symmetric or asymmetric superpositions of
the subenvelope functions in different layers. The absorption spectrum only exhibits the
single-peak structures with uniform intensity except for the threshold peak in each category
with half of intensity. On the other hand, the ABC-stacked trilayer graphene possesses nine
categories of absorption peaks with nonuniform intensities [40, 41], similar to those of the
AAB stacking. The whole spectrum, excluding the threshold peaks, exhibits the twin-peak
structure. Overall, the intragroup excitations are stronger than the intergroup ones. This
can also be observed in the ABA stacking (Fig. 6(a)-6(c)), being in sharp contrast with the
AAB stacking. Concerning the number of absorption peaks, it is higher for the ABC and
AAB stackings but lowest for the AAA one. The critical differences among the four stacked
trilayer graphenes can provide the useful information in identifying the specific stacking
configurations by the experimental measurements [54–59].
4. Conclusion
14

The magneto-optical properties of the AAB-stacked trilayer graphene have been investi-
gated using the generalized tight-binding model. This method can also be extended to study
the other essential physical properties of few-layer graphenes and other 2D materials. An
optical selection rule that the Al (Bl) sublattice of the initial state has the same quantum
mode with the Bl (Al) sublattice of the final state is deduced from the spatial distributions
of LL wavefunctions. The main features of magneto-absorption spectra, including the ex-
citation category, intensity, structure, frequency, and number of absorption peaks, are fully
explored in a wide frequency range. There are nine categories of inter-LL optical transitions
in which the intragroup and intergroup ones quite differ from one another. The magneto-
absorption spectrum could be enriched by the splitting LLs, arising from the destruction of
inversion symmetry in the AAB stacking. Both single- and twin-peak structures are clearly
revealed in the magneto-absorption spectra. The main characteristics of LL wavefunctions
and energy spectra and the Fermi-Dirac function are responsible for the above-mentioned
characteristics. The predicted feature-rich magneto-absorption spectra with nine excitation
categories can be further verified by optical spectroscopy techniques [54–59].
The intergroup and intragroup absorption peaks are significantly different in intensity,
structure, and frequency. In general, the former are much higher than the latter, depending
on the phase and amplitude relations between the subenvelope functions on six sublattices.
Due to the quantum modes and asymmetric LLs, the former have single and twin peaks
while the latter display twin-peak structures except for threshold ones. The energy spacings
between the twin-peak structures are much wider for the intergroup excitations compared
with the intragroup ones. The critical differences in spectra at 2/6 (5/6) and 4/6 (1/6)
localization centers mostly lie in the excitations associated to the low-lying LLs. This is
15

caused by the significant side modes during the LL anti-crossings. A lot of low-frequency
extra single peaks are present in the latter when the magnetic field is within the range
of LL anti-crossings. The inter-LL excitations of the higher-lying LLs are quite similar in
certain respects for different localization centers.
The AAB-stacked trilayer graphene exhibits the unique magneto-optical properties
among four typical stacking systems. It possesses the most plentiful magneto-absorption
spectrum, mainly owing to the splitting LLs and the frequent LL anti-crossings. The AAA
stacking, the superposition of three monolayer graphenes, has three categories of intragroup
excitation peaks. The magneto-absorption spectrum only has many single peaks with a
uniform intensity except for the threshold ones. The ABA stacking, being regarded as the
combination of monolayer and AB-stacked bilayer graphene, only presents five categories of
absorption peaks. Only peaks arising from the slightly distorted Dirac cones show the uni-
form spectral intensity in the single-peak structures. Two pairs of parabolic bands induce
two intragroup and two intergroup excitations categories, in which the former are stronger
than the latter. All the peaks, the threshold ones excepted, have the twin-peak structures.
The ABC stacking possesses the same number of intra- and inter-group absorption peak
categories as the AAB one. However, the intensity relation between the intragroup and
intergroup peaks is similar to that of the ABA stacking, but in sharp contrast with the
AAB one.
Acknowledgments
This work was supported in part by the National Science Council of Taiwan, the Re-
public of China, under Grant Nos. NSC 98-2112-M-006-013-MY4 and NSC 99-2112-M-
165-001-MY3.
16
References
[1] Z. Y. Rong, P. Kuiper. Phys. Rev. B 48 (23) (1993) 17427.
[2] J. M. Campanera, G. Savini, I. Suarez-Martinez, M. I. Heggie. Phys. Rev. B 75 (2007)
235449.
[3] L. Y. Zhang, Y. Zhang, J. Camacho, M. Khodas, I. Zaliznyak. Nature Phys. 7 (2011)
953.
[4] L. B. Biedermann, L. B. Michael, A. C. Michael, Z. Dmitry, G. R. Ronald. Phys. Rev.
B 79 (2009) 125411.
[5] C. T. Ellis, A. V. Stier, M. H. Kim, J. G. Tischler, E. R. Glaser, R. L. Myers-Ward et
al. Scientific Reports 3 (2013) 03143.
[6] C. H. Lui, M. M. Leandro, S. Kim, L. Gabriel, E. L. Franois, S. Riichiro et al. Nano
Lett. 12 (2012) 5539.
[7] J. H. Hwang, B. S. Virgil, I. T. Christopher, S. Shriram, H. Dong, M. Kim et al.
Journal of Crystal Growth 312 (2010) 3219.
[8] Z. Y. Juang, A. Y. Lu, C. Y. Su, K. C. Leou, F. R. Chen et al. Carbon 48 (2010) 3169.
[9] Z. S. Wu, W. Ren, L. Gao, J. Zhao, Z. Chen, B. Liu et al. ACS Nano 3 (2009) 411.
[10] Y. K. Huang, S. C. Chen, Y. H. Ho, C. Y. Lin, M. F. Lin. Scientific Reports 4 (2014)
7509.
[11] Y. H. Lai, J. H. Ho, C. P. Chang, M. F. Lin. Phys. Rev. B 77 (2008) 085426-36.
[12] Y. P. Lin, J. Wang, J. M. Lu, C. Y. Lin, M. F. Lin. RSC Advances 4 (2014) 056552.
17

[13] S. H. R. Sena, J. M. Pereira Jr., F. M. Peeters, G. A. Farias. Phys. Rev. B 84 (2011)
205448.
[14] C. Y. Lin, J. Y. Wu, Y. J. Ou, Y. H. Chiu, M. F. Lin. PCCP, DOI:
10.1039/C5CP05013H (2015).
[15] T. N. Do, C. Y. Lin, Y. P. Lin, P. H. Shih, M. F. Lin. Carbon 94 (2015) 619.
[16] Y. B. Zhang, Y. W. Tan, H. L. Stormer, P. Kim. Nature 438 (2005) 201.
[17] C. L. Kane, E. J. Mele. Phys. Rev. Lett. 95 (2005) 226801.
[18] K.S. Novoselov, E. Mccann, S. V. Morozov, V. I. Fal’ko, M. I. Katsnelson, U. Zeitler
et al. Nature Phys. 2 (2006) 117.
[19] X. Jiang. Phys. Rev. B 54 (1996) 13487.
[20] J. Y. Wu, S. C. Chen, O. Roslyak, G. Gumbs, M. F. Lin. ACS Nano 5 (2011) 1026.
[21] M. Aoki, H. Amawashi. Solid State Communications 142 (2007) 123.
[22] A. A. Avetisyan, B. Partoens, F. M. Peeters. Phys. Rev. B 81 (2010) 115432.
[23] K. F. Mak, J. Shan, T. F. Heinz. Phys. Rev. Lett. 104 (2010) 176404.
[24] D. M. Basko, S. Piscanec, A. C. Ferrari. Phys. Rev. B 80 (2009) 165413.
[25] C. Casiraghi. Phys. Rev. B 80 (2009) 233407.
[26] H. Hibino, H. Kageshima, M. Kotsugi, F. Maeda, F. -Z. Guo, Y. Watanabe. Phys.
Rev. B 79 (2009) 125437.
18

[27] E. H. M. Ferreira, M. V. O. Moutinho, F. Stavale, M. M. Lucchese, R. B. Capaz, C.
A. Achete et al. Phys. Rev. B 82 (2010) 125429.
[28] Y. Zhang, Z. Jiang, J. P. Small, M. S. Purewal, Y. -W. Tan, M. Fazlollahi et al. Phys.
Rev. Lett. 96 (2006) 136806.
[29] M. O. Goerbig. Rev. of Modern Phys. 83(4) (2011) 1193-243.
[30] C. L. Lu, C. P. Chang, Y. C. Huang, R. B. Chen, M. F. Lin. Phys. Rev. B 73 (2006)
14427.
[31] E. V. Castro, K. S. Novoselov, S. V. Morozov, N. M. R. Peres, J. M. B. Lopes dos
Santos, J. Nilsson et al. Phys. Rev. Lett. 99 (2007) 216802.
[32] K. F. Mak, C. H. Lui, J. Shan, T. F. Heinz. Phys. Rev. Lett. 102 (2009) 256405.
[33] J. E. Lee, G. Ahn, J. Shim, Y. S Lee, S Ryu. Nature Communications 3 (2012) 2022.
[34] S. M. Choi, S. H. Jhi, Y. W. Son. Phys. Rev. B 81 (2010) 081407.
[35] J. H. Wong, B. R. Wu, M. F. Lin. J. Phys. Chem. C 116 (2012) 8271.
[36] Y. -W. Tan, Y. Zhang, H. L. Stormer, P. Kim. Eur. Phys. J. Special. Toptics 148
(2007) 15.
[37] V.V. Cheianov, V. I. Fal’ko. Phys. Rev. Lett. 97 (2006) 226801.
[38] R. B. Chen, Y. H. Chiu, M. F. Lin. Carbon 54 (2013) 268.
[39] C. P. Chang. J. Appl. Phys. 110 (2011) 013725.
[40] Y. P. Lin, C. Y. Lin, Y. H. Ho, T. N. Do, M. F. Lin. PCCP 17 (2015) 15921.
19

[41] S. Yuan, R. Roldan, M. I. Katsnelson. Phys. Rev. B 84 (2011) 125455.
[42] S. Berciaud, M. Potemski, C. Faugeras. Nano Lett. 14 (2014) 4548.
[43] Y. H. Ho, Y. H.Chiu, W. P. Su, M. F. Lin. Appl. Phys. Lett. 99 (2011) 011914.
[44] Y. H. Ho, Y. H. Chiu, D. H. Lin, C. P. Chang, M. F. Lin. ACS Nano 4 (2010) 1465.
[45] C. Casiraghi, A. Hartschuh, E. Lidorikis, H. Qian, H. Harutyunyan, T. Gokus et al.
Nano Lett. 7 (2007) 2711.
[46] S. M. Tabakman, K. Welsher, G. Hong, H. Dai. J. Phys. Chem. C 114 (2010) 1956975.
[47] R. Denk, M. Hohage, P. Zeppenfeld, J. Cai, C. A. Pignedoli, H. Sode et al. Nature
Communications 5(2014) 5253-60.
[48] Y. Kim, Y. Ma, A. Imambekov, N. G. Kalugin, A. Lombardo, A. C. Ferrari et al.
Phys. Rev. B 85 (2012) 121403.
[49] D. Jose, A. Nijamudheen, A. Datta. Phys. Chem. Chem. Phys. 15 (2013) 8700.
[50] E. Scalise, E. Cinquanta, M. Houssaa, B. van den Broek, D. Chiappe, C. Grazianettib
et al. Appl. Surf. Sci. 291 (2014) 113.
[51] J. Zhang, Z. Peng, A. Soni, Y. Zhao, Y. Xiong, B. Peng et al. Nano Lett. 11 (2011)
2407.
[52] B. C. Windom, W. Sawyer, D. W. Hahn. Tribol. Lett. 42 (2011) 301.
[53] H. Li, Q. Zhang, C. C. R. Yap, B. K. Tay, T. H. T. Edwin, A. Olivier et al. Adv.
Junct. Mater. 22 (2012) 1385.
20

[54] E. A. Henriksen, P. Cadden-Zimansky, Z. Jiang, Z. Q. Li, L. -C. Tung, M. E. Schwartz
et al. Phys. Rev. Lett. 104 (2010) 067404.
[55] Z. Jiang, E. A. Henriksen, L. C. Tung, Y. -J. Wang, M. E. Schwartz, M. Y. Han et al.
Phys. Rev. Lett. 98 (2007) 197403.
[56] P. Plochocka, C. Faugeras, M. Orlita, M. L. Sadowski, G. Martinez, M. Potemski.
Phys. Rev. Lett. 100 (2008) 087401.
[57] C. Faugeras, M. Amado, P. Kossacki, M. Orlita, M. Kuhne, A. A. L. Nicolet et al.
Phys. Rev. Lett. 107 (2011) 036807.
[58] H. Zhao, Y. C. Lin, C. H. Yeh, H. Tian, Y. C. Chen, D. Xie. ACS Nano 8 (2014)
10766.
[59] C. Cong, J. Jung, B. Cao, C. Qiu, Z. Shen, A. Ferreira et al. Phys. Rev. B 91 (2015)
235403.
[60] M. F. Lin, K. W. -K. Shung. Phys. Rev. B 50 (1994) 17744(R).
21

FIGURE CAPTIONS
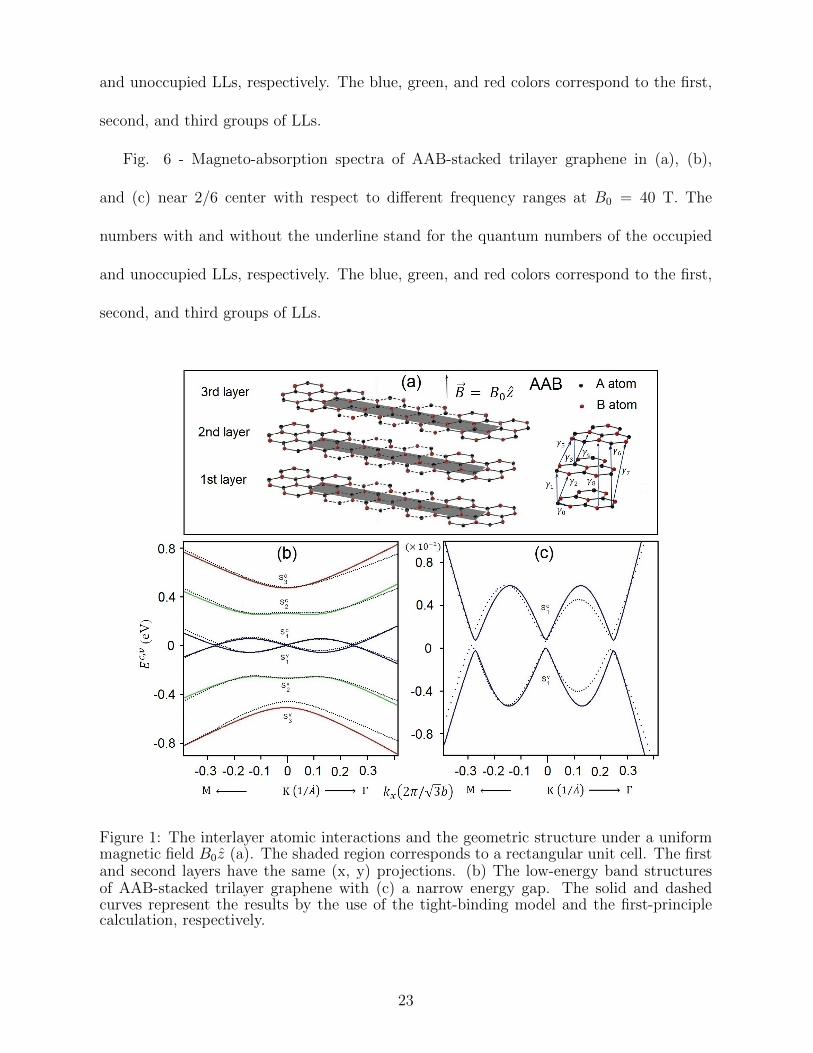
Fig. 1 - The interlayer atomic interactions and the geometric structure under a uniform
magnetic field B0z (a). The shaded region corresponds to a rectangular unit cell. The first
and second layers have the same (x, y) projections. (b) The low-energy band structures
of AAB-stacked trilayer graphene with (c) a narrow energy gap. The solid and dashed
curves represent the results by the use of the tight-binding model and the first-principle
calculation, respectively.
Fig. 2 - The distributions of the low-lying LL wavefunctions of AAB-stacked trilayer
graphene with the six distinct sublattices centered at the 2/6 localization under B0 = 40
T. The unit of the x-axis is m/2RB, where m represents the m-th A or B atom in the
enlarged unit cell.
Fig. 3 - The distributions of the conduction (a) and valence (b) LL wavefunctions
of AAB-stacked trilayer graphene with the six distinct sublattices centered at the 2/6
localization under B0 = 40 T. The unit of the x-axis is m/2RB, where m represents the
m-th A or B atom in the enlarged unit cell.
Fig. 4 - Magneto-absorption spectra of AAB-stacked trilayer graphene in (a), (b), (c),
(d) and (e) near 2/6 center with respect to different frequency ranges at B0 = 40 T. The
numbers with and without the underline stand for the quantum numbers of the occupied
and unoccupied LLs, respectively. The blue, green, and red colors correspond to the first,
second, and third groups of LLs.
Fig. 5 - Magneto-absorption spectra of AAB-stacked trilayer graphene in (a), (b), (c),
(d) and (e) near 4/6 center with respect to different frequency ranges at B0 = 40 T. The
numbers with and without the underline stand for the quantum numbers of the occupied
22
and unoccupied LLs, respectively. The blue, green, and red colors correspond to the first,
second, and third groups of LLs.
Fig. 6 - Magneto-absorption spectra of AAB-stacked trilayer graphene in (a), (b),
and (c) near 2/6 center with respect to different frequency ranges at B0 = 40 T. The
numbers with and without the underline stand for the quantum numbers of the occupied
and unoccupied LLs, respectively. The blue, green, and red colors correspond to the first,
second, and third groups of LLs.
Figure 1: The interlayer atomic interactions and the geometric structure under a uniformmagnetic field B0z (a). The shaded region corresponds to a rectangular unit cell. The firstand second layers have the same (x, y) projections. (b) The low-energy band structuresof AAB-stacked trilayer graphene with (c) a narrow energy gap. The solid and dashedcurves represent the results by the use of the tight-binding model and the first-principlecalculation, respectively.
23

Figure 2: The distributions of the low-lying LL wavefunctions of AAB-stacked trilayergraphene with the six distinct sublattices centered at the 2/6 localization under B0 = 40T. The unit of the x-axis is m/2RB, where m represents the m-th A or B atom in theenlarged unit cell.
24

Figure 3: The distributions of the conduction (a) and valence (b) LL wavefunctions of AAB-stacked trilayer graphene with the six distinct sublattices centered at the 2/6 localizationunder B0 = 40 T. The unit of the x-axis is m/2RB, where m represents the m-th A or Batom in the enlarged unit cell.
25

Figure 4: Magneto-absorption spectra of AAB-stacked trilayer graphene in (a), (b), (c),(d) and (e) near 2/6 center with respect to different frequency ranges at B0 = 40 T. Thenumbers with and without the underline stand for the quantum numbers of the occupiedand unoccupied LLs, respectively. The blue, green, and red colors correspond to the first,second, and third groups of LLs.
26

Figure 5: Magneto-absorption spectra of AAB-stacked trilayer graphene in (a), (b), (c),(d) and (e) near 4/6 center with respect to different frequency ranges at B0 = 40 T. Thenumbers with and without the underline stand for the quantum numbers of the occupiedand unoccupied LLs, respectively. The blue, green, and red colors correspond to the first,second, and third groups of LLs.
27
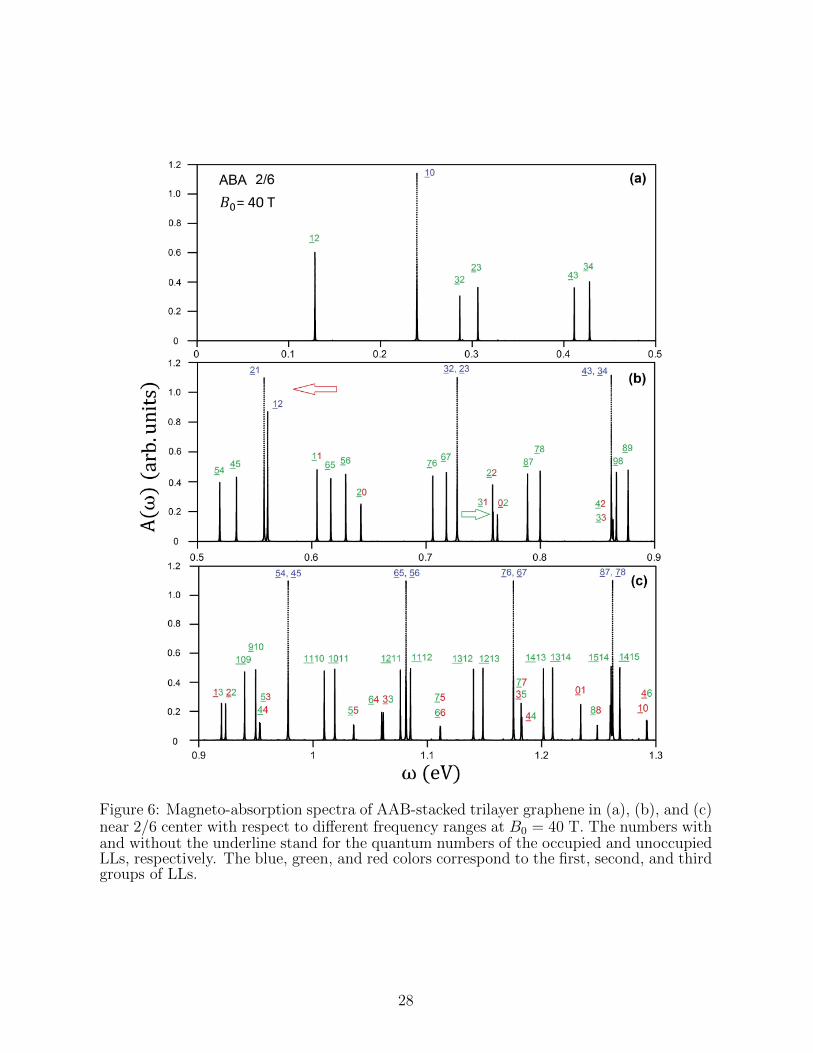
Figure 6: Magneto-absorption spectra of AAB-stacked trilayer graphene in (a), (b), and (c)near 2/6 center with respect to different frequency ranges at B0 = 40 T. The numbers withand without the underline stand for the quantum numbers of the occupied and unoccupiedLLs, respectively. The blue, green, and red colors correspond to the first, second, and thirdgroups of LLs.
28