rice cropping systems and resource efficiency - … comparison of different rice cropping systems on...
TRANSCRIPT

Rice cropping systems and resource efficiency
Comparison of different rice cropping systems on their resource use and socio-economic and environmental impactsB
ANOVA .......................... Analysis of variance
ATT ........................................... Average treatment effect on treated
ATU .......................................... Average treatment effect on untreated
AWD ...................................... Alternate wetting and drying
BF .................................................. Basal fertilizer
BMP ........................................ Best management practice = RMP
CDF .......................................... Cumulative distribution function
CRN ......................................... Controlled released nitrogen management
DAT .......................................... Days after transplanting
DS ................................................. Dry season
DSP ........................................... Direct seeding practice
ER .................................................. Effective rainfall
ET .................................................. Evapotranspiration
FAP ............................................ Farmers’ adapted practice
FFP ............................................. Farmers’ fertilization practice
FI ..................................................... Flooded irrigation
IP ..................................................... Total water input = WC
IR .................................................... In Xu et al. (2012): Irrigation water, ............................. in Boumann et al. (2005): total water input: Irrigation plus rainfall
IRRI .......................................... International Rice Research Institute
LSD ........................................... Least significant difference
MJ .................................................. Megajoule = 1 million Joule
NH3 ........................................... Ammonia
PF ................................................... Panicle fertilizer
PL ................................................... Percolation losses
ps-d .......................................... person days
RMP ........................................ Recommended Management practice = BMP
SD ................................................. Standard deviation
SNS ............................................ Submerged non-submerged irrigation
SRI ............................................... System of rice intensification
SSF .............................................. Strong seedling fertilizer
SSNM .................................. Site specific nutrient management
TF .................................................. Tillering fertilizer
VMP ....................................... Versatile multi-crop planter
WC ............................................. Water consumption = IP
WP .............................................. Water productivity =WUE
WS ............................................... Wet season
WUE ...................................... Water use efficiency = WP

1
Foreword .......................................................................................................................................... 50 Abstract ............................................................................................................................................. 61 Introduction, scope and objectives of the study ............................................................. 82 Rice production and different rice cropping systems ............................................... 11
2.1. Conventional irrigated lowland rice cultivation ................................................................................ 12
2.2. System of Rice Intensification (SRI) .......................................................................................................... 12
2.3. Alternate wetting and drying ...................................................................................................................... 13
2.4. Aerobic rice systems ........................................................................................................................................ 13
3 Comparison of different rice cropping systems ............................................................ 143.1. Water ...................................................................................................................................................................... 15
3.1.1 Water use and water productivity ....................................................................................................... 15
3.2 Energy .................................................................................................................................................................... 17
3.3 Labor requirement and gender aspects ................................................................................................... 19
3.4 Fertilizer ................................................................................................................................................................ 21
3.5 Weed occurrence and pesticide use ........................................................................................................... 22
3.6 Farmers’ perceptions, problems and risk adaptation practices ..................................................... 22
3.7 Grain yields .......................................................................................................................................................... 23
3.8 Production economics and impact on poverty .................................................................................... 24
3.9 Environmental impacts .................................................................................................................................. 26
3.9.1 Ammonia volatilization ............................................................................................................................ 26
3.9.2 Soil fertility ..................................................................................................................................................... 28
4 Under what conditions is the adoption of water saving technologies beneficial? .......................................................................................................... 29
4.1 General considerations ......................................................................................................................................... 29
4.2 Soil conditions ................................................................................................................................................... 29
5 Conclusions and recommendations .................................................................................. 316 References ..................................................................................................................................... 347 Annex .............................................................................................................................................. 38
Table of contents

Comparison of different rice cropping systems on their resource use and socio-economic and environmental impacts2
Table 1 Global production and food supply quantity of rice, wheat and maize in 2009 ...................... 9Table 2 World rice production .......................................................................................................................................... 12Table 3 Water productivity (g rice/kg water) in respect of evapotranspiration (WPET),
irrigation (WPI) and total water input (WPIP) at different scales .................................................. 15Table 4 Water use and percolation losses (in mm) of paddy rice (Japonica variety Jia33)
with different water and nitrogen managements (2008) ................................................................... 16Table 5 Water use efficiency (WUE, in kg/m3) of paddy rice (Japonica variety Jia33)
with different water and nitrogen managements (2008) ................................................................... 16Table 6 Water productivity with respect to total water input (WPIR; g grain/kg water)
of different varieties grown under flooded and aerobic conditions in the dry season (DS) and wet season (WS) of 2001–2003 ................................................................................ 17
Table 7 Water productivity (kg grain/m3 water) under recommended management practices (RMP) and the System of Rice Intensification (SRI) for the wet and dry seasons from 2007 to 2009 at Ndiaye, Senegal .................................................................................. 17
Table 8 Energy input : output ratio of different crops cultivated in developing countries in comparison to USA ........................................................................................................................................... 17
Table 9 Energy consumption (MJ/ha) based on energy sources under different tillage options ............................................................................................................................................................ 18
Table 10 Labor requirements reported in the literature for different rice cropping systems (in ps-d/ha) .......................................................................................................................... 19
Table 11 Change in labor requirements reported in the literature for different rice cropping systems (in %) .............................................................................................................................. 19
Table 12 Labor requirements for different rice cropping systems (in ps-d/ha) ......................................... 21Table 13 Grain yield from different rice cropping systems under two fertilizer
regimes in Amazonia ............................................................................................................................................. 23Table 14 Grain yield (t/ha) of different varieties grown under flooded and aerobic
conditions in the dry season (DS) and wet season (WS) of 2001–2003 ......................................... 24Table 15 Grain yield (t/ha) of the Japonica variety Bing 98110 grown under
traditional flooded rice cultivation and SRI in Zhejiang Province, China in 2004 ............... 24Table 16 Profitability analysis of rice management systems during 2008 wet and
2009 dry seasons at three sites in the Senegal ........................................................................................... 25Table 17 Costs and returns on SRI and conventional rice plots ......................................................................... 26Table 18 Factors influencing ammonia volatilization ............................................................................................ 27Table 19 Seasonal ammonia volatilization losses from rice paddy with different
water and nitrogen management, Tai-lake region, China (2008) ................................................... 28Table 20 Differences in water use and water use efficiency of different rice
cropping systems ..................................................................................................................................................... 32Table 21 Area equipped for irrigation (percentage of cultivated land
and part irrigated with groundwater) ......................................................................................................... 38Table 22 Typical daily rates of water outflows and seasonal water input
in lowland rice production in the tropics .................................................................................................. 39Table 23 Characteristics of selected indigenous rice varieties with yields
reported to be higher than 6 t/ha, cultivated in India ......................................................................... 40Table 24 Changes of grain yield of different varieties in the dry season (DS)
and wet season (WS) of 2001–2003 comparing aerobic conditions with flooded conditions ...................................................................................................................................... 40
List of Tables
3
Figure 1 Evolution of land under irrigated and rainfed cropping (1961 – 2008) .......................................... 9Figure 2 Global rice production, per capita calorie supply, and rice price
development between 1960 and 2012 ............................................................................................................. 9Figure 3 Classification of the world’s rice cropping systems .............................................................................. 11Figure 4 Water balance of irrigated (paddy) rice field (Bouman et al. 2006) ................................................ 15Figure 5 Energy inputs to three size classes of lowland rice farm in Central Thailand ........................ 18Figure 6 a) Median and span of labor use ratio and b) median and span of the percent
change in labor productivity . ............................................................................................................................ 20Figure 7 Descending cumulative distribution functions in the 2008 wet season (A) and the 2009
dry season (B) ............................................................................................................................................................. 25Figure 8 Ammonia volatilization rates from rice paddy with different water
and N managements .............................................................................................................................................. 27
List of Figures

Comparison of different rice cropping systems on their resource use and socio-economic and environmental impacts4

5
One of the major challenges in the world today is provid-ing food security for around seven billion people. Nor does the challenge end here. It is estimated that the world’s population could increase to nearly nine billion by the middle of this century. This impending scenario demands dramatically improved resource efficiency in agricultural production.
The most important resources for food production - ara-ble land, water and energy - are interlinked in a multitude of dependencies. Different sectors constantly compete for their use. Agriculture, as the largest user of natural re-sources, offers also the greatest opportunities to preserve resources by improving resource efficiency.
New agricultural technologies are needed to reach dual, but potentially conflicting, goals: conserving natural re-sources and providing food for an increasing demand. Are we prepared to take on this challenge? What is the cur-rent state of knowledge in the field of resource efficiency in today’s food production systems? And will emerging resource efficient technologies be adopted by the farmers?
Rice is one of the world’s most important staple crops.
The following study provides an overview of major rice production systems and their technologies. It analyses the different degrees of consumption of resources such as wa-ter, energy, fertile land, labor and inputs of fertilizer and pesticides. The study also looks into the contribution of these production systems to food security, as well as the effects of rice production on climate change. Incentives relevant to farmers for the adoption and diffusion of in-novative production systems are also considered.
This desk-study draws on results of international agricul-tural research as well as on the ground experiences of GIZ and other international development organisations.
The engagement of the German Federal Ministry for Economic Cooperation and Development (BMZ) to fi-nance this study not only allows an interesting overview on resource use efficiencies in rice production but also provides unexpected insights into the farmer’s rationale in their decision making. Trusting that this study will con-tribute to a better understanding of how to improve re-source efficiencies in rice production, I wish all a fruitful reading.
Dr. Elisabeth van den Akker (Senior Planning Officer Agricultural Water Use, Department of Rural Development and Agriculture, GIZ)
Foreword
Comparison of different rice cropping systems on their resource use and socio-economic and environmental impacts6
Globally, rice is the most important
staple crop and therefore crucial for
food security. An estimated area of
15 – 20 million hectares of irrigated
rice will face water scarcity, threaten-
ing the livelihoods of many small scale
farmers with land holdings of less than
three hectares. Different water saving
rice cropping methods have been de-
veloped, but their broader ecologic and
socio-economic outcomes remain un-
clear. Therefore, the present study re-
views the scientific literature and com-
piles findings that contribute to fill the
knowledge gap on input use and envi-
ronmental and socio-economic out-
comes of selected water saving rice
cropping systems.
0Abstract
7
Research results show a broad range of possible water sav-ings and conflicting figures on changes in water use ef-ficiency. Results appear to be site specific and affected by seasonal variation. The existence and control of irrigation systems in terms of irrigation amount and timing by in-dividual farmers is crucial for the success of water saving rice production. Different yield levels (worldwide ranging from less than 1 t/ha to up to 10 t/ha) make generalizations on energy input to output ratios difficult. There seems to be agreement that rice cropping without puddling uses significantly less energy compared to conventional wet soil cultivation and more aerobic conditions will change the mechanization possibilities in rice cultivation. Labor requirements vary largely in different locations (25 to 275 person days for conventionally flooded rice). Different methods for transplanting rice exist some of which are more time consuming than others. The initially increased time for transplanting in the System of Rice Intensifica-tion (SRI) is reported to decrease with more experience. However farmers have labor bottlenecks due to other on farm or off-farm activities. The adoption of water saving technologies seems to change the gender involvement in rice cropping. All rice cropping systems respond positively on the application of mineral fertilizer. Integrated organic and mineral fertilizer applications have a positive effect on soil quality. However, farmers might prefer to apply organic matter to higher value crops. In general, high wa-ter levels effectively control most weeds of rice. Increased weed occurrence is a major problem under aerobic cul-ture. However, no differences in weed biomass compar-ing SRI with recommended management practices are frequently reported. In the absence of mechanical options to control weeds, pesticide applications may significantly affect rice yields under SRI while pesticide applications do not affect conventional yields. However, whether farm-ers resort to pesticide depends on the pesticide price, the availability of sufficient amounts of pesticides in a timely manner and the existence of functioning local financial
markets to provide credit. Grain yields under different rice cropping systems vary largely due to site specific condi-tions and different cultivars. In general, results show that the same yield can be achieved with less seed and less wa-ter and that SRI, Alternate Wetting and Drying (AWD), and other improved methods outperform farmers’ practices. Ammonia volatilization is affected by climatic conditions, type of nitrogen fertilizer application, and field water management. Experiments show that the type of N ferti-lizer dominates ammonia volatilization compared to wa-ter depth. Also water depth has no significant influence on total N loss from the rice field. Repeated wetting and drying increases soil pore volume, and repeated applica-tion of organic matter, as practiced in SRI, increases total soil C and N contents, and soil microbial biomass, hence improving soil quality. Farmers’ top most constraints for adopting water saving technologies are (1) difficulties in land leveling, (2) difficulties in water control and manage-ment, and (3) shortages in labor availability. Farmers have no incentive to save water where irrigation water and electricity for pumping water are available free of charge. Economic impacts of SRI adoption are very context spe-cific and depend on micro-level socioeconomic and agro-ecological conditions.
It can be concluded that circumstances affecting the re-quired inputs and outcomes that can be expected under different water saving technologies are complex and highly site specific. The judgment on the overall perfor-mance of a water saving technology depends on the cho-sen reference base. Adapting suitable agronomic practices to local conditions in collaboration with farmers proved to be the most successful option for improving rice crop-ping in terms of yields, water savings and other input use. Breeding for early vigor and shorter growth duration can produce cultivars that perform better under water saving technologies. The development or adaptation of mechani-cal weeding devices would help resolve the increased weed infestation in more aerobic rice systems.
Comparison of different rice cropping systems on their resource use and socio-economic and environmental impacts88
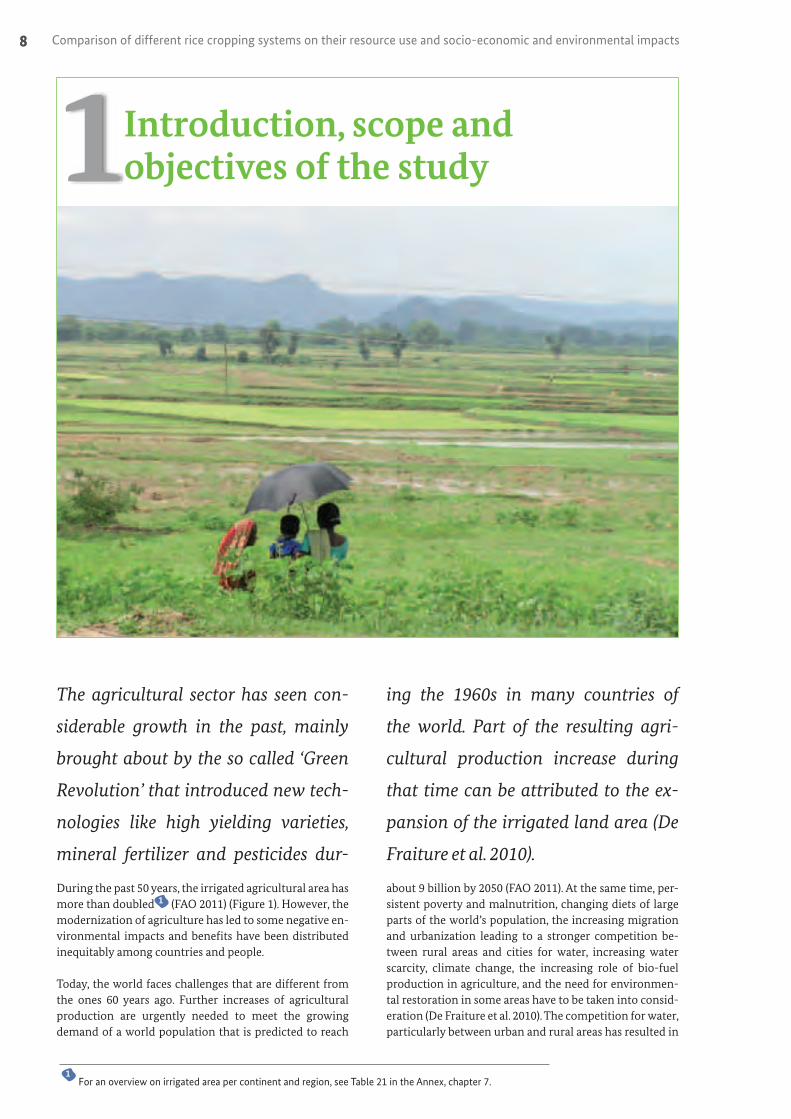
The agricultural sector has seen con-
siderable growth in the past, mainly
brought about by the so called ‘Green
Revolution’ that introduced new tech-
nologies like high yielding varieties,
mineral fertilizer and pesticides dur-
ing the 1960s in many countries of
the world. Part of the resulting agri-
cultural production increase during
that time can be attributed to the ex-
pansion of the irrigated land area (De
Fraiture et al. 2010).
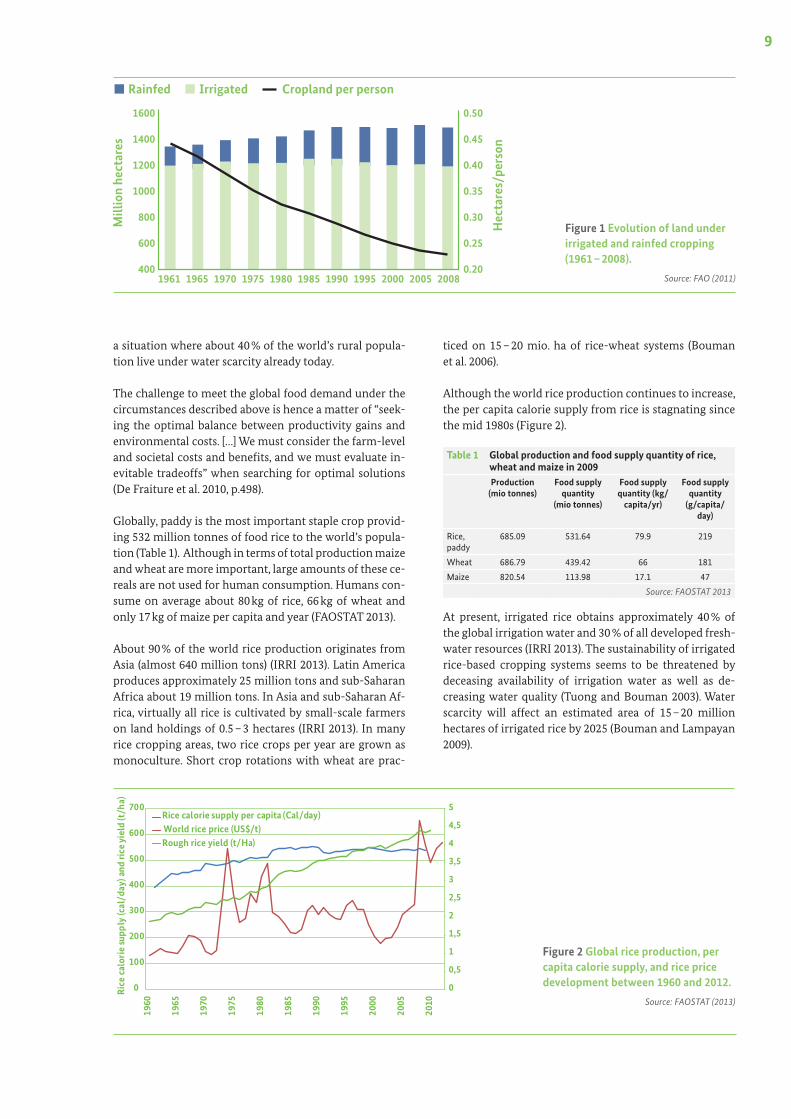
During the past 50 years, the irrigated agricultural area has more than doubled 1 (FAO 2011) (Figure 1). However, the modernization of agriculture has led to some negative en-vironmental impacts and benefits have been distributed inequitably among countries and people.
Today, the world faces challenges that are different from the ones 60 years ago. Further increases of agricultural production are urgently needed to meet the growing demand of a world population that is predicted to reach
about 9 billion by 2050 (FAO 2011). At the same time, per-sistent poverty and malnutrition, changing diets of large parts of the world’s population, the increasing migration and urbanization leading to a stronger competition be-tween rural areas and cities for water, increasing water scarcity, climate change, the increasing role of bio-fuel production in agriculture, and the need for environmen-tal restoration in some areas have to be taken into consid-eration (De Fraiture et al. 2010). The competition for water, particularly between urban and rural areas has resulted in
1
For an overview on irrigated area per continent and region, see Table 21 in the Annex, chapter 7.
1Introduction, scope and objectives of the study
9
a situation where about 40 % of the world’s rural popula-tion live under water scarcity already today.
The challenge to meet the global food demand under the circumstances described above is hence a matter of “seek-ing the optimal balance between productivity gains and environmental costs. […] We must consider the farm-level and societal costs and benefits, and we must evaluate in-evitable tradeoffs” when searching for optimal solutions (De Fraiture et al. 2010, p.498).
Globally, paddy is the most important staple crop provid-ing 532 million tonnes of food rice to the world’s popula-tion (Table 1). Although in terms of total production maize and wheat are more important, large amounts of these ce-reals are not used for human consumption. Humans con-sume on average about 80 kg of rice, 66 kg of wheat and only 17 kg of maize per capita and year (FAOSTAT 2013).
About 90 % of the world rice production originates from Asia (almost 640 million tons) (IRRI 2013). Latin America produces approximately 25 million tons and sub-Saharan Africa about 19 million tons. In Asia and sub-Saharan Af-rica, virtually all rice is cultivated by small-scale farmers on land holdings of 0.5 – 3 hectares (IRRI 2013). In many rice cropping areas, two rice crops per year are grown as monoculture. Short crop rotations with wheat are prac-
ticed on 15 – 20 mio. ha of rice-wheat systems (Bouman et al. 2006).
Although the world rice production continues to increase, the per capita calorie supply from rice is stagnating since the mid 1980s (Figure 2).
Table 1 Global production and food supply quantity of rice, wheat and maize in 2009Production
(mio tonnes)Food supply
quantity (mio tonnes)
Food supply quantity (kg/
capita/yr)
Food supply quantity
(g/capita/day)
Rice, paddy
685.09 531.64 79.9 219
Wheat 686.79 439.42 66 181
Maize 820.54 113.98 17.1 47
Source: FAOSTAT 2013
At present, irrigated rice obtains approximately 40 % of the global irrigation water and 30 % of all developed fresh-water resources (IRRI 2013). The sustainability of irrigated rice-based cropping systems seems to be threatened by deceasing availability of irrigation water as well as de-creasing water quality (Tuong and Bouman 2003). Water scarcity will affect an estimated area of 15 – 20 million hectares of irrigated rice by 2025 (Bouman and Lampayan 2009).
0
0,5
1
1,5
2
2,5
3
3,5
4
4,5
5
0
100
200
300
400
500
600
700
1960
1965
1970
1975
1980
1985
1990
1995
2000
2005
2010
Rice
cal
orie
supp
ly (c
al/d
ay) a
nd ri
ce y
ield
(t/h
a)
Rice calorie supply per capita (Cal/day)World rice price (US$/t)Rough rice yield (t/Ha)
Figure 1 Evolution of land under irrigated and rainfed cropping (1961 – 2008).
Source: FAO (2011)
Rainfed
1961 1965 19851975 1995 20051970 19901980 2000 2008
1600
1400
1200
1000
800
600
400
0.50
0.45
0.40
0.35
0.30
0.25
0.20
Mill
ion
hect
ares
Hec
tare
s/pe
rson
Irrigated Cropland per person
Figure 2 Global rice production, per capita calorie supply, and rice price development between 1960 and 2012.
Source: FAOSTAT (2013)

Comparison of different rice cropping systems on their resource use and socio-economic and environmental impacts10
Different methods of rice crop cultivation that can help reduce the water used for cultivation have been devel-oped like the System of Rice Intensification (SRI), Alter-nate Wetting and Drying (AWD), dry seeded rice or aerobic rice. However, the broader ecologic and socio-economic effects of these water saving technologies remain un-clear. How do water saving technologies affect ammonia volatilization? What are the fertilizer requirements? More weeds will occur in more aerobic systems. Will farmers respond to this by increasing herbicide applications or through increased mechanization (energy requirements) or manual weeding (labor requirement)? How time con-suming are water saving technologies for planting and weeding? What is the impact on the environment (eco-system services)? Under which topographic, climatic and soil conditions can water be saved successfully? And what type of farmer can benefit from water saving technologies (small-scale or larger scale commercial)?
The present study therefore reviews the available scien-tific literature and compiles findings that contribute to fill the knowledge gap on input use and environmental and socio-economic outcomes of selected rice cropping systems. Since almost all rice production in Sub-Saharan Africa and Asia originates from small-scale farms, the present review focuses on effects within these farming systems.
Conclusions will be drawn and recommendations will be formulated in view of future development initiatives on rice production.

11
Rice is produced in a large diversity of
agroecological systems. Conen et al.
(2010) (Conen et al. 2010) classify the
world’s rice cropping systems accord-
ing to the ecosystems in which they are
implemented and according to their
flooding patterns (Figure 3).
2 Rice production and different rice cropping systems
Flooding Pattern
Ecosystem
Rice Production
Lowland
Irrigated
(fully or partically controlled)
Continuously Intermittend
Rainfed
Regular Drought Prone
Deepwater/ Flood Prone Upland
Rainfed
Figure 3 Classification of the world’s rice cropping systems.
Source: adapted from Conen et al. (2010); Bouman et al. (2006)
Comparison of different rice cropping systems on their resource use and socio-economic and environmental impacts12
Irrigated lowlands occupy 79 million hectares (mio ha) worldwide and account for 75 % of the world rice produc-tion. Irrigated lowland cultivation is the most important rice cropping system for food security (IRRI 2013). Global rice yields range from less that 1 t per hectare (t/ha) from poor rainfed cropping systems to as much as 10 t/ha from irrigated and intensive temperate region rice cultivation (IRRI 2013). The world average of yields from irrigated lowlands is 5.4 t/ha, in Asia alone the average yield is between 3 and 9 t/ha (Table 2) (Bouman et al. 2007; IRRI 2013). For a detailed characterization of the different rice cropping systems, see Bouman et al. (2007).
The following paragraphs give an introduction to the ag-ronomic principles of conventional irrigated lowland rice cultivation, the System of Rice Intensification, Alternate Wetting and Drying, and aerobic rice systems. Other wa-ter saving practices include flush irrigation (the crop is irrigated when leaves start to roll) and raised bed cultiva-tion (the crop is irrigated when the water in the furrows between raised beds has disappeared) (Belder et al. 2005).
Table 2 World rice productionAgro environment
World area coverage (mio ha)
World average rice yield (t/ha)
World rice production (%)
Irrigated lowlands 79 5.4 75
Rainfed lowlands 54 2.3 19
Rainfed uplands 14 1 4
Flooded area 11 1.5 No data available
Source: Bouman et al. (2007); IRRI (2013)
Xu et al. (2012) give an overview of other irrigation prac-tices that increase water use efficiency. They are non-flooding controlled irrigation, saturated soil culture, and ground cover systems. However, the latter mentioned ir-rigation techniques will not be considered in this study. Also, this study does not discuss differences between the systems of traditionally grown rice with full or partial wa-ter control, floating rice or recession cultivation.
2.1. Conventional irrigated lowland rice cultivation 2
Traditionally, irrigated lowland rice is grown in bunded fields that are flooded for most of the cropping cycle. Land preparation mainly consists of tillage, the so called pud-dling and land leveling. Puddling destroys the soil struc-ture under saturated soil moisture conditions and creates an impermeable soil layer, the so called hard pan that helps reducing water losses through percolation. Puddling helps weed control, land leveling and transplanting (Bou-man et al. 2006). Land leveling assures an even distribution of irrigation water to all parts of the field and saves the amount of irrigation water required to achieve this. Rice can either be transplanted into the field or directly seeded. Transplanting is the most common crop establishment
technique. Seedlings are grown in a nursery for 20 to 80 days before they are relocated into the flooded field ei-ther manually or mechanically. Rice is a crop that thrives well in flooded ecosystems where other terrestrial plants cannot survive. Through this adaptation to unaerobic soil conditions, it is very sensitive to water shortages result-ing in symptoms of water stress when soil water content drops below saturation. Therefore, farmers usually main-tain their rice field flooded with a water layer of 5 – 10 cm during the cropping cycle until several days before har-vesting (Bouman et al. 2006). Typical daily rates of water input throughout the cropping season in tropical lowland rice production are shown in Table 22 in the Annex.
2.2. System of Rice Intensification (SRI)
The System of Rice Intensification (SRI) originally called ‘Système de Riziculture Intensive’ was developed in Mad-agascar by de Laulanié in the 1980s. SRI is a rice cropping system that is commonly based on six principles and as-sociated practices: 1) start with young seedlings (at the 2-3 leaf stage) (although direct-seeding is also possible), 2) avoid trauma to the roots (gentle removal from seed beds, quick transplanting within 15 – 30 minutes, shal-low planting and taking care not to invert the root tips), 3) reduce plant density (plant single plants per hill at 25x25 cm depending on soil quality (wider in high quality soils), square planting), 4) avoid continuous flooding (giving just enough water on a regular basis with dry intervals, main-tain mainly moist but aerobic soil conditions), 5) actively aerate the soil (regular weed control, enhance nutrient mobilization), and 6) enhance soil organic matter (‘feed the soil, and let the soil feed the plant’) (Kassam and Up-hoff 2012). The formulation of principles and practices dif-fers in various sources, with some authors merging some of the above mentioned practices resulting in only four or five practices. Some sources state three to five principles (e.g. Dobermann 2004; SRI-Rice 2012b) from which prac-tices can be derived owing to that fact that SRI is not a standard package of practices (Zhao et al. 2010a). Recom-mendations can be adapted by farmers to suit the local conditions of their soil, water, fertilizer and manure as well as labor availability. For example, Uphoff (2007) (Up-hoff 2007) suggests that compost application is optional.
The SRI methodology aims to provide optimal growth conditions to individual rice plants, thereby maximiz-ing tillering and shortening the phyllochrons “which is believed to accelerate growth rates” (Nemoto et al. 1995, cited in Bouman 2004). The main objective of SRI is to achieve higher factor productivity from land, labor, capi-tal and water used in rice production rather than to maxi-mize rice yields (Uphoff et al. 2002). Initially, de Laulanié developed SRI for irrigated rice cultivation but nowadays its principles are adapted to rice under rainfed conditions as well as to other crops 3 .
2 If not otherwise mentioned, paragraph 2.1 draws on IRRI (2013), available at http://www.irri.org/index.php?option=com_k2&view=item&layout=item&id=9151&lang=en.
3 Other crops include wheat, sugar cane, teff, finger millet, maize, pulses, and vegetables. The system can then be referred to as System of Crop Intensification (SCI) (SRI-Rice 2012a).

13
Many reports show higher yields from SRI fields compared to traditional cultivation methods in many locations, and additional benefits like water saving, reduction in seed re-quired, reduction in mineral fertilizer, resistance to biotic and abiotic stresses, shorter cropping cycle, higher milling out-turn, reductions in labor requirements and lower production costs (Kassam and Uphoff 2012).
2.3. Alternate wetting and drying
‘Alternately submerged-non-submerged’ (SNS) water re-gime and ‘intermittend irrigation’ are synonyms for alternate wetting and drying (AWD) (Belder et al. 2005, 2007) (Belder et al. 2005). Under the AWD regime, fields are kept flooded during the first ten days after transplanting (DAT). If many weeds are present in the field, the initially flooded period can be extended to 2 – 3 weeks until the weeds are suppressed. Thereafter, the rice crop is irrigated three to five days after the surface has dried up (Belder et al. 2005). A recommended way to decide on the right moment when to re-irrigate the field is by monitoring the field water depth using a field wa-ter tube (for more details, see Bouman & Lampayan 2009). If the water table in the tube drops to 15 cm 4 below the soil surface, the field is irrigated until a water depth of 5 cm above ground. One week before and after flowering, the field should remain flooded. After flowering, during grain filling and ripening, AWD can be practiced again. Just before pani-cle initiation a non-irrigated period of ten to twelve days is recommended (Belder et al. 2005).
2.4. Aerobic rice systems
Aerobic rice is cultivated just as other upland crops. Special aerobic rice cultivars are grown under aerobic (non-sub-merged and non-saturated) soil conditions with supple-mental irrigation if rainfall is insufficient. Irrigation is usually applied when leaves start to roll. This system is suitable in areas where water is too scarce to allow submerged or inter-mittently submerged soil conditions.
4 The threshold of 15 cm is the safe upper limit. Following this safe recommendation, water savings of 15 – 30 % can be achieved. Once confident that AWD does not lead to yield losses, farmers are encouraged to experiment with deeper water levels of 20, 25, 30 cm or deeper in order to increase and optimize water savings, especially when water prices are high or water is very scarce (Bouman and Lampayan 2009).
2 Rice production and different rice cropping systems
Comparison of different rice cropping systems on their resource use and socio-economic and environmental impacts14
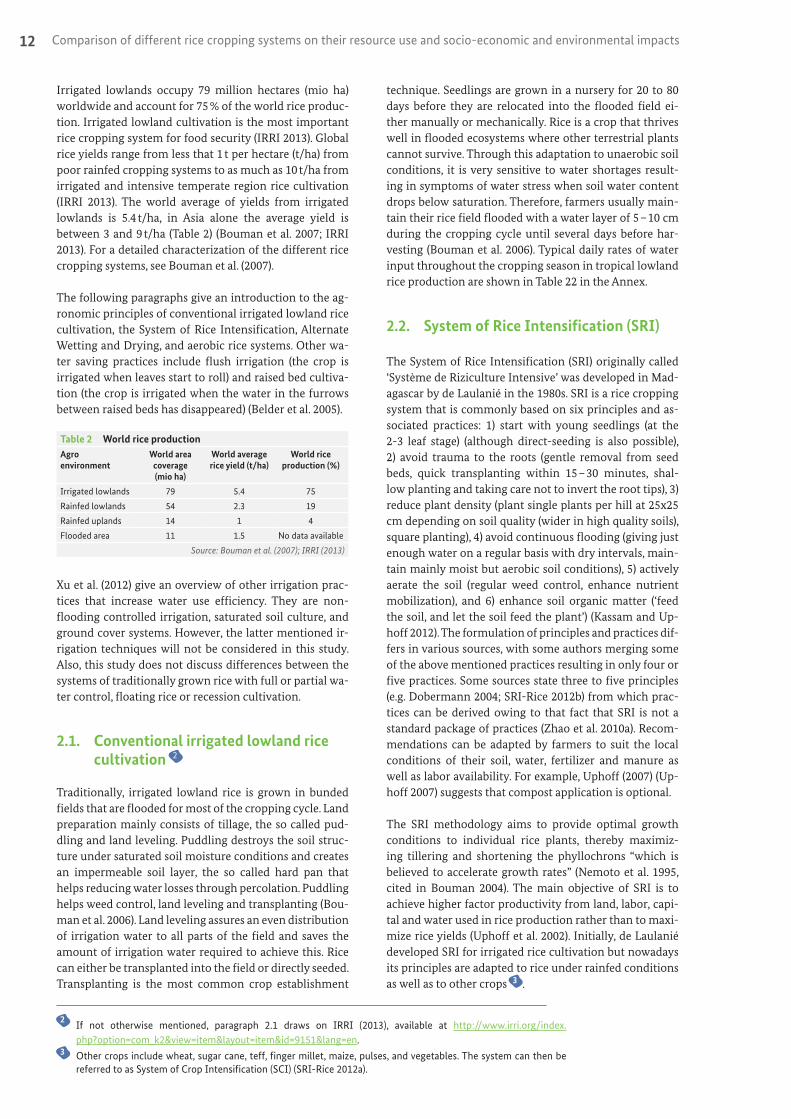
The present study tempts an assess-
ment of the rice cropping systems de-
scribed above in terms of their input
use and outputs manifested as yields
as well as environmental and socio-
economic impacts.
The comparison of different studies on rice cropping sys-tems published in the scientific literature is difficult be-cause of largely different conditions (climatic, soil) and research methodologies (Dobermann 2004). Where ap-propriate and meaningful, relative data (in percent) was calculated in relation to the reference base for this data,
comparable to Bouman and Tuong (2000). However, the agronomic, financial, energy, and environmental costs and benefits are complex and would require systems modeling to develop an understanding of alternative ap-proaches (Keen et al. 2012), which is beyond the scope of this study.
3Comparison of different rice cropping systems

15
3.1. Water
The amount of water used for irrigation in lowland rice varies according to the type of soil. On heavy clay soils that have a shallow groundwater table (20 – 50 cm) and that supply water to the crop by capillary raise, the water inputs for crop growth are only 400 mm. Soils with a coarse texture (loamy and sandy) and with deep groundwater tables (1.5 m or more) require more than 2,000 mm for the rice crop (Bouman and Tuong 2001, cited in Bouman et al. 2007, p. 9). Bouman et al. (2007) indicate 1300 – 1500 mm as the typical average irriga-
tion water input for irrigated rice in Asia. Not all of this water is used by the rice plant. Water flows from the field include evaporation, transpiration, lateral see- page 5 and percolation 6 , 7 and possible overbund flows (runoff) (Bouman and Tuong, 2000) (Figure 4). Only transpiration is a ‘productive’ water flow while all other water flows are nonproductive for the rice crop. Runoff, seepage and percolation account for 25 % – 50 % of all wa-ter input in heavy soils with shallow groundwater tables and for 50 % – 85 % in coarsely textured soils with deep groundwater tables (Bouman et al. 2007)
Water productivity can be indicated in different forms: 1) as amount of grain per transpired amount of water, 2) as amount of grain per amount of evapotranspired wa-ter or 3) as amount of grain per amount of input water used (Bouman et al. 2007). Water use can be defined as 1) total amount of water from irrigation and rainfall or 2) as evapotranspiration (ET) (Belder et al. 2005). Water use ef-ficiency is usually used synonymously to water productiv-ity.
To estimate water productivity of rice one has to decide at what scale water losses should be taken into account. Water that percolates from the field level to the ground-water or flows to lower lying fields through seepage and overbund flow can be reused further downstream and is hence not really lost. However, 1) percolation, seepage and overbund flow water is lost to the farmer and 2) the recuperation of water further downstream is still linked with costs for some form of energy for pumping. Taking the viewpoint of either field level or larger irrigation sys-tem level, water productivity calculations will differ with smaller water productivity at field level and higher water productivity at larger scale level (Table 3). For typical daily water flows from lowland rice, see Table 22 in chapter 7.
Table 3 Water productivity (g rice/kg water) in respect of evapotranspiration (WPET), irrigation (WPI) and total water input (WPIP) at different scales
Area (ha) WPET WPI WPIPLocation Source
30 – 50 0.5 – 0.6 1 – 1.5 0.25 – 0.27 Muda irrigarion system, Kendal, Malaysia
Cabangon et al. (2002)
287 – 606 1 – 1.7 0.4 – 1 – Zhanghe irrigation system, Hunan, China
Dong Bin et al. (2001)
Over 105 – 1 – 2.5 0.5 – 1.3
Source: Tuong and Bouman (2003)
3.1.1. Water use and water productivity
Water savings can be achieved without yield penalties by reducing the losses to nonproductive outflows, in particu-lar to seepage and percolation (Bouman et al. 2007).
Comparing flooding irrigation with non-flooding con-trolled irrigation (similar to AWD), Xu et al. (2012) find a 57.4 % to 63.7 % reduction in irrigation water input under the latter, depending on the type of fertilizer regime used (Table 4, compare also chapter 3.4 on fertilizer use).
Figure 4 Water balance of irrigated (paddy) rice field
Note: C, capillary raise; E, evaporation; I, irrigation; O, overbund flow; P, percolation, R, rainfall; S, seepage; T, transpiration
Source: Bouman et al. (2006)
5 Seepage is the flow of water through bordering bunds.6 Percolation is the flow of water downwards to soil levels below the root zone.7 ‘Typical combined values for seepage and percolation vary from 1 – 5 mm/day in heavy clay soils to 25 – 30 mm/day
in sandy and sandy loam soils’ (Bouman and Tuong, 2001; cited in Bouman et al. 2006 .

Comparison of different rice cropping systems on their resource use and socio-economic and environmental impacts16
Table 4 Water use and percolation losses (in mm) of paddy rice (Japonica variety Jia33) with different water and nitrogen managements (2008)
Irrigation type Nitrogen management type IR ER WC ET PL
Flooding irrigation Farmers practice (total 403.3 kg N/ha) 878.0 a 346.2 a 1224.2 a 632.0 a 592.2
Site specific nutrient management (total 162.0 kg N/ha) 855.2 a 368.3 a 1223.5 a 610.6 a 612.9
Controlled released nitrogen (total 180.0 kg N/ha) 771.2 a 366.3 a 1137.5 a 593.6 a 543.9
Non-flooding controlled irrigation
Farmers practice (total 403.3 kg N/ha) 318.5 b 377.2 a 695.7 b 466.8 b 228.9
Site specific nutrient management (total 162.0 kg N/ha) 315.0 b 383.3 a 698.3 b 478.6 b 219.7
Controlled released nitrogen (total 180.0 kg N/ha) 328.2 b 395.3 a 723.5 b 490.1 b 233.4
Change in % Farmers practice (total 403.3 kg N/ha) -63.7 -43.2 -61.3
Site specific nutrient management (total 162.0 kg N/ha) -63.2 -42.9 -64.2
Controlled released nitrogen (total 180.0 kg N/ha) -57.4 -36.4 -57.1
Note: IR: irrigation water, ER: effective rainfall, WC: water consumption, ET: evapotranspiration, PL: Percolation losses. Within a column, means followed by a different letter are significantly different at 0.05 probability (Tamhane test).
Source: adapted from Xu et al. (2012)
Percolation losses 8 from a non-flooded controlled irri-gated paddy field in China were less than half of the losses incurred through percolation in a flooded paddy field. This was confirmed by increased N contents in the top soil until 60 cm of depth after harvest in the non-flooded fields compared to flooded fields (Xu et al. 2012). Water use efficiency (WUE) was
significantly larger under non-flooding controlled ir-rigation compared to flooding irrigation (Table 5). Xu et al. (2012) found a significant interaction effect between nitrogen and irrigation management indicating that fer-tilization affects water use efficiency differently under dif-ferent irrigation (Xu et al. 2012).
Table 5 Water use efficiency (WUE, in kg/m3) of paddy rice (Japonica variety Jia33) with different water and nitrogen managements (2008)
Irrigation type Nitrogen management type WUEI WUEET WUEWC
Flooding irrigation Farmers practice (total 403.3 kg N/ha) 0.815 a 1.133 a 0.585 a
Site specific nutrient management (total 162.0 kg N/ha) 0.812 a 1.138 a 0.568 a
Controlled released nitrogen (total 180.0 kg N/ha) 0.911 b 1.184 a 0.618 a
Non-flooding controlled irrigation
Farmers practice (total 403.3 kg N/ha) 2.185 c 1.491 b 1.000 b
Site specific nutrient management (total 162.0 kg N/ha) 2.101 c 1.383 c 0.948 b
Controlled released nitrogen (total 180.0 kg N/ha) 2.053 c 1.375 c 0.932 b
Note: WUEI: water use efficiency with respect to irrigation water, WUEET: water use efficiency with respect to evapotranspiration water, WUEWC: water use ef-ficiency with respect to total water consumed. Within a column, means followed by a different letter are significantly different at 0.05 probability (Tamhane test).
Source: Xu et al. (2012)
Zhao et al. (2010a) report a 57 % reduction in irrigation wa-ter use and a 91 % increase in water use efficiency for SRI plots compared to conventional flooded rice.
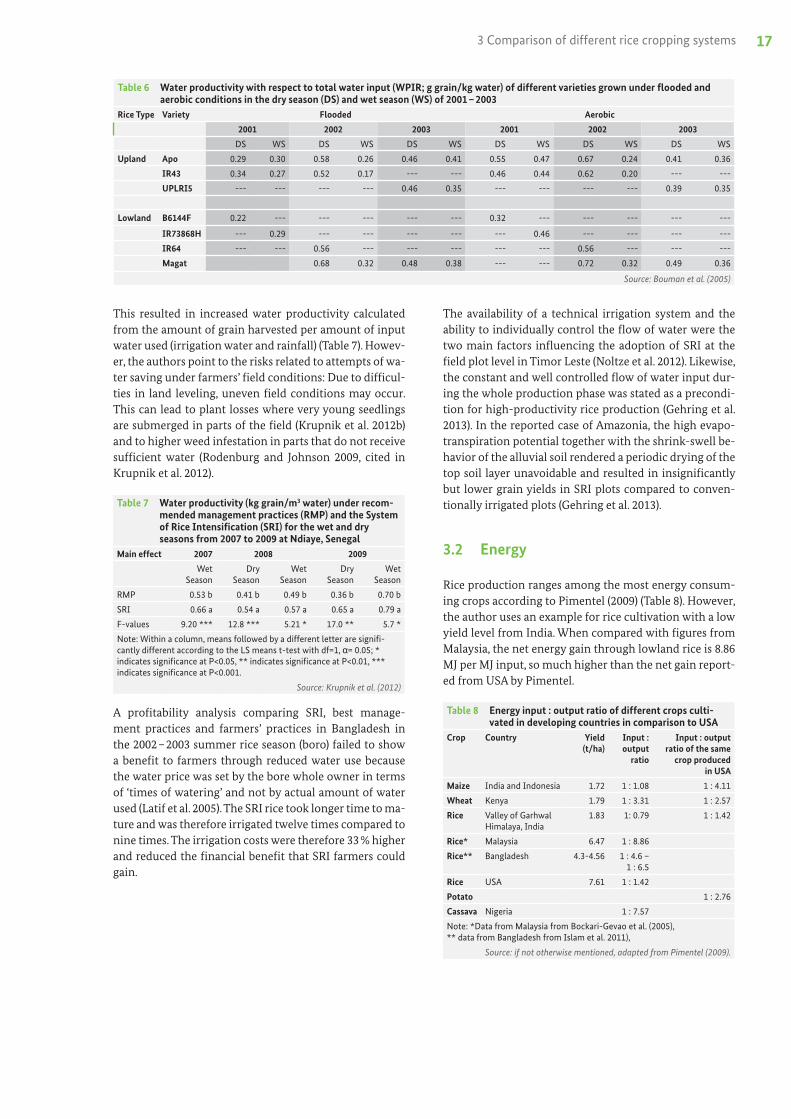
Table 6 presents water use efficiencies for three upland and four lowland rice varieties under flooded and aerobic cropping conditions.
Krupnik et al. (2012) recorded water savings between 16 % and 48 % in a five season field experiment in the Sen-egal comparing SRI with the recommended management practices. The least water savings were realized in a rainy season that was relatively rich in rainfall (16 %). Larger savings were realized during the dry seasons (25 % in 2008 and 48 % in 2009).
8 Percolation losses (PL) were calculated as water consumption (WC) minus evapotranspiration (ET): PL = WC – ET.
17
Table 6 Water productivity with respect to total water input (WPIR; g grain/kg water) of different varieties grown under flooded and aerobic conditions in the dry season (DS) and wet season (WS) of 2001 – 2003
Rice Type Variety Flooded Aerobic
2001 2002 2003 2001 2002 2003
DS WS DS WS DS WS DS WS DS WS DS WS
Upland Apo 0.29 0.30 0.58 0.26 0.46 0.41 0.55 0.47 0.67 0.24 0.41 0.36
IR43 0.34 0.27 0.52 0.17 --- --- 0.46 0.44 0.62 0.20 --- ---
UPLRI5 --- --- --- --- 0.46 0.35 --- --- --- --- 0.39 0.35
Lowland B6144F 0.22 --- --- --- --- --- 0.32 --- --- --- --- ---
IR73868H --- 0.29 --- --- --- --- --- 0.46 --- --- --- ---
IR64 --- --- 0.56 --- --- --- --- --- 0.56 --- --- ---
Magat 0.68 0.32 0.48 0.38 --- --- 0.72 0.32 0.49 0.36
Source: Bouman et al. (2005)
This resulted in increased water productivity calculated from the amount of grain harvested per amount of input water used (irrigation water and rainfall) (Table 7). Howev-er, the authors point to the risks related to attempts of wa-ter saving under farmers’ field conditions: Due to difficul-ties in land leveling, uneven field conditions may occur. This can lead to plant losses where very young seedlings are submerged in parts of the field (Krupnik et al. 2012b) and to higher weed infestation in parts that do not receive sufficient water (Rodenburg and Johnson 2009, cited in Krupnik et al. 2012).
Table 7 Water productivity (kg grain/m3 water) under recom-mended management practices (RMP) and the System of Rice Intensification (SRI) for the wet and dry seasons from 2007 to 2009 at Ndiaye, Senegal
Main effect 2007 2008 2009
Wet Season
Dry Season
Wet Season
Dry Season
Wet Season
RMP 0.53 b 0.41 b 0.49 b 0.36 b 0.70 b
SRI 0.66 a 0.54 a 0.57 a 0.65 a 0.79 a
F-values 9.20 *** 12.8 *** 5.21 * 17.0 ** 5.7 *
Note: Within a column, means followed by a different letter are signifi-cantly different according to the LS means t-test with df=1, α= 0.05; * indicates significance at P<0.05, ** indicates significance at P<0.01, *** indicates significance at P<0.001.
Source: Krupnik et al. (2012)
A profitability analysis comparing SRI, best manage-ment practices and farmers’ practices in Bangladesh in the 2002 – 2003 summer rice season (boro) failed to show a benefit to farmers through reduced water use because the water price was set by the bore whole owner in terms of ‘times of watering’ and not by actual amount of water used (Latif et al. 2005). The SRI rice took longer time to ma-ture and was therefore irrigated twelve times compared to nine times. The irrigation costs were therefore 33 % higher and reduced the financial benefit that SRI farmers could gain.
The availability of a technical irrigation system and the ability to individually control the flow of water were the two main factors influencing the adoption of SRI at the field plot level in Timor Leste (Noltze et al. 2012). Likewise, the constant and well controlled flow of water input dur-ing the whole production phase was stated as a precondi-tion for high-productivity rice production (Gehring et al. 2013). In the reported case of Amazonia, the high evapo-transpiration potential together with the shrink-swell be-havior of the alluvial soil rendered a periodic drying of the top soil layer unavoidable and resulted in insignificantly but lower grain yields in SRI plots compared to conven-tionally irrigated plots (Gehring et al. 2013).
3.2 Energy
Rice production ranges among the most energy consum-ing crops according to Pimentel (2009) (Table 8). However, the author uses an example for rice cultivation with a low yield level from India. When compared with figures from Malaysia, the net energy gain through lowland rice is 8.86 MJ per MJ input, so much higher than the net gain report-ed from USA by Pimentel.
Table 8 Energy input : output ratio of different crops culti-vated in developing countries in comparison to USA
Crop Country Yield (t/ha)
Input : output
ratio
Input : output ratio of the same
crop produced in USA
Maize India and Indonesia 1.72 1 : 1.08 1 : 4.11
Wheat Kenya 1.79 1 : 3.31 1 : 2.57
Rice Valley of Garhwal Himalaya, India
1.83 1: 0.79 1 : 1.42
Rice* Malaysia 6.47 1 : 8.86
Rice** Bangladesh 4.3-4.56 1 : 4.6 – 1 : 6.5
Rice USA 7.61 1 : 1.42
Potato 1 : 2.76
Cassava Nigeria 1 : 7.57
Note: *Data from Malaysia from Bockari-Gevao et al. (2005), ** data from Bangladesh from Islam et al. 2011),
Source: if not otherwise mentioned, adapted from Pimentel (2009).
3 Comparison of different rice cropping systems
Comparison of different rice cropping systems on their resource use and socio-economic and environmental impacts18
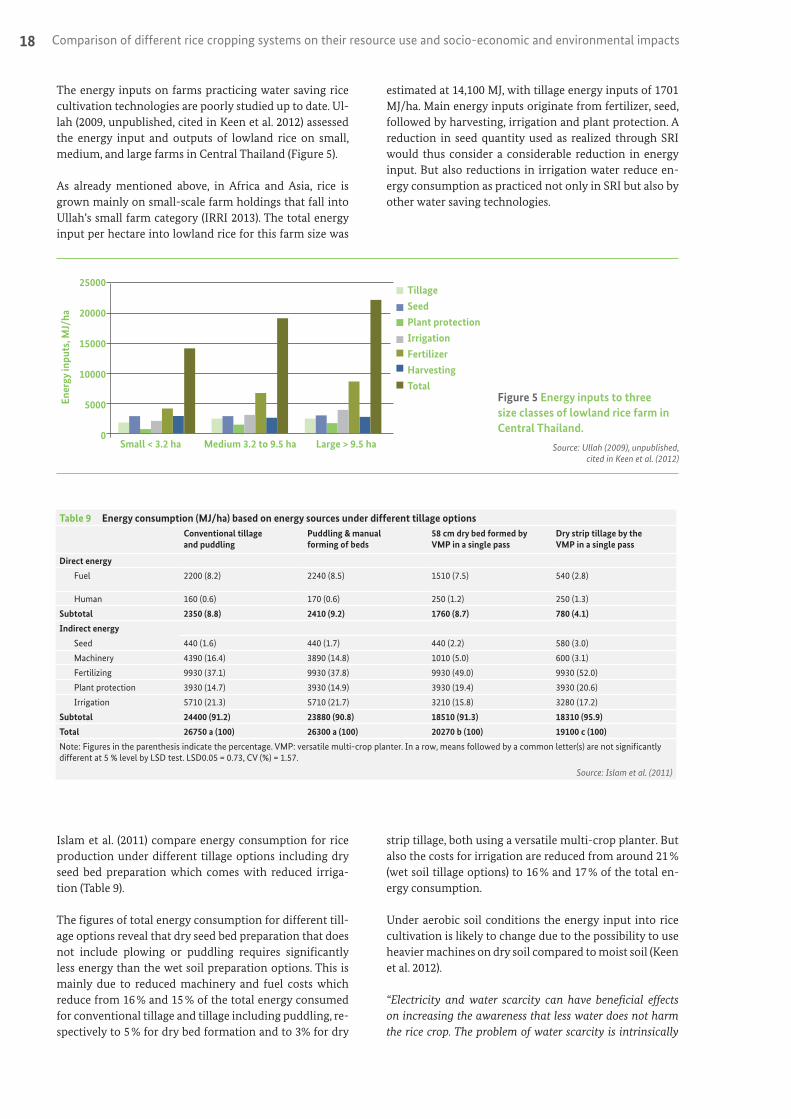
The energy inputs on farms practicing water saving rice cultivation technologies are poorly studied up to date. Ul-lah (2009, unpublished, cited in Keen et al. 2012) assessed the energy input and outputs of lowland rice on small, medium, and large farms in Central Thailand (Figure 5).
As already mentioned above, in Africa and Asia, rice is grown mainly on small-scale farm holdings that fall into Ullah’s small farm category (IRRI 2013). The total energy input per hectare into lowland rice for this farm size was
estimated at 14,100 MJ, with tillage energy inputs of 1701 MJ/ha. Main energy inputs originate from fertilizer, seed, followed by harvesting, irrigation and plant protection. A reduction in seed quantity used as realized through SRI would thus consider a considerable reduction in energy input. But also reductions in irrigation water reduce en-ergy consumption as practiced not only in SRI but also by other water saving technologies.
Islam et al. (2011) compare energy consumption for rice production under different tillage options including dry seed bed preparation which comes with reduced irriga-tion (Table 9).
The figures of total energy consumption for different till-age options reveal that dry seed bed preparation that does not include plowing or puddling requires significantly less energy than the wet soil preparation options. This is mainly due to reduced machinery and fuel costs which reduce from 16 % and 15 % of the total energy consumed for conventional tillage and tillage including puddling, re-spectively to 5 % for dry bed formation and to 3% for dry
strip tillage, both using a versatile multi-crop planter. But also the costs for irrigation are reduced from around 21 % (wet soil tillage options) to 16 % and 17 % of the total en-ergy consumption.
Under aerobic soil conditions the energy input into rice cultivation is likely to change due to the possibility to use heavier machines on dry soil compared to moist soil (Keen et al. 2012).
“Electricity and water scarcity can have beneficial effects on increasing the awareness that less water does not harm the rice crop. The problem of water scarcity is intrinsically
Table 9 Energy consumption (MJ/ha) based on energy sources under different tillage optionsConventional tillage and puddling
Puddling & manual forming of beds
58 cm dry bed formed by VMP in a single pass
Dry strip tillage by the VMP in a single pass
Direct energy
Fuel 2200 (8.2) 2240 (8.5) 1510 (7.5) 540 (2.8)
Human 160 (0.6) 170 (0.6) 250 (1.2) 250 (1.3)
Subtotal 2350 (8.8) 2410 (9.2) 1760 (8.7) 780 (4.1)
Indirect energy
Seed 440 (1.6) 440 (1.7) 440 (2.2) 580 (3.0)
Machinery 4390 (16.4) 3890 (14.8) 1010 (5.0) 600 (3.1)
Fertilizing 9930 (37.1) 9930 (37.8) 9930 (49.0) 9930 (52.0)
Plant protection 3930 (14.7) 3930 (14.9) 3930 (19.4) 3930 (20.6)
Irrigation 5710 (21.3) 5710 (21.7) 3210 (15.8) 3280 (17.2)
Subtotal 24400 (91.2) 23880 (90.8) 18510 (91.3) 18310 (95.9)
Total 26750 a (100) 26300 a (100) 20270 b (100) 19100 c (100)
Note: Figures in the parenthesis indicate the percentage. VMP: versatile multi-crop planter. In a row, means followed by a common letter(s) are not significantly different at 5 % level by LSD test. LSD0.05 = 0.73, CV (%) = 1.57.
Source: Islam et al. (2011)
Figure 5 Energy inputs to three size classes of lowland rice farm in Central Thailand.
Source: Ullah (2009), unpublished, cited in Keen et al. (2012)
TillageSeedPlant protectionIrrigationFertilizerHarvestingTotal
25000
20000
15000
10000
5000
0
Ener
gy in
puts
, MJ/
ha
Small < 3.2 ha Medium 3.2 to 9.5 ha Large > 9.5 ha

19
linked to the chronically deficient electricity supply. It really depends on the regions” (Zeiske, personal comment 2013).
“Bottlenecks in power supply therefore form a central obsta-cle for farmers in obtaining irrigation water in time. It is of-ten believed that solving the energy problem will automati-cally lead to solving the water problem as well. It appears that farmers and some extension officers do not necessarily relate water scarcity to an overexploitation of groundwater resources” (Zeiske, personal comment 2013).
3.3 Labor requirement and gender aspects
It is generally reported that transplanting and weeding is more time consuming under SRI compared with other rice cropping systems (Uphoff and Fernandes 2002; Mishra et
al. 2006; Moser and Barrett 2003; Senthilkumar et al. 2008). However, different techniques exist to assist in line trans-planting, notably a rope stretched across the field and a simple wooden rake that scores the field surface with lines. The former technique is more time consuming than the rake (Uphoff and Fernandes 2002). The time consumed for seedling preparation and transplanting can be reduced by using seedling trays with individual seed holes (Ceesay et al. 2006). However, Ceesay et al. (2006) do not report the additional investment needed for these seed trays. Table 10 summarizes labor requirements reported in the litera-ture. The figures reveal a large span of time spent for rice cultivation under farmers practice in different countries, reaching from 25 days in Brazil to a total (men and women labor) of 274.5 days in India. Women in the Indian exam-ple provided by Senthilkumar et al. (2008) spent more than four times more days in rice cultivation than men.
Table 10 Labor requirements reported in the literature for different rice cropping systems (in ps-d/ha)Source Country Type of work considered DSP FP FAP BMP/RMP SRI
Gehring et al. 2013 Brazil Seedling production and transplanting 1 25 50
Uphoff and Fernandes 2002 Madagascar Hand weeding 20 – 25
Manual push weeder 1 - 5
Noltze et al. 2013 Timor Leste Total labor 201.75 209.11
Krupnik et al. 2012b The Senegal Total labor requirement in 2008 85.2 105.2 103.7 122.2
Total labor requirement in 2009 95.6 98.7 102.0 148.9
Senthilkumar et al. 2008 India Labor requirement of men 52 85.5
Labor requirement of women 222.5 167.5
Total labor requirement 274.5 253
Note: ps-d: person days; DSP: direct seeding practice, FP: Farmers’ practice, FAP: Farmer Adapted Practice, BMP: Best Management Practice, RMP: Recommended Management Practice, SRI: System of Rice Intensification
The changes in required labor comparing different modi-fied rice cropping systems with their reference base do not allow formulating general conclusions. Comparing SRI with famers’ practice leads to changes in labor be-tween reductions of about 8 % to increases up to 100 % of
time (Table 11). The case presented by Krupnik et al. (2012) further reveals that time requirements for rice cropping are highly season specific: a comparison of SRI with best management practices on labor requirements showed an increase of 18 % in 2008 but an increase of 46 % in 2009.
Table 11 Change in labor requirements reported in the literature for different rice cropping systems (in %)Based on: Source Country Type of work considered SRI vs. FP SRI vs. BMP FAP vs. FP
Gehring et al. 2013 Brazil Seedling production and transplanting 100
Noltze et al. 2013 Timor Leste Total labor 3.6
Krupnik et al. 2012b The Senegal Total labor requirement in 2008 43.4 17.8 23.5
Total labor requirement in 2009 55.8 46.0 3.2
Senthilkumar et al. 2008 India Labor requirement of men 64.4
Labor requirement of women -24.7
Total labor requirement -7.8
Note: ps-d: person days; DSP: direct seeding practice, FP: Farmers’ practice, FAP: Farmer Adapted Practice, BMP: Best Management Practice, RMP: Recommended Management Practice, SRI: System of Rice Intensification
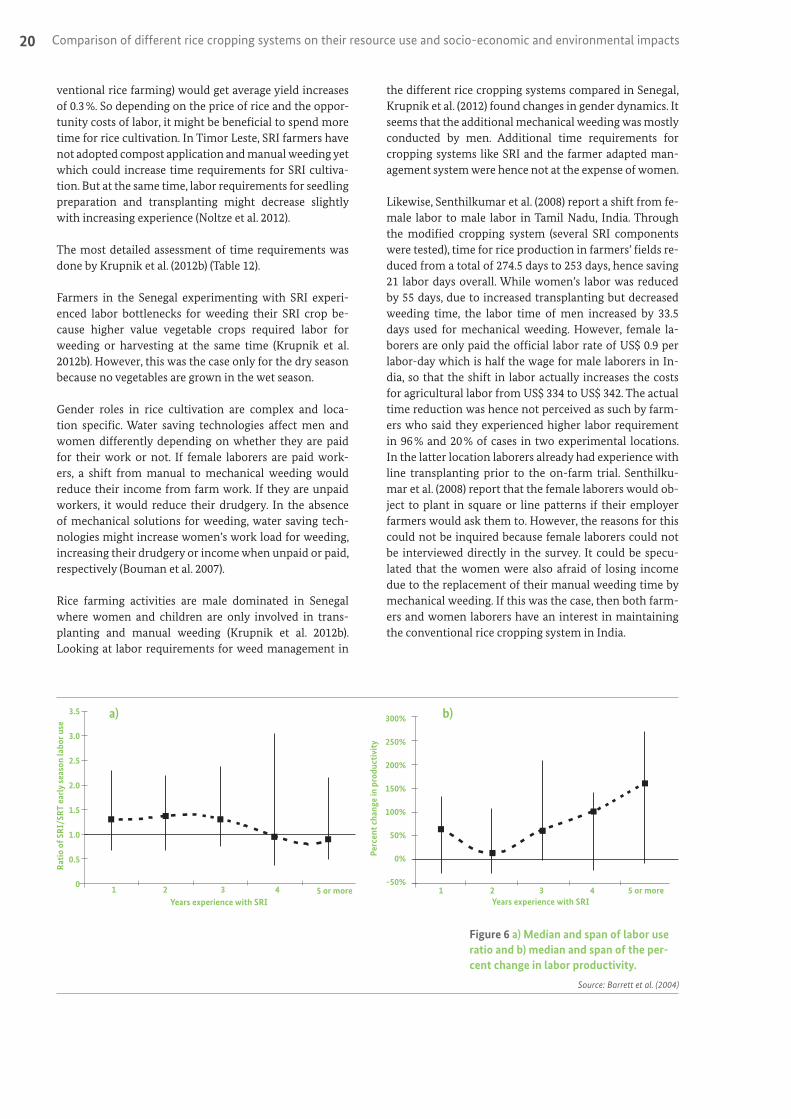
Long term measurements of time requirements over several seasons would hence be helpful to produce more reliable mean changes in time requirements. Moreover, long term measurements would provide more reliable information because farmers might become quicker in planting seedlings in modified patterns after several sea-sons. Barrett et al. (2004) report that time requirements for transplanting and early season weeding was increased during the first three years after adoption but was reduced from the fifth year onwards (Figure 6).
Farmers had to invest more time initially to learn the skills needed for handling young seedlings and planting single
seedlings per hill in line or square patterns. Over the same time period, labor productivity was found to initially de-cline and then to increase from the third to the fifth year.
According to Uphoff and Fernandes (2002), women trans-planting SRI seedlings in Sri Lanka felt more comfortable transplanting the lighter and fewer seedlings and reported that it was quicker.
Results from farm survey data from Timor Leste show that labor has the largest production elasticity. This means that a farmer who would invest 1 % more time into rice farming (irrespective of whether she practices SRI or con-
3 Comparison of different rice cropping systems
Comparison of different rice cropping systems on their resource use and socio-economic and environmental impacts20
ventional rice farming) would get average yield increases of 0.3 %. So depending on the price of rice and the oppor-tunity costs of labor, it might be beneficial to spend more time for rice cultivation. In Timor Leste, SRI farmers have not adopted compost application and manual weeding yet which could increase time requirements for SRI cultiva-tion. But at the same time, labor requirements for seedling preparation and transplanting might decrease slightly with increasing experience (Noltze et al. 2012).
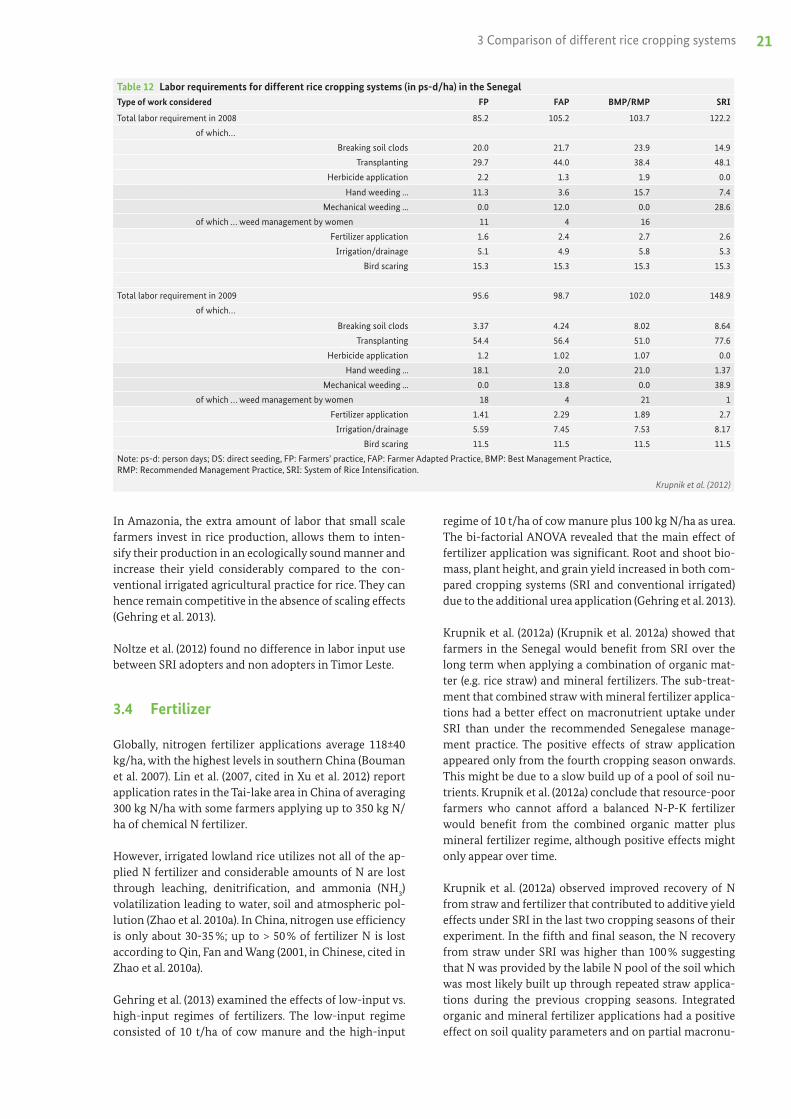
The most detailed assessment of time requirements was done by Krupnik et al. (2012b) (Table 12).
Farmers in the Senegal experimenting with SRI experi-enced labor bottlenecks for weeding their SRI crop be-cause higher value vegetable crops required labor for weeding or harvesting at the same time (Krupnik et al. 2012b). However, this was the case only for the dry season because no vegetables are grown in the wet season.
Gender roles in rice cultivation are complex and loca-tion specific. Water saving technologies affect men and women differently depending on whether they are paid for their work or not. If female laborers are paid work-ers, a shift from manual to mechanical weeding would reduce their income from farm work. If they are unpaid workers, it would reduce their drudgery. In the absence of mechanical solutions for weeding, water saving tech-nologies might increase women’s work load for weeding, increasing their drudgery or income when unpaid or paid, respectively (Bouman et al. 2007).
Rice farming activities are male dominated in Senegal where women and children are only involved in trans-planting and manual weeding (Krupnik et al. 2012b). Looking at labor requirements for weed management in
the different rice cropping systems compared in Senegal, Krupnik et al. (2012) found changes in gender dynamics. It seems that the additional mechanical weeding was mostly conducted by men. Additional time requirements for cropping systems like SRI and the farmer adapted man-agement system were hence not at the expense of women.
Likewise, Senthilkumar et al. (2008) report a shift from fe-male labor to male labor in Tamil Nadu, India. Through the modified cropping system (several SRI components were tested), time for rice production in farmers’ fields re-duced from a total of 274.5 days to 253 days, hence saving 21 labor days overall. While women’s labor was reduced by 55 days, due to increased transplanting but decreased weeding time, the labor time of men increased by 33.5 days used for mechanical weeding. However, female la-borers are only paid the official labor rate of US$ 0.9 per labor-day which is half the wage for male laborers in In-dia, so that the shift in labor actually increases the costs for agricultural labor from US$ 334 to US$ 342. The actual time reduction was hence not perceived as such by farm-ers who said they experienced higher labor requirement in 96 % and 20 % of cases in two experimental locations. In the latter location laborers already had experience with line transplanting prior to the on-farm trial. Senthilku-mar et al. (2008) report that the female laborers would ob-ject to plant in square or line patterns if their employer farmers would ask them to. However, the reasons for this could not be inquired because female laborers could not be interviewed directly in the survey. It could be specu-lated that the women were also afraid of losing income due to the replacement of their manual weeding time by mechanical weeding. If this was the case, then both farm-ers and women laborers have an interest in maintaining the conventional rice cropping system in India.
Figure 6 a) Median and span of labor use ratio and b) median and span of the per-cent change in labor productivity.
Source: Barrett et al. (2004)
300%
250%
200%
150%
100%
50%
0%
-50%
Perc
ent c
hang
e in
pro
duct
ivit
y
Years experience with SRI1 2 3 4 5 or more
3.5
3.0
2.5
2.0
1.5
1.0
0.5
0
Rat
io o
f SR
I/SR
T ea
rly
seas
on la
bor u
se
Years experience with SRI1 2 3 4 5 or more
a) b)
21
Table 12 Labor requirements for different rice cropping systems (in ps-d/ha) in the SenegalType of work considered FP FAP BMP/RMP SRI
Total labor requirement in 2008 85.2 105.2 103.7 122.2
of which…
Breaking soil clods 20.0 21.7 23.9 14.9
Transplanting 29.7 44.0 38.4 48.1
Herbicide application 2.2 1.3 1.9 0.0
Hand weeding ... 11.3 3.6 15.7 7.4
Mechanical weeding ... 0.0 12.0 0.0 28.6
of which … weed management by women 11 4 16
Fertilizer application 1.6 2.4 2.7 2.6
Irrigation/drainage 5.1 4.9 5.8 5.3
Bird scaring 15.3 15.3 15.3 15.3
Total labor requirement in 2009 95.6 98.7 102.0 148.9
of which…
Breaking soil clods 3.37 4.24 8.02 8.64
Transplanting 54.4 56.4 51.0 77.6
Herbicide application 1.2 1.02 1.07 0.0
Hand weeding ... 18.1 2.0 21.0 1.37
Mechanical weeding ... 0.0 13.8 0.0 38.9
of which … weed management by women 18 4 21 1
Fertilizer application 1.41 2.29 1.89 2.7
Irrigation/drainage 5.59 7.45 7.53 8.17
Bird scaring 11.5 11.5 11.5 11.5
Note: ps-d: person days; DS: direct seeding, FP: Farmers’ practice, FAP: Farmer Adapted Practice, BMP: Best Management Practice, RMP: Recommended Management Practice, SRI: System of Rice Intensification.
Krupnik et al. (2012)
In Amazonia, the extra amount of labor that small scale farmers invest in rice production, allows them to inten-sify their production in an ecologically sound manner and increase their yield considerably compared to the con-ventional irrigated agricultural practice for rice. They can hence remain competitive in the absence of scaling effects (Gehring et al. 2013).
Noltze et al. (2012) found no difference in labor input use between SRI adopters and non adopters in Timor Leste.
3.4 Fertilizer
Globally, nitrogen fertilizer applications average 118±40 kg/ha, with the highest levels in southern China (Bouman et al. 2007). Lin et al. (2007, cited in Xu et al. 2012) report application rates in the Tai-lake area in China of averaging 300 kg N/ha with some farmers applying up to 350 kg N/ha of chemical N fertilizer.
However, irrigated lowland rice utilizes not all of the ap-plied N fertilizer and considerable amounts of N are lost through leaching, denitrification, and ammonia (NH3) volatilization leading to water, soil and atmospheric pol-lution (Zhao et al. 2010a). In China, nitrogen use efficiency is only about 30-35 %; up to > 50 % of fertilizer N is lost according to Qin, Fan and Wang (2001, in Chinese, cited in Zhao et al. 2010a).
Gehring et al. (2013) examined the effects of low-input vs. high-input regimes of fertilizers. The low-input regime consisted of 10 t/ha of cow manure and the high-input
regime of 10 t/ha of cow manure plus 100 kg N/ha as urea. The bi-factorial ANOVA revealed that the main effect of fertilizer application was significant. Root and shoot bio-mass, plant height, and grain yield increased in both com-pared cropping systems (SRI and conventional irrigated) due to the additional urea application (Gehring et al. 2013).
Krupnik et al. (2012a) (Krupnik et al. 2012a) showed that farmers in the Senegal would benefit from SRI over the long term when applying a combination of organic mat-ter (e.g. rice straw) and mineral fertilizers. The sub-treat-ment that combined straw with mineral fertilizer applica-tions had a better effect on macronutrient uptake under SRI than under the recommended Senegalese manage-ment practice. The positive effects of straw application appeared only from the fourth cropping season onwards. This might be due to a slow build up of a pool of soil nu-trients. Krupnik et al. (2012a) conclude that resource-poor farmers who cannot afford a balanced N-P-K fertilizer would benefit from the combined organic matter plus mineral fertilizer regime, although positive effects might only appear over time.
Krupnik et al. (2012a) observed improved recovery of N from straw and fertilizer that contributed to additive yield effects under SRI in the last two cropping seasons of their experiment. In the fifth and final season, the N recovery from straw under SRI was higher than 100 % suggesting that N was provided by the labile N pool of the soil which was most likely built up through repeated straw applica-tions during the previous cropping seasons. Integrated organic and mineral fertilizer applications had a positive effect on soil quality parameters and on partial macronu-
3 Comparison of different rice cropping systems

Comparison of different rice cropping systems on their resource use and socio-economic and environmental impacts22
trient balances. However, recovery of fertilizer N was not significantly increased under SRI (Krupnik et al. 2012a).
Farmers in the Senegal explained that they preferred to apply the limited organic matter available to higher value crops like vegetables (Krupnik et al. 2012b).
Since fertilizer treatments have direct impacts on yields more details on fertilizer effects under different cropping systems can be found in chapter 3.7 on grain yields.
3.5 Weed occurrence and pesticide use
The type of rice crop management practices (type of crop establishment, water management, mechanical and chemical weed control management) and their interac-tions affect the weed occurrence and species composition in rice fields (Bhagat et al. 1996). Influences and interac-tions are complex and are further complicated by site specificity. In general, a high water level in flooded rice fields is an effective means for controlling weed species. Under flooded conditions, only amphibious or aquatic weeds can survive. However, weed species respond dif-ferently to changing water management. Under flooded conditions, C-3 weeds dominated over C-4 weeds while in saturated soils and under upland conditions, C-4 weeds accounted for 90 % of the dry mass compared to only 10 % under flooded conditions (Tanaka 1976, cited in Bhagat et al. 1996).
Senegalese farmers who participated in a farmer-research-er collaborative field experiment, considered the use of pesticides at high rates used in a recommended manage-ment practice treatment as too costly to adopt it under their circumstances. The recommended dose was 8 l/ha of Propanil and 1 l/ha of 2,4-D compared to 5.2 and 0.8 l/ha of the two pesticides, respectively under farmers’ prac-tice. Reasons they put forward were poorly functioning credit systems and value chains that hampered the timely and consistent availability of large amounts of herbicides (Krupnik et al. 2012b). The farmer adapted management practice that was jointly developed and tested resulted in 40 % and 11 % reduction in herbicide use compared to rec-ommended practices and farmers practices in 2008 and in a 52 % and 34 % reduction, respectively, in 2009.
In 2008, the best weed control was achieved with recom-mended management practice (high levels of pesticide) and farmers adapted practice (combination of weeding and herbicide application) at booting stage (Krupnik et al. 2012b). In 2009, only fields that were operated following farmers’ practice had significantly more weed biomass while all other management practices (SRI, RMP, and FAP) had similar amounts of weed biomass.
Results from farm survey data from Timor Leste show that yield is affected significantly by pesticide applications under SRI while it is not affected under conventional rice management (Noltze et al. 2013). Mechanical weed control
is not always adopted with SRI in Timor Leste although weeds occur more abundantly under non-flooded condi-tions and hence farmers might rely more often on herbi-cides under SRI.
3.6 Farmers’ perceptions, problems and risk adaptation practices
Farmers in the Senegal perceived very young seedlings as less adapted to agronomic stresses and preferred older seedlings for transplanting (Krupnik et al. 2012b). Some of them had experienced seedling mortality under SRI and had to fill the gaps after transplanting. Although linked with higher labor requirements, farmers perceived line planting as advantageous for weeding and crop develop-ment.
In an irrigation system where water was pumped follow-ing a pre-defined weekly schedule, farmers offset the risk of pump failures by irrigating large amounts of water into their field. The deep water served as buffer and thus re-duced their drought risk. They were reluctant to adopt an alternate wetting and drying practice. In another ir-rigation scheme, where water was available to individual farmers every 3 to 5 days, farmers found it easy to adopt AWD. In the irrigation scheme where farmers managed the water flow on their own it was easy to adapt irrigation frequency and amounts to SRI requirements (Krupnik et al. 2012b). However, overall, farmers used alternate wet-ting and drying practices mainly in the later vegetative growth stages because they felt that higher water levels at early stages were necessary for weed control.
Farmers perceived that difficulties of even land leveling, difficulties in water control and management, and short-ages in labor availability were the three top most con-straints to realizing larger water savings. The difficulties related to pumping frequency were already mentioned above. In commonly used water canals, free riding might occur when only a few farmers make efforts to save wa-ter. Reliable methods to measure water inflow at the field level would be required to equitably distribute irrigation fees among water users. However, as long as such methods are not available, Krupik et al. (2012) suggest that farmers would need to adopt improved governance procedures to implement water savings at the irrigation scheme level.
Farmers in Tamil Nadu have no incentive to save water because both irrigation water and electricity for pump-ing are free of charge for farmers. Some experienced difficulties in adopting water saving irrigation because their fields were located in a cascade system of irrigation (Senthilkumar et al. 2008). The three top most reasons for farmers to be interested in SRI were (1) increases in yield and profit, (2) reduction in costs, and (3) low initial capital investments. Ecosystem conservation, long-term sustain-ability and water savings were among the least important reasons (Senthilkumar et al. 2008).
23
About 40 % of farmers using a mechanical cono-weeder in heavy clay soil in Tamil Nadu complained about the heavy weight and difficulty of handling the tool (Senthilkumar et al. 2008).
3.7 Grain yields
Grain production did not differ (although lower, but insig-nificantly) comparing SRI production with conventional irrigated production system in a field trial in the eastern periphery of Amazonia, Brazil (Gehring et al. 2013). Still, the bi-factorial ANOVA showed significant main effects of the production systems as well as of the fertilizer regime.
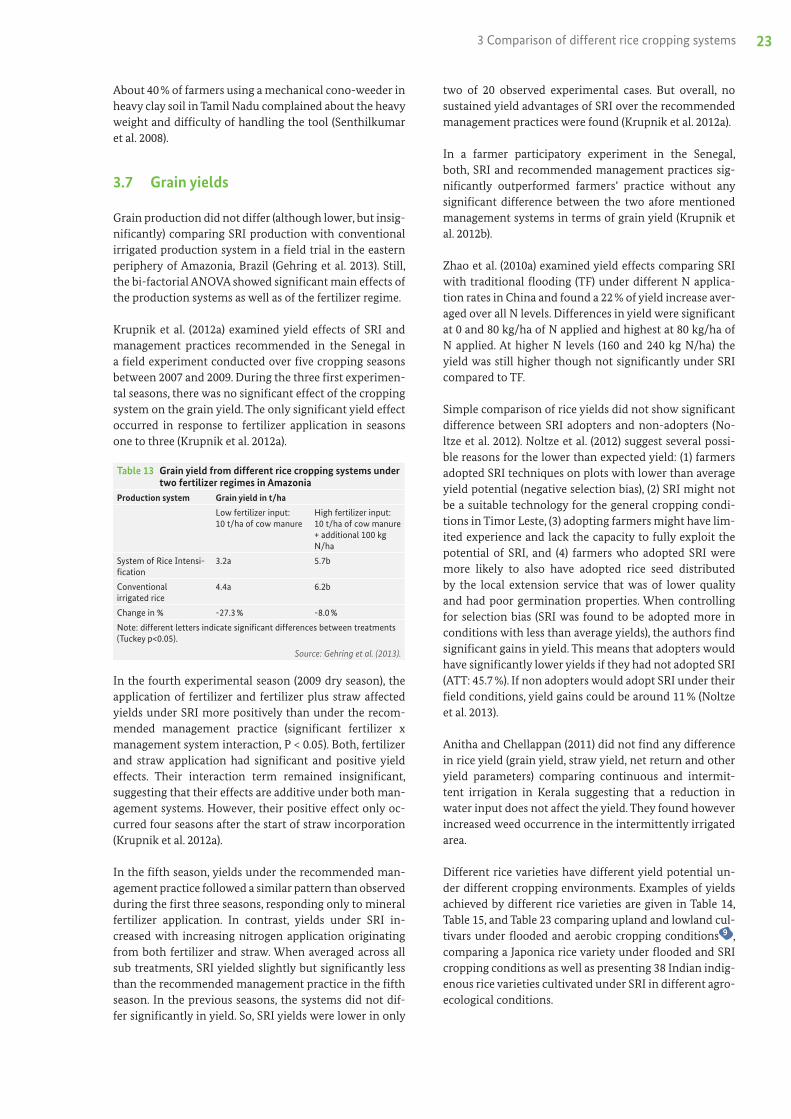
Krupnik et al. (2012a) examined yield effects of SRI and management practices recommended in the Senegal in a field experiment conducted over five cropping seasons between 2007 and 2009. During the three first experimen-tal seasons, there was no significant effect of the cropping system on the grain yield. The only significant yield effect occurred in response to fertilizer application in seasons one to three (Krupnik et al. 2012a).
Table 13 Grain yield from different rice cropping systems under two fertilizer regimes in Amazonia
Production system Grain yield in t/ha
Low fertilizer input: 10 t/ha of cow manure
High fertilizer input: 10 t/ha of cow manure + additional 100 kg N/ha
System of Rice Intensi-fication
3.2a 5.7b
Conventional irrigated rice
4.4a 6.2b
Change in % -27.3 % -8.0 %
Note: different letters indicate significant differences between treatments (Tuckey p<0.05).
Source: Gehring et al. (2013).
In the fourth experimental season (2009 dry season), the application of fertilizer and fertilizer plus straw affected yields under SRI more positively than under the recom-mended management practice (significant fertilizer x management system interaction, P < 0.05). Both, fertilizer and straw application had significant and positive yield effects. Their interaction term remained insignificant, suggesting that their effects are additive under both man-agement systems. However, their positive effect only oc-curred four seasons after the start of straw incorporation (Krupnik et al. 2012a).
In the fifth season, yields under the recommended man-agement practice followed a similar pattern than observed during the first three seasons, responding only to mineral fertilizer application. In contrast, yields under SRI in-creased with increasing nitrogen application originating from both fertilizer and straw. When averaged across all sub treatments, SRI yielded slightly but significantly less than the recommended management practice in the fifth season. In the previous seasons, the systems did not dif-fer significantly in yield. So, SRI yields were lower in only
two of 20 observed experimental cases. But overall, no sustained yield advantages of SRI over the recommended management practices were found (Krupnik et al. 2012a).
In a farmer participatory experiment in the Senegal, both, SRI and recommended management practices sig-nificantly outperformed farmers’ practice without any significant difference between the two afore mentioned management systems in terms of grain yield (Krupnik et al. 2012b).
Zhao et al. (2010a) examined yield effects comparing SRI with traditional flooding (TF) under different N applica-tion rates in China and found a 22 % of yield increase aver-aged over all N levels. Differences in yield were significant at 0 and 80 kg/ha of N applied and highest at 80 kg/ha of N applied. At higher N levels (160 and 240 kg N/ha) the yield was still higher though not significantly under SRI compared to TF.
Simple comparison of rice yields did not show significant difference between SRI adopters and non-adopters (No-ltze et al. 2012). Noltze et al. (2012) suggest several possi-ble reasons for the lower than expected yield: (1) farmers adopted SRI techniques on plots with lower than average yield potential (negative selection bias), (2) SRI might not be a suitable technology for the general cropping condi-tions in Timor Leste, (3) adopting farmers might have lim-ited experience and lack the capacity to fully exploit the potential of SRI, and (4) farmers who adopted SRI were more likely to also have adopted rice seed distributed by the local extension service that was of lower quality and had poor germination properties. When controlling for selection bias (SRI was found to be adopted more in conditions with less than average yields), the authors find significant gains in yield. This means that adopters would have significantly lower yields if they had not adopted SRI (ATT: 45.7 %). If non adopters would adopt SRI under their field conditions, yield gains could be around 11 % (Noltze et al. 2013).
Anitha and Chellappan (2011) did not find any difference in rice yield (grain yield, straw yield, net return and other yield parameters) comparing continuous and intermit-tent irrigation in Kerala suggesting that a reduction in water input does not affect the yield. They found however increased weed occurrence in the intermittently irrigated area.
Different rice varieties have different yield potential un-der different cropping environments. Examples of yields achieved by different rice varieties are given in Table 14, Table 15, and Table 23 comparing upland and lowland cul-tivars under flooded and aerobic cropping conditions 9 , comparing a Japonica rice variety under flooded and SRI cropping conditions as well as presenting 38 Indian indig-enous rice varieties cultivated under SRI in different agro-ecological conditions.
3 Comparison of different rice cropping systems
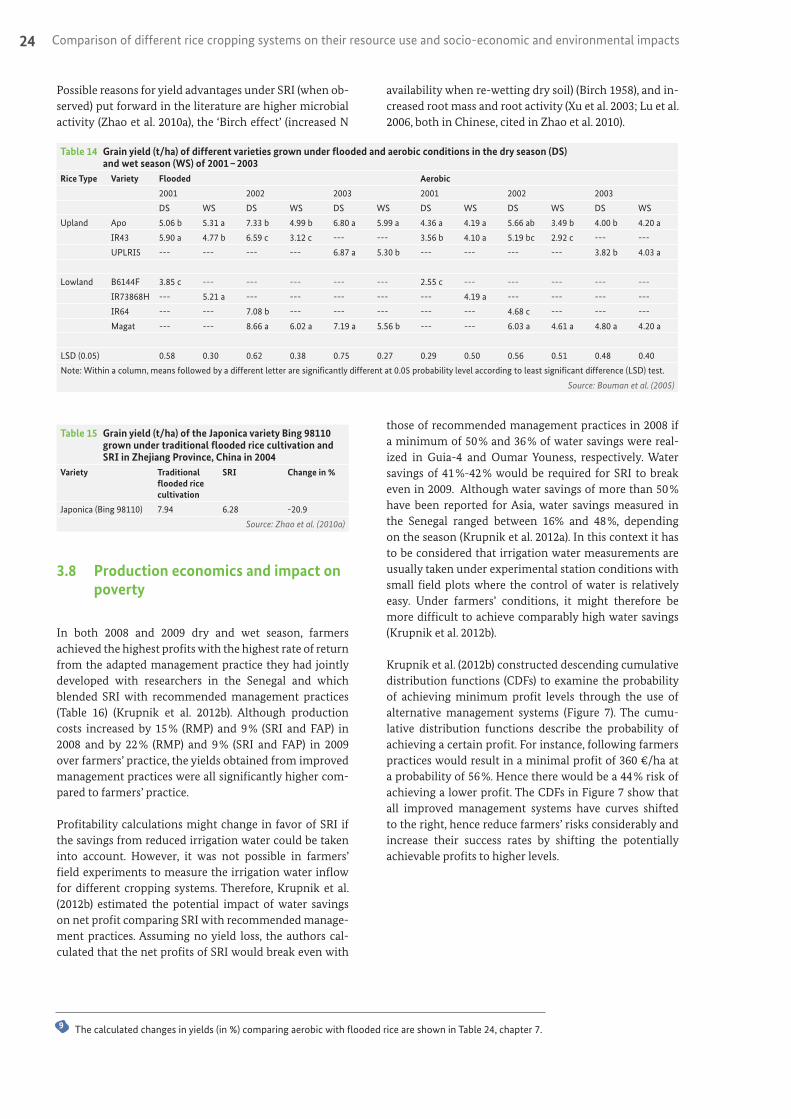
Comparison of different rice cropping systems on their resource use and socio-economic and environmental impacts24
Possible reasons for yield advantages under SRI (when ob-served) put forward in the literature are higher microbial activity (Zhao et al. 2010a), the ‘Birch effect’ (increased N
availability when re-wetting dry soil) (Birch 1958), and in-creased root mass and root activity (Xu et al. 2003; Lu et al. 2006, both in Chinese, cited in Zhao et al. 2010).
Table 14 Grain yield (t/ha) of different varieties grown under flooded and aerobic conditions in the dry season (DS) and wet season (WS) of 2001 – 2003
Rice Type Variety Flooded Aerobic
2001 2002 2003 2001 2002 2003
DS WS DS WS DS WS DS WS DS WS DS WS
Upland Apo 5.06 b 5.31 a 7.33 b 4.99 b 6.80 a 5.99 a 4.36 a 4.19 a 5.66 ab 3.49 b 4.00 b 4.20 a
IR43 5.90 a 4.77 b 6.59 c 3.12 c --- --- 3.56 b 4.10 a 5.19 bc 2.92 c --- ---
UPLRI5 --- --- --- --- 6.87 a 5.30 b --- --- --- --- 3.82 b 4.03 a
Lowland B6144F 3.85 c --- --- --- --- --- 2.55 c --- --- --- --- ---
IR73868H --- 5.21 a --- --- --- --- --- 4.19 a --- --- --- ---
IR64 --- --- 7.08 b --- --- --- --- --- 4.68 c --- --- ---
Magat --- --- 8.66 a 6.02 a 7.19 a 5.56 b --- --- 6.03 a 4.61 a 4.80 a 4.20 a
LSD (0.05) 0.58 0.30 0.62 0.38 0.75 0.27 0.29 0.50 0.56 0.51 0.48 0.40
Note: Within a column, means followed by a different letter are significantly different at 0.05 probability level according to least significant difference (LSD) test.
Source: Bouman et al. (2005)
Table 15 Grain yield (t/ha) of the Japonica variety Bing 98110 grown under traditional flooded rice cultivation and SRI in Zhejiang Province, China in 2004
Variety Traditional flooded rice cultivation
SRI Change in %
Japonica (Bing 98110) 7.94 6.28 -20.9
Source: Zhao et al. (2010a)
3.8 Production economics and impact on poverty
In both 2008 and 2009 dry and wet season, farmers achieved the highest profits with the highest rate of return from the adapted management practice they had jointly developed with researchers in the Senegal and which blended SRI with recommended management practices (Table 16) (Krupnik et al. 2012b). Although production costs increased by 15 % (RMP) and 9 % (SRI and FAP) in 2008 and by 22 % (RMP) and 9 % (SRI and FAP) in 2009 over farmers’ practice, the yields obtained from improved management practices were all significantly higher com-pared to farmers’ practice.
Profitability calculations might change in favor of SRI if the savings from reduced irrigation water could be taken into account. However, it was not possible in farmers’ field experiments to measure the irrigation water inflow for different cropping systems. Therefore, Krupnik et al. (2012b) estimated the potential impact of water savings on net profit comparing SRI with recommended manage-ment practices. Assuming no yield loss, the authors cal-culated that the net profits of SRI would break even with
those of recommended management practices in 2008 if a minimum of 50 % and 36 % of water savings were real-ized in Guia-4 and Oumar Youness, respectively. Water savings of 41 %-42 % would be required for SRI to break even in 2009. Although water savings of more than 50 % have been reported for Asia, water savings measured in the Senegal ranged between 16% and 48 %, depending on the season (Krupnik et al. 2012a). In this context it has to be considered that irrigation water measurements are usually taken under experimental station conditions with small field plots where the control of water is relatively easy. Under farmers’ conditions, it might therefore be more difficult to achieve comparably high water savings (Krupnik et al. 2012b).
Krupnik et al. (2012b) constructed descending cumulative distribution functions (CDFs) to examine the probability of achieving minimum profit levels through the use of alternative management systems (Figure 7). The cumu-lative distribution functions describe the probability of achieving a certain profit. For instance, following farmers practices would result in a minimal profit of 360 €/ha at a probability of 56 %. Hence there would be a 44 % risk of achieving a lower profit. The CDFs in Figure 7 show that all improved management systems have curves shifted to the right, hence reduce farmers’ risks considerably and increase their success rates by shifting the potentially achievable profits to higher levels.
9 The calculated changes in yields (in %) comparing aerobic with flooded rice are shown in Table 24, chapter 7.

25
Table 16 Profitability analysis of rice management systems during 2008 wet and 2009 dry seasons at three sites in the SenegalYear Location FP FAP BMP/RMP SRI
2008 Total production costs (€/ha) Nianga 423 483 482 506
Guia-4 407 442 441 494
Oumar Youness 571 616 623 654
Yield (t grain/ha) Nianga 3.79 5.36 4.91 5.10
(unit price: 0.21 €) Guia-4 4.19 5.07 4.79 4.79
Oumar Youness 4.08 5.84 5.28 5.11
Profit (€/ha) Nianga 375 644 551 566
Guia-4 475 624 568 515
Oumar Youness 287 614 487 420
Rate of return Nianga 0.89 1.33 1.14 1.12
Guia-4 1.17 1.41 1.29 1.04
Oumar Youness 0.50 1.00 0.78 0.64
2009 Total production costs (€/ha) Nianga 556 533 574 630
Guia-4 435 545 548 627
Oumar Youness - - - -
Yield (t grain/ha) Nianga 4.32 6.06 5.84 6.05
(unit price: 0.18 €) Guia-4 3.98 7.51 7.44 7.42
Oumar Youness - - - -
Profit (€/ha) Nianga 228 560 520 450
Guia-4 287 817 802 720
Oumar Youness - - - -
Rate of return Nianga 0.41 1.04 0.96 0.69
Guia-4 0.66 1.50 1.46 1.15
Oumar Youness - - - -
Note: FP: Farmers’ practice, FAP: Farmer Adapted Practice, BMP: Best Management Practice, RMP: Recommended Management Practice, SRI: System of Rice Intensification; Rate of return = profit/production costs, profit may differ slightly from the difference in production value and costs because of rounding; Because of crop loss from severe granivorous bird attack in Oumar Youness, 2009 dry season data are not shown.
Source: Krupnik et al. (2012b)
Similarly as in the case of yield, a simple comparison of household income in Timor Leste does not show signifi-cant difference between SRI adopters and non-adopters (Noltze et al. 2012) (Table 17). However, total variable costs are significantly lower under SRI, largely due to lower seed
costs and lower pesticide costs. Fertilizer costs (chemical fertilizer in this case) are only slightly but still significantly higher for SRI while no significant difference was found in labor inputs.
Figure 7 Descending cumulative distribution functions in the 2008 wet season (A) and the 2009 dry season (B)
Note: Descending cumulative distribution functions describing the potential (y-axis) of obtaining profits (€/ha) greater than values on the x-axis for all farmers from Farmers’ Practices (FPs), the System of Rice Intensification (SRI), Recommended Management Practices (RMPs) and Farmer Adapted Practice (FAP).
Source: Krupnik et al. (2012b)
Des
cend
ing
cum
ulat
ive
prob
abili
ty (%
)
100908070605040302010
00 200 400 600 800 1000 1200 0 200 400 600 800 1000 1200
FPRMPSRIFAP
3 Comparison of different rice cropping systems
(B)(A)
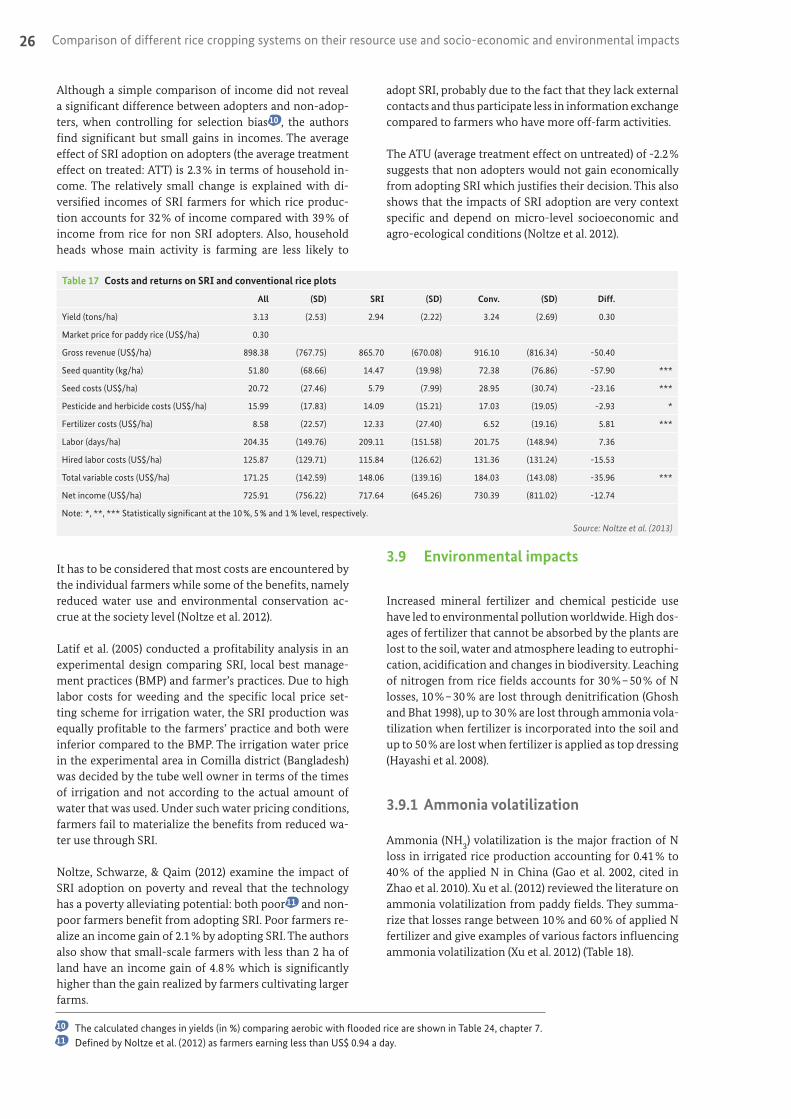
Comparison of different rice cropping systems on their resource use and socio-economic and environmental impacts26
Although a simple comparison of income did not reveal a significant difference between adopters and non-adop-ters, when controlling for selection bias 10 , the authors find significant but small gains in incomes. The average effect of SRI adoption on adopters (the average treatment effect on treated: ATT) is 2.3 % in terms of household in-come. The relatively small change is explained with di-versified incomes of SRI farmers for which rice produc-tion accounts for 32 % of income compared with 39 % of income from rice for non SRI adopters. Also, household heads whose main activity is farming are less likely to
adopt SRI, probably due to the fact that they lack external contacts and thus participate less in information exchange compared to farmers who have more off-farm activities.
The ATU (average treatment effect on untreated) of -2.2 % suggests that non adopters would not gain economically from adopting SRI which justifies their decision. This also shows that the impacts of SRI adoption are very context specific and depend on micro-level socioeconomic and agro-ecological conditions (Noltze et al. 2012).
Table 17 Costs and returns on SRI and conventional rice plots
All (SD) SRI (SD) Conv. (SD) Diff.
Yield (tons/ha) 3.13 (2.53) 2.94 (2.22) 3.24 (2.69) 0.30
Market price for paddy rice (US$/ha) 0.30
Gross revenue (US$/ha) 898.38 (767.75) 865.70 (670.08) 916.10 (816.34) -50.40
Seed quantity (kg/ha) 51.80 (68.66) 14.47 (19.98) 72.38 (76.86) -57.90 ***
Seed costs (US$/ha) 20.72 (27.46) 5.79 (7.99) 28.95 (30.74) -23.16 ***
Pesticide and herbicide costs (US$/ha) 15.99 (17.83) 14.09 (15.21) 17.03 (19.05) -2.93 *
Fertilizer costs (US$/ha) 8.58 (22.57) 12.33 (27.40) 6.52 (19.16) 5.81 ***
Labor (days/ha) 204.35 (149.76) 209.11 (151.58) 201.75 (148.94) 7.36
Hired labor costs (US$/ha) 125.87 (129.71) 115.84 (126.62) 131.36 (131.24) -15.53
Total variable costs (US$/ha) 171.25 (142.59) 148.06 (139.16) 184.03 (143.08) -35.96 ***
Net income (US$/ha) 725.91 (756.22) 717.64 (645.26) 730.39 (811.02) -12.74
Note: *, **, *** Statistically significant at the 10 %, 5 % and 1 % level, respectively.
Source: Noltze et al. (2013)
It has to be considered that most costs are encountered by the individual farmers while some of the benefits, namely reduced water use and environmental conservation ac-crue at the society level (Noltze et al. 2012).
Latif et al. (2005) conducted a profitability analysis in an experimental design comparing SRI, local best manage-ment practices (BMP) and farmer’s practices. Due to high labor costs for weeding and the specific local price set-ting scheme for irrigation water, the SRI production was equally profitable to the farmers’ practice and both were inferior compared to the BMP. The irrigation water price in the experimental area in Comilla district (Bangladesh) was decided by the tube well owner in terms of the times of irrigation and not according to the actual amount of water that was used. Under such water pricing conditions, farmers fail to materialize the benefits from reduced wa-ter use through SRI.
Noltze, Schwarze, & Qaim (2012) examine the impact of SRI adoption on poverty and reveal that the technology has a poverty alleviating potential: both poor 11 and non-poor farmers benefit from adopting SRI. Poor farmers re-alize an income gain of 2.1 % by adopting SRI. The authors also show that small-scale farmers with less than 2 ha of land have an income gain of 4.8 % which is significantly higher than the gain realized by farmers cultivating larger farms.
3.9 Environmental impacts
Increased mineral fertilizer and chemical pesticide use have led to environmental pollution worldwide. High dos-ages of fertilizer that cannot be absorbed by the plants are lost to the soil, water and atmosphere leading to eutrophi-cation, acidification and changes in biodiversity. Leaching of nitrogen from rice fields accounts for 30 % – 50 % of N losses, 10 % – 30 % are lost through denitrification (Ghosh and Bhat 1998), up to 30 % are lost through ammonia vola-tilization when fertilizer is incorporated into the soil and up to 50 % are lost when fertilizer is applied as top dressing (Hayashi et al. 2008).
3.9.1 Ammonia volatilization
Ammonia (NH3) volatilization is the major fraction of N loss in irrigated rice production accounting for 0.41 % to 40 % of the applied N in China (Gao et al. 2002, cited in Zhao et al. 2010). Xu et al. (2012) reviewed the literature on ammonia volatilization from paddy fields. They summa-rize that losses range between 10 % and 60 % of applied N fertilizer and give examples of various factors influencing ammonia volatilization (Xu et al. 2012) (Table 18).
10 The calculated changes in yields (in %) comparing aerobic with flooded rice are shown in Table 24, chapter 7.11 Defined by Noltze et al. (2012) as farmers earning less than US$ 0.94 a day.
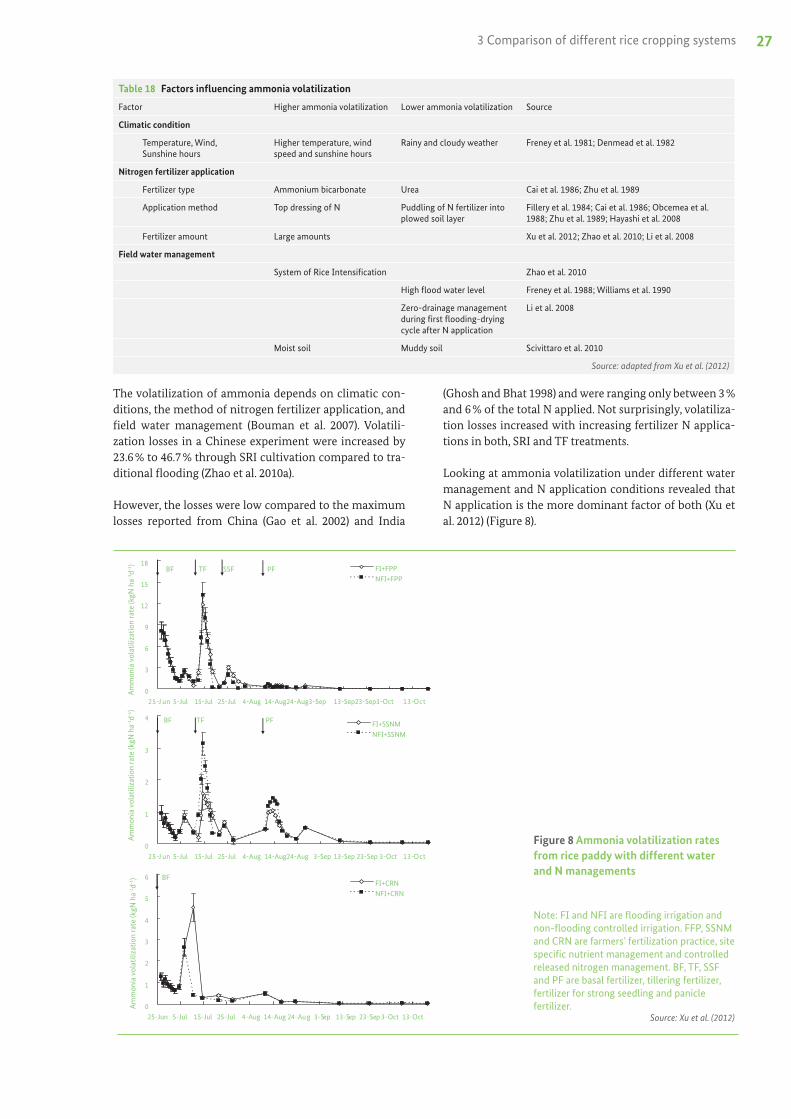
27
Table 18 Factors influencing ammonia volatilization
Factor Higher ammonia volatilization Lower ammonia volatilization Source
Climatic condition
Temperature, Wind, Sunshine hours
Higher temperature, wind speed and sunshine hours
Rainy and cloudy weather Freney et al. 1981; Denmead et al. 1982
Nitrogen fertilizer application
Fertilizer type Ammonium bicarbonate Urea Cai et al. 1986; Zhu et al. 1989
Application method Top dressing of N Puddling of N fertilizer into plowed soil layer
Fillery et al. 1984; Cai et al. 1986; Obcemea et al. 1988; Zhu et al. 1989; Hayashi et al. 2008
Fertilizer amount Large amounts Xu et al. 2012; Zhao et al. 2010; Li et al. 2008
Field water management
System of Rice Intensification Zhao et al. 2010
High flood water level Freney et al. 1988; Williams et al. 1990
Zero-drainage management during first flooding-drying cycle after N application
Li et al. 2008
Moist soil Muddy soil Scivittaro et al. 2010
Source: adapted from Xu et al. (2012)
The volatilization of ammonia depends on climatic con-ditions, the method of nitrogen fertilizer application, and field water management (Bouman et al. 2007). Volatili-zation losses in a Chinese experiment were increased by 23.6 % to 46.7 % through SRI cultivation compared to tra-ditional flooding (Zhao et al. 2010a).
However, the losses were low compared to the maximum losses reported from China (Gao et al. 2002) and India
(Ghosh and Bhat 1998) and were ranging only between 3 % and 6 % of the total N applied. Not surprisingly, volatiliza-tion losses increased with increasing fertilizer N applica-tions in both, SRI and TF treatments.
Looking at ammonia volatilization under different water management and N application conditions revealed that N application is the more dominant factor of both (Xu et al. 2012) (Figure 8).
Figure 8 Ammonia volatilization rates from rice paddy with different water and N managements
Note: FI and NFI are flooding irrigation and non-flooding controlled irrigation. FFP, SSNM and CRN are farmers’ fertilization practice, site specific nutrient management and controlled released nitrogen management. BF, TF, SSF and PF are basal fertilizer, tillering fertilizer, fertilizer for strong seedling and panicle fertilizer.
Source: Xu et al. (2012)
0
3
6
9
12
15
18
13-Sep23-Sep3-Oct14-Aug24-Aug3-Sep4-Aug25-Jul15-Jul5-Jul tcO-31nuJ-52
Am
mon
ia v
olat
iliza
tion
rate
/kg
N h
m-2
d-1 FI+FPP
NFI+FPP
0
1
2
3
4
13-Sep 23-Sep 3-Oct14-Aug24-Aug 3-Sep4-Aug25-Jul15-Jul5-Jul tcO-31nuJ-52
FI+SSNMNFI+SSNM
0
1
2
3
4
5
6
4-Aug25-Jul15-Jul5-Jul25-Jun 14-Aug 24-Aug 3-S ep 13-S ep 23-Se p 3- Oct 13-Oct
FI+CRNNFI+CRN
BF TF SSF PF
BF TF PF
BF
Am
mon
ia v
olat
iliza
tion
rate
(kgN
ha-1
d-1)
Am
mon
ia v
olat
iliza
tion
rate
(kgN
ha-1
d-1)
Am
mon
ia v
olat
iliza
tion
rate
(kgN
ha-1
d-1)
3 Comparison of different rice cropping systems
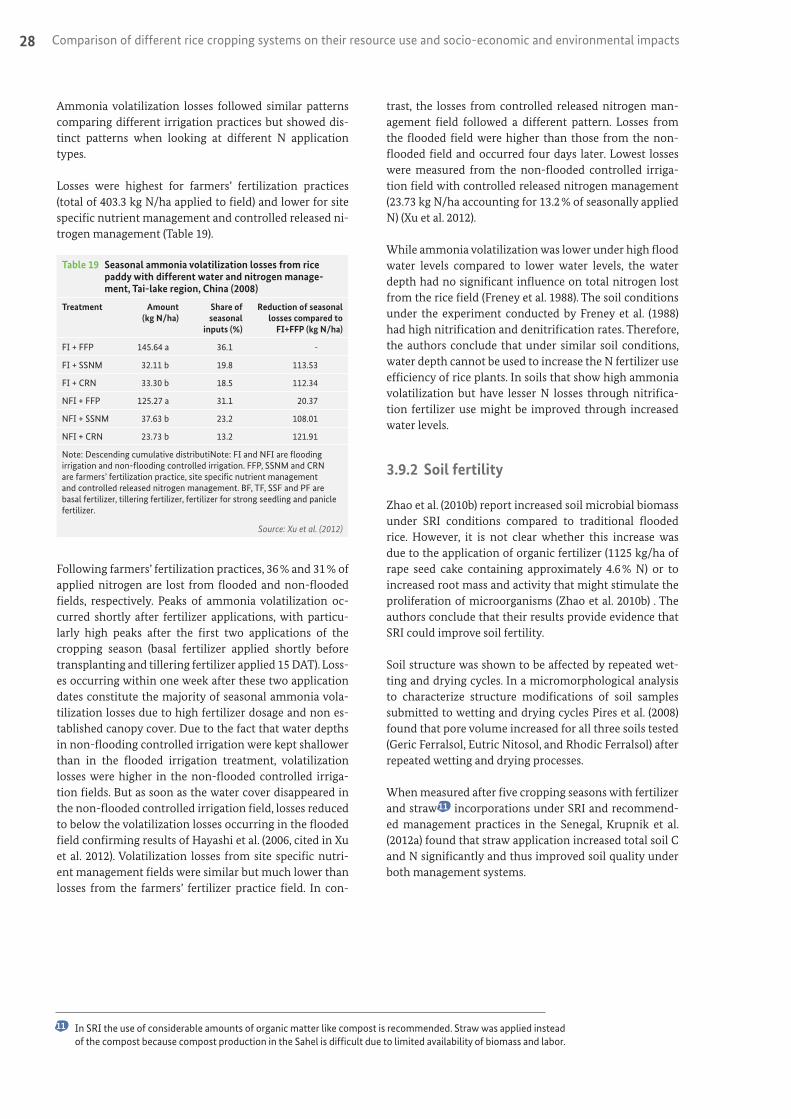
Comparison of different rice cropping systems on their resource use and socio-economic and environmental impacts28
Ammonia volatilization losses followed similar patterns comparing different irrigation practices but showed dis-tinct patterns when looking at different N application types.
Losses were highest for farmers’ fertilization practices (total of 403.3 kg N/ha applied to field) and lower for site specific nutrient management and controlled released ni-trogen management (Table 19).
Table 19 Seasonal ammonia volatilization losses from rice paddy with different water and nitrogen manage-ment, Tai-lake region, China (2008)
Treatment Amount (kg N/ha)
Share of seasonal
inputs (%)
Reduction of seasonal losses compared to
FI+FFP (kg N/ha)
FI + FFP 145.64 a 36.1 -
FI + SSNM 32.11 b 19.8 113.53
FI + CRN 33.30 b 18.5 112.34
NFI + FFP 125.27 a 31.1 20.37
NFI + SSNM 37.63 b 23.2 108.01
NFI + CRN 23.73 b 13.2 121.91
Note: Descending cumulative distributiNote: FI and NFI are flooding irrigation and non-flooding controlled irrigation. FFP, SSNM and CRN are farmers’ fertilization practice, site specific nutrient management and controlled released nitrogen management. BF, TF, SSF and PF are basal fertilizer, tillering fertilizer, fertilizer for strong seedling and panicle fertilizer.
Source: Xu et al. (2012)
Following farmers’ fertilization practices, 36 % and 31 % of applied nitrogen are lost from flooded and non-flooded fields, respectively. Peaks of ammonia volatilization oc-curred shortly after fertilizer applications, with particu-larly high peaks after the first two applications of the cropping season (basal fertilizer applied shortly before transplanting and tillering fertilizer applied 15 DAT). Loss-es occurring within one week after these two application dates constitute the majority of seasonal ammonia vola-tilization losses due to high fertilizer dosage and non es-tablished canopy cover. Due to the fact that water depths in non-flooding controlled irrigation were kept shallower than in the flooded irrigation treatment, volatilization losses were higher in the non-flooded controlled irriga-tion fields. But as soon as the water cover disappeared in the non-flooded controlled irrigation field, losses reduced to below the volatilization losses occurring in the flooded field confirming results of Hayashi et al. (2006, cited in Xu et al. 2012). Volatilization losses from site specific nutri-ent management fields were similar but much lower than losses from the farmers’ fertilizer practice field. In con-
trast, the losses from controlled released nitrogen man-agement field followed a different pattern. Losses from the flooded field were higher than those from the non-flooded field and occurred four days later. Lowest losses were measured from the non-flooded controlled irriga-tion field with controlled released nitrogen management (23.73 kg N/ha accounting for 13.2 % of seasonally applied N) (Xu et al. 2012).
While ammonia volatilization was lower under high flood water levels compared to lower water levels, the water depth had no significant influence on total nitrogen lost from the rice field (Freney et al. 1988). The soil conditions under the experiment conducted by Freney et al. (1988) had high nitrification and denitrification rates. Therefore, the authors conclude that under similar soil conditions, water depth cannot be used to increase the N fertilizer use efficiency of rice plants. In soils that show high ammonia volatilization but have lesser N losses through nitrifica-tion fertilizer use might be improved through increased water levels.
3.9.2 Soil fertility
Zhao et al. (2010b) report increased soil microbial biomass under SRI conditions compared to traditional flooded rice. However, it is not clear whether this increase was due to the application of organic fertilizer (1125 kg/ha of rape seed cake containing approximately 4.6 % N) or to increased root mass and activity that might stimulate the proliferation of microorganisms (Zhao et al. 2010b) . The authors conclude that their results provide evidence that SRI could improve soil fertility.
Soil structure was shown to be affected by repeated wet-ting and drying cycles. In a micromorphological analysis to characterize structure modifications of soil samples submitted to wetting and drying cycles Pires et al. (2008) found that pore volume increased for all three soils tested (Geric Ferralsol, Eutric Nitosol, and Rhodic Ferralsol) after repeated wetting and drying processes.
When measured after five cropping seasons with fertilizer and straw 11 incorporations under SRI and recommend-ed management practices in the Senegal, Krupnik et al. (2012a) found that straw application increased total soil C and N significantly and thus improved soil quality under both management systems.
11 In SRI the use of considerable amounts of organic matter like compost is recommended. Straw was applied instead of the compost because compost production in the Sahel is difficult due to limited availability of biomass and labor.
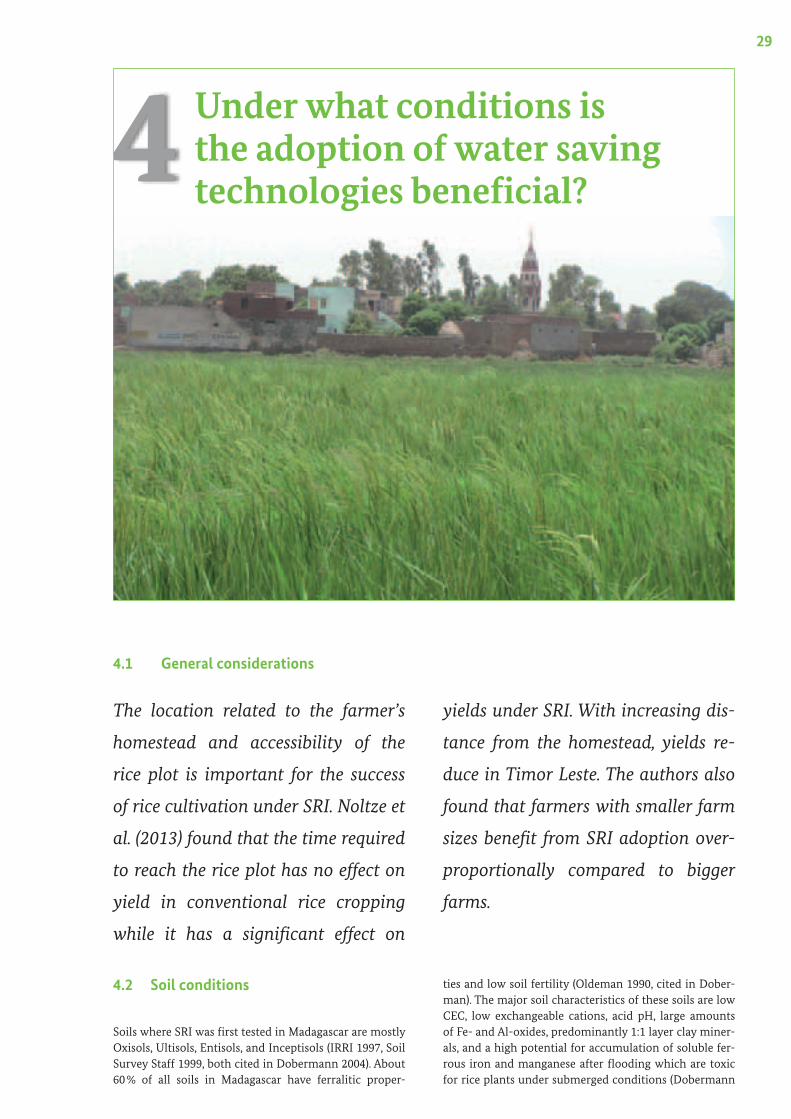
29
4 Under what conditions is the adoption of water saving technologies beneficial?
4.1 General considerations
The location related to the farmer’s
homestead and accessibility of the
rice plot is important for the success
of rice cultivation under SRI. Noltze et
al. (2013) found that the time required
to reach the rice plot has no effect on
yield in conventional rice cropping
while it has a significant effect on
yields under SRI. With increasing dis-
tance from the homestead, yields re-
duce in Timor Leste. The authors also
found that farmers with smaller farm
sizes benefit from SRI adoption over-
proportionally compared to bigger
farms.
4.2 Soil conditions
Soils where SRI was first tested in Madagascar are mostly Oxisols, Ultisols, Entisols, and Inceptisols (IRRI 1997, Soil Survey Staff 1999, both cited in Dobermann 2004). About 60 % of all soils in Madagascar have ferralitic proper-
ties and low soil fertility (Oldeman 1990, cited in Dober-man). The major soil characteristics of these soils are low CEC, low exchangeable cations, acid pH, large amounts of Fe- and Al-oxides, predominantly 1:1 layer clay miner-als, and a high potential for accumulation of soluble fer-rous iron and manganese after flooding which are toxic for rice plants under submerged conditions (Dobermann
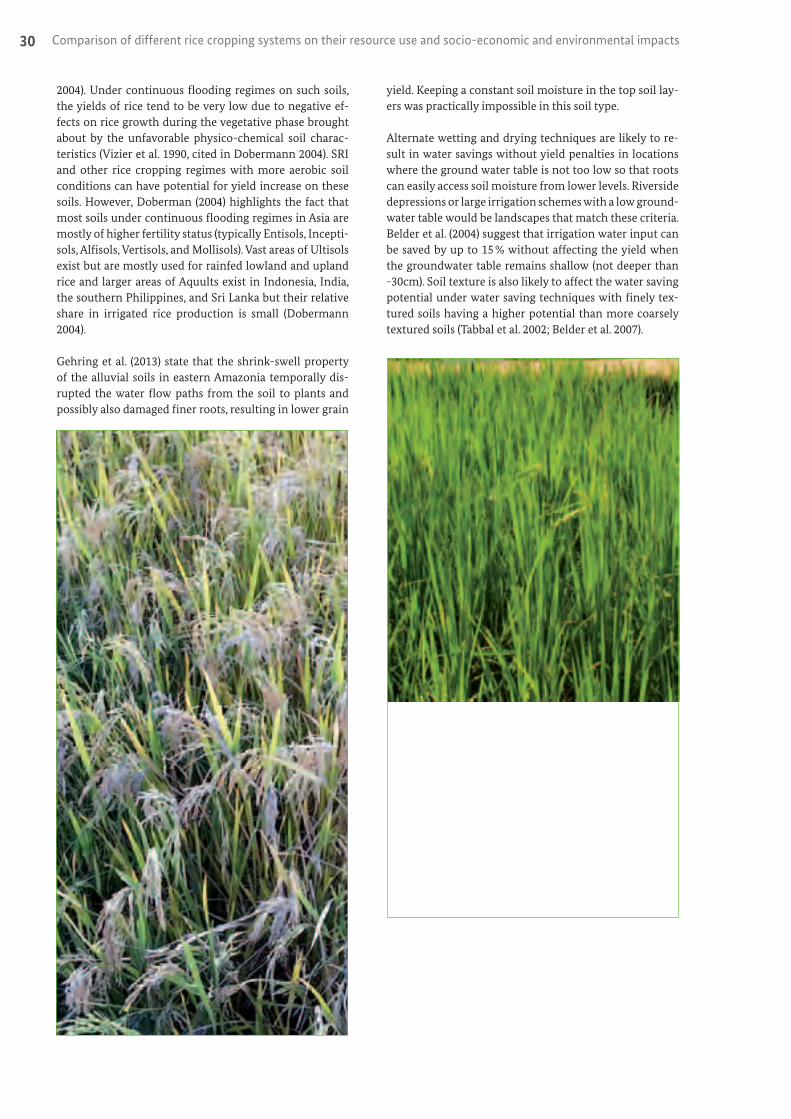
Comparison of different rice cropping systems on their resource use and socio-economic and environmental impacts30
2004). Under continuous flooding regimes on such soils, the yields of rice tend to be very low due to negative ef-fects on rice growth during the vegetative phase brought about by the unfavorable physico-chemical soil charac-teristics (Vizier et al. 1990, cited in Dobermann 2004). SRI and other rice cropping regimes with more aerobic soil conditions can have potential for yield increase on these soils. However, Doberman (2004) highlights the fact that most soils under continuous flooding regimes in Asia are mostly of higher fertility status (typically Entisols, Incepti-sols, Alfisols, Vertisols, and Mollisols). Vast areas of Ultisols exist but are mostly used for rainfed lowland and upland rice and larger areas of Aquults exist in Indonesia, India, the southern Philippines, and Sri Lanka but their relative share in irrigated rice production is small (Dobermann 2004).
Gehring et al. (2013) state that the shrink-swell property of the alluvial soils in eastern Amazonia temporally dis-rupted the water flow paths from the soil to plants and possibly also damaged finer roots, resulting in lower grain
yield. Keeping a constant soil moisture in the top soil lay-ers was practically impossible in this soil type.
Alternate wetting and drying techniques are likely to re-sult in water savings without yield penalties in locations where the ground water table is not too low so that roots can easily access soil moisture from lower levels. Riverside depressions or large irrigation schemes with a low ground-water table would be landscapes that match these criteria. Belder et al. (2004) suggest that irrigation water input can be saved by up to 15 % without affecting the yield when the groundwater table remains shallow (not deeper than -30cm). Soil texture is also likely to affect the water saving potential under water saving techniques with finely tex-tured soils having a higher potential than more coarsely textured soils (Tabbal et al. 2002; Belder et al. 2007).
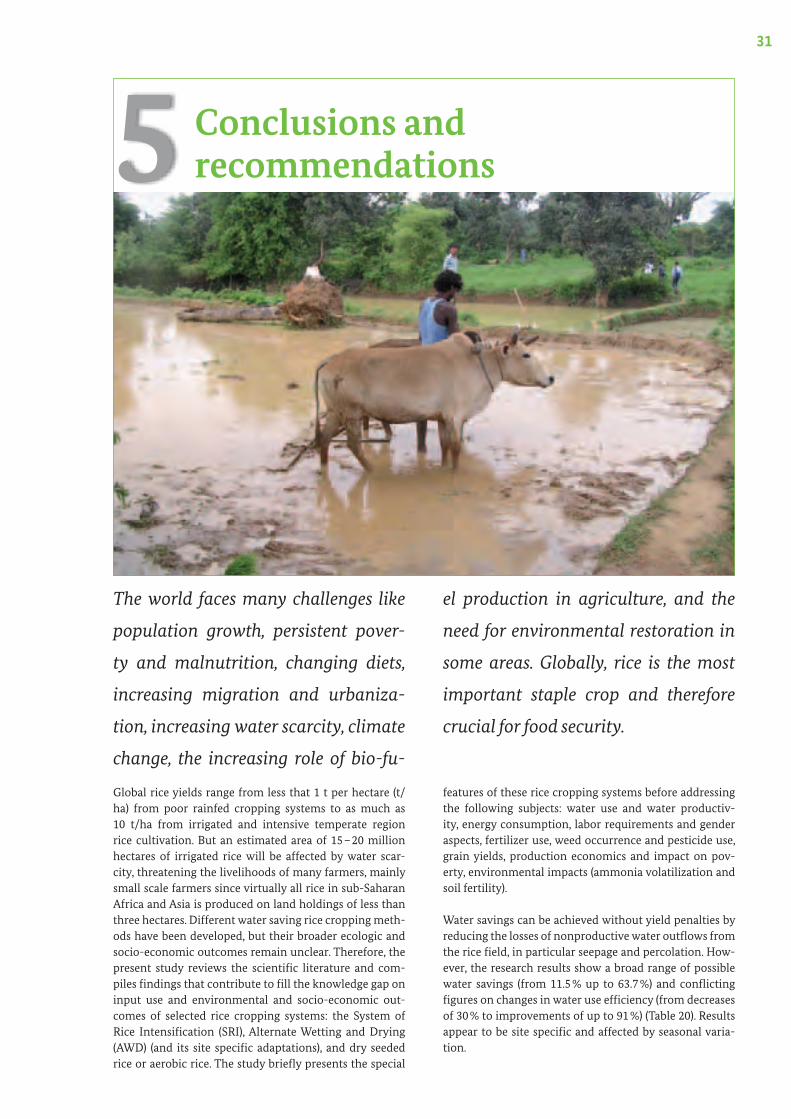
31
5 Conclusions and recommendations
The world faces many challenges like
population growth, persistent pover-
ty and malnutrition, changing diets,
increasing migration and urbaniza-
tion, increasing water scarcity, climate
change, the increasing role of bio-fu-
el production in agriculture, and the
need for environmental restoration in
some areas. Globally, rice is the most
important staple crop and therefore
crucial for food security.
Global rice yields range from less that 1 t per hectare (t/ha) from poor rainfed cropping systems to as much as 10 t/ha from irrigated and intensive temperate region rice cultivation. But an estimated area of 15 – 20 million hectares of irrigated rice will be affected by water scar-city, threatening the livelihoods of many farmers, mainly small scale farmers since virtually all rice in sub-Saharan Africa and Asia is produced on land holdings of less than three hectares. Different water saving rice cropping meth-ods have been developed, but their broader ecologic and socio-economic outcomes remain unclear. Therefore, the present study reviews the scientific literature and com-piles findings that contribute to fill the knowledge gap on input use and environmental and socio-economic out-comes of selected rice cropping systems: the System of Rice Intensification (SRI), Alternate Wetting and Drying (AWD) (and its site specific adaptations), and dry seeded rice or aerobic rice. The study briefly presents the special
features of these rice cropping systems before addressing the following subjects: water use and water productiv-ity, energy consumption, labor requirements and gender aspects, fertilizer use, weed occurrence and pesticide use, grain yields, production economics and impact on pov-erty, environmental impacts (ammonia volatilization and soil fertility).
Water savings can be achieved without yield penalties by reducing the losses of nonproductive water outflows from the rice field, in particular seepage and percolation. How-ever, the research results show a broad range of possible water savings (from 11.5 % up to 63.7 %) and conflicting figures on changes in water use efficiency (from decreases of 30 % to improvements of up to 91 %) (Table 20). Results appear to be site specific and affected by seasonal varia-tion.
Comparison of different rice cropping systems on their resource use and socio-economic and environmental impacts32
Table 20 Differences in water use and water use efficiency of different rice cropping systems
Country Differences in Source
water use water use efficiency
AWD vs. conv. China -57.4 % to -63.7 % 50.8 % to 70.9 % Xu et al. 2012
Aerobic vs. conv. Philippines -11.5 % to -50.7 % 32 % to 88 %; 0 % to 45 %; -6 % to -30 %
Bouman et al. 2005
SRI vs. conv. China -57 % 91 % Zhao et al. 2010
SRI vs. best management practice Senegal -16 % to -48 % 13 % to 81 % Krupnik et al. 2012
The reduction of irrigation water input needed at the field level depends on the status of the ground water table. High water savings at the field level can be achieved if sur-rounding fields are continuously flooded, hence replen-ishing the groundwater table like in many experimental settings where high water savings could be achieved. Wa-ter use efficiency varies with the rice variety and provides scope for breeding varieties for water scarce environ-ments. The existence and control of an irrigation system in terms of the amount and timing of water inflow by in-dividual farmers is crucial for agronomic and economic success of rice production under water saving techniques. SRI is by no means the only approach to save water with-out affecting the yield (Krupnik et al. 2012a). Special care must be given to land leveling (e.g. by laser technology).
The differences in energy use of various water saving rice production systems is poorly studied up to date. Gener-ally it seems that rice production consumes the largest amounts of energy compared to other major cereal crops (maize and wheat) but different yield levels (worldwide ranging from less than 1 t/ha to up to 10 t/ha) make gen-eralizations on energy input to output ratios difficult. Most energy for rice cropping is utilized for fertilizer, fol-lowed by harvesting and seed, followed by irrigation. Till-age and plant protection use least energy. The reduction of seed required in SRI consists a considerable reduction of energy input. There seems to be agreement that rice cropping approaches without puddling use significantly less energy compared to conventional wet soil cultivation and more aerobic conditions will change the mechaniza-tion possibilities in rice cultivation because heavier and more energy efficient machinery can be utilized. Energy use patterns are thus likely to change with more aerobic soil conditions and require further investigation.
Labor requirements vary largely with as little time for rice cultivation as 25 person days reported from Brazil to up to 275 person days reported from India. Generally, SRI in-creases the amount of time spent for rice cultivation. Dif-ferent methods for transplanting rice (at random, in line or square pattern assisted with either a rope or a wooden rake) exist some of which are more time consuming than others. However, the initially increased time for trans-planting in SRI is reported to decrease after several seasons when farmers gain experience with the different handling technique. However farmers experience labor bottlenecks due to other on farm (other, higher value crops requiring their attention) or off-farm activities (wage labor).
The adoption of water saving technologies seems to change the gender involvement in rice cropping. How-ever, gender dynamics are complex and highly location specific and development projects carefully have to assess existing gender roles and consider potential impacts. De-pending on whether laborers are paid or unpaid workers, shifts in labor requirements can have positive or negative impacts. Possible differences in wages for men and wom-en also have to be considered, like in the case of India.
The application of organic matter is recommended un-der SRI but its availability is often very limited. All rice cropping systems respond positively on the application of mineral fertilizer. Additional application of organic matter (e.g. as straw) showed improved N recovery from straw and mineral fertilizer under SRI leading to additive positive yield effects. N recovery from straw was more than 100% starting from the fifth season after application, suggesting that N was also taken up from the soil N pool. Integrated organic and mineral fertilizer applications had a positive effect on soil quality parameters and on partial macronutrient balances. However, farmers might prefer to apply the limited organic matter available to higher value crops like vegetables.
The type of crop establishment, water management, me-chanical and chemical weed control management and their interactions affect the weed occurrence and species composition in rice fields. Influences and interactions are complex and are further complicated by site specificity. In general, a high water level in flooded rice fields is an effective means for controlling weed species. Due to the wider spacing combined with younger aged seedlings in SRI, the canopy of the rice crop takes longer time to close hence creating favorable growth conditions for weeds. The increased weed occurrence is a major problem of SRI. However, Krupnik et al. (2012b) did not find differences in weed biomass comparing SRI with recommended man-agement practices. In the absence of mechanical options to control weeds, pesticide applications may significantly affect rice yields under SRI while pesticide applications do not affect conventional yields. However, whether farm-ers resort to pesticide depends on the pesticide price, the availability of sufficient amounts of pesticides in a timely manner and the existence of functioning local financial markets to provide credit.
Grain yields under different rice cropping systems vary largely due to site specific climate and soil conditions as well as different rice cultivars used. In general, when
33
compared with high yield level cultivation methods, no significant difference with SRI yields was found, showing that the same yield can be achieved with less seed and less water. When comparing SRI, AWD, and other methods with farmers’ cultivation practices, the improved methods outperformed farmers’ yields.
High dosages of fertilizer that cannot be absorbed by the plants are lost to the soil, water and atmosphere leading to eutrophication, acidification and changes in biodiver-sity. Leaching of nitrogen from rice fields accounts for 30 % – 50 % of N losses, 10 % – 30 % are lost through deni-trification, 30 % – 50 % (10 % – 60 %) are lost through am-monia volatilization. Ammonia volatilization is affected by climatic conditions, type of nitrogen fertilizer applica-tion, and field water management. Experiments show that the type of N fertilizer dominates ammonia volatilization compared to water depth. High ammonia volatilization losses occur mainly after fertilizer applications at the be-ginning of the cropping cycle, when the crop stand is not well established yet. Losses at this stage could be prevented using higher irrigation levels at early stages as suggested by Li et al. (2008), since higher water levels reduce ammo-nia volatilization (Freney et al. 1988; Williams et al. 1990). This practice was already implemented in the Senegal by rice farmers. However, they decided to start AWD at later growth stages of rice and kept their fields flooded at early stages mainly to suppress weeds. Although higher water levels can reduce ammonia volatilization, water depth has no significant influence on total N loss from the rice field.
Repeated wetting and drying as practiced in AWD and SRI increases soil pore volume, and repeated application of organic matter, e.g. rice straw as practiced in SRI increases total soil C and N contents, and soil microbial biomass, hence improving soil quality.
Farmers’ top most constraints for adopting water saving technologies are (1) difficulties in land leveling, (2) diffi-culties in water control and management, and (3) short-ages in labor availability. The three top most reasons to be interested in SRI adoption are (1) increases in yields compared to farmers’ practice, (2) reduction in production costs, and (3) low initial investment. Least relevant reasons for farmers to adopt a water saving technology are eco-system conservation, long term sustainability, and water savings. Farmers have no incentive to save water where ir-rigation water and electricity for pumping water are avail-able free of charge (subsidized by governments).
Krupnik et al. (2012b) suggest using single and young seedlings only in low risk settings where farmers are able to minimize agronomic (e.g. land leveling) and social (e.g. labor availability) constraints (Krupnik et al. 2012b). In the farmer adapted practice, agronomic recommendations from SRI and recommended management practices were blended and farmers planted 3 seedlings per hill.
It can be concluded that circumstances affecting the re-quired inputs and outcomes that can be expected under different water saving technologies are complex and highly site specific. Economic impacts of SRI adoption are very context specific and depend on micro-level socio-
economic and agro-ecological conditions. The judgment on the overall performance of a water saving technol-ogy depends on the chosen reference base which can be either farmers’ practice or the recommended best man-agement practice. Adapting suitable agronomic practices to local conditions in collaboration with farmers proved to be the most successful option for improving rice crop-ping in terms of yields, water savings and other input use (Krupnik et al. 2012b).
There is a large variation in response to drought condi-tions among cultivars. This suggests that there is scope for the selection of cultivars that are suitable for water sav-ing technologies (Bouman and Tuong 2000). New variet-ies have been developed that are more tolerant to water stress: e.g. aerobic rice, and Nerica (New Rice for Africa, by WARDA) (Bouman et al. 2007). Options to improve water productivity through breeding include 1) shorter growth duration combined with a higher yield of modern variet-ies which leads to lower water losses caused by evapora-tion, seepage, and percolation from individual fields and thereby to a higher water productivity related to total water input; 2) early vigor increasing the evapotranspira-tion efficiency. This leads to earlier canopy cover reduc-ing evaporation from soil and weed suppression reducing weed transpiration.
The development or adaptation of weeding devices would help resolve the increased weed infestation in aerobic sys-tems. Keen et al. (2012) point to the growing importance of precision mechanical weeding under aerobic rice crop-ping systems with increased weed occurrence. They also highlight that heavier tractors and harvesters are likely to be used under dry soil conditions compared to moist conditions because heavy machines are difficult to use on soft puddle soil. This should allow for higher work rates and labor output of machinery used in lowland rice cul-tivation. To further reduce the energy inputs from heavy machinery, the conversion of power into drawbar work by maximizing the tractive efficiency is of increasing impor-tance (Keen et al. 2012).
5 Conclusions and recommendations
Comparison of different rice cropping systems on their resource use and socio-economic and environmental impacts34
6 References
Anitha S and Chellappan M, 2011. Comparison of the system of rice intensification (SR), recommended practices , and farmers ’ methods of rice (Oryza sa-tiva L.) production in the humid tropics of Kerala, India. Journal of Tropical Agriculture, 49, pp.64 – 71.
Banerjee S, 2013. Study of Performance of Indigenous Paddy Varieties under SRI and Conventional Prac-tices, p.35.
Barrett CB, Moser CM, McHugh O V, and Barison J, 2004. Better Technology, Better Plots, or Better Farm-ers? Identifying Changes in Productivity and Risk among Malagasy Rice Farmers. American Journal of Agricultural Economics, 86(4), pp.869 – 888.
Belder P, Bouman BAM, Cabangon R, Guoan L, Quilang EJP, Li Y, Spiertz JHJ, and Tuong TP, 2004. Effect of water-saving irrigation on rice yield and water use in typical lowland conditions in Asia. Agricultural Water Management, 65(3), pp.193 – 210. Available at: http://linkinghub.elsevier.com/retrieve/pii/S0378377403002440 [Accessed January 29, 2013].
Belder P, Bouman BAM, and Spiertz JHJ, 2007. Exploring options for water savings in lowland rice using a modelling approach. Agricultural Systems, 92(1 – 3), pp.91 – 114. Available at: http://linkinghub.elsevier.com/retrieve/pii/S0308521X06000382 [Accessed February 19, 2013].
Belder P, Spiertz JHJ, Bouman BAM, Lu G, and Tuong TP, 2005. Nitrogen economy and water productivity of lowland rice under water-saving irrigation. Field Crops Research, 93(2 – 3), pp.169 – 185. Available at: http://linkinghub.elsevier.com/retrieve/pii/S0378429004002618 [Accessed February 5, 2013].
Bhagat RM, Bhuiyan SI, and Moody K, 1996. Water, till-age and weed interactions in lowland tropical rice: a review. Agricultural Water Management, 31, pp.165 – 184.
Birch HF, 1958. The Effect of Soil Drying on Humus De-composition and Nitrogen Availability. Plant and Soil, X(1), pp.9 – 31.
Bockari-Gevao SM, Ishak W, Yahya A, and Wan CC, 2005. Analysis of energy consumption in lowland rice-based cropping system of Malaysia. Songkla-nakarin Journal of Science and Technology, 27(4), pp.819 – 826.
Bouman BAM, Baker R, Humphreys L, Tuong TP, Atlin G, Bennett J, Dawe D, Dittert K, Dobermann A, Facon T, Fujimoto N, Gupta R, Haefele S, Hosen Y, Ismail A, Johnson D, Johnson S, Khan S, Shan L, et al., 2007. Rice: feeding the billions. In The Comprehen-sive Assessment of Water in Agriculture. IRRI, p. 36.
Bouman BAM, Humphreys E, Tuong TP, and Barker R, 2006. Rice and Water. Advances in Agronomy, 92, pp.187 – 237.
Bouman BAM and Lampayan RM, 2009. Rice Fact sheet. Saving Water: Alternate Wetting and Drying (AWD), (August), p.2. Available at: http://www.knowledgebank.irri.org/factsheetsPDFs/water-management_FSAWD3.pdf.
Bouman BAM, Peng S, Castañeda AR, and Visperas RM, 2005. Yield and water use of irrigated tropical aero-bic rice systems. Agricultural Water Management, 74(2), pp.87 – 105. Available at: http://linkinghub.elsevier.com/retrieve/pii/S0378377404003257 [Ac-cessed February 5, 2013].
Bouman BAM and Tuong TP, 2000. Field water manage-ment to save water and increase its productivity in irrigated lowland rice, 1615, pp.1 – 20.
Cai G-X, Zhu Z-L, Trevitt ACF, Freney JR, and Simpson JR, 1986. Nitrogen loss from ammonium bicarbonate and urea fertilizers applied to flooded rice. Fertilizer Research, 10, pp.203 – 215. Available at: http://link.springer.com/10.1007/BF01049350.
35
Ceesay M, Reid WS, Fernandes ECM, and Uphoff NT, 2006. The effects of repeated soil wetting and drying on lowland rice yield with System of Rice Inten-sification ( SRI ) methods. International Journal of Agricultural Sustainability, 4(1), pp.5 – 14.
Conen F, Smith KA, and Yagi K, 2010. Rice Cultivation. In D. Reay, P. Smith, & A. van Amstel, eds. Methane and Climate Change. London, UK: Earthscan Publica-tions, p. 261.
Denmead OT, Freney JR, and Simpson JR, 1982. Dynam-ics of Ammonia Volatilization during Furrow Irrigation of Maize. Soil Science Society of America Journal, 46, pp.149 – 155.
Dobermann A, 2004. A critical assessment of the system of rice intensification (SRI). Agricultural Systems, 79(3), pp.261 – 281. Available at: http://linkinghub.elsevier.com/retrieve/pii/S0308521X03000878 [Ac-cessed November 26, 2012].
FAO, 2011. The State of the World’s Land and Water Re-sources for Food and Agriculture. Managing systems at risk,
Fillery IRP, Simpson JR, and De Datta SK, 1984. Influence of Field Environment and Fertilizer Management on Ammonia Loss from Flooded Rice. Soil Science Society of America Journal, 48, pp.914 – 920.
De Fraiture C, Molden D, and Wichelns D, 2010. Investing in water for food , ecosystems , and livelihoods : An overview of the comprehensive assessment of water management in agriculture, 97, pp.495 – 501.
Freney JR, Denmead OT, Watanabe I, and Craswell ET, 1981. Ammonia and Nitrous Oxide Losses Follow-ing Applications of Ammonium Sulfate to Flooded Rice. Australian Journal of Agricultural Research, 32, pp.37 – 45.
Freney JR, Trevitt ACF, Muirhead WA, Denmead OT, Simpson JR, and Obcemea WN, 1988. Effect of water depth on ammonia loss from lowland rice. Fertilizer Research, 16, pp.97 – 107.
Gehring C, De Moura EG, Soares Santos RR, Aguiar A das CF, De Sousa AMB, and Boddey RM, 2013. Ecologi-cal intensification of rice production in the low-lands of Amazonia – Options for smallholder rice producers. European Journal of Agronomy, 46(0), pp.25 – 33. Available at: http://www.sciencedirect.com/science/article/pii/S1161030112001517.
Ghosh BC and Bhat R, 1998. Environmental hazards of nitrogen loading in wetland rice fields. Environ-mental Pollution, 102(S1), pp.123 – 126.
Hayashi K, Nishimura S, and Yagi K, 2008. Ammonia volatilization from a paddy field following applica-tions of urea: rice plants are both an absorber and an emitter for atmospheric ammonia. The Science of the total environment, 390(2 – 3), pp.485 – 94. Available at: http://www.ncbi.nlm.nih.gov/pubmed/18054067 [Accessed March 13, 2013].
IRRI, 2013. Rice production and processing. Available at: http://www.irri.org/index.php?option=com_k2&view=item&layout=item&id=9151&lang=en [Ac-cessed February 20, 2013].
Islam AKMS, Hossain MM, Sarkar RI, Saleque MA, Rah-man MA, Haque ME, and Bell RW, 2011. Energy utilization in unpuddled transplanting of wet sea-son rice. In: 5th World Congress of Conservation Agriculture incorporating 3rd Farming Systems Design Conference, 26 – 29 September 2011 Bris-bane, Australia, pp.3 – 6.
Kassam A and Uphoff N, 2012. How rice will be produced in the future - based on learning from the System of Rice Intensification (SRI). Agriculture for Devel-opment, (15), pp.34 – 39.
Keen A, Hall N, Soni P, Gholkar MD, Cooper S, and Fer-dous J, 2012. A review of the tractive performance of wheeled tractors and soil management in low-land intensive rice production. Journal of Terrame-chanics, pp.1 – 18. Available at: http://linkinghub.elsevier.com/retrieve/pii/S0022489812000481 [Accessed March 21, 2013].
Krupnik TJ, Shennan C, and Rodenburg J, 2012a. Yield, water productivity and nutrient balances under the System of Rice Intensification and Recommended Management Practices in the Sahel. Field Crops Research, 130(0), pp.155 – 167. Available at: http://dx.doi.org/10.1016/j.fcr.2012.02.003.
Krupnik TJ, Shennan C, Settle WH, Demont M, Ndiaye AB, and Rodenburg J, 2012b. Improving irri-gated rice production in the Senegal River Valley through experiential learning and innovation. Agricultural Systems, 109, pp.101 – 112. Available at: http://linkinghub.elsevier.com/retrieve/pii/S0308521X12000169 [Accessed February 19, 2013].
Latif MA, Islam MR, Ali MY, and Saeque MA, 2005. Validation of the system of rice intensification (SRI) in Bangladesh. Field Crops Research, 93(2 – 3), pp.281 – 292.
Li H, Liang X, Chen Y, Tian G, and Zhang Z, 2008. Am-monia volatilization from urea in rice fields with zero-drainage water management. Agricultural Water Management, 95(8), pp.887 – 894. Available at: http://linkinghub.elsevier.com/retrieve/pii/S0378377407001412 [Accessed March 13, 2013].
Mishra A, Whitten M, Ketelaar JW, and Salokhe VM, 2006. The System of Rice Intensification ( SRI ): a chal-lenge for science, and an opportunity for farmer empowerment towards sustainable agriculture. International Journal of Agricultural Sustainability, 4(3), pp.193 – 212.
Moser CM and Barrett CB, 2003. The disappointing adop-tion dynamics of a yield- increasing, low external-input technology: the case of SRI in Madagascar. Agricultural Systems, 76(3), pp.1085 – 1100. Available at: http://linkinghub.else-vier.com/retrieve/pii/S0308521X02000410.
Comparison of different rice cropping systems on their resource use and socio-economic and environmental impacts36
Noltze M, Schwarze S, and Qaim M, 2012. Farm Diversity and Heterogeneous Impacts of System Technolo-gies on Yield , Income and Poverty : The System of Rice Intensification in Timor Leste. In Interna-tional Association of Agricultural Economists (IAAE) Triennial Conference, Foz do Iguaçu, Brazil, 18 – 24 August, 2012. p. 24.
Noltze M, Schwarze S, and Qaim M, 2013. Impacts of natural resource management technologies on agricultural yield and household income: The system of rice intensification in Timor Leste. Ecological Economics, 85, pp.59 – 68. Available at: http://linkinghub.elsevier.com/retrieve/pii/S0921800912004132 [Accessed March 1, 2013].
Obcemea WN, Real JG, and De Datta SK, 1988. Effect of Soil Texture and Nitrogen Management on Ammo-nia Volatilization and Total Nitrogen Losses. Philip-pine Journal of Crop Science, 13(3), pp.145 – 153.
Pimentel D, 2009. Energy Inputs in Food Crop Production in Developing and Developed Nations. Energies, 2(1), pp.1 – 24. Available at: http://www.mdpi.com/1996-1073/2/1/1/ [Accessed March 21, 2013].
Pires LF, Cooper M, Cássaroa FAM, Reichardtb K, Bacchib OOS, and Diasd NMP, 2008. Micromorphological analysis to characterize structure modifications of soil samples submitted to wetting and drying cycles, pp.297 – 304.
Senthilkumar K, Bindraban PS, Thiyagarajan TM, De Rid-der N, and Giller KE, 2008. Modified rice cultiva-tion in Tamil Nadu, India: Yield gains and farmers’ (lack of) acceptance. Agricultural Systems, 98(2), pp.82 – 94. Available at: http://linkinghub.elsevier.com/retrieve/pii/S0308521X08000425 [Accessed March 6, 2013].
SRI-Rice, 2012a. SRI methods and concepts applied to other crops. Available at: http://sri.ciifad.cornell.edu/aboutsri/othercrops/index.html [Accessed February 7, 2013].
SRI-Rice, 2012b. System of Rice Intensification Method-ologies, p.1. Available at: http://sri.ciifad.cornell.edu/aboutsri/methods/index.html [Accessed Janu-ary 19, 2013].
Tabbal DF, Bouman BAM, Bhuiyan SI, Sibayan EB, and Sattar MA, 2002. On-farm strategies for reducing water input in irrigated rice; case studies in the Philippines. Agricultural Water Management, 56(2), pp.93 – 112. Available at: http://linkinghub.elsevier.com/retrieve/pii/S0378377402000070.
Tuong TP and Bouman BAM, 2003. Rice Production in Water-scarce Environments. In J. W. Kijne, R. Barker, & D. Molden, eds. Water Productivity in Ag-riculture: Limits and Opportunities for Improvement. CAB International, pp. 53 – 67.
Uphoff N, 2007. Agroecological alternatives: Capitalis-ing on existing genetic potentials. Journal of Development Studies, 43(1), pp.218–236. Avail-able at: http://www.tandfonline.com/doi/abs/10.1080/00220380601055700 [Accessed Febru-ary 4, 2013].
Uphoff N and Fernandes E, 2002. System of Rice In-tensification gains momentum. LEISA Magazne, October, pp.24 – 29.
Uphoff N, Sebastien Rafaralaby, and Rabenandrasana J, 2002. What is the System of Rice Intensification? In Assessment of the System of Rice Intensification. Proceedings of an International Conference, Sanya China. pp. 5 – 7.
Williams JF, Roberts SR, Hill JE, Scardaci SC, and Tibbits G, 1990. Weed Control Water Management Effects On Rice Weed Growth, 44(5), pp.7 – 10.
Xu J, Peng S, Yang S, and Wang W, 2012. Ammonia vola-tilization losses from a rice paddy with different irrigation and nitrogen managements. Agricultural Water Management, 104, pp.184 – 192. Available at: http://linkinghub.elsevier.com/retrieve/pii/S0378377411003374 [Accessed March 13, 2013].
Zhao L, Wu L, Dong C, and Li Y, 2010a. Rice yield, nitrogen utilization and ammonia volatilization as influ-enced by modified rice cultivation at varying ni-trogen rates. Agricultural Sciences, 01(01), pp.10 – 16. Available at: http://www.scirp.org/journal/Pa-perDownload.aspx?DOI=10.4236/as.2010.11002 [Accessed March 8, 2013].
Zhao L, Wu L, Li Y, Animesh S, Zhu D, and Uphoff NT, 2010b. Comparisons of Yield , Water Use Efficiency , and Soil Microbial Biomass as Affected by the Sys-tem of Rice Intensification. Communications in Soil Science and Plant Analysis, (January 2013), pp.1 – 12.
Zhu Z-L, Cai G-X, Simpson JR, Zhang SL, Chen DL, Jack-son A V, and Freney JR, 1989. Processes of nitrogen loss from fertilizers applied to flooded rice fields on a calcareous soil in north-central China. Fertil-izer Research, 18, pp.101 – 115.

376 References
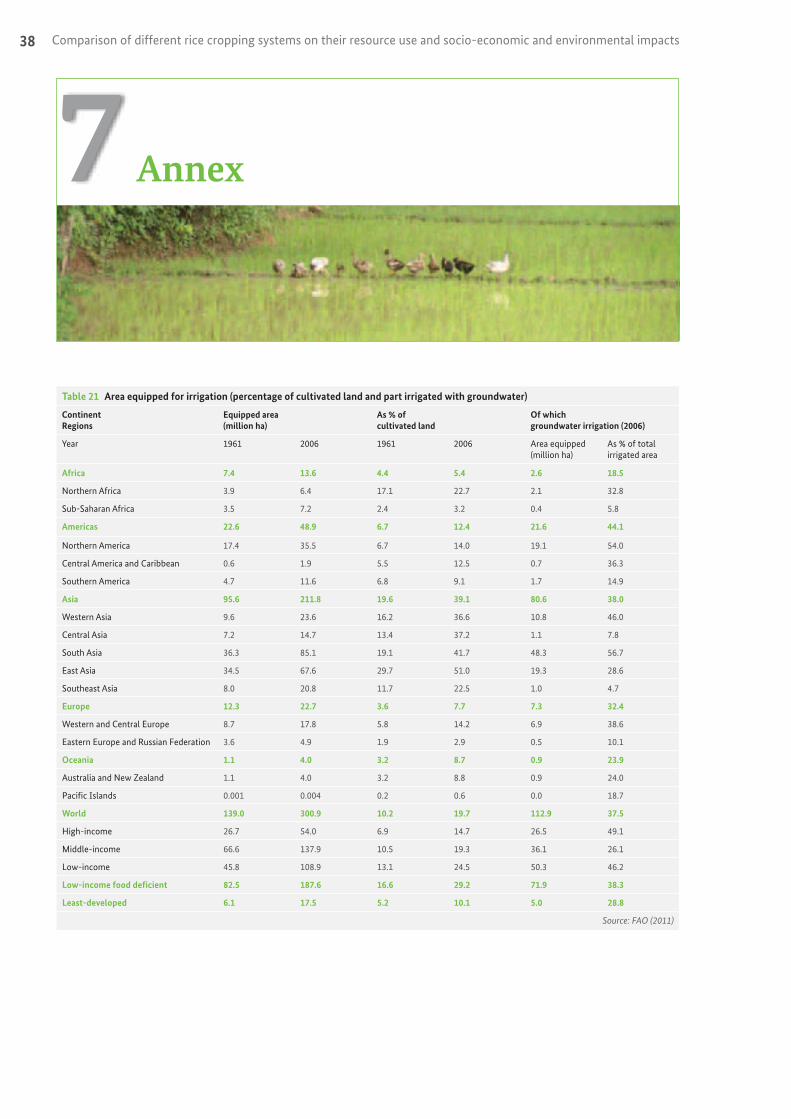
Comparison of different rice cropping systems on their resource use and socio-economic and environmental impacts38
7 Annex
Table 21 Area equipped for irrigation (percentage of cultivated land and part irrigated with groundwater)
Continent Regions
Equipped area (million ha)
As % of cultivated land
Of which groundwater irrigation (2006)
Year 1961 2006 1961 2006 Area equipped (million ha)
As % of total irrigated area
Africa 7.4 13.6 4.4 5.4 2.6 18.5
Northern Africa 3.9 6.4 17.1 22.7 2.1 32.8
Sub-Saharan Africa 3.5 7.2 2.4 3.2 0.4 5.8
Americas 22.6 48.9 6.7 12.4 21.6 44.1
Northern America 17.4 35.5 6.7 14.0 19.1 54.0
Central America and Caribbean 0.6 1.9 5.5 12.5 0.7 36.3
Southern America 4.7 11.6 6.8 9.1 1.7 14.9
Asia 95.6 211.8 19.6 39.1 80.6 38.0
Western Asia 9.6 23.6 16.2 36.6 10.8 46.0
Central Asia 7.2 14.7 13.4 37.2 1.1 7.8
South Asia 36.3 85.1 19.1 41.7 48.3 56.7
East Asia 34.5 67.6 29.7 51.0 19.3 28.6
Southeast Asia 8.0 20.8 11.7 22.5 1.0 4.7
Europe 12.3 22.7 3.6 7.7 7.3 32.4
Western and Central Europe 8.7 17.8 5.8 14.2 6.9 38.6
Eastern Europe and Russian Federation 3.6 4.9 1.9 2.9 0.5 10.1
Oceania 1.1 4.0 3.2 8.7 0.9 23.9
Australia and New Zealand 1.1 4.0 3.2 8.8 0.9 24.0
Pacific Islands 0.001 0.004 0.2 0.6 0.0 18.7
World 139.0 300.9 10.2 19.7 112.9 37.5
High-income 26.7 54.0 6.9 14.7 26.5 49.1
Middle-income 66.6 137.9 10.5 19.3 36.1 26.1
Low-income 45.8 108.9 13.1 24.5 50.3 46.2
Low-income food deficient 82.5 187.6 16.6 29.2 71.9 38.3
Least-developed 6.1 17.5 5.2 10.1 5.0 28.8
Source: FAO (2011)

39
Table 22 Typical daily rates of water outflows and seasonal water input in lowland rice production in the tropics
Daily (mm per day) Duration (days) Season (mm)
Land preparation
Land soaking 100 – 150
Evaporation 4 – 6 7 – 30 28 – 180
Seepage and percolation 5 – 30 7 – 30 35 – 900
Total land preparation 160 – 1580
Crop growth period
Evapotranspiration
Wet season 4 – 5 100 400 – 500
Dry season 6 – 7 100 600 – 700
Seepage and percolation
Heavy clays 1 – 5 100 100 – 500
Loamy/sandy soils 15 – 30 100 1500 – 3000
Total crop growth 500 – 3700
Total seasonal water input 660 – 5280
Typical range of values for total seasonal water input 1000 – 2000
Source: Tuong and Bouman (2003)

Comparison of different rice cropping systems on their resource use and socio-economic and environmental impacts40
Table 23 Characteristics of selected indigenous rice varieties with yields reported to be higher than 6 t/ha, cultivated in India
Code Variety name Habitat Dura-tion (days)
Tillers/plant
Panicle length (cm)
% Pani-cles
Grains/panicle
Grain yield (t/ha)
Stress toler-ance
Grain grade
Special features
AP-2 Lohondi Lowland 150 17 25 90 200 6 1 2 1, F2, no need to parboilPRG7 Rongochuri Lowland 120 40 18 38 120 6.2 1, 3, 4 2 1, F1, Biryani making, grain elongation on
cookingCHP-1 Kalinga Med Upland 90 25 20 90 200 6.2 1 2 1, Summer paddy, Rs 10/kgCR-2 Jhumpuri Lowland 160 32 30 93 290 6.2 1 2 1, Straw is strong, this is alternated with
Champaisiari for avoiding weedsDS-1 Asamchudi Lowland 135 25 27 100 385 6.2 1, 3, 4 2 1, High satiety, rice porridge (Pejh, Amat),
rice beer (Landah)DS-12 Ramipareva Med Upland 130 15 25 100 346 6.2 3, 4 2 1, 2, 3GYPM-1 Puiri Lochai Med Upland 125 43 24 100 275 6.2 1, 3, 4 2 1, Rs 12.5/kgAP-1 Jeeraphul Lowland 150 50 25 90 200 6.4 1 2 1, F2, no need to pairboilSAM8 Tulsibas Med Upland 135 21 29 13 355 3.5 2 F2, rice tate 50/kg, ratooningDS-11 Bandiluchai Lowland 135 23 NA 100 390 6.7 1, 3, 4 2 1, 3, 4, rice porridge (Pejh, Amat), grain elon-
gation on cookingPRG8 Sopori Lowland 150 45 25 40 140 6.9 3, 4 3 F1, Ptha making, testes sweetCR-1 Champaisiari Lowland 160 35 32 95 320 7 2 (30d) 2 1, tasty, preferred by poorGVK-1 Jauphur Med Upland 145 70 19 100 280 7 1, 3, 4, 2 1, F2, Rice – 50/kgSAM10 Sarogoto Med Upland 135 26 29 23 350 7 3 1, fine non-scented rice, short-length straw
suitable as fodderSAM7 Mourikhas Lowland 140 22 30 18 345 7 2 F2, rice –Rs 50-55/kgSAM9 Khajurcheri Med Upland 128 25 25 NA 245 7 3 1, fine non-scented rice, good as raw & par-
boiled, cross-pollinating cluster variety CHP-3 Dhaniaphul Lowland 140 45 25 90 330 7.2 1 1KP-1 Bhataphul Med Upland 95 25 28 100 300 7.2 1, 3, 4 1 1, F2KP-2 Birholi Med Upland 95 25 28 100 300 7.2 1; 3; 4 1 1, F2CHP-6 Kumdhen Lowland 110 25 25 25 250 7.4 1 2 1, F2GYPM-2 Lal Lochai Med Upland 125 33 23 100 250 7.4 1, 3, 4 2 1, Rs 12.5/kgSSS-4 Kalajeera Lowland 145 20 25 100 NA 7.4 1 1, F2DS-13 Lolmokro Lowland 135 15 27 100 271 7.5 1, 3, 4 2 1, F1, tastyCR-6 Latamohu Lowland 160 43 30 97 250 7.6 1 2 1CR-8 Kalachampa Med Upland 150 37 34 85 327 7.6 1 2 1CHP-2 Kajiri Lowland 135 45 25 90 285 8 2 1DS-2 Kurulubuti Lowland 135 19 26 100 271 8 1, 3 4 2 1, rice porridge (Pejh, Amat), less breaking
while millingSAM6 Radhatilak Med Upland 135 21 29 17 345 8 2 1, F2, rice rate- Rs50/kgCHP-4 Mahsuri Lowland 125 55 25 90 285 8.4 2 1, tasty, Rs 10/kgSS-7 Adanbargi Lowland 100 35 28 90 225 8.8 1, 3, 4 2 1SAM3 Agnilal Med Upland 130 16 26 11 220 9 4 (Blast) 2 1, 7 -
SAM4 Red 1009 Med Upland 135 27 25 22 232 9 2 1, 2, 3, strong straw used for growing mush-rooms and thatching
SAM5 Laluchura Med Upland 130 25 29 18 245 9 2 1, 2, 4, bold variety preferred by economical-ly-weaker sections, straw good for thatch-ing
SS-5 Kanchan Safri Med Upland 110 80 28 90 275 9.2 1, 3, 4 3 1SS-6 Kumlichudi 120 45 28 90 275 9.2 1, 3, 4 2 1SAM2 Sungibaram 130 21 29 18 285 10 4 (Blast) 2 1SS-4 Bashabhog Med Upland 120 43 32 90 350 10.4 1 2 1, F2SAM1 Talomuli Med Upland 130 31 30 18 280 11 1, 3 2 1, 4Note: Stress tolerance- 1-Drought, 2-Flood, 3-Pests, 4-Diseases; Grain grade- 1-Round, 2-Bold, and 3-Slender; Special features- 1-Daily cooking, 2-Puffed rice, 3-Rice flakes, 4-Popped rice, 7-Medicinal, F1- Light-scented, F2-Strong-scented
Source: Banerjee (2013)
Table 24 Changes of grain yield of different varieties in the dry season (DS) and wet sea-son (WS) of 2001–2003 comparing aerobic conditions with flooded conditions
Rice Type Variety Aerobic vs. flooded
2001 2002 2003
DS WS DS WS DS WS
Upland Apo -13,8 -21,1 -22,8 -30,1 -41,2 -29,9
IR43 -39,7 -14,1 -21,2 -6,4
UPLRI5 -44,4 -24
Lowland B6144F -33,8
IR73868H -19,6
IR64 -33,9
Magat -16,1 -23,4 -33,2 -24,5
LSD (0.05)
Source: calculated based on Bouman et al. (2005)
417 Annex

Published by Deutsche Gesellschaft für Internationale Zusammenarbeit (GIZ) GmbH
Registered offices Bonn and Eschborn, Germany
Sector project Agricultural Policies and Food Security Sector project Sustainable Agriculture (NAREN) Dag-Hammarskjöld-Weg 1-5 65760 Eschborn Germany Tel. +49 (0) 6196 79-0 Fax +49 (0) 6196 79-1115
[email protected]; [email protected] www.giz.de/food-security; www.giz.de/sustainable-agriculture
Author Dr Simone Kathrin Kriesemer, University of Hohenheim, Germany
Design and layout Ira Olaleye, Eschborn, Germany
Printed by TOP Kopie, Frankfurt a.M., Germany Printed on FSC-certified paper
Photo credits Cover: © GIZ/Andreas Springer-Heinze; Pg. 1, 2: © Ira Olaleye; Pg. 3, 4, 5 left, 12, 28 left, 31: © AfricaRice/K. Senthilkumar, Madagascar; Pg. 6, 9, 11, 27, 29, 32, 36,37, 39: © Simone Kathrin Kriesemer; Pg. 8: © AfricaRice; Pg. 5 right, 28 right: © AfricaRice/R. Raman; Pg. 34: © Takako Takahatake
As at November 2013
GIZ is responsible for the content of this publication.
On behalf of Federal Ministry for Economic Cooperation and Development (BMZ) Division Rural development; agriculture; food security
Addresses of the BMZ offices
BMZ Bonn Dahlmannstraße 4 53113 Bonn Germany Tel. +49 (0) 228 99 535-0 Fax +49 (0) 228 99 535-3500
BMZ Berlin Stresemannstraße 94 10963 Berlin Germany Tel. +49 (0) 30 18 535-0 Fax +49 (0) 30 18 535-2501
[email protected] www.bmz.de