review of dairy market indicators - microsoft · independent review of market indicators used in...
TRANSCRIPT
Review of Dairy Market Indicators
April 2014
A report produced by Ken Burgess Associates on behalf of AHDB/DairyCo

Review of Dairy Market Indicators
Contents
Executive Summary i
1. INTRODUCTION 1
1.1 Background to the review 1
1.2 IMPE and its context 1
1.3 Review objectives 2
1.4 Methodology 3
2. DEVELOPMENT OF IMPE/AMPE/MCVE INDICATORS 5
2.1 IMPE 5
2.2 AMPE 9
2.3 MCVE 10
2.4 Feedback on usefulness of indicators 11
3. INTERNATIONAL INDICATORS 12
3.1 International approaches to reporting milk price trends 12
3.2 Trends in international milk price indicators 15
4. CONVERSION FACTORS 16
4.1 Review of current factors 16
4.2 Mass balance approach 22
4.3 Summary 26
5. PROCESSING COST 29
5.1 Scope of processing cost 29
5.2 Availability of commercial data 32
5.3 Published data – USA 32
5.4 Published data – Europe 33
5.5 Cost engineering approach 35
5.6 Comparison of cost estimates 38
5.7 Summary 39
6. COMMODITY PRICES 41
7. REVIEW OF FINDINGS 43
7.1 Dairy market indicators 43
7.2 Conversion factors 43
7.3 Processing costs 44
7.4 Standardised SMP 45
8. CONCLUSIONS AND RECOMMENDATIONS 46

Review of Dairy Market Indicators
8.1 Review objectives 46
8.2 Recommendations 47
References 49
Appendices 51
i
Executive Summary
This report sets out findings and recommendations from an independent review into
two milk price indicators, the Actual Milk Price Equivalent (AMPE) and the Milk for
Cheese Volume Equivalent (MCVE). The review was commissioned by
AHDB/DairyCo in response to industry feedback to the effect that these indicators
may no longer be accurate due to changes in processing costs and practices since
they were originally developed.
A key feature of milk price market indicators is that ‘they are what they say on the
tin’, ie simply indicators rather than absolute values. Discussions with industry as
part of the review highlighted that there can never be a ‘correct’ processing cost.
There is variability in costs across different processing plants and factors such as
milk composition, plant utilisation and efficiency will affect this. The value of market
indicators is as a basis for identifying trends and to attempt to use them for more
precise purposes goes beyond the limits of their scope and accuracy.
Organisations consulted as part of the review felt there was a need for reliable price
indicators as a basis for monitoring trends in milk product price movements. Both the
production and processing sides of the supply chain gave positive feedback
regarding the usefulness of the indicators. They are a subject of weekly review by
producers bodies and some processing organisations now include them in their
pricing formulae.
The market indicators use conversion factors which outline the number of litres of
milk required to produce a tonne of final product. The review found that for both
AMPE and MCVE current conversion factors are broadly correct within the natural
variations of milk composition and manufacturing efficiency. The exceptions to this
general statement were that the current mild Cheddar conversion factor was found to
be slightly less than is currently achievable, while the whey butter factor needs
amending. However, the latter has only a very low impact on the MCVE value and,
indeed, some cheese market indicators in other countries do not include it.
The review of the AMPE indicator revealed that the market has now largely moved
from producing conventional SMP (skimmed milk powder [which is used in the
current AMPE indicator]) to protein standardised SMP. Revised conversion factors
and process costs for standardised SMP are given in the report, and it was
recognised that, in practice, this product would have only one regular manufacturer
in the UK. In view of the commercial sensitivity of such a situation, an independently
published EU processing cost for standardised SMP should be used in the AMPE
formula.
ii
A review of the processing costs of the main commodities began with defining which
cost elements from the supply chain should be included, and what level of plant
utilisation should be assumed. The cost elements selected for inclusion were the
plant-based variable and fixed manufacturing costs. Evidence shows that there is a
large variation in these across different plants. Variation in manufacturing plant
utilisation was shown to have a very large impact on unit processing cost. Other
factors impacting on variable costs include energy source (eg. gas v fuel oil),
flexibility of labour redeployment and efficiency differences related to the age of the
technology used. Fixed cost variability is seen in widely different depreciation costs
depending on the age of the investment, and the way in which general site
overheads are allocated between a site’s portfolio of products. The variability in
these factors serves to re-emphasise the earlier point that there can never be a
single ‘correct’ processing cost figure.
It was recommended that intervention system costs, such as transport to store and
payment delay, (which were taken from the IMPE formula) are excluded from the
AMPE formula because they are no longer relevant to its context or purpose. The
inclusion (or not) of a profit margin is a matter of policy, with a balance of arguments
for and against. However, the key point here is that the AMPE and MCVE are market
indicators and not quasi-regulated prices to be used as the basis of a milk auction
system (the context of the OFT IMPE margin formula).
The estimates provided must, therefore, be seen in this context as broad, general
estimates rather than actual production costs at specific plants. Their key value as
part of a market indicator is to provide a base against which trends in wholesale
product prices can be translated back into a milk equivalent.
Direct collection and collation of processing costs proved challenging because of the
confidential nature of commercial cost information. For this reason, cost estimates
for the key commodities were generated from factored cost estimates, and cross-
checked against US and EU data for robustness. The factory-based manufacturing
costs for butter, conventional SMP, mild cheddar and whey powder were estimated
at £237, £352, £322 and £340 per tonne, respectively.
The processing costs for powders in particular have increased significantly since
2003/4 due to the marked increase in energy prices. As a result of such cost input
changes, it is recommended that the cost factors are in future reviewed on a regular
(three to five-yearly) basis.
The report concludes that there is a need to communicate the changes arising from
the review. AHDB/DairyCo must detail the changes they will make to the indicators
with a clear changeover timetable.

Report produced by Ken Burgess Associates on behalf of DairyCo 1
1. Introduction
Ken Burgess Associates were appointed by AHDB/DairyCo to undertake an
independent review of market indicators used in the GB dairy sector. This report
presents the findings of this review.
1.1 Background to the review
AHDB/DairyCo publishes two milk price indicators, the Actual Milk Price Equivalent
(AMPE) and the Milk for Cheese Volume Equivalent (MCVE), as part of its market
information service aimed at increasing the transparency of dairy markets.
Comparing trends in these indicators with trends in farm gate prices is seen by
DairyCo as providing a method for assessing how well and quickly transmission of
price changes feed down the milk supply chain.
AMPE was adapted from the earlier Intervention Milk Price Equivalent (IMPE)
indicator in approximately 2000, and MCVE was developed by DairyCo in
approximately 2005. In recent years, DairyCo has noted how some processing costs
(notably energy) have increased which may mean the indicators are no longer
accurate. DairyCo, therefore, decided to instigate an independent review of the
method of calculation.
This report sets out the results of that review, starting with a consideration of the
original IMPE indicator from which the AMPE and MCVE indicators developed.
1.2 IMPE and its context
The Intervention Milk Price Equivalent (IMPE) was an integral part of the intervention
system, itself one of the key tools for regulating the dairy sector market in the
European Community1. The IMPE was seen as the floor to the milk price provided by
the intervention system, and a key indicator as to the degree to which the Target
Price was being achieved. The target price was the politically established return that
milk producers were expected to receive.
The IMPE was calculated from actual intervention prices, the cost of converting the
raw milk into butter and skimmed milk powder (SMP), and the yield of these
products. An example of an early calculation taken from Dairy Facts and Figures
1991 is given in Table 1.
1 EC Regulation 804/68

Report produced by Ken Burgess Associates on behalf of DairyCo 2
Table 1. IMPE derivation from 1991
Butter
(at 82% fat)
Skimmed Milk
Powder
Intervention price (£/tonne) 2142.53 1302.97
less processing margin (£/tonne) 203.39 190.90
equals Raw Material Value of Product (£/tonne) 1939.14 1112.07
divide by Yield Factor (litres/tonne) 21990 10680
equals Raw Material Value for milk (pence/litre) 8.82 10.41
Total equals IMPE (pence/litre) 19.23
Source: Dairy Facts and Figures 1991
The IMPE was a ‘delivered to dairy’ price for milk with a butterfat content of 3.7%,
and it has often been the subject of controversy and disagreement over the years.
This is because the conversion factors and costs were provided by a combination of
sources2, reflecting one or two member states in particular, and were never
consulted or agreed across the EU.
Dairy Facts and Figures (1991) notes that ‘both costs and yield will vary according to
the factory carrying out the conversion and also on the level of solids in the milk’.
These factors are two of the key considerations in the review of the AMPE and
MCVE indicator calculations, and they are analysed in detail in sections 4 and 5.
1.3 Review objectives
The overall aim of the review involved assessing the existing AMPE/ MCVE formulas
and providing recommendations on whether, and if so how, the market indicators
should be changed. In addition, responses are provided for the following specific
questions:
1. Are the estimated production costs in the formulas accurate and
representative?
2. Are the yield conversion factors within the formulas representative of what
is achieved by industry across Europe?
3. We expect that the utilisation of capacity within plants will have a
significant bearing on efficiency:
2 Including the European Commission, Assilec and European Dairy Association (EDA)

Report produced by Ken Burgess Associates on behalf of DairyCo 3
- What level of utilisation is there across plants for the different products?
- Should there be an assumed level of utilisation going forward?
4. Does the use of UK (general spot) wholesale prices for butter, powder,
whey and Cheddar provide a helpful measure of the market?
5. Should the indicators include estimations of profit margin (return on
capital), as they do currently?
Consult with the processing side of the industry to assess:
6. How are AMPE/ MCVE viewed by the industry?
7. Should DairyCo issue an estimated transport cost figure alongside the
market indicators, as they do currently?
1.4 Methodology
In order to address these objectives, a range of information gathering exercises were
undertaken before analysing the feedback and collating this report.
Following a project initiation meeting with AHDB/DairyCo, a data gathering exercise
was undertaken starting first with a literature review of commercial information about
the IMPE and its history, and the development of the AMPE and MCVE indicators.
This review was supplemented by meetings with industry personnel from Dairy UK,
Dairy Industry Newsletter (DIN) and others who were working in the industry in the
1990s and 2000s. These gave rise to new leads and searches for supplementary
background reports.
The academic and commercial technical literature was then reviewed to retrieve
information on conversion yields and costs. Following this, meetings were held with
processors of relevant products to elicit their ideas and attitudes towards the
indicators, and the conversion costs and factors currently in use. These discussions
also included the use of wholesale prices in margin calculations. Telephone
interviews were also conducted with policy officers from the farming unions.
Information gathering was also extended by discussion with key personnel within IDF
member countries on both the indicators and conversion factors used in their
countries. In view of the similarities between Irish and UK commodity product
operations, a visit was also made to University College Dublin and Teagasc
Moorepark in Ireland to review the development of dairy processing cost models that
have been in development there for the past five years.

Report produced by Ken Burgess Associates on behalf of DairyCo 4
The remainder of this report is structured into four main sections which present
findings from the review. Firstly, section 2 presents details of dairy market indicators
in terms of their origin and development, leading up to the current AMPE and MCVE
indicators and the nature of their calculation. Section 3 then goes on to review how
these types of market indicators operate in other parts of the world.
Section 4 starts to review the conversion factors used in the AMPE and MCVE
calculations, both in relation to published data and to calculated factors based on a
mass balance approach. The nature of processing costs is covered in Section 5,
looking at costs structures in the US and Ireland before establishing estimates of
cost structures for the main dairy commodities.
Section 6 briefly reviews feedback on the use of wholesale prices in the AMPE and
MCVE models, before the findings of the study are reviewed in section 7, and finally
recommendations made in section 8.
Report produced by Ken Burgess Associates on behalf of DairyCo 5
2. Development of IMPE/AMPE/MCVE indicators
This secion of the report looks at how the IMPE came about and was used, and the
industry discussions over its calculation following the breakup of the Milk Marketing
Board system in 1994. The introduction of the AMPE indicator is then reviewed, and
its development tracked to demonstrate the continuity of the calculation of the margin
element from its inception to the present day.
2.1 IMPE
History of IMPE development to 2000
As mentioned in the introduction, the origin of the IMPE was as a policy instrument
for assessing the degree to which producers within the European Community were
being paid the target price. Within the UK, the context of the IMPE then changed
after the mid-1990s following the deregulation of the Milk Marketing Boards.
Under the Milk Marketing Schemes there had been a well-established process for
the determination of milk prices between the Milk Marketing Boards (MMBs) and the
Dairy Trade Federation (DTF), which represented processors. Following
deregulation, Milk Marque, the main successor body to the England and Wales
MMB, tried to establish its own selling process for milk. However, this was
challenged by the processors, eventually leading to the involvement of the Office of
Fair Trading (OFT) in 1996.
One of the specific interventions of the OFT was in allowing Milk Marque to put a
floor in their market, and that was to be the IMPE. However, there was a dispute
between Milk Marque and the Dairy Industry Federation (the successor organisation
to the DTF) as to how the IMPE should be calculated. These differences are
summarised in Table 2, together with the cost parameters imposed by the OFT at
the time (1997).

Report produced by Ken Burgess Associates on behalf of DairyCo 6
Table 2. 1997 Milk Marque & DIF proposed IMPE calculations, with OFT version
Milk Marque Dairy Industry
Federation (DIF)
OFT
Product yields
Butter (litres/tonne) 20,273 20,485 20,273
SMP (litres/tonne) 10,855 11,172 10.855
Costs:
Payment delay 0.42
Transport to store 0.17
BMP dilution 0.05
Direct process costs 1.39
Overheads 2.02
Profit (3%) 0.76
Total manufacturing costs 3.7 4.81 4.355
Source: DIN
There are a number of additional elements included in the DIF cost analysis. This
includes costs of using the intervention system (delayed payment and the interest
incurred, transport to intervention stores), the practical reality of the butter/SMP
manufacturing process resulting in production of a quantity of buttermilk powder
(BMP), which has a lower price than SMP, and the provision of a profit element.
At the time of its first review of the IMPE in 1997, the OFT imposed a simple
manufacturing cost figure (the 4.355 ppl), although this figure was subject to minor
adjustments depending on exchange rates. The OFT manufacturing cost figure was
reported at the time as being simply a compromise between Milk Marque and DIF
submissions. The OFT also retained the Milk Marque conversion factors.
The OFT continued to monitor the IMPE situation and, in March 2000, a further
version of the IMPE was published (see Table 3), which more specifically set out the
elements within the total processing margin.
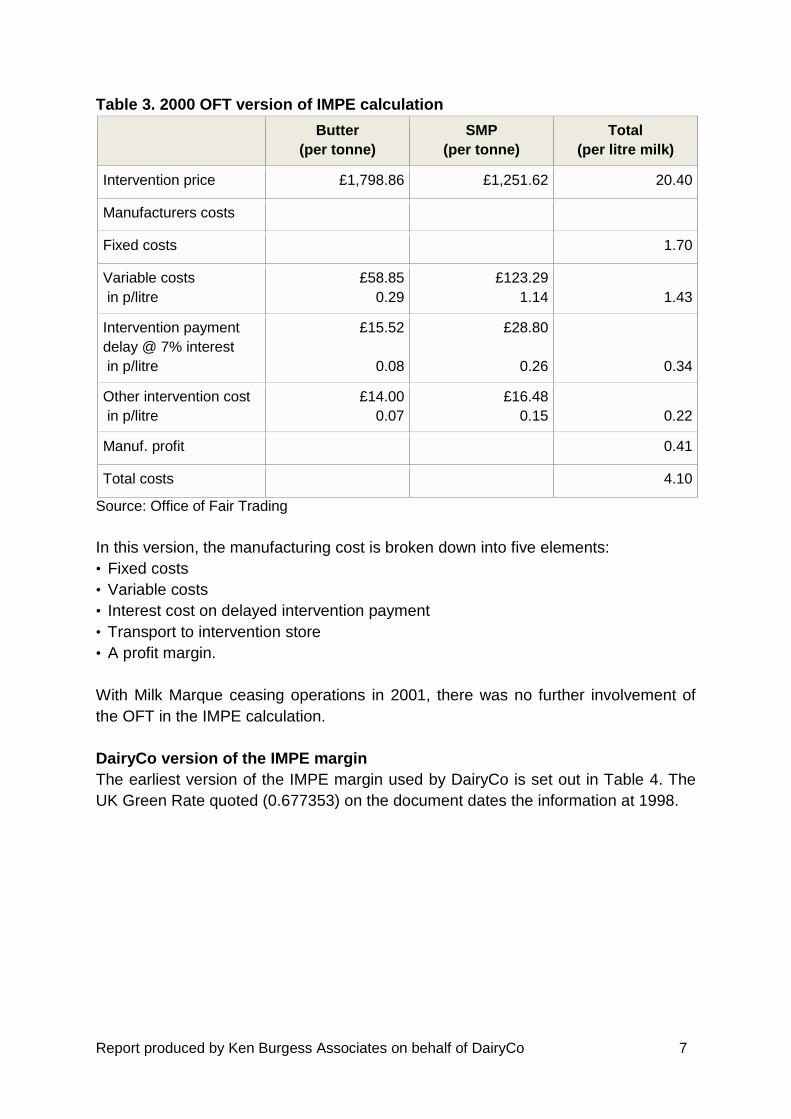
Report produced by Ken Burgess Associates on behalf of DairyCo 7
Table 3. 2000 OFT version of IMPE calculation
Butter
(per tonne)
SMP
(per tonne)
Total
(per litre milk)
Intervention price £1,798.86 £1,251.62 20.40
Manufacturers costs
Fixed costs 1.70
Variable costs
in p/litre
£58.85
0.29
£123.29
1.14 1.43
Intervention payment
delay @ 7% interest
in p/litre
£15.52
0.08
£28.80
0.26 0.34
Other intervention cost
in p/litre
£14.00
0.07
£16.48
0.15 0.22
Manuf. profit 0.41
Total costs 4.10
Source: Office of Fair Trading
In this version, the manufacturing cost is broken down into five elements:
• Fixed costs
• Variable costs
• Interest cost on delayed intervention payment
• Transport to intervention store
• A profit margin.
With Milk Marque ceasing operations in 2001, there was no further involvement of
the OFT in the IMPE calculation.
DairyCo version of the IMPE margin
The earliest version of the IMPE margin used by DairyCo is set out in Table 4. The
UK Green Rate quoted (0.677353) on the document dates the information at 1998.
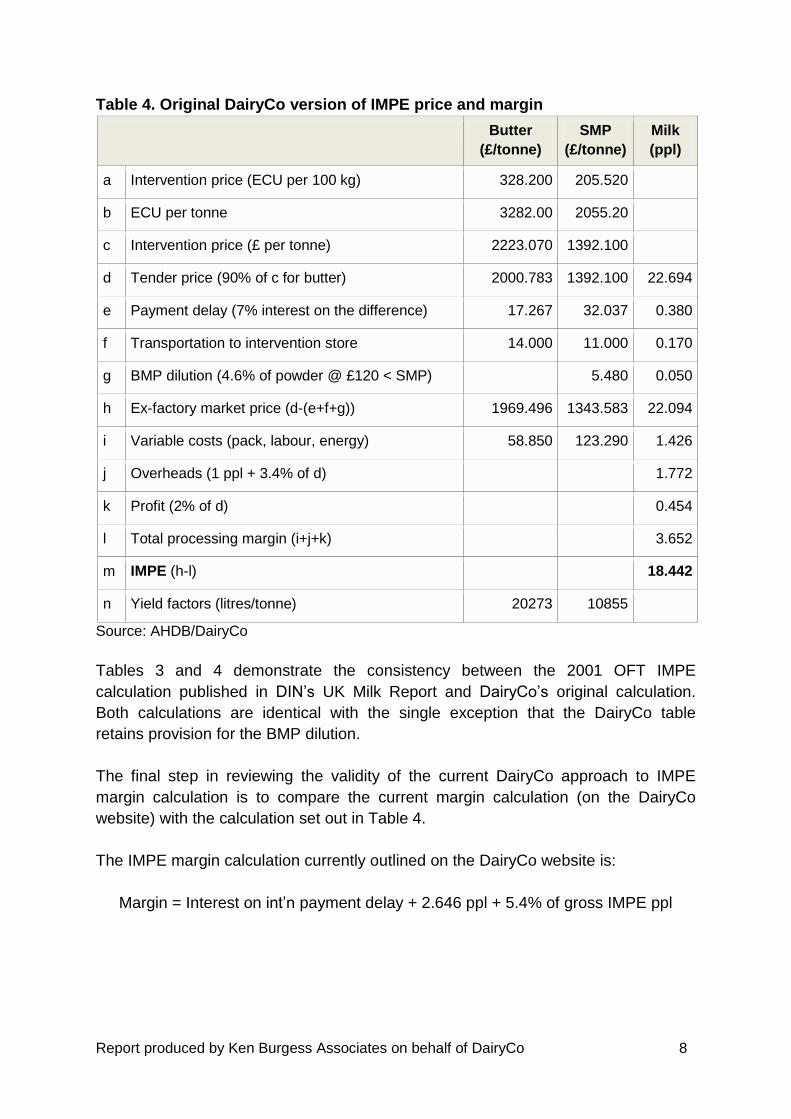
Report produced by Ken Burgess Associates on behalf of DairyCo 8
Table 4. Original DairyCo version of IMPE price and margin
Butter
(£/tonne)
SMP
(£/tonne)
Milk
(ppl)
a Intervention price (ECU per 100 kg) 328.200 205.520
b ECU per tonne 3282.00 2055.20
c Intervention price (£ per tonne) 2223.070 1392.100
d Tender price (90% of c for butter) 2000.783 1392.100 22.694
e Payment delay (7% interest on the difference) 17.267 32.037 0.380
f Transportation to intervention store 14.000 11.000 0.170
g BMP dilution (4.6% of powder @ £120 < SMP) 5.480 0.050
h Ex-factory market price (d-(e+f+g)) 1969.496 1343.583 22.094
i Variable costs (pack, labour, energy) 58.850 123.290 1.426
j Overheads (1 ppl + 3.4% of d) 1.772
k Profit (2% of d) 0.454
l Total processing margin (i+j+k) 3.652
m IMPE (h-l) 18.442
n Yield factors (litres/tonne) 20273 10855
Source: AHDB/DairyCo
Tables 3 and 4 demonstrate the consistency between the 2001 OFT IMPE
calculation published in DIN’s UK Milk Report and DairyCo’s original calculation.
Both calculations are identical with the single exception that the DairyCo table
retains provision for the BMP dilution.
The final step in reviewing the validity of the current DairyCo approach to IMPE
margin calculation is to compare the current margin calculation (on the DairyCo
website) with the calculation set out in Table 4.
The IMPE margin calculation currently outlined on the DairyCo website is:
Margin = Interest on int’n payment delay + 2.646 ppl + 5.4% of gross IMPE ppl

Report produced by Ken Burgess Associates on behalf of DairyCo 9
These three components compare to the calculation in Table 5 as follows:
Table 5: Comparison of current and original DairyCo margin elements
Current DairyCo margin element Original DairyCo element (from Table 4)
Interest on intervention payment delay Interest on intervention payment delay (line e)
2.646 ppl 1 ppl (part of overheads, from line j)
+ 1.426 ppl (variable costs, from line i)
+ 0.17 ppl (transport, from line f)
+ 0.05 ppl (BMP dilution, from line g)
5.4% of gross IMPE ppl 3.4% of gross IMPE ppl (part of overheads,
line j)
+ 2% of gross IMPE ppl (profit, from line k)
Source: AHDB/DairyCo
The original (1998) Milk Development Council/DairyCo calculation and the current
published DairyCo IMPE margin are, therefore, identical in content, albeit differently
expressed.
This may go some way to providing an explanation to those in the industry not
involved at the original time, and unsure of the elements of the margin. However, in
re-arranging the way the elements are organised to simplify the calculation, some
meaning has been lost as both the 2.646 ppl static and 5.4% figure include elements
of overheads.
The important conclusion here is that the current IMPE margin published by DairyCo
is the calculation agreed by the OFT in the late 1990s and is, therefore, the
recognised independent version.
It should also be remembered here that the IMPE margin and its development were
in the context of the IMPE price and the EU’s formal Intervention System for butter
and SMP.
2.2 AMPE
The IMPE remained a relevant indicator of the lowest milk price for a number of
years following the deregulation of the MMBs, but, in 2000, this was seriously
questioned when the market prices for butter and SMP in the EU rose significantly
above the support levels offered by the intervention system.
This led to the introduction of the ‘Actual Milk Price Equivalent’ by the Dairy Industry
Newsletter (DIN). The AMPE is calculated by the same formula as the IMPE, with
intervention support prices replaced by actual market prices. The AMPE is now the
Report produced by Ken Burgess Associates on behalf of DairyCo 10
key UK milk price indicator used for following movements in commodity butter and
SMP prices as they relate back to milk price.
While the AMPE maintains currency with regard to product market prices, the margin
used in the calculation is the original IMPE margin. The current IMPE is not
significantly different from the IMPE ten years ago, so the value of the margin is
unchanged over this period. This was not the original intention, since the third
element of the margin formula was expressed as a percentage to reflect changes in
the gross price.
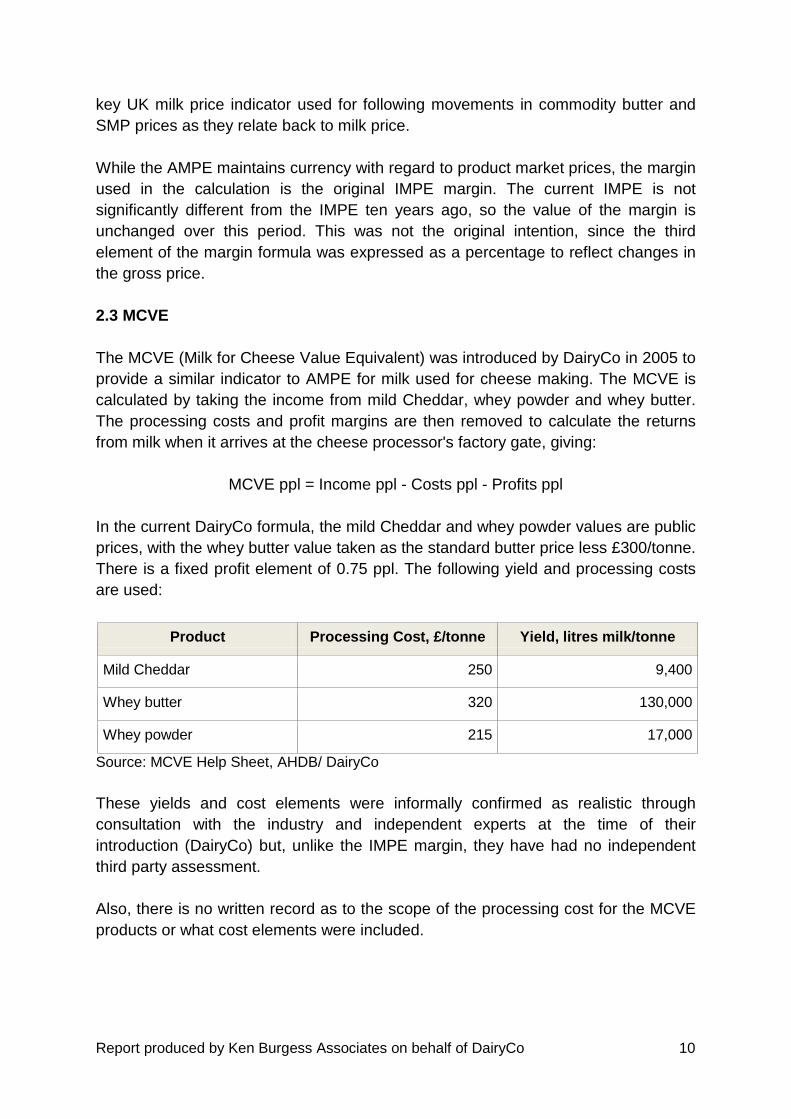
2.3 MCVE
The MCVE (Milk for Cheese Value Equivalent) was introduced by DairyCo in 2005 to
provide a similar indicator to AMPE for milk used for cheese making. The MCVE is
calculated by taking the income from mild Cheddar, whey powder and whey butter.
The processing costs and profit margins are then removed to calculate the returns
from milk when it arrives at the cheese processor's factory gate, giving:
MCVE ppl = Income ppl - Costs ppl - Profits ppl
In the current DairyCo formula, the mild Cheddar and whey powder values are public
prices, with the whey butter value taken as the standard butter price less £300/tonne.
There is a fixed profit element of 0.75 ppl. The following yield and processing costs
are used:
Product Processing Cost, £/tonne Yield, litres milk/tonne
Mild Cheddar 250 9,400
Whey butter 320 130,000
Whey powder 215 17,000
Source: MCVE Help Sheet, AHDB/ DairyCo
These yields and cost elements were informally confirmed as realistic through
consultation with the industry and independent experts at the time of their
introduction (DairyCo) but, unlike the IMPE margin, they have had no independent
third party assessment.
Also, there is no written record as to the scope of the processing cost for the MCVE
products or what cost elements were included.

Report produced by Ken Burgess Associates on behalf of DairyCo 11
2.4 Feedback on usefulness of indicators
Both the production and processing sides of the supply chain gave positive feedback
regarding the usefulness of the indicators. They are a subject of weekly review by
producers bodies and some processing organisations now include them in their
pricing formulae.
Organisations consulted felt there was a need for reliable price indicators as a basis
for monitoring trends in milk product price movements. The main use of the
indicators as establishing accurate trends and movements in milk prices was also
emphasised, as opposed to their being using as target price which a farmer can be
expected to be paid.

Report produced by Ken Burgess Associates on behalf of DairyCo 12
3. International indicators
3.1 International approaches to reporting milk price trends
Milk price indicators are used in a number of countries by various organisations to
provide indications or trends in movements of the value of milk. Data are also
published on the movements of milk product prices only, and a range of both types
of information is summarised in Table 6.
All five of the indicators used to varying extents within the UK are net indicators, ie
include a provision for deducting processing costs from the market returns. This
probably reflects the importance of this type of indicator to the particular milk selling
environment, and the fact that the processing cost from the OFT’s IMPE margin is
still relatively recent.
Table 6. A Summary of some Milk Price Indicators and Product Price Indices
Country Use of Indicator Products Scope of processing
margin
UK
AMPE Market indicator (net) Butter, SMP Processing + HO
overhead + distribution
+ profit margin
MCVE Market indicator (net) Cheese, whey powder Processing + profit
margin
UFU MPI Market indicator (net) Cheese/whey powder;
Butter/SMP; WMP
Collection +
processing + profit
margin
Scottish NFU Pricing formula (net) 20% AMPE: 80%
MCVE
NA
Dairy Group MPE Market Price Equivalent
(net)
Liquid milk, cheese,
butter and powders
“after normal
processing costs”

Report produced by Ken Burgess Associates on behalf of DairyCo 13
Country Use of Indicator Products Scope of processing
margin
EU
IMPE/EU
Commission
IMPE, World Milk Price
Equivalent: Market
indicator (net) as
comparison with target
price
Butter, SMP Processing only
France (CNIEL) Market indicator
(Previous net indicator
discontinued)
Industrial products and
fresh products
Not included (prices
only)
Germany (KIEL) Market indicator (net) Butter, SMP Processing +
distribution
Ireland (IDB) Market indicator IDB product portfolio
(replaced Butter/SMP
index)
Not included (prices
only)
Netherlands (DDB) NA: no longer computed NA NA
North America
USA (USDA) Legal Butter, SMP, cheese,
whey powder
Processing + HO
overhead + ROI
Canada (CDC) Legal Butter, SMP Processing + HO
overhead + distribution
+ ROI
Australasia
Australia Market Indicator
(Australian Export Index)
Butter, cheese, SMP,
WMP by contribution
to exports
Not included (prices
only)
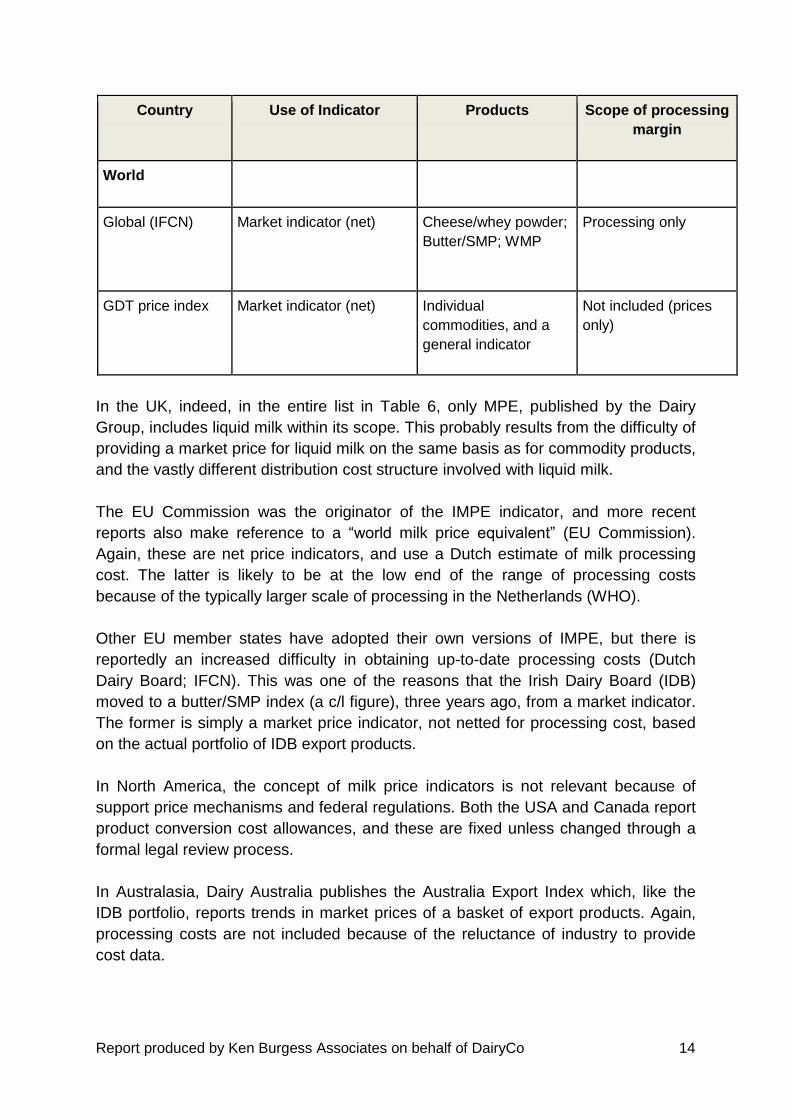
Report produced by Ken Burgess Associates on behalf of DairyCo 14
Country Use of Indicator Products Scope of processing
margin
World
Global (IFCN) Market indicator (net) Cheese/whey powder;
Butter/SMP; WMP
Processing only
GDT price index Market indicator (net) Individual
commodities, and a
general indicator
Not included (prices
only)
In the UK, indeed, in the entire list in Table 6, only MPE, published by the Dairy
Group, includes liquid milk within its scope. This probably results from the difficulty of
providing a market price for liquid milk on the same basis as for commodity products,
and the vastly different distribution cost structure involved with liquid milk.
The EU Commission was the originator of the IMPE indicator, and more recent
reports also make reference to a “world milk price equivalent” (EU Commission).
Again, these are net price indicators, and use a Dutch estimate of milk processing
cost. The latter is likely to be at the low end of the range of processing costs
because of the typically larger scale of processing in the Netherlands (WHO).
Other EU member states have adopted their own versions of IMPE, but there is
reportedly an increased difficulty in obtaining up-to-date processing costs (Dutch
Dairy Board; IFCN). This was one of the reasons that the Irish Dairy Board (IDB)
moved to a butter/SMP index (a c/l figure), three years ago, from a market indicator.
The former is simply a market price indicator, not netted for processing cost, based
on the actual portfolio of IDB export products.
In North America, the concept of milk price indicators is not relevant because of
support price mechanisms and federal regulations. Both the USA and Canada report
product conversion cost allowances, and these are fixed unless changed through a
formal legal review process.
In Australasia, Dairy Australia publishes the Australia Export Index which, like the
IDB portfolio, reports trends in market prices of a basket of export products. Again,
processing costs are not included because of the reluctance of industry to provide
cost data.
Report produced by Ken Burgess Associates on behalf of DairyCo 15
Finally, on a global basis, the GDT provides trends in world prices (both individual
commodities and an overall index), while the International Farm Comparison
Network (IFCN) reports a combined world milk price indicator. The latter is calculated
on similar lines to AMPE/MCVE based on a mix of butter/SMP; cheese (39%
moisture)/whey powder; whole milk powder. IFCN does not share their processing
costs or conversion coefficients but reports that these have not been changed since
the 1990’s (IFCN).
3.2 Trends in international milk price indicators
A consideration of some of these approaches shows that the net market indicator is
still considered worthwhile when processing costs are available. Where market
indicators are or have incorporated a product cost component, then their scope has
largely been the factory-based process conversion cost and not included transport or
a profit margin.
However, discussions with policy officers in some of these organisations confirmed
that the latter are increasingly difficult to obtain because of the competitive nature of
manufacturing and the reluctance of processors to divulge costs. This has led to
either the processing cost element not being updated for several years (e.g IFCN) or
to an increasing use of market price indices which measure product market
movements only (and not processing costs) for the product mix of the particular
country.
The use of a mixed, rather than a single, market indicator was also observed by
some to have the advantage of balancing out sporadic short-term movements in just
one of the products.
Report produced by Ken Burgess Associates on behalf of DairyCo 16
4. Conversion factors
Conversion factors have been used in the dairy industry over several decades to
relate the yield of product from a given quantity of milk. In this format they are usually
expressed as litres of milk per tonne of product.
This approach is simple to calculate and useful for indicative purposes. However, it
lacks precision because:
• The concentration of key milk product components (especially fat, protein) varies
seasonally, from year to year, by breed and even regionally.
• Milk products may vary in their content of the key milk components as a result of
product composition standardisation and compositional variation in product
varieties.
The discussion below deals with average values only, so does not take into account
variations on a seasonal or regional basis.
The scope of the conversion factors is assumed to be that of commodity rather than
specialised products. This assumes that plants are working at good manufacturing
practice levels for product yields.
4.1 Review of current factors
4.1.1 AMPE factors
The current AMPE conversion factors for butter and SMP are 20,273 and 10,855
litres per tonne, respectively. In 1996/97 Milk Marque had proposed these factors,
while the DIF had proposed 21,141kg (20,525 litres) and 11,530kg (11,172 litres) per
tonne of butter and SMP, respectively.
The DIF butter figure was actually within 1.25% of the Milk Marque figure. The DIF
SMP figure was significantly different and, while the reason for this is not fully clear,
it is known that DIF was making the point that only around 95% of the solids not fat
(SNF) in the milk went into the skimmed milk (the remainder going into the
buttermilk). This resulted in the OFT including a buttermilk dilution allowance in the
formula. The OFT accepted Milk Marque’s figures and these have been in use for
both IMPE and AMPE calculations since.
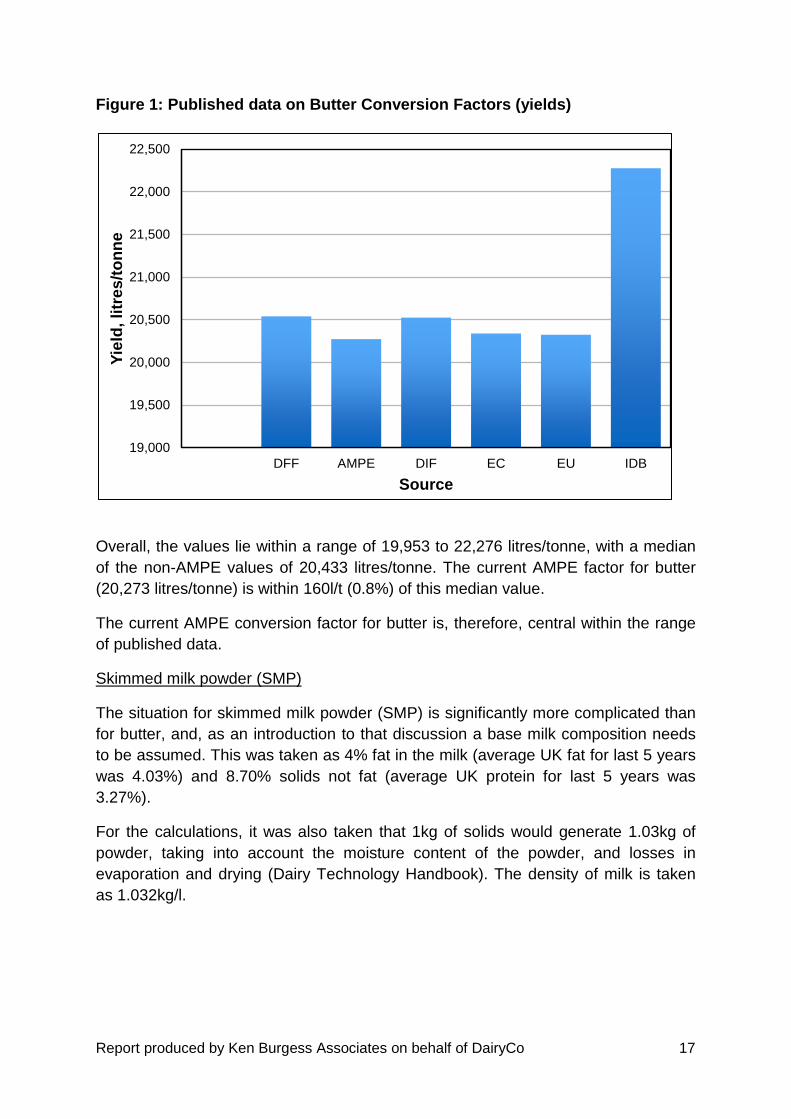
Butter
Figure 1 below compares the current AMPE conversion factor for butter with a
number of other published sources from the UK (Dairy Facts & Figures, DFF; AMPE;
DIF), the EU (EC Dairy Facts & Figures), EU) and non EU (IDB, USDA, IFCN, FAO).
The original data are tabulated in Appendix 1.
Report produced by Ken Burgess Associates on behalf of DairyCo 17
Figure 1: Published data on Butter Conversion Factors (yields)
Overall, the values lie within a range of 19,953 to 22,276 litres/tonne, with a median
of the non-AMPE values of 20,433 litres/tonne. The current AMPE factor for butter
(20,273 litres/tonne) is within 160l/t (0.8%) of this median value.
The current AMPE conversion factor for butter is, therefore, central within the range
of published data.
Skimmed milk powder (SMP)
The situation for skimmed milk powder (SMP) is significantly more complicated than
for butter, and, as an introduction to that discussion a base milk composition needs
to be assumed. This was taken as 4% fat in the milk (average UK fat for last 5 years
was 4.03%) and 8.70% solids not fat (average UK protein for last 5 years was
3.27%).
For the calculations, it was also taken that 1kg of solids would generate 1.03kg of
powder, taking into account the moisture content of the powder, and losses in
evaporation and drying (Dairy Technology Handbook). The density of milk is taken
as 1.032kg/l.
19,000
19,500
20,000
20,500
21,000
21,500
22,000
22,500
DFF AMPE DIF EC EU IDB
Yie
ld,
litr
es
/to
nn
e
Source
Report produced by Ken Burgess Associates on behalf of DairyCo 18
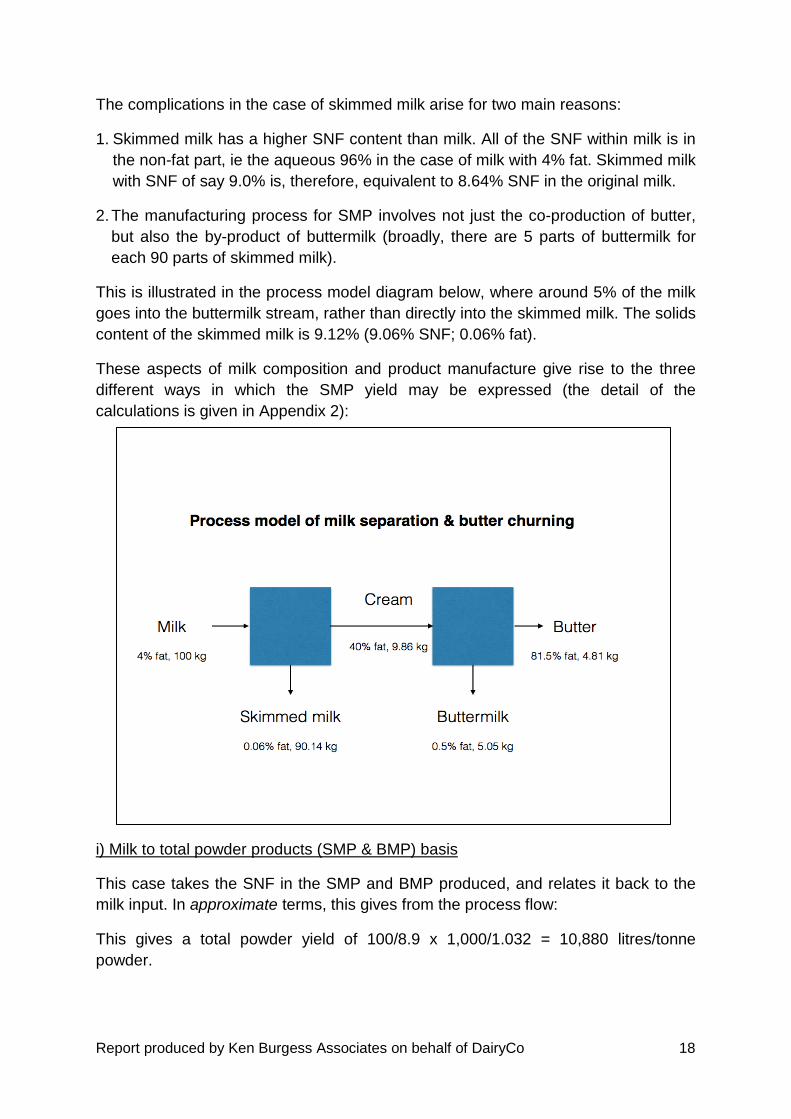
The complications in the case of skimmed milk arise for two main reasons:
1. Skimmed milk has a higher SNF content than milk. All of the SNF within milk is in
the non-fat part, ie the aqueous 96% in the case of milk with 4% fat. Skimmed milk
with SNF of say 9.0% is, therefore, equivalent to 8.64% SNF in the original milk.
2. The manufacturing process for SMP involves not just the co-production of butter,
but also the by-product of buttermilk (broadly, there are 5 parts of buttermilk for
each 90 parts of skimmed milk).
This is illustrated in the process model diagram below, where around 5% of the milk
goes into the buttermilk stream, rather than directly into the skimmed milk. The solids
content of the skimmed milk is 9.12% (9.06% SNF; 0.06% fat).
These aspects of milk composition and product manufacture give rise to the three
different ways in which the SMP yield may be expressed (the detail of the
calculations is given in Appendix 2):
i) Milk to total powder products (SMP & BMP) basis
This case takes the SNF in the SMP and BMP produced, and relates it back to the
milk input. In approximate terms, this gives from the process flow:
This gives a total powder yield of 100/8.9 x 1,000/1.032 = 10,880 litres/tonne
powder.
Report produced by Ken Burgess Associates on behalf of DairyCo 19
ii) Milk to only SMP basis
In practice, SMP and BMP are different products, so in some instances the actual
amount of specifically SMP is related back to the original milk:
This gives SMP only powder yield of 100/8.44 x 1,000/1.032 = 11,480 litres/tonne
iii) Skimmed milk to SMP basis
Another practical case is relating the SMP produced back to the skimmed, rather
than whole, milk used in its manufacture:
This gives SMP yield of 100/9.37 x 1,000/1.035 = 10,310 litres/tonne from skim
The basis for the AMPE calculation is case i), which provides for the total powder
yield resulting from the SNF in the original milk, ie the SMP and the BMP. This
conversion factor, therefore, translates one tonne of SMP equivalent back to the
number of litres of milk required for its manufacture.
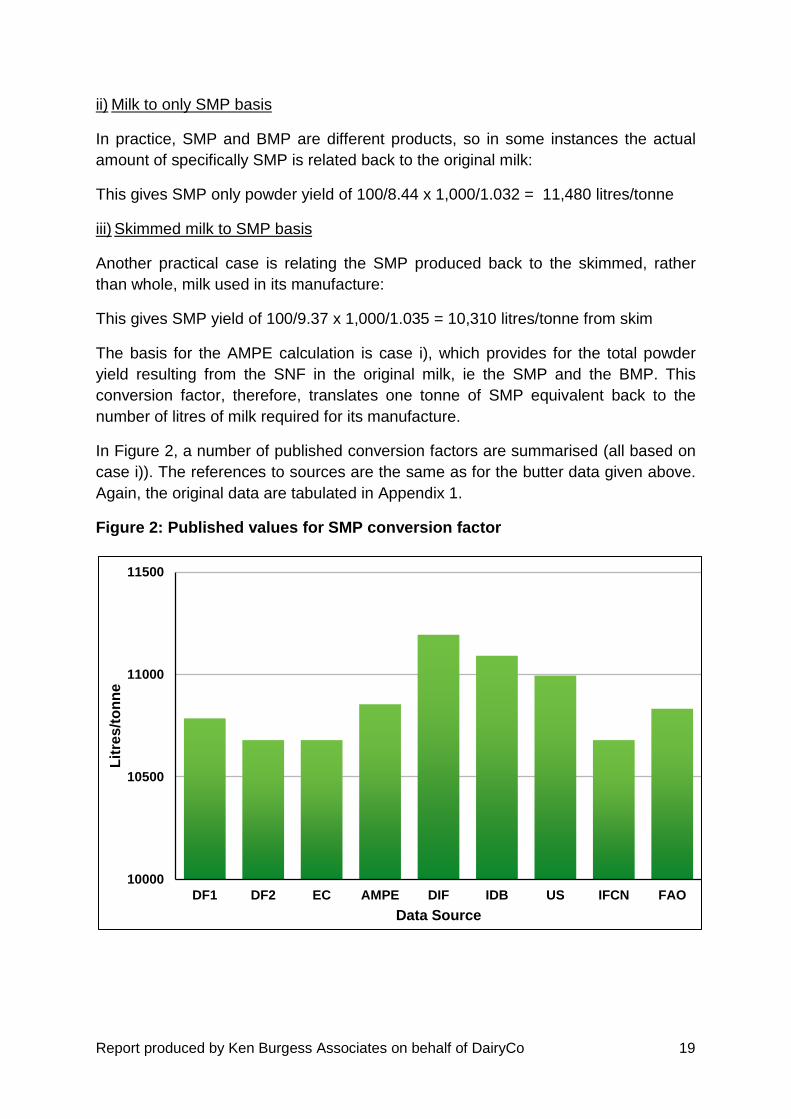
In Figure 2, a number of published conversion factors are summarised (all based on
case i)). The references to sources are the same as for the butter data given above.
Again, the original data are tabulated in Appendix 1.
Figure 2: Published values for SMP conversion factor
10000
10500
11000
11500
DF1 DF2 EC AMPE DIF IDB US IFCN FAO
Lit
res
/to
nn
e
Data Source

Report produced by Ken Burgess Associates on behalf of DairyCo 20
The values fall within the range 10,680 to 11,172 litres/tonne, with the AMPE value
at the centre of the range. The conversion factor used consistently in Dairy Facts
and Figures, and EC Dairy Facts and Figures throughout the 1980s and 1990s was
11,000kg milk to make one tonne SMP. This equates to 10,658l/t.
The current AMPE conversion factor for SMP is, therefore, again broadly central
within the range of published data. However, it is apparent that the different ways of
expressing SMP yields led to some confusion in the published data over the years,
and this is clarified when a mass balance approach is used in section 4.2.
An additional factor with the SMP conversion is the buttermilk issue; the OFT version
of the IMPE margin recognised that some of the tonne of powder from the 10,855
litres of milk is buttermilk and an allowance was made in their formula for the slightly
lower return on this. This issue is addressed separately in section 5 as part of the
review of processing costs.
4.1.2 MCVE factors
The conversion factors for Cheddar, whey butter and whey powder were established
in 2005 when the MCVE was introduced. These figures were broadly accepted
informally at the time but have not been independently reviewed.
Cheese
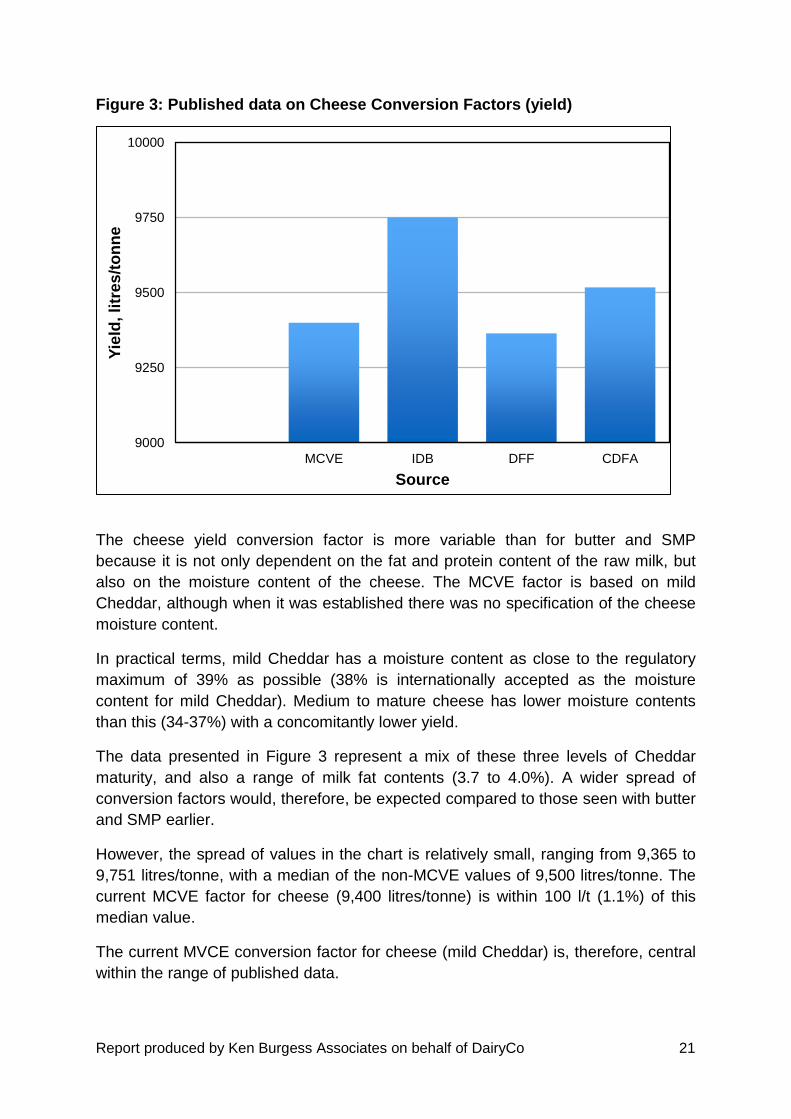
Figure 3 compares the current MCVE conversion factor for cheese with a number of
other published sources from the UK (Dairy Facts & Figures, 1994, DFF; MCVE, the
EU (IDB) and non EU (CFDA; Dairy Australia, DA; FAO). The original data are
tabulated in Appendix 1.
Report produced by Ken Burgess Associates on behalf of DairyCo 21
Figure 3: Published data on Cheese Conversion Factors (yield)
The cheese yield conversion factor is more variable than for butter and SMP
because it is not only dependent on the fat and protein content of the raw milk, but
also on the moisture content of the cheese. The MCVE factor is based on mild
Cheddar, although when it was established there was no specification of the cheese
moisture content.
In practical terms, mild Cheddar has a moisture content as close to the regulatory
maximum of 39% as possible (38% is internationally accepted as the moisture
content for mild Cheddar). Medium to mature cheese has lower moisture contents
than this (34-37%) with a concomitantly lower yield.
The data presented in Figure 3 represent a mix of these three levels of Cheddar
maturity, and also a range of milk fat contents (3.7 to 4.0%). A wider spread of
conversion factors would, therefore, be expected compared to those seen with butter
and SMP earlier.
However, the spread of values in the chart is relatively small, ranging from 9,365 to
9,751 litres/tonne, with a median of the non-MCVE values of 9,500 litres/tonne. The
current MCVE factor for cheese (9,400 litres/tonne) is within 100 l/t (1.1%) of this
median value.
The current MVCE conversion factor for cheese (mild Cheddar) is, therefore, central
within the range of published data.
9000
9250
9500
9750
10000
MCVE IDB DFF CDFA
Yie
ld,
litr
es
/to
nn
e
Source

Report produced by Ken Burgess Associates on behalf of DairyCo 22
Whey powder & whey butter
Whey solids have traditionally attracted little financial value compared with the
commodity products, milk powders, butter and cheese. Consequently, there is not a
great deal of reliable published data available concerning whey powder conversion
factors and the list of indicative values in Table 7 below is significantly less extensive
than those for the other products.
Table 7: Published whey powder conversion factors
Source Yield, litres/tonne milk
MCVE 17,000
Dairy Facts & Figures, 1980 16,644
Dairy Facts & Figures, 1992 16,500
Dairy Australia 16,051
USDA (Class III price calculation) 16,558
Three of the non-MCVE values are in the narrow range between 16,500 and 16,644
litres per tonne, some 2.5% below the MCVE value. In the case of whey powder, the
MCVE value is, therefore, slightly adverse to published yield factors.
There is no reliable published data on conversion factors for whey butter/cream so
estimates for these can only be based on a mass balance approach as outlined
below.
4.2 Mass balance approach
The mass balance approach is based on deriving conversion factors from the
composition of the milk component inputs and the percentage of milk components in
the finished product. This principle is now applied to each of the commodities in turn.
4.2.1 Butter & SMP
In order to be able to compare this approach with the conversion factors reviewed
above, it is assumed here that any buttermilk produced is co-dried with the skimmed
milk into SMP. This is the basis on which the current AMPE conversion factor is
determined.
The milk input is set at 100kg with a fat content of 4%. The fat content of skimmed
milk and butter are assumed as 0.06% and 81.5%, respectively.
Report produced by Ken Burgess Associates on behalf of DairyCo 23
Using the earlier process model for cream and butter production again (the full
calculation is given in Section 4 of Appendix 2), the mass balance produces 9.86kg
cream @ 40% fat. This in turn generates 4.81kg butter, and thus 5.05kg buttermilk.
For the butter, wastage is assumed at 1% to give 4.76kg butter from the 100kg milk,
and converting this from kg/100kg milk to litres/tonne gives:
Butter conversion factor = 100/1.032/4.76 = 20,357 litres/tonne
For the powder production, wastage in liquid processing is assumed at 0.5% (the
1.03 factor to convert solids to powder incorporates a drying process loss).
The combined skimmed milk and buttermilk (95.19kg @ 9.12% solids) then gives
8.90kg powder from the 100kg milk, and converting this from kg/100kg milk to
litres/tonne gives:
SMP conversion factor = 100/1.032/8.90 = 10,887 litres/tonne.
The calculated factor for butter is therefore within 0.4% of the AMPE figure and the
calculated SMP conversion factor is within 0.3% of the AMPE value.
Standardised SMP
The review of published data above was restricted to conventional SMP only. In fact,
since 2008, provision has been made in UK law for the protein standardisation of
SMP through the Condensed Milk and Dried Milk (England) (Amendment)
Regulations 2008. This implemented the European Council Directive 2007/61/EC.
This regulation provides for the adjustment of the protein content of SMP down to
34% of the SNF, using either milk ultrafiltration permeate or lactose (note: the
average protein content of SMP in the UK is approximately 37.5%). This implies a
practical standardisation factor, ie lactose addition rate, of 8%.
There is an economic imperative for processors to act on this by extending the solids
in skimmed milk with lactose. However, some customers still require unstandardised
product so standardisation is not applied in practice to all powder.
By introducing standardisation into the discussion, a distinction needs to be made
between SMP and BMP since the volume of buttermilk available for drying would not
make it worthwhile to standardise it. This is incorporated into the calculation next.
The standardisation process for SMP adds a layer of complication to the mass
balance, but in simple terms:
Report produced by Ken Burgess Associates on behalf of DairyCo 24
For conventional non-fat powders (SMP and BMP):
100kg powder = 95kg SMP + 5kg BMP
For standardisation, the 95kg SMP becomes 102.6kg, i.e 8% more, with the addition
of lactose. This is a non-standard process so a process loss of 1% is applied, leaving
1.016kg standardised SMP.
Using the calculated SMP conversion factor of 10,887l/t,
10,887 litres milk = 1t conventional powder >> 1.016t standardised SMP
+ 0.05 t BMP
The conversion factors for standardised SMP and BMP are, therefore, estimated at
10,720 and 217,740l/t respectively. When the product costs are considered in the
next Section, a cost model for standardisation will be given to reflect the lactose
addition related costs.
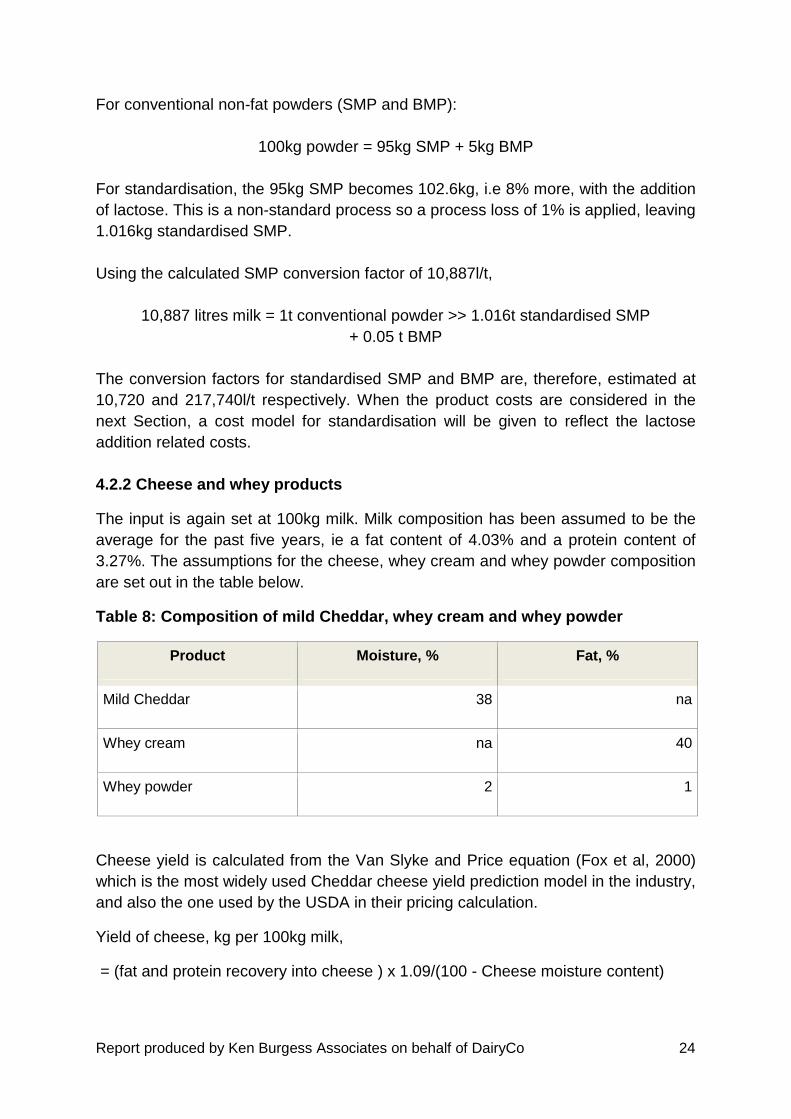
4.2.2 Cheese and whey products
The input is again set at 100kg milk. Milk composition has been assumed to be the
average for the past five years, ie a fat content of 4.03% and a protein content of
3.27%. The assumptions for the cheese, whey cream and whey powder composition
are set out in the table below.
Table 8: Composition of mild Cheddar, whey cream and whey powder
Product Moisture, % Fat, %
Mild Cheddar 38 na
Whey cream na 40
Whey powder 2 1
Cheese yield is calculated from the Van Slyke and Price equation (Fox et al, 2000)
which is the most widely used Cheddar cheese yield prediction model in the industry,
and also the one used by the USDA in their pricing calculation.
Yield of cheese, kg per 100kg milk,
= (fat and protein recovery into cheese ) x 1.09/(100 - Cheese moisture content)

Report produced by Ken Burgess Associates on behalf of DairyCo 25
The protein and fat recovery percentages used are 74% and 88%, respectively, as
these are representative of industry practice. This gives:
Cheese yield = (4 x 88 + 3.3 x 0.74) x 1.09/62 = 10.48kg cheese/100kg milk.
Converting this to litres/tonne gives 100/1.032/10.48 = 9,250 litres/tonne. This is
1.6% lower (higher yield) than the MCVE figure but changing the cheese moisture
assumption from 38% to 37% would make this calculated yield identical with MCVE.
Cheese yield may vary quite substantially from factory to factory, as a result of
differences in fat recovery and moisture content. However, if fat is lost in the cheese
making process, then there should be a compensating gain in fat recovery into whey
cream/butter and vice versa. The key factor is that 98.5% of the fat in the milk should
be recoverable between the cheese, whey butter and whey powder.
Whey cream
The fat available to whey cream is calculated as follows:
Again, based on 100kg milk with 4.03% fat;
Fat to whey cream = Fat in milk x 0.985 - fat in cheese - fat in whey powder
= 3.97 - 3.55 - 0.05 = 0.37 kg
This means that 0.37kg fat in a whey cream of 40% gives 0.37/0.4 = 0.93kg whey
cream for 100kg of original milk. Converting this to litres/tonne gives 100/1.032/0.93
= 104,000 litres/tonne whey cream.
This gives a whey fat figure of 35-36 kg/tonne cheese, which is around the norm
seen in the industry.
Assuming a conversion factor of 2.1kg cream/tonne butter, this is equivalent to
218,000 litres/tonne for whey butter. This is significantly different from the current
MCVE factor for whey butter (130,000 litres/tonne), and indicates that the MCVE
figure needs adjustment.
The scale of this difference can be calculated using the existing MCVE processing
cost for whey butter (£320/t) and a wholesale price for whey butter of £3,200/t. At a
conversion factor of 130,000 litres/tonne the whey butter contribution to MCVE is
2.2ppl while, at a conversion factor of 218,000 litres/tonne, the whey butter
contribution is 1.3ppl.
Whey powder
The theoretical quantity of whey produced is the original milk quantity, minus the
cheese, minus the whey cream, ie 100 - 10.5 - 0.93 = 88.6kg whey at 6.5% solids, or
5.76kg solids.
Report produced by Ken Burgess Associates on behalf of DairyCo 26
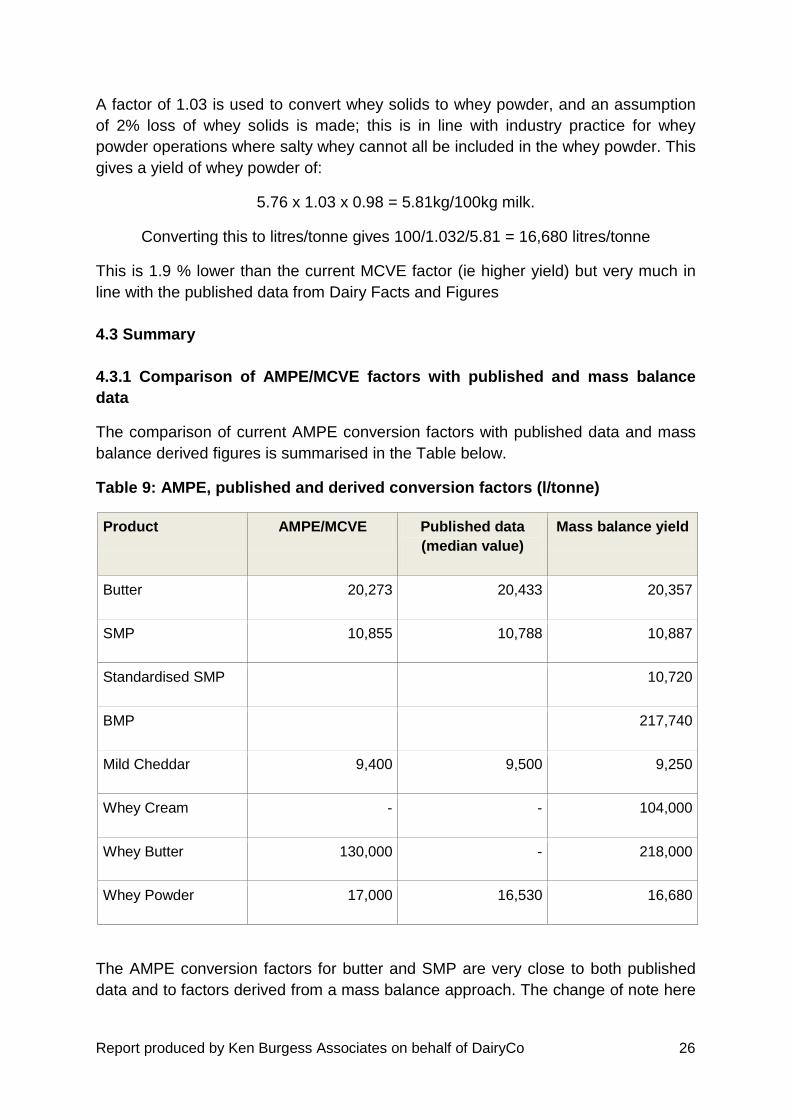
A factor of 1.03 is used to convert whey solids to whey powder, and an assumption
of 2% loss of whey solids is made; this is in line with industry practice for whey
powder operations where salty whey cannot all be included in the whey powder. This
gives a yield of whey powder of:
5.76 x 1.03 x 0.98 = 5.81kg/100kg milk.
Converting this to litres/tonne gives 100/1.032/5.81 = 16,680 litres/tonne
This is 1.9 % lower than the current MCVE factor (ie higher yield) but very much in
line with the published data from Dairy Facts and Figures
4.3 Summary
4.3.1 Comparison of AMPE/MCVE factors with published and mass balance
data
The comparison of current AMPE conversion factors with published data and mass
balance derived figures is summarised in the Table below.
Table 9: AMPE, published and derived conversion factors (l/tonne)
Product AMPE/MCVE Published data
(median value)
Mass balance yield
Butter 20,273 20,433 20,357
SMP 10,855 10,788 10,887
Standardised SMP 10,720
BMP 217,740
Mild Cheddar 9,400 9,500 9,250
Whey Cream - - 104,000
Whey Butter 130,000 - 218,000
Whey Powder 17,000 16,530 16,680
The AMPE conversion factors for butter and SMP are very close to both published
data and to factors derived from a mass balance approach. The change of note here
Report produced by Ken Burgess Associates on behalf of DairyCo 27
is the appearance of protein standardised SMP as the current commodity product,
bringing with it a new conversion factor.
The MCVE conversion factor for cheese is slightly more optimistic than the median
published value, but this is not surprising as the latter will have included some yields
relating to more mature, and, therefore, lower yielding, cheese. For a similar reason,
the mass balance derived factor of 9,250 litres/tonne is more optimistic than the
MCVE figure of 9,400 litres/tonne. When the MCVE was established, it is likely that
cheese manufacturers were making mild cheese at 37 to 38% moisture, whereas the
commodity manufacturers will now be focusing on moistures of 38%.
For whey powder, the MCVE factor is slightly more pessimistic than the mass
balance derived figures, but only by 2%. For the whey cream/butter, the review
highlighted that a correction would be required to the MCVE factor. This change is
partially offset by the improved cheese yield.
4.3.2 Comparison with processor factors
AMPE
A key part of the review involved consulting with processors. In general, during
discussions with processors the conversion factors for butter and SMP were not
raised as issues.
The average of the butter conversion factors provided was within 1.5% of the AMPE
and, in view of the variation of milk composition over a year and regionally, this was
not seen to be significant.
The case of the SMP conversion factors was less clear, as figures were provided in
different contexts, ie the different cases set out in 4.1.1 above.
In the case of SMP, it has to be recognised that only one plant in GB manufactures
this product on a regular basis and it must, therefore, be treated as a special case. If
an AMPE type indicator is to be used for SMP going forward, it needs to be based on
a wider data set than is currently available within GB.
MCVE
There was general agreement that milk with fat and protein contents of 4% and
3.3%, respectively, would give a cheese yield between 9,200 and 9,300 litres/tonne.
This range bounded the mass balance value and was somewhat lower than the
current MCVE value of 9,400.
Report produced by Ken Burgess Associates on behalf of DairyCo 28
The whey powder yield data were also very consistent, ranging within +/- 5% of the
current MCVE value. The whey cream values were more variable, but this is not
surprising in view of different fat recoveries into cheese at different sites. Even so,
values provided were within +/- 15% of the mass balance value and, in view of the
relatively small contribution of whey cream/butter to the MCVE price, this is not
considered significant (some indicators only utilise cheese and whey powder in their
formulae). However, as mentioned above, the current MCVE factor for whey butter is
significantly different from industry data and the mass balance value.
Report produced by Ken Burgess Associates on behalf of DairyCo 29
5. Processing cost
This section reviews the processing cost elements of the market indicator formulae,
and begins with a consideration of the elements that should be included within the
scope of the conversion cost, and the nature of the manufacturing operation being
used to produce these commodity products.
5.1 Scope of processing cost
Cost elements
The scope for the “processing cost” has not been defined explicitly in any of the
reviews of the IMPE margin since the deregulation of the MMB system. It is
supposed to represent “the assumed processing cost of turning milk into butter and
SMP” (Dairy Fact and Figures, 1988).
The IMPE margin was always a factory-based cost, not including transport of milk
from farm to factory. DairyCo reports the transport cost separately reflecting a
comprehensive approach to showing the whole supply chain cost. This is also the
case, for example, in Germany where a milk transport cost of 1.4c/kg is reported
alongside the production cost.
The starting point for establishing the scope of the “processing cost” figure must,
therefore, go back to the 2000 OFT IMPE calculation as captured in the current
AMPE formula. This had six elements:
• Fixed costs
• Variable costs
• Interest cost on delayed intervention payment
• Transport to intervention store
• A buttermilk dilution cost
• A profit margin.
The AMPE does not apply to intervention sales so there is now no logical reason for
including intervention system related costs within the AMPE formula, either the
delayed payment cost or the transport to intervention store.
The buttermilk dilution cost (to allow for the fact that 5% of the total powder yield is
BMP rather than SMP) is not normally included within processing allowances.
However, in view of its relatively small impact, and the fact it is real and has been in
the formula for the last 15 years, it is recommended to leave it unchanged.
A profit margin was also included within the 2000 OFT formula, although this does
not come within the original concept of the processing margin as set out above, and

Report produced by Ken Burgess Associates on behalf of DairyCo 30
other European (EU, 2011) and World indicators (IFCN, 2012) do not include it. It
should also be remembered that the AMPE indicator should have an AMPE margin
relevant to its context, ie as a typical market indicator, rather than an IMPE margin
factored in response to resolving a major industry conflict in the aftermath of the
abolition of the Milk Marketing Scheme in the 1990s.
On the other hand, a profit margin has been in the IMPE calculation since the OFT
intervention, and the MCVE has always incorporated a profit margin. One of the
interviewed processors in particular expressed the strong view that such a provision
should be included.
One of the industry discussions also brought mention of including a milk
administration cost into the formula. However, this has not been pursued because:
• The original IMPE only covered the cost of conversion
• The IMPE margin was expanded by the OFT to include transport and a profit
margin, but nothing beyond this
• MCVE when it was introduced only included “typical processing costs” and a profit
margin as the elements to be netted from the gross MCVE value.
To introduce a further overhead cost would, therefore, extend the scope of the
indicators beyond their current framework.
The inclusion of a profit margin or not therefore has arguments on both sides. It is a
matter of policy as to whether a margin should be included within the formula, rather
than a practical or technical issue.
The arguments for the elements to be included in the scope of the AMPE
“processing cost” apply equally to the MCVE formula.
The review of processing costs for these formulae will, therefore, focus on the fixed
and variable costs of plant processing, ie fixed costs beyond the factory gate are not
included.
Plant operation
Process costs are dependent on the degree of utilisation of the process plant. One of
the cost data sources (CDFA, 2011) clearly demonstrates this.
The range of costs (£/t) from different plants in California in 2011 is shown in Table
10 below for the two main cost categories of processing labour and processing non-
labour.

Report produced by Ken Burgess Associates on behalf of DairyCo 31
Table 10: Range of individual plant costs, £/t (CDFA)
Cost Category Butter Cheese SMP (NFDM)
Processing labour
Min 47 55 30
Max 310 151 139
Processing non-labour
Min 69 83 135
Max 306 184 382
The figures show that labour costs per tonne have a range with a ratio in excess of
6:1, and the non-labour costs a ratio in excess of 4:1.
The high range of labour costs in particular demonstrates that plant utilisation has a
major impact on efficiency in the context of dairy product manufacture. For example,
it would be legitimate to see the possibility of a labour cost of £50/tonne for butter
The other largest cost input, energy, is similarly affected by plant utilisation as there
is always a fixed element of energy use in plant start-up and shut-down. The longer
these two take as a proportion of total running time will impact on energy efficiency in
the same way as labour efficiency.
Capacity utilisation can literally vary between 0 and 100% depending on the
timeframe within the milk production season but it is unrealistic to assume utilisations
at either end of these extremes because:
• Very low utilisation is not compatible with commodity production which by its nature
is very low margin.
• Very high levels of utilisation are not achievable in practice because of the
availability of milk supply.
As a “middle ground” level, 65% has been chosen in this study as being reasonably
representative in plants operating in the region of 4 to 6 tonnes per hour of product.
This is typical of plant installed in the UK over the past 20 years or so, but is
obviously lower than more recent investments in Europe and New Zealand. It is
generally recognised that a throughput of around 8 to 10 tonnes per hour is optimal
in terms of maximising efficiency and productivity while retaining a level of flexibility
to deal with variations in milk supply.

Report produced by Ken Burgess Associates on behalf of DairyCo 32
5.2 Availability of commercial data
Commercial manufacturing data is by its nature highly confidential and in the past 30
years there have been no instances of such information being made available unless
required by legislation. In the current study, the author requested such information
from some of the commercial organisations involved in dairy commodity
manufacture, and a limited amount of data was provided on the basis of strict
confidentiality.
That bond of confidentiality precludes the publication of any of that information, but
the data provided on yields provided a useful yardstick against which to compare the
author’s models. Data provided on labour and energy costs was not used in any way
in the compilation of any cost structures in this report because of the risk of it being
associated with particular sources. However, for some of the smaller cost elements,
the data was used as simple averages where there were at least three values
available for a given product type.
Because of these restrictions on commercial data availability, cost information from
other sources was also reviewed in order to add to the body of knowledge of product
manufacturing costs and their elements.
5.3 Published data - USA
The most comprehensive information on dairy product manufacturing costs is
published by the California Department of Food and Agriculture. The State Code
provides for the carrying out of cost studies to gather information on manufacturing
costs and the Agriculture Department has a Manufacturing Cost Unit which
undertakes thorough cost audits of participating sites. This set of cost data is
particularly valuable because it is based on audited information, and is available over
a number of years.
The make-up of this set of cost data is set out in Appendix 3.
These CDFA manufacturing costs amount to £228, £272, £245 and £312 per tonne
for butter, cheese, SMP and whey powder, respectively.
When the subcategories making up each cost category were reviewed, it was noted
that utility costs for these Californian plants (US EIA, 2013) were slightly more
favourable than the UK. When the above costs are adjusted for this, the processing
cost per tonne becomes £238, £288, £305 and £430 for butter, cheese, SMP and
whey powder, respectively.
In addition to providing a base for comparison against factored UK estimates, this set
of cost data is also useful for demonstrating two key points regarding the nature of
Report produced by Ken Burgess Associates on behalf of DairyCo 33
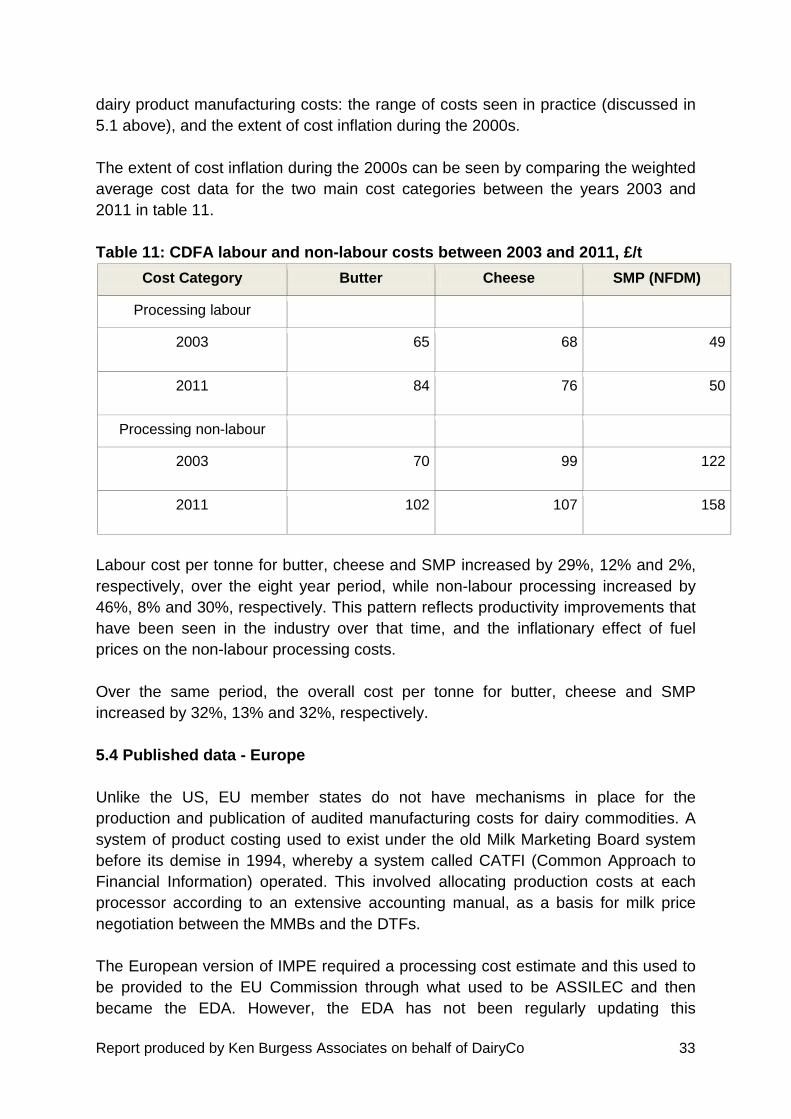
dairy product manufacturing costs: the range of costs seen in practice (discussed in
5.1 above), and the extent of cost inflation during the 2000s.
The extent of cost inflation during the 2000s can be seen by comparing the weighted
average cost data for the two main cost categories between the years 2003 and
2011 in table 11.
Table 11: CDFA labour and non-labour costs between 2003 and 2011, £/t
Cost Category Butter Cheese SMP (NFDM)
Processing labour
2003 65 68 49
2011 84 76 50
Processing non-labour
2003 70 99 122
2011 102 107 158
Labour cost per tonne for butter, cheese and SMP increased by 29%, 12% and 2%,
respectively, over the eight year period, while non-labour processing increased by
46%, 8% and 30%, respectively. This pattern reflects productivity improvements that
have been seen in the industry over that time, and the inflationary effect of fuel
prices on the non-labour processing costs.
Over the same period, the overall cost per tonne for butter, cheese and SMP
increased by 32%, 13% and 32%, respectively.
5.4 Published data - Europe
Unlike the US, EU member states do not have mechanisms in place for the
production and publication of audited manufacturing costs for dairy commodities. A
system of product costing used to exist under the old Milk Marketing Board system
before its demise in 1994, whereby a system called CATFI (Common Approach to
Financial Information) operated. This involved allocating production costs at each
processor according to an extensive accounting manual, as a basis for milk price
negotiation between the MMBs and the DTFs.
The European version of IMPE required a processing cost estimate and this used to
be provided to the EU Commission through what used to be ASSILEC and then
became the EDA. However, the EDA has not been regularly updating this

Report produced by Ken Burgess Associates on behalf of DairyCo 34
information since 1996 in view of the unwillingness of processors to release
confidential cost information.
The processing costs published by the EU Commission have been largely
unchanged for a number of years at 29.3€/100kg (£250/tonne) and 28.3 €/100kg
(£240/tonne) for butter and SMP, respectively (EU Commission; 2011). They were
predominantly provided by the Dutch industry which had a model of recent
investment in large capacity plant running at high utilisation.
The above EU-based processing cost figures are essentially based on variable costs
and, therefore, not strictly comparable to the UK market indicator margins which
include a fixed cost element.
The other specific costs published within the EU are from the Research Centre for
Food Economics in Kiel, Germany (IFE, 2013). Here, 26 €/100kg (£221/t) and 38€
/100kg (£323/t) are quoted for butter and SMP respectively, with the processing cost
for SMP specifically stated as being for protein standardised SMP. The sources of
the Kiel underlying costs are individual cost data of several dairy processors. The
cost data represents the production of SMP and butter in German and European
dairies at a commodity level (IFE, 2013). A transport price from farm to factory of
1.4c/kg is quoted separately.
These published European costs for the AMPE products are summarised in table 12.
Table 12 : EU published process costs (€/tonne) for AMPE products
Butter Conventional SMP
Standardised SMP
EU Commission 293 283 NA
IFE, Kiel 260 NA 380
IFCN 311 290 NA
The other potential source of cost information within the EU is the Dairy Industry
processing model developed by the government-funded Teagasc at Moorepark. That
model is based on production costs collected from the industry by Teagasc
researchers in 2001. The cost components have been updated since, through the
application of a combination of cost inflation indices and industry productivity factors
with regard to energy and labour. The model also separates costs into those
associated with liquid processing of the milk before the conversion process, and
product processing and packing thereafter (see Appendix 4 for detail of the model).

Report produced by Ken Burgess Associates on behalf of DairyCo 35
The estimates derived from the Moorepark data are equivalent to £325, £294, £366
and £433/tonne for cheese, butter, SMP and whey powder, respectively, not
including post-manufacturing costs.
It should be noted that this model is still being refined and obviously reflects the
particular nature of the Irish processing sector and its environment. The latter
includes a very efficient ramp up and down approach to managing the peak to trough
milk production variance. However, the estimates do help to set a likely range of
variation in which actual processing costs are likely to sit.
5.5 Cost engineering approach
The components of the cost structure of dairy products are well known and
incorporated into dairy company accounting systems. The key cost components are:
• Energy (electricity, gas, fuel oil etc.)
• Labour (direct and indirect)
• Raw materials (ingredients, packaging)
• Repairs and maintenance
• Chemicals, water and waste treatment
• Storage
• Depreciation
• General and administration (management, accounts, bought-in services, other
costs)
The cost engineering approach builds up product costs from estimates of these
individual components.
It was mentioned earlier in this report that the commercially supplied energy and
labour cost data was not used in the compilation of these estimates for reasons of
confidentiality. A secondary reason was the difficulty in accurately allocating costs to
products in the absence of a proceduralised system for doing so, such as the CATFI
manual or the CDFA audit system.
The data assumptions and method of calculation of the cost elements are set out in
Appendix 3. An important factor in these costs is the energy cost of production. For
this purpose, the fuel cost has been calculated on the basis of using gas rather than
fuel oil as this is the predominant fuel used in the industry. Energy costs using fuel oil
as a base will be substantially higher.
On the basis of these estimation strategies, the following cost structures were
developed for the four main commodities, ie butter, conventional SMP, mild Cheddar
and whey powder.
Report produced by Ken Burgess Associates on behalf of DairyCo 36
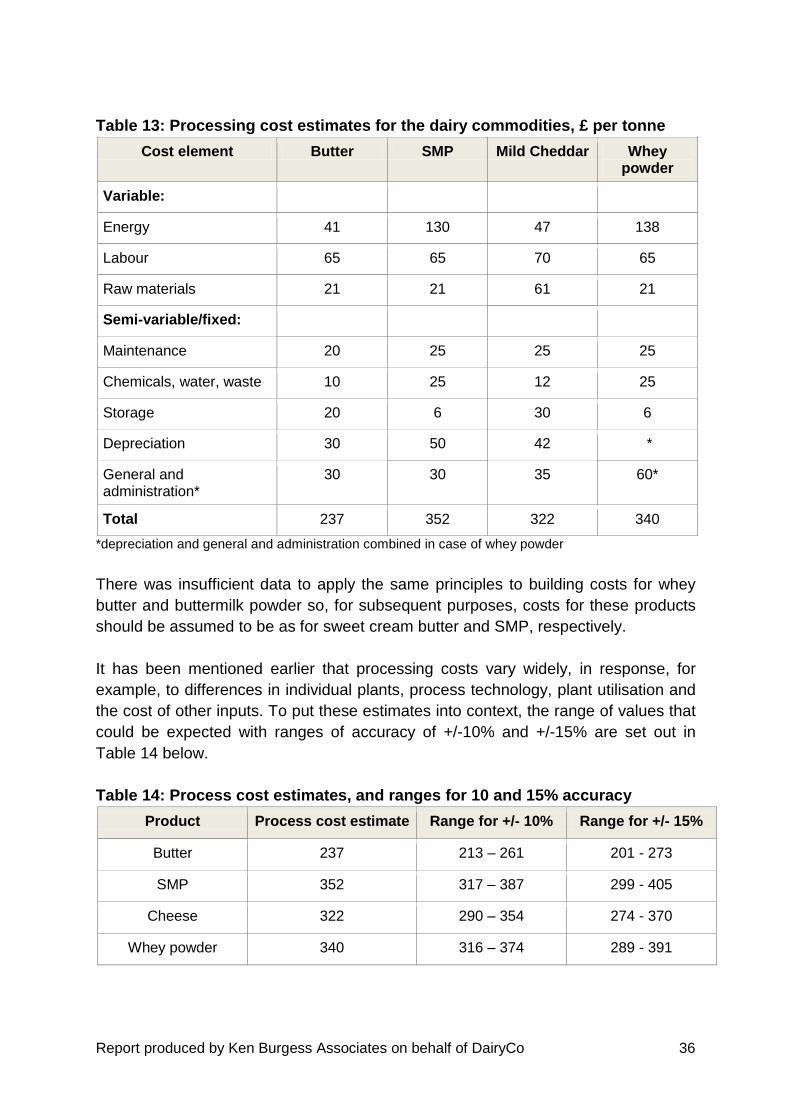
Table 13: Processing cost estimates for the dairy commodities, £ per tonne
Cost element Butter SMP Mild Cheddar Whey powder
Variable:
Energy 41 130 47 138
Labour 65 65 70 65
Raw materials 21 21 61 21
Semi-variable/fixed:
Maintenance 20 25 25 25
Chemicals, water, waste 10 25 12 25
Storage 20 6 30 6
Depreciation 30 50 42 *
General and administration*
30 30 35 60*
Total 237 352 322 340
*depreciation and general and administration combined in case of whey powder
There was insufficient data to apply the same principles to building costs for whey
butter and buttermilk powder so, for subsequent purposes, costs for these products
should be assumed to be as for sweet cream butter and SMP, respectively.
It has been mentioned earlier that processing costs vary widely, in response, for
example, to differences in individual plants, process technology, plant utilisation and
the cost of other inputs. To put these estimates into context, the range of values that
could be expected with ranges of accuracy of +/-10% and +/-15% are set out in
Table 14 below.
Table 14: Process cost estimates, and ranges for 10 and 15% accuracy
Product Process cost estimate Range for +/- 10% Range for +/- 15%
Butter 237 213 – 261 201 - 273
SMP 352 317 – 387 299 - 405
Cheese 322 290 – 354 274 - 370
Whey powder 340 316 – 374 289 - 391

Report produced by Ken Burgess Associates on behalf of DairyCo 37
Buttermilk dilution
There is then the question of how to factor in the reality that some of the SMP solids
are in practice recovered as buttermilk powder. The latter commands a consistent
slightly lower market price than SMP itself: in 1997 the OFT estimated this difference
at £120/t, while the 2013 Global Dairy Trade data gives an average difference of
£103/t. This differential between the prices of SMP and BMP may exhibit a different
pattern at UK wholesale prices but that would need to be decided in practice.
The OFT dealt with this issue by including a buttermilk dilution allowance in the
margin formula (in practice it only amounted to some 0.05 pence per litre). However,
while this approach works satisfactorily for conventional SMP, it is not appropriate for
protein standardised SMP. This is dealt with in the next section.
Standardised SMP
Standardised SMP is made by adding a source of lactose to skimmed milk to give a
minimum protein content of 34% of the solids not fat. This source of lactose can
either be lactose powder itself, or the permeate resulting from the ultrafiltration of
milk or skimmed milk. The latter process is not significant commercially in the UK so
the lactose addition route is assumed here.
In this case, the additional processing cost for standardised skimmed milk powder
practically requires the reconstitution of lactose powder for blending into the
skimmed milk before drying. The calculation in Appendix 6 estimates that, to
standardise by 8%, one tonne of standardised powder will contain 78kg added
lactose powder. An additional processing cost could also be incurred, but only to the
extent of a small number of pounds per tonne.
In the case of protein standardised SMP the buttermilk also has to be treated
differently as this cannot be dealt with as a general part of the solids not fat; the
buttermilk is not standardised while the skimmed milk is. Using a buttermilk dilution
allowance is not, therefore, appropriate.
The situation is handled by having a conversion factor and cost for each of the two
streams, the BMP and the protein standardised SMP. The estimated conversion
costs for these were given in 4.2.1.
For the standardised SMP, the lactose price is relatively more volatile than that of the
higher volume dairy commodities and, while it broadly follows SMP and whey
powder prices, there is no consistent relationship. USDA quoted prices for lactose
were as high as $2012/t in 2012 but now rest at $1424/t (September 2013). A
pragmatic solution to arriving at a lactose price for this purpose would be to take the
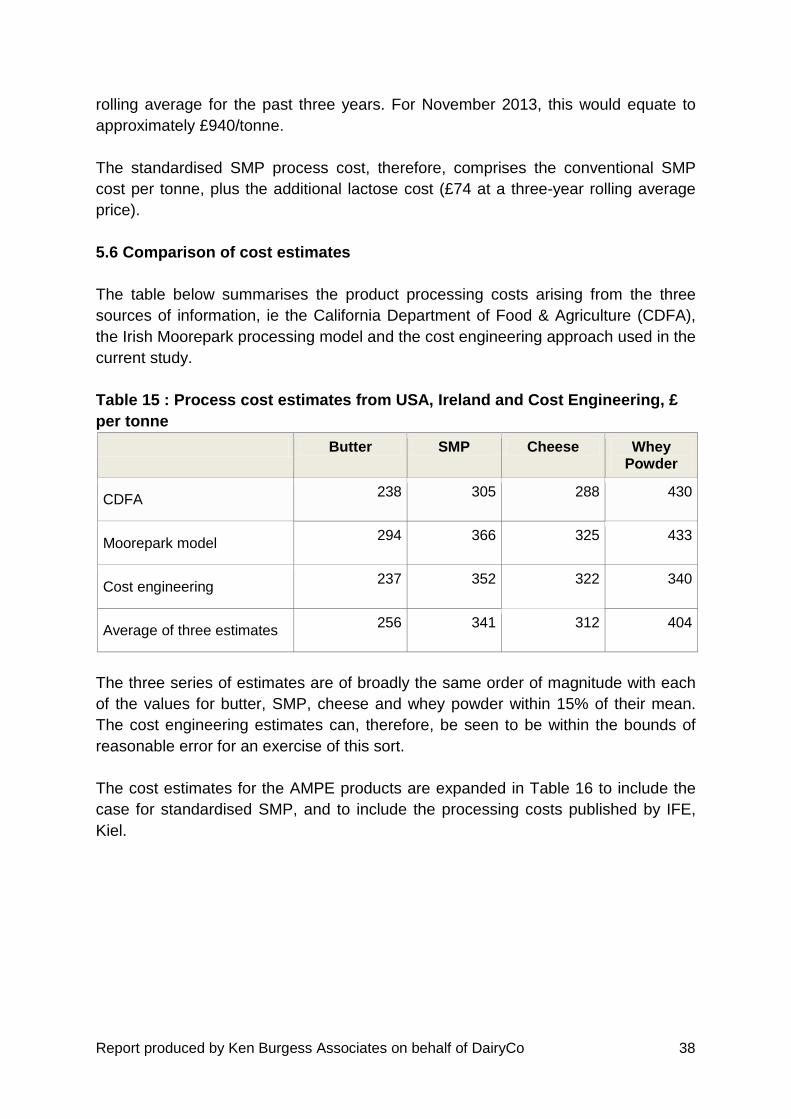
Report produced by Ken Burgess Associates on behalf of DairyCo 38
rolling average for the past three years. For November 2013, this would equate to
approximately £940/tonne.
The standardised SMP process cost, therefore, comprises the conventional SMP
cost per tonne, plus the additional lactose cost (£74 at a three-year rolling average
price).
5.6 Comparison of cost estimates
The table below summarises the product processing costs arising from the three
sources of information, ie the California Department of Food & Agriculture (CDFA),
the Irish Moorepark processing model and the cost engineering approach used in the
current study.
Table 15 : Process cost estimates from USA, Ireland and Cost Engineering, £
per tonne
Butter SMP Cheese Whey Powder
CDFA 238 305 288 430
Moorepark model 294 366 325 433
Cost engineering 237 352 322 340
Average of three estimates 256 341 312 404
The three series of estimates are of broadly the same order of magnitude with each
of the values for butter, SMP, cheese and whey powder within 15% of their mean.
The cost engineering estimates can, therefore, be seen to be within the bounds of
reasonable error for an exercise of this sort.
The cost estimates for the AMPE products are expanded in Table 16 to include the
case for standardised SMP, and to include the processing costs published by IFE,
Kiel.

Report produced by Ken Burgess Associates on behalf of DairyCo 39
Table 16 : Process cost estimates for AMPE products, £ per tonne
Butter Conventional SMP
Standardised SMP
CDFA 238 305 NA
Moorepark model 294 366 NA
Cost engineering 237 352 430
IFE, Kiel* 221 NA 323
*; €260 and €380/tonne for butter and SMP, respectively
It should be noted that the IFE, Kiel cost for standardised SMP includes both lactose
and permeate use for standardisation, so it is not surprising that the cost engineering
estimate is higher than the IFE one.
Finally, it should be noted that these cost estimates represent a significant increase
over the existing cost data in the AMPE and MCVE formulae.
The two standard AMPE product costs (for butter and conventional SMP) combine to
amount to 4.2p per litre. This compares with the 3.2p per litre from the fixed and
variable cost elements of the DairyCo version of the IMPE formula, and represents a
37% increase over the values that were established in the late 1990s.
The estimated cheese and whey powder processing costs are higher than the
current MCVE values by 29 and 58%, respectively. The original MCVE figures were
developed following a literature review and discussions with processors; however,
the original basis was never published.
The increases in the AMPE costs for butter and conventional SMP of 37% over the
past 15 years are broadly in line with the increase seen for these products in the
CFDA cost data between 2003 and 2011 (32%).
5.7 Summary
The relevance and accuracy of processing cost data was shown to be highly
dependent on the level of plant utilisation. Within this framework, the site-based
processing costs for butter, conventional SMP, mild Cheddar and whey powder have
been estimated through factored cost models, and these shown to be in line with
other published costs.

Report produced by Ken Burgess Associates on behalf of DairyCo 40
The cost estimates are higher than the existing formula costs, but this is in line with
the general trend in manufacturing cost inflation.
The case for protein standardised SMP needs to be recognised along with the
realisation that in a UK context, there is only one manufacturing plant that is likely to
consistently produce standardised SMP. In such circumstances, it is important that a
reference processing cost for standardised SMP recognises this commercial
sensitivity, and this is considered in the review of findings in section 7.

Report produced by Ken Burgess Associates on behalf of DairyCo 41
6. Commodity prices
Product commodity prices are obviously the starting point for the calculation of the
AMPE and MCVE indicators, and the prices used need to reflect the reality of the
marketplace in which the indicators are used.
A range of sources of price information are used within the EU member states,
including:
• Dutch Dairy Board
• Eurex
• Agra Europe
• Agra Informa
• USDA
• Global Dairy Trade.
On a more restricted geographical scale, more local sources may be used eg. the
Kempten butter and cheese stock exchange in Germany. Also, the USDA uses the
Dairy Product Prices survey produced weekly by the National Agricultural Marketing
Service, a weekly survey of large commodity manufacturers for prices, reflecting
current sales of Cheddar, butter, dry whey and non-fat dry milk.
Of the list above, the first four relate to European market prices, with the latter two
focusing on world prices. Several other national government departments and
information brokers use these sources in their original and represented forms.
The UK market is characterised mainly by domestic markets for the dairy
commodities, although some powder exports will inevitably occur. The UK is also a
large enough market to enable the collection of a representative mix of wholesale
prices covering sales of commodities to wholesalers, brokers, manufacturers, food
service and retail packers. DairyCo and the PTF produce such commodity price
reports on a regular basis and these are well regarded across Europe. In Ireland, in
particular, these reports are a key source of information for producers and
processors alike.
Discussions with industry personnel did not reveal any strong opinion either way as
to the use of one particular source of commodity price or another. Similarly, there
was no significant preference expressed for the inclusion of prices based on long-
term contracts. In fact, contacts in two countries (Germany, Ireland) expressly
mentioned the exclusion of such contracts. From a commercial perspective, sellers
will only enter into long term contracts if they believe they will get a better return,
albeit with associated higher risk (there are many examples of losses incurred from
forward selling). On the basis that those taking the additional risk should also accept

Report produced by Ken Burgess Associates on behalf of DairyCo 42
the gains and losses, it follows that long term contracts should be excluded from
commodity price sources.
It is therefore concluded that the current mix of UK commodity prices for butter,
skimmed milk powder, mild Cheddar and whey powder are the most appropriate
sources of information as the basis for the AMPE and MCVE indicators.

Report produced by Ken Burgess Associates on behalf of DairyCo 43
7. Review of findings
The findings of this study have been discussed in the body of the report. However, it
is useful to briefly review the issues around the indicators themselves, the
conversion factors and the scope and magnitude of the processing costs. The
position of protein standardised SMP is included as a special case demanding
sensitivity in its incorporation into the AMPE indicator.
7.1 Dairy Market Indicators
The review of the development of the UK market indicators in section 2 showed a
clear trajectory:
• The IMPE as a EC Commission tool for policy administration
• The AMPE in 2000 as a “floor level” in milk pricing in the disputes between Milk
Marque and the DTF at the time, gradually replacing the IMPE
• The MCVE in 2005 to reflect the importance of Cheddar in determination of prices
in the UK
In the review of international approaches to dairy market indicators described in
section 3, it was noted that there was a trend for indicators to be modified to reflect
the market circumstances in particular countries or regions, by basing an indicator on
a portfolio of relevant products rather than the traditional butter and skimmed milk
powder alone. The GB approach of publishing MCVE alongside AMPE already
brings cheese and whey powder into the mix, although as two separate indicators
rather than one holistic one.
The other question of policy relates to the extent of inclusion of processing costs in
the market indicators. Some countries publish a product price figure with no costs
taken into account. Market indicators which include a processing cost allowance
usually just include variable costs, while the UK has traditionally included an element
of fixed cost as well.
7.2 Conversion factors
Section 3 reviewed the current conversion factors for the AMPE and MCVE and
concluded that they were generally robust when compared with published data and
calculated values, with the exception of the factor for whey butter. They are also
broadly in line with industrial practice.
It has been shown that the current cheese conversion factor of 9,400 litres/tonne is
in line with a product moisture content of 37%, whereas modern practice is to target
38%. The latter equates to a cheese conversion factor of between 9,250 and 9,300

Report produced by Ken Burgess Associates on behalf of DairyCo 44
litres/tonne and consideration could, therefore, be given to a prudent move of the
cheese conversion factor to 9,350 litres/tonne. A conversion factor for whey butter
was calculated as 218,000 litres/tonne, compared with the current MCVE factor of
130,000.
The practice of standardisation of skimmed milk powder was reviewed and
conversion costs for the protein standardised product estimated. This product is now
the norm on international markets and is largely so in the UK.
It was observed that conversion factors very much depend on the concentration of
the key milk components in the original milk and, as such, there is a strong case for
basing the indicators on a standard milk composition. Current UK milk composition is
close to 4% fat and 3.3% protein, and this is also the base composition used by the
IFCN.
7.3 Processing costs
Section 5 first set out the remit for what it is believed should be within the scope of
the processing cost allowance within the AMPE and MCVE formulae.
The case was made for removing the intervention system-related costs as these play
no part in AMPE commercial framework. The decision as to whether or not to include
a profit margin within the formula was seen as a policy one, as there were arguments
on both sides. However, it is not normal practice to include a profit margin within a
market indicator.
Processing cost data from the US and EU were then reviewed and compared with
built up estimates for each of the key processing cost elements. The latter were
comparable with the US and EU data, once a common scope of cost elements had
been accounted for.
The processing costs for butter and conventional SMP were estimated at £237 and
£352/t, respectively, the former being lower than the current EU figure and the latter
higher. It was noted that using fuel oil as a fuel instead of gas would give rise to a
significantly higher figure than this for SMP.
The processing cost for mild Cheddar was estimated at £322/t. This compares with
the current MCVE figure of £250 but the original scope of this is unknown. The
increases in processing costs compared with those in the original AMPE and MCVE
formulae were proved to be in line with general dairy product manufacturing cost
inflation.
The main reason for the increase in processing cost of SMP in relation to butter is
the very significant energy price increases that have been seen since around 2003/4.

Report produced by Ken Burgess Associates on behalf of DairyCo 45
There is an argument for linking the SMP process cost in particular to an energy
index, but the downside of this would be to neglect any trend in more efficient energy
utilisation in product manufacture. For example, the use of CHP (combined heat and
power) is increasing within the EU and other energy initiatives are also seen, eg
biofuel fired boilers.
The review of processing costs re-emphasised the large impact that the degree of
plant utilisation can have on unit product costs. The estimates provided must be
seen in this context as broad, general estimates rather than actual production costs
at specific plants. Their key value as part of a market indicator is to provide a base
against which trends in wholesale product prices can be translated back into a milk
equivalent.
7.4 Standardised SMP
The analysis in sections 4 and 5 developed estimates for the conversion factors and
process costs associated with producing standardised SMP. In world markets,
standardised SMP is now the commodity traded product.
However, it is noted that, within a GB context, there is only one plant likely to be
producing standardised SMP on a regular basis, and that a sensitive approach will
be necessary in coming to a reasonable processing cost figure for this relatively new
commodity. One approach worthy of consideration would be to use the Kiel figure as
the basis for the variable cost element, alongside the fixed cost element for the
conventional product. This would ensure that the variable cost was based on a wider
dataset than would be available in the GB alone, while maintaining the scope of
variable and fixed cost approach in the indicators for the other products.
Report produced by Ken Burgess Associates on behalf of DairyCo 46
8. Conclusions and Recommendations
8.1 Review objectives
This review sets out to answer the specific questions outlined in the project
objectives, summarised in the introduction to the report. These are addressed first,
before recommendations are made.
With regard to the production costs in the formulas, these were shown to be lower
than current commercial practice with energy costs in spray drying identified as one
of the key drivers in the difference. The scope of the costs has also been clarified in
the process of the study, and a revised set of costs proposed for the key commodity
products.
The yield factors were found to be representative with the exception of the factor for
whey cream. The current factor for cheese was found to be slightly pessimistic and a
new factor was estimated for use in the case where SMP is standardised with
respect to protein content.
Plant utilisation was shown to have a large bearing on efficiency, with labour and
non-labour processing rates varying by factors between 4 and 6. A realistic utilisation
of 65% was chosen as representative of modelling commodity manufacture in the
UK.
The use of wholesale prices for products was confirmed as being a helpful measure
of the market. Overall, the industry takes the AMPE and MCVE indicators very
seriously and uses them in their own organisations. However, consistent feedback
was received to the effect that cost inflation had not been taken into account
sufficiently frequently.
Finally, an estimated transport cost figure should continue to figure alongside the
indicators as it does currently. This is established practice in other countries and
helps provide a picture of the supply chain from farm to product.
Report produced by Ken Burgess Associates on behalf of DairyCo 47
8.2 Recommendations
8.2.1 AMPE/MCVE
As a result of this review, there are a number of items that should be introduced to
update the AMPE and MCVE indicators.
AMPE
While the current conversion factors for butter and conventional SMP are broadly
correct, the introduction of protein standardised SMP as the mainstream format of
this product requires a new conversion factor and associated process cost.
The existing AMPE margin costs related to the intervention system should be
removed, ie the cost for delayed payment, along with the transport cost to an
intervention store. The same applies to the buttermilk dilution factor. The revised
process cost estimates for butter and SMP should then be incorporated into the
AMPE formula in place of the current fixed and variable cost elements.
The inclusion of a profit margin is seen as a policy decision rather than one which
has strong technical or economic drivers.
The AMPE formula should then follow the same format as MCVE, ie:
Potential value of milk = Income - costs – (profit, if included)
For AMPE, the products would be butter, SMP and buttermilk powder.
MCVE
Consideration should be given to modifying the conversion factor for mild Cheddar to
9,350l/t, or even to 9,300l/t based on the yield data presented. The current whey
butter conversion factor (133,000l/t) needs updating and should be moved to the
estimated value of 218,000l/t which is in line with industry practice.
The revised process cost estimates should be incorporated into the MCVE model.

Report produced by Ken Burgess Associates on behalf of DairyCo 48
8.2.2 General recommendation
In view of the number of potential changes that the above recommendations would
bring, it is suggested that a holistic approach is taken.
There are a number of potential steps in moving to a revised AMPE/MCVE system:
i) Decide whether to maintain the two market indicators, or consider moving to a
mixed product indicator.
ii) Decide the scope of the processing costs within the AMPE and MCVE formulae.
iii) Establish a standard composition milk (eg 4% fat, 3.3% protein) as a basis for
standardised conversion factors.
iv) Incorporate protein standardised SMP as the appropriate SMP variant, along
with appropriate new conversion factors and process costs.
v) Incorporate the revised process costs for the commodity products, together with
the revised conversion factors for cheese and whey butter.
vi) Communicate the proposed changes to the industry with a changeover
timetable.
vii) Introduce the change, showing clearly how the new and old approaches relate to
each other
viii) Review the process cost elements on a three to five-yearly basis.

Report produced by Ken Burgess Associates on behalf of DairyCo 49
References AMPE Guide; DairyCo @ www.dairyco.org.uk/market-indicators/milk-prices-contracts/market-indicators/ampe-guide Black, J.H in Humphreys, K; “Jelen’s Cost and Optimization Engineering”; 3rd edition, 1991, McGraw Hill CDF; Canadian Dairy Federation, Gilles Froment, Canadian Dairy Commission, Ontario, Canada personal communication CDFA; “Butter and Powder Yields”, DMB-PY-101, 1998 CDFA; California Department of Food and Agriculture, Sacramento, CA “Manufacturing Cost Manual”, 2011 data Cornell University; “Manufacturing Costs in Ten Butter/Powder Processing Plants”, Dept Agricultural Economics,1989 COWI Consulting Engineers and Planners AS; “Cleaner Production Assessment in Dairy Processing”, UNEP & Danish Environment Protection Agency, 2000 Dairy Australia, Annual Report 2009/10; Appendix 3 Dairy Technology Handbook, APV, 1990 DIN; Dairy Industry Newsletter UK Milk Reports; 1997, 2001 EC Dairy Facts & Figures, 1994, Residuary Milk Marketing Board Enterprise Ireland; “Resource Efficiency in Ireland’s Dairy Processing Sector”, 2010 EU Report, 2011: Producer prices @ ec.europa.eu/agriculture/eval/reports/dairy/chapter6_en.pdf FAO Agribusiness Handbook, Milk/Dairy Products 2009 Fox et al; “Fundamentals of Cheese Science”, Aspen, 2000, p 174 GEA “Milk Powder Factory”, Niro A/S 2004 Geary, U et al; Development and application of a processing model for the Irish Dairy Industry, J. Dairy Science, 2010. Geary, U et al; Spring calving effects on farm, processor and industry profitability for the Irish dairy industry. Journal of Agricultural Science, 2013. Harding, F; “Milk Quality”, 1995, Blackie Humphreys, K; “Basic Cost Engineering”; 3rd edition, 1996, CRC Press
Report produced by Ken Burgess Associates on behalf of DairyCo 50
IDB; Irish Dairy Board, Annual Report 2007, www.idb.ie/facts13.htm IDF Bulletin 401/2005; Energy Use in Dairy Processing IFCN Dairy Report 2012, IFCN, International Farm Comparison Network IFE Informations- und Forschuchzentrum fur Ernahrungswirtschaft (Research Centre for Food Economics), Kiel; 2013 MCVE help sheet; AMPE Guide; DairyCo @ www.dairyco.org.uk/market-indicators/milk-prices-contracts/market-indicators/mcve-help-sheet Nyborg, N; in “Milk protein Definition & Standardisation’, IDF, 1994 O’Callaghan, D, “Optimising plant scale for expansion in milk production - Engineering Aspects”, SDT Conference, Cork, September 2012 Shalloo, L; personal communication, 2013 UK Dairy Facts & Figures, 1980-1993, Federation of UK Milk Marketing Boards USDA; USDA Agricultural Marketing Service, Marketing order, Price Formula-2000, @ www.ams.usda.gov US EIA; US Energy Information Administration, www.eia.gov, 2013
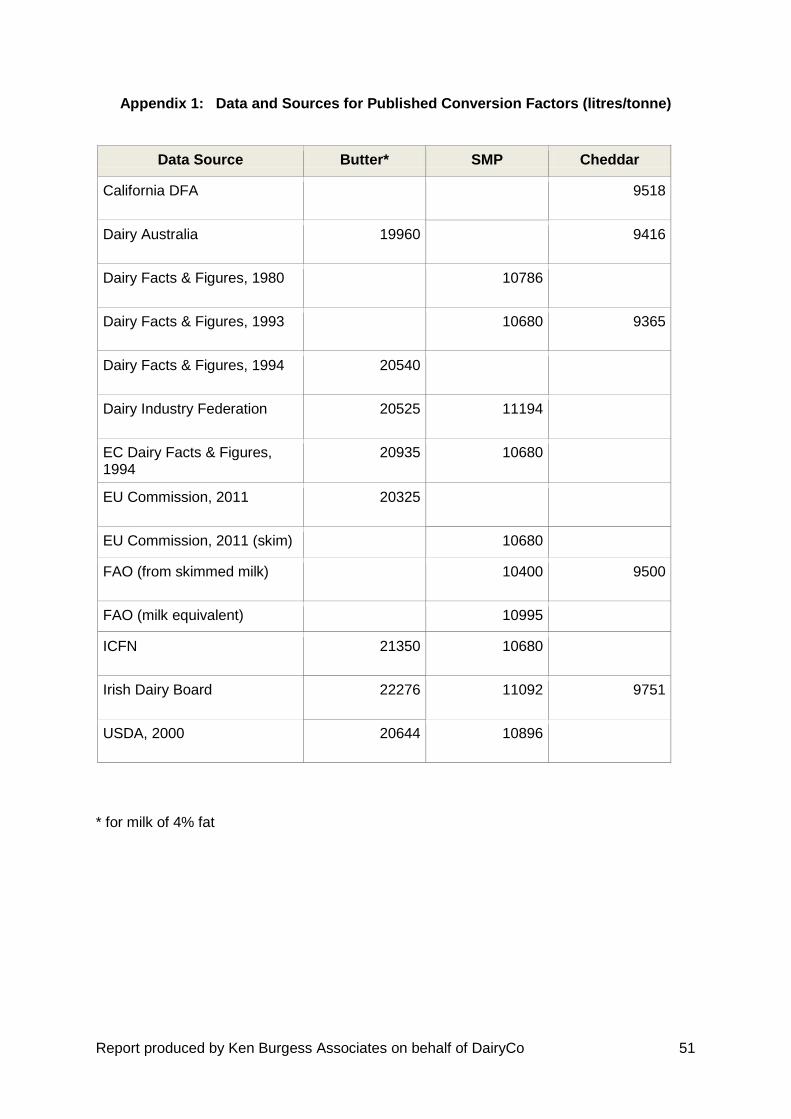
Report produced by Ken Burgess Associates on behalf of DairyCo 51
Appendix 1: Data and Sources for Published Conversion Factors (litres/tonne)
Data Source Butter* SMP Cheddar
California DFA 9518
Dairy Australia 19960 9416
Dairy Facts & Figures, 1980 10786
Dairy Facts & Figures, 1993 10680 9365
Dairy Facts & Figures, 1994 20540
Dairy Industry Federation 20525 11194
EC Dairy Facts & Figures, 1994
20935 10680
EU Commission, 2011 20325
EU Commission, 2011 (skim) 10680
FAO (from skimmed milk) 10400 9500
FAO (milk equivalent) 10995
ICFN 21350 10680
Irish Dairy Board 22276 11092 9751
USDA, 2000 20644 10896
* for milk of 4% fat

Report produced by Ken Burgess Associates on behalf of DairyCo 52
Appendix 2: Skimmed Milk & Butter Conversion Factor Issues
1. Solids not Fat content of Milk
The solids not fat (SNF) content of milk is a necessary starting point for calculating conversion factors for milk based powders such as skimmed milk powder (SMP). The SNF content of UK milk used to be measured annually by the MMBs and published in Dairy Facts and Figures. The last date of this regular publication was 1984, when the average SNF for E&W was 8.75%. In the current century, only milk protein values are published regularly (by Defra and DairyCo) so it is necessary to estimate the SNF from this base protein value as follows. Basis for SNF estimation The average protein to SNF ratio for UK milk is 37.4% (Nyborg, 1994). The average UK protein value for the past three years has been 3.27%, giving a corresponding SNF of 3.27/0.374 = 8.74%. This is consistent with average current milk composition, ie 3.27% protein, 4.55% lactose and 0.9% vitamins, minerals and other minor constituents (Harding, 1995), giving a SNF of 8.72%. For the sake of prudence, SNF in raw milk of 8.70% is, therefore, assumed in this study. 2. Methods for expressing SMP and Powder Yield from Milk There are three different ways in which the yield of SMP or overall milk powder (SMP
and BMP combined) can be calculated. The basis for this is illustrated in the process
model diagram below. Just over 5% of the milk, therefore, goes into the buttermilk
stream, rather than directly into the skimmed milk.
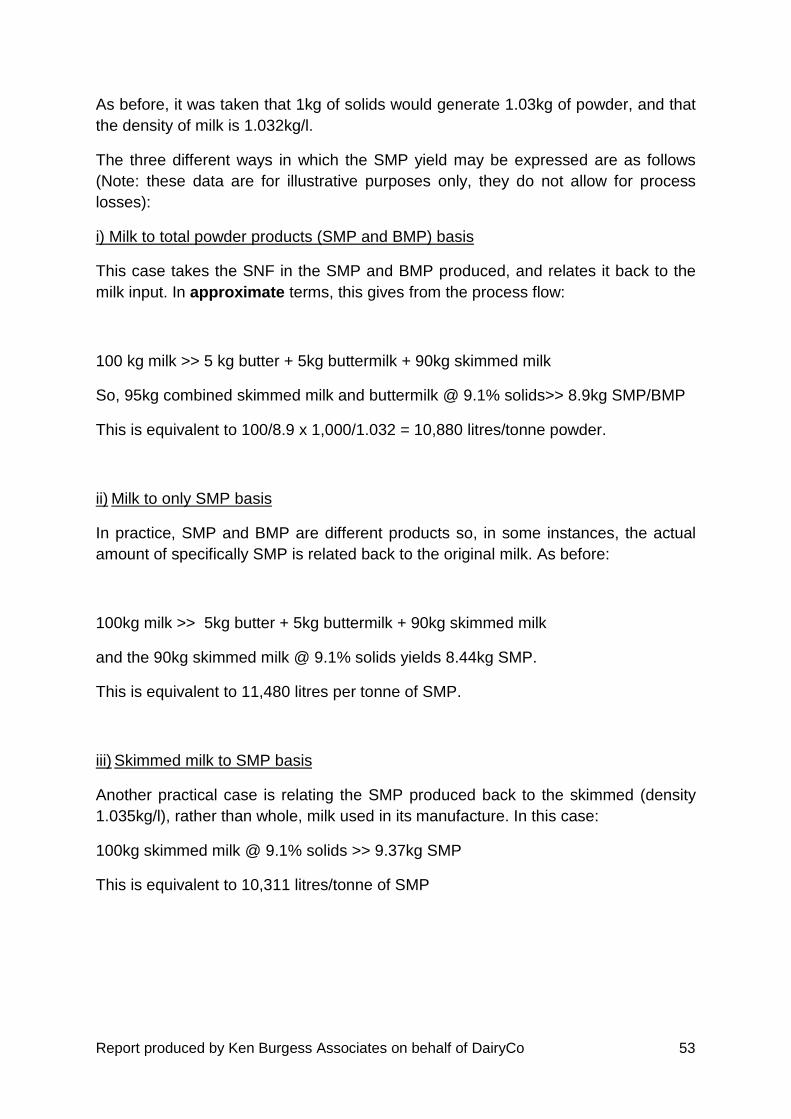
Report produced by Ken Burgess Associates on behalf of DairyCo 53
As before, it was taken that 1kg of solids would generate 1.03kg of powder, and that
the density of milk is 1.032kg/l.
The three different ways in which the SMP yield may be expressed are as follows
(Note: these data are for illustrative purposes only, they do not allow for process
losses):
i) Milk to total powder products (SMP and BMP) basis
This case takes the SNF in the SMP and BMP produced, and relates it back to the
milk input. In approximate terms, this gives from the process flow:
100 kg milk >> 5 kg butter + 5kg buttermilk + 90kg skimmed milk
So, 95kg combined skimmed milk and buttermilk @ 9.1% solids>> 8.9kg SMP/BMP
This is equivalent to 100/8.9 x 1,000/1.032 = 10,880 litres/tonne powder.
ii) Milk to only SMP basis
In practice, SMP and BMP are different products so, in some instances, the actual
amount of specifically SMP is related back to the original milk. As before:
100kg milk >> 5kg butter + 5kg buttermilk + 90kg skimmed milk
and the 90kg skimmed milk @ 9.1% solids yields 8.44kg SMP.
This is equivalent to 11,480 litres per tonne of SMP.
iii) Skimmed milk to SMP basis
Another practical case is relating the SMP produced back to the skimmed (density
1.035kg/l), rather than whole, milk used in its manufacture. In this case:
100kg skimmed milk @ 9.1% solids >> 9.37kg SMP
This is equivalent to 10,311 litres/tonne of SMP

Report produced by Ken Burgess Associates on behalf of DairyCo 54
3. EU Conversion factor for SMP
The EU Commission has consistently used a SMP conversion factor of 11kg skimmed milk
per kg SMP in its IMPE calculation. This factor was introduced in the late 1970s when the
prevailing technology in SMP drying plants was associated with significantly higher losses
than today’s good practice (CDFA reported up to 4% in 1998).
This can be seen from the following calculation:
100kg skimmed milk @ 9% solids should give 9 x 1.03 = 9.27kg SMP, equivalent to 10.8kg
skimmed milk to 1kg SMP.
The 1.03 factor from solids to powder allows a 1% loss, while the EU allowance of 11 rather
than 10.8 gives another 2%, giving an overall loss allowance of 3%. This is a very dated
waste allowance as current best practice should achieve no more than 1% (CDFA, 1998).
4. Butter and SMP Mass Balance Calculations
The milk input is set at 100 kg with a fat content of 4%. The fat content of skimmed
milk and butter are assumed as 0.06% and 81.5%, respectively.
Using the earlier process model for cream and butter production again:
For the cream production:
kg cream = kg milk (% fat in milk - % fat in skim milk)/(% fat in cream - % fat in skim
milk)
= 100 (4.0 - 0.06)/(40 - 0.06) = 9.86kg cream @ 40% fat
For the butter production:
kg butter = kg cream (% fat in cream - % fat in b’milk)/(% fat in cream - % fat in
b’milk)
= 9.86 (40 - 0.5)/(81.5 - 0.5) = 4.81kg, and thus 5.05kg buttermilk
For the butter, wastage is assumed at 1% of to give 4.76kg butter from 100kg milk
Converting this from kg/100 kg milk to litres/tonne gives:
Butter conversion factor = 100/1.032/4.76 = 20,357 litres/tonne
For the powder production:
For the powder, wastage in liquid processing is assumed at 0.5% (the 1.03 factor to
convert solids to powder incorporates a drying process loss)
kg skimmed milk and buttermilk combined = 100 - 4.81 = 95.19kg @ 9.12% solids
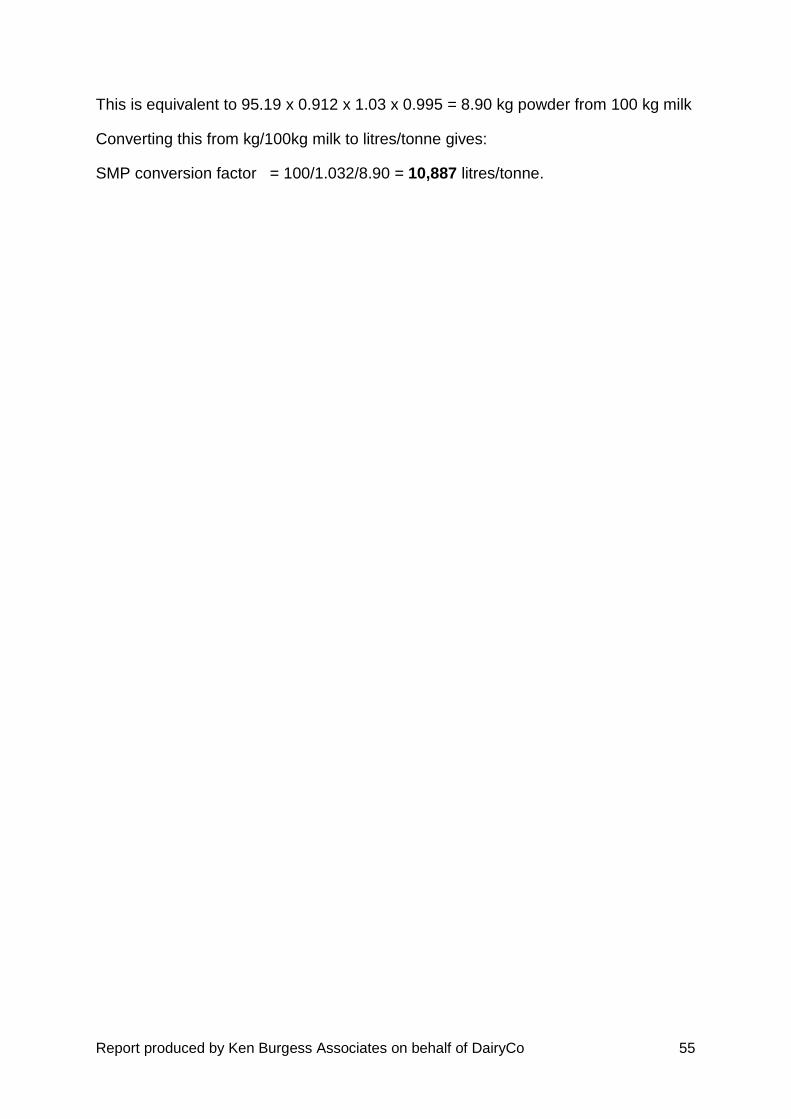
Report produced by Ken Burgess Associates on behalf of DairyCo 55
This is equivalent to 95.19 x 0.912 x 1.03 x 0.995 = 8.90 kg powder from 100 kg milk
Converting this from kg/100kg milk to litres/tonne gives:
SMP conversion factor = 100/1.032/8.90 = 10,887 litres/tonne.

Report produced by Ken Burgess Associates on behalf of DairyCo 56
Appendix 3: California CDFA Dairy Product Costs
The CDFA costs are allocated into categories (processing labour, processing non-
labour, packaging, miscellaneous ingredients and general and administrative). The
main elements of the processing non-labour category are energy, water & effluent,
repairs and maintenance, depreciation, chemicals and storage. A return on
investment cost is also included in the CDFA costs, but this is not included in the
following discussion as it is outside the scope of the process cost review.
A summary of the 2011 data is given in the table below, with the cents/lb figures in
the original report converted to p/kg.
Table A 3.1: Summary of CDFA cost studies on butter, cheese, SMP & whey
powder
Cost Category Butter Cheese SMP (NFDM) Whey powder
Processing labour 8.4 7.56 4.97 8.7
Processing non-labour
10.15 10.71 15.76 20.39
Packaging 1.62 2.42 1.92 1.73
Misc. ingredients 0.33 3.48 - -
General and administrative
2.27 3.01 1.85 0.36
Total 22.8 27.19 24.5 31.17
Note: Table uses weighted average figures

Report produced by Ken Burgess Associates on behalf of DairyCo 57
Appendix 4: Moorepark Dairy Product Processing Model
A summary of the cost elements in the Moorepark model is given in the table below
(Geary et al, 2010):
Table A4.1: Moorepark processing model volume and product-related costs
Cost element (€) Cheese Butter SMP Whey powder
Volume costs, /l
Standardisation (fat)
0.005 0.005 0.005 0.005
Processing milk 0.0125 0.0041 0.0125 0.0044
Product costs, /t:
Processing product
125.78 98.59 173.39 251.96
Packaging 40.9 31.36 40.9 40.9
In addition to these variable costs, the model incorporates a fixed cost of 1.5 c/l
(Geary et al, 2012). This was estimated by one of the authors to equate to
approximately €100/tonne of product (Shalloo, 2013).
The main use of this model at present is the evaluation of different scenarios in the
Irish dairy industry, but it is possible to use the data to develop estimates of
production costs by assuming a similar cost per litre for the liquid processing part of
product production for each commodity.
The Irish model includes provision for storage, distribution and marketing costs since
these products are stored for several months during the trough milk products season
and are shipped globally. These categories of cost have, therefore, been excluded in
the figures.
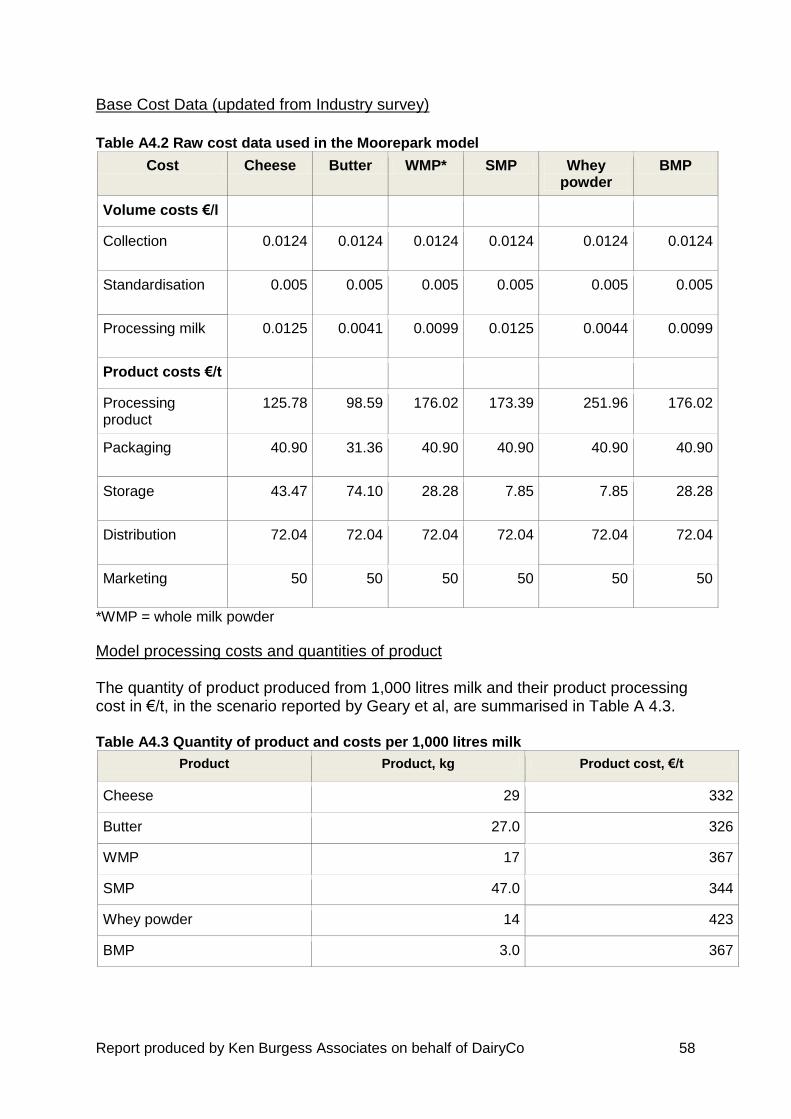
Report produced by Ken Burgess Associates on behalf of DairyCo 58
Base Cost Data (updated from Industry survey)
Table A4.2 Raw cost data used in the Moorepark model
Cost Cheese Butter WMP* SMP Whey powder
BMP
Volume costs €/l
Collection 0.0124 0.0124 0.0124 0.0124 0.0124 0.0124
Standardisation 0.005 0.005 0.005 0.005 0.005 0.005
Processing milk 0.0125 0.0041 0.0099 0.0125 0.0044 0.0099
Product costs €/t
Processing product
125.78 98.59 176.02 173.39 251.96 176.02
Packaging 40.90 31.36 40.90 40.90 40.90 40.90
Storage 43.47 74.10 28.28 7.85 7.85 28.28
Distribution 72.04 72.04 72.04 72.04 72.04 72.04
Marketing 50 50 50 50 50 50
*WMP = whole milk powder
Model processing costs and quantities of product The quantity of product produced from 1,000 litres milk and their product processing cost in €/t, in the scenario reported by Geary et al, are summarised in Table A 4.3. Table A4.3 Quantity of product and costs per 1,000 litres milk
Product Product, kg Product cost, €/t
Cheese 29 332
Butter 27.0 326
WMP 17 367
SMP 47.0 344
Whey powder 14 423
BMP 3.0 367

Report produced by Ken Burgess Associates on behalf of DairyCo 59
Calculation of base liquid processing cost First, the milk collection cost (€0.0124/l) for the 1,000 litres is subtracted from the €75.30 = €62.90 The net total processing cost reported for this mix of products was €62.90 for the 1,000 litres. The processing cost for each product = the base liquid cost/t + the product cost, This gives the average liquid processing cost/tonne = €116 This is the figure used in the Table below:
Table A 4.4: Product processing cost estimates derived from Moorepark model
Cost area, €/t Cheese Butter SMP Whey powder
Fixed cost 100 100 100 100
Liquid processing
116 116 116 116
Product processing
126 99 174 252
Packaging 41 31 41 41
Total 383 346 431 509
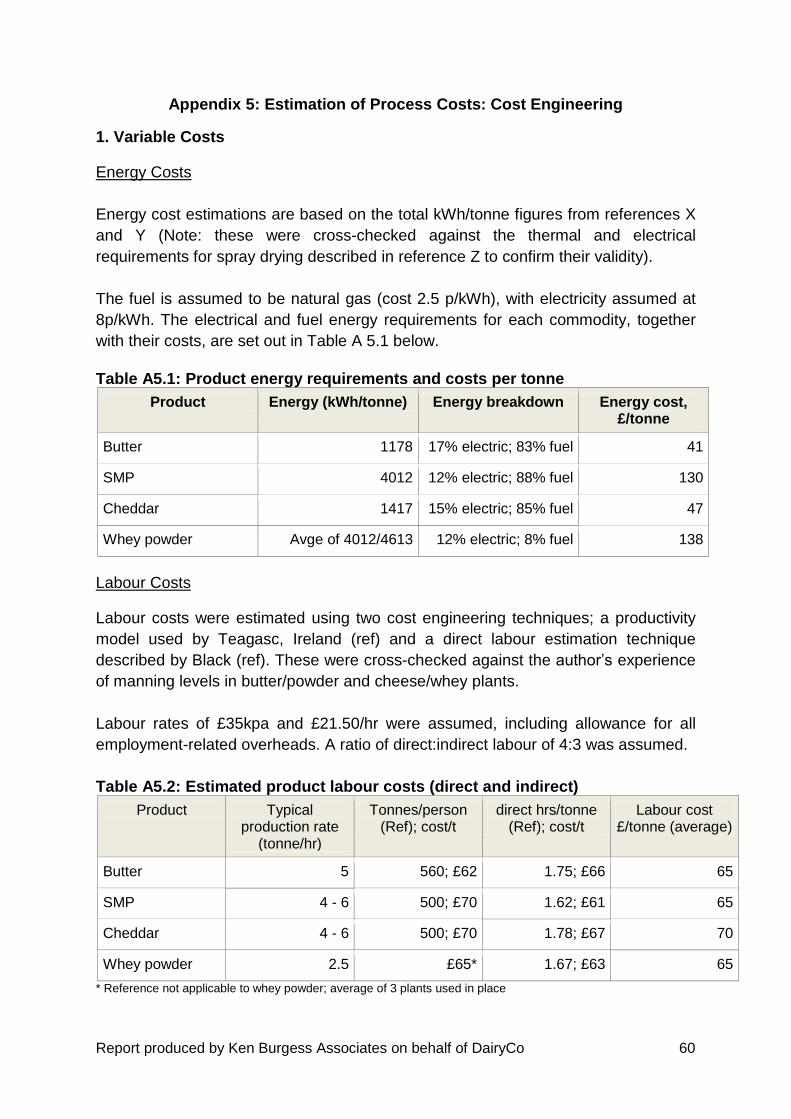
Report produced by Ken Burgess Associates on behalf of DairyCo 60
Appendix 5: Estimation of Process Costs: Cost Engineering
1. Variable Costs
Energy Costs
Energy cost estimations are based on the total kWh/tonne figures from references X
and Y (Note: these were cross-checked against the thermal and electrical
requirements for spray drying described in reference Z to confirm their validity).
The fuel is assumed to be natural gas (cost 2.5 p/kWh), with electricity assumed at
8p/kWh. The electrical and fuel energy requirements for each commodity, together
with their costs, are set out in Table A 5.1 below.
Table A5.1: Product energy requirements and costs per tonne
Product Energy (kWh/tonne) Energy breakdown Energy cost, £/tonne
Butter 1178 17% electric; 83% fuel 41
SMP 4012 12% electric; 88% fuel 130
Cheddar 1417 15% electric; 85% fuel 47
Whey powder Avge of 4012/4613 12% electric; 8% fuel 138
Labour Costs
Labour costs were estimated using two cost engineering techniques; a productivity
model used by Teagasc, Ireland (ref) and a direct labour estimation technique
described by Black (ref). These were cross-checked against the author’s experience
of manning levels in butter/powder and cheese/whey plants.
Labour rates of £35kpa and £21.50/hr were assumed, including allowance for all
employment-related overheads. A ratio of direct:indirect labour of 4:3 was assumed.
Table A5.2: Estimated product labour costs (direct and indirect)
Product Typical production rate
(tonne/hr)
Tonnes/person (Ref); cost/t
direct hrs/tonne (Ref); cost/t
Labour cost £/tonne (average)
Butter 5 560; £62 1.75; £66 65
SMP 4 - 6 500; £70 1.62; £61 65
Cheddar 4 - 6 500; £70 1.78; £67 70
Whey powder 2.5 £65* 1.67; £63 65
* Reference not applicable to whey powder; average of 3 plants used in place

Report produced by Ken Burgess Associates on behalf of DairyCo 61
Raw material costs
The raw material costs (ingredients and packaging) were calculated from averages
of the commercial data supplied.
2. Semi-variable and fixed costs
The remaining elements of product cost structure (repairs and maintenance, water,
waste treatment, chemicals, storage, depreciation, general and administration) were
compiled in different ways for each commodity product, depending on the availability
of information.
The data are summarised in Table A 5.3.
SMP
Depreciation was calculated on the basis of a capital cost estimate for a 3 tonne/hr
drier obtained from Teagasc (Ref). Over 20 years, this gave a depreciation cost of
£50/tonne. Using a similar starting point, a repair and maintenance investment of
2.5% of capital pa gives a maintenance cost per tonne of £25.
Chemicals, water and waste were taken together as an average of commercial data
for powder plants in general, as were storage costs. General and administration
costs were taken as an average between all butter and powder data available.
Butter
Depreciation was calculated on the basis of a recent large butter plant investment,
operating at 60% capacity and depreciating over 20 years. This gave a depreciation
cost of £31.50/tonne, rounded to £30.
The remaining butter cost elements were calculated as above.
Mild Cheddar
In the case of mild cheddar, a much wider range of internally consistent commercial
cost data was available, so it was possible to use averages for each of the cost
elements as the basis for the calculation.
Whey powder
Maintenance, chemicals, water, waste treatment and storage were taken as the
averages for powder manufacture as a whole. Depreciation and general overhead

Report produced by Ken Burgess Associates on behalf of DairyCo 62
and administration were the averages of commercial data, grouped together for the
sake of confidentiality.
3. Summary of estimated product cost structure
The estimates of the product cost elements are consolidated in Table A5.3 below.
Table A5.3: Consolidated product cost estimates
Cost element Butter SMP Mild Cheddar Whey powder
Variable:
Energy 41 130 47 138
Labour 65 65 70 65
Raw materials 21 21 61 21
Semi-variable/fixed:
Maintenance 20 25 25 25
Chemicals, water, waste
10 25 12 25
Storage 20 6 30 6
Depreciation 30 50 42 *
General and administration*
30 30 35 60*
Total 237 352 322 340
* General and administration combined with depreciation for whey powder
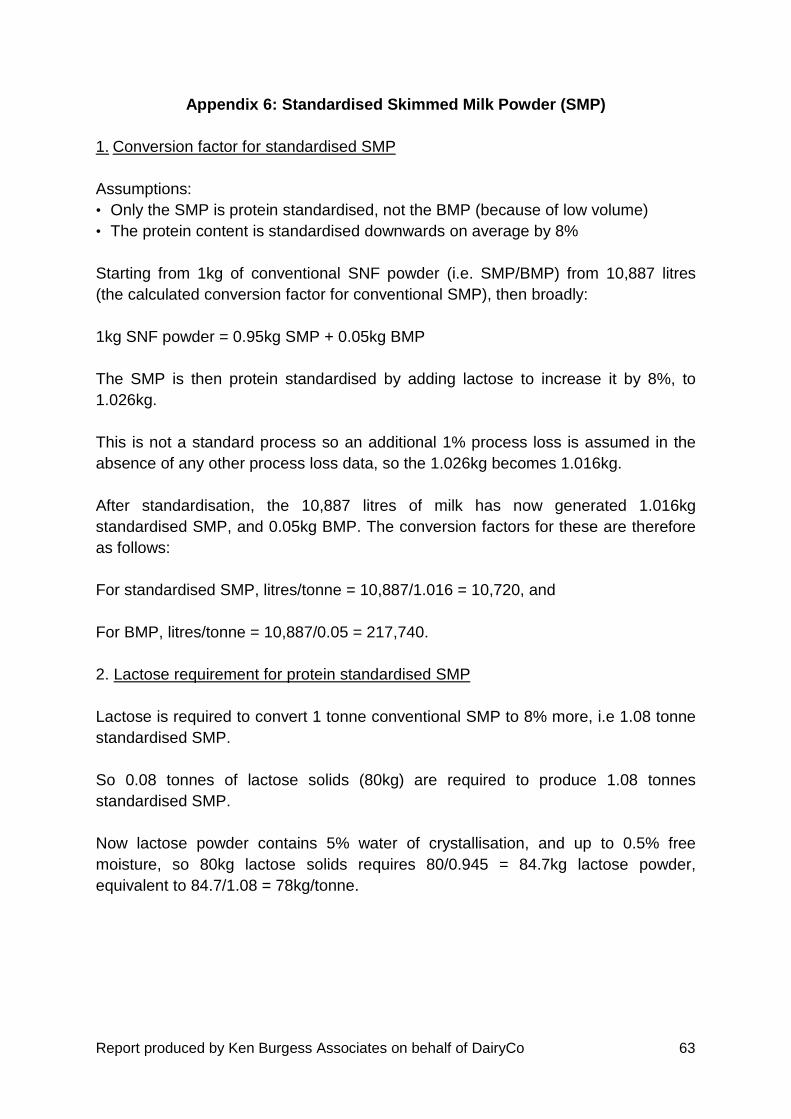
Report produced by Ken Burgess Associates on behalf of DairyCo 63
Appendix 6: Standardised Skimmed Milk Powder (SMP)
1. Conversion factor for standardised SMP
Assumptions:
• Only the SMP is protein standardised, not the BMP (because of low volume)
• The protein content is standardised downwards on average by 8%
Starting from 1kg of conventional SNF powder (i.e. SMP/BMP) from 10,887 litres
(the calculated conversion factor for conventional SMP), then broadly:
1kg SNF powder = 0.95kg SMP + 0.05kg BMP
The SMP is then protein standardised by adding lactose to increase it by 8%, to
1.026kg.
This is not a standard process so an additional 1% process loss is assumed in the
absence of any other process loss data, so the 1.026kg becomes 1.016kg.
After standardisation, the 10,887 litres of milk has now generated 1.016kg
standardised SMP, and 0.05kg BMP. The conversion factors for these are therefore
as follows:
For standardised SMP, litres/tonne = 10,887/1.016 = 10,720, and
For BMP, litres/tonne = 10,887/0.05 = 217,740.
2. Lactose requirement for protein standardised SMP
Lactose is required to convert 1 tonne conventional SMP to 8% more, i.e 1.08 tonne
standardised SMP.
So 0.08 tonnes of lactose solids (80kg) are required to produce 1.08 tonnes
standardised SMP.
Now lactose powder contains 5% water of crystallisation, and up to 0.5% free
moisture, so 80kg lactose solids requires 80/0.945 = 84.7kg lactose powder,
equivalent to 84.7/1.08 = 78kg/tonne.