structural indicators: a critical review - oecd. · pdf filestructural indicators: a critical...
TRANSCRIPT

OECD Journal: Economic Studies
Volume 2010
© OECD 2010
1
Structural Indicators: A Critical Review
byDavide Furceri and Annabelle Mourougane*
This article reviews and assesses, in terms of availability, reliability andtransparency, existing policy and outcome indicators that have been found to belinked both directly and indirectly to economic growth and living standards.Indicators aiming at capturing the political and social situation of countries, aswell as governance-related issues, are examined (e.g., political system, politicalstability, corruption, crime and violence). Topics also include product and labourmarkets, infrastructure, trade, financial indicators and composite indices ofreform.
JEL Classification: O4, P50
Keywords: structural indicators, economic performance, policy, outcome,governance
* Furceri: OECD Economics Department (e-mail: [email protected]); Mourougane: OECDEconomics Department (e-mail: [email protected]). The authors would like tothank Rüdiger Ahrend, Sveinbjörn Blöndal, Jonathan Coppel, Sean Dougherty, Giuseppe Nicoletti,Joaquim Oliveira Martins, Klaus Schmidt-Hebbel and other colleagues for helpful discussions andsuggestions. The views expressed in this paper do not necessarily reflect those of the OECD or itsmember countries.
STRUCTURAL INDICATORS: A CRITICAL REVIEW
OECD JOURNAL: ECONOMIC STUDIES – VOLUME 2010 © OECD 20102
Differences in living standards (generally proxied by income) across OECD countries
reflect both different structural policy settings and institutional characteristics. Although
there is a broad consensus that institutions and policy matter for living standards, these
are not always easily captured through reliable and timely structural indicators. In recent
years, a large number of indicators have been developed to fill this gap.
The last three decades have witnessed an intensive effort, both in the production of
policy and outcome indicators and in linking these indicators to economic growth and
living standards. This work has contributed to developing a better understanding of
growth-enhancing policies, but has sometimes relied on the misuse of indicators. For this
reason, it is useful to undertake an evaluation of these indicators and their potential use in
empirical work, relating them to growth and living standards.
Following on and expanding the work by Loayza and Soto (2003), this paper reviews
and assesses, in terms of availability, reliability and transparency, existing policy and
outcome indicators that have been used and found to be linked, both directly and indirectly,
to economic growth and living standards.
In more detail, the focus of the paper is on indicators produced by international
organisations (including the OECD), think tanks and researchers. Special attention is given
to indicators that are widely used in the literature. Coverage of the indicators discussed in
the paper is not intended to be comprehensive, but rather selective in a number of
important areas. Topics examined include product and labour markets, infrastructure,
trade, financial indicators and composite indices of reform. Moreover, indicators aiming at
capturing the political and social situation of countries, as well as governance-related
issues, are assessed (e.g., political system, political stability, corruption, crime and
violence).
The rest of the paper is organised in two main sections: the first presents a typology of
indicators that will be used throughout the paper, and the second reviews existing policy
and outcome indicators. A detailed annex documenting the main features of these
indicators can be found in Furceri and Mourougane (2009).
1. Typology of indicatorsA wide range of indicators is currently produced by international organisations as well
as individual researchers. They differ not only on their time and geographical coverage, but
also by their intrinsic nature. Structural indicators can be differentiated according to a
number of criteria, which are discussed in turn below.
1.1. Perception-based versus fact-based
Perception-based indicators rely on subjective assessments, usually drawn from
surveys. Typical examples are corruption indices. By contrast, fact-based indicators usually
rely on “hard” data derived from the legislation or institutional settings. Examples include
STRUCTURAL INDICATORS: A CRITICAL REVIEW
OECD JOURNAL: ECONOMIC STUDIES – VOLUME 2010 © OECD 2010 3
the Product Market Regulation (PMR) indicators or indices of Employment Protection
Legislation (EPL).
The distinction between perception-based and fact-based indicators is important, not
least because fact-based indicators are replicable (Table 1). Yet fact-based does not mean
objective, as these indicators also embody a significant degree of subjectivity (e.g., in the
choice of questions). Moreover, assessments of complicated rules are subject to errors of
fact and judgement, particularly when the analyst has to determine the net effect of
conflicting rules and regulations. Perception-based and fact-based indicators are
complementary sources of information. Perception-based information can be internal
(results based upon the views of respondents from within the country) or external (results
based upon assessments made by non-residents of the country).
1.2. Single versus composite indicator
A composite indicator combines different sub-indicators into a single measure.
Composite indicators have a number of advantages over single indicators. For example, if
the same concept is measured by different data sources, it is possible to increase the
coverage and reliability by combining the sources. A widely cited example is the Governance
Matters Reports from the World Bank, which draw together 25 data sources into six
composite indicators. The main weakness of composite indicators is that they are not
always well constructed or used. In particular, one of the main downsides of composite
indicators is that unless the component data are shown, it is not clear how the rating is
derived. Such a lack of clarity weakens the basis for inferring policy prescriptions. In
addition, all the existing composite indicators fail to capture the necessity to ensure
coherence among various economic policies. In most cases, the composite indicator is
simply the aggregation of unrelated sub-indicators, and the existing interactions between
these variables are ignored (Table 2). A notable exception is the summary measure of
tertiary education set-up developed by Oliveira Martins et al. (2007).
The unit chosen of the component indicator and the conversion of the underlying
information into a scale that can be aggregated are non-trivial and can sometimes be
Table 1. Fact- and perception-based measures
Fact-based measures Perception-based measures
Advantages Do not rely on personal judgement Can be subject to peer review Exogenous to economic developments occurring at the time
the data are collectedFree of noise (other than measurement errors)Ownership more distinguishable
Easier to assemble a data base Answers reflect, in part, the way regulations are enforced Can cover all levels of regulation
Drawbacks Require assembling a huge data base and assistance from governments and lawyers
Often focus only on regulation at the national level (problem in federal countries where regulation can be carried out by local governments)
Such measures cannot indicate certain ground-level features (how regulations are enforced)
The quantification of regulations requires the construction and combination of various types of indexes, raising the questions of how to code the laws and how to weight them (entry point for subjectivity)
Rely on personal judgements Issue of comparability of answers between nations (most
surveys ask questions that are specific to the country)No control on the type of questions asked Context specific
Source: Based on Nicoletti and Pryor (2006).

STRUCTURAL INDICATORS: A CRITICAL REVIEW
OECD JOURNAL: ECONOMIC STUDIES – VOLUME 2010 © OECD 20104
questioned. The choice of the weights is also not straightforward. Weights can be derived
either from theory or empirical analysis, usually principal component analysis.
Alternatively, equal weights could be applied. Although the first alternative is more
attractive from an analytical point of view, it is not without drawbacks. Indeed, some
indicators have weights varying over time and, as a result, the ranking between countries
can reflect more a change in weights than a change in policy. Robustness tests run in the
context of the re-estimation of OECD product market regulations suggest that it is
preferable to use equal weights in the multilateral surveillance process (Woefl et al., 2009).
Given the complexity of composite indicators, a number of characteristics have been
identified to help users and to avoid misinterpretation. These relate to relevance, accuracy,
timeliness, accessibility, interpretability and coherence (OECD, 2005).
1.3. Policy versus outcome measures
Policy indicators are instruments on which policy makers can have a direct impact (for
instance, tax rates). However, these measures are often an imperfect proxy of the policy
lever. Outcome measures capture the country performance in a specific domain and reflect
the effects of national policy measures or institutional settings and the international
environment. The indicator can be an intermediate, or a final, indicator of economic
performance, for instance, the unemployment or employment rates. In general, reliable
and timely measures are available, but policy makers can influence only indirectly such
indicators via policy action.
2. Review of existing structural indicatorsThis section reviews the main policy and outcome indicators currently produced by
international and other organisations. Indicators are discussed by policy topics (see the
annex in Furceri and Mourougane, 2009, for a detailed and extensive description of the
existing indicators by category).
2.1. Governance
The focus on governance has gained prominence over the last decade, following the
move toward more open markets and less direct governmental control of business
activities. Governance can be broadly defined as a system of values, processes, policies and
Table 2. Pros and cons of composite indicators
Advantages Reduces multicollinearityCan summarise complex or multidimensional issuesEasier to interpret than trying to find a trend in many separate indicatorsFacilitates the task of ranking countriesCan assess progress of countries over time on complex issuesReduces the size of a set of indicators or includes more informationPlaces issues of country performance and progress at the centre of the policy arenaFacilitates communication with the general public and promotes accountability
Drawbacks May send misleading policy messages if they are poorly constructed or misinterpretedMay invite simplistic policy conclusionsMay be misused if the construction is not transparent and lacks sound statistical or conceptual principlesThe selection of indicators and weights could be the target of political challengeMay disguise serious failing in some dimensions of policy and increase the difficulty of identifying
proper remedial actionMay lead to inappropriate policies if dimensions of performance that are difficult to measure are ignored
Source: OECD, “Handbook on Constructing Composite Indicators: Methodology and User Guide”, OECD StatisticsWorking Paper 2005/3.

STRUCTURAL INDICATORS: A CRITICAL REVIEW
OECD JOURNAL: ECONOMIC STUDIES – VOLUME 2010 © OECD 2010 5
institutions by which a society manages its economic, political and social affairs. However,
governance indicators are usually narrowed down to measure specific areas of governance,
for instance, electoral systems, corruption, human rights, public service provision, civil
society and gender equality.
Measuring governance is difficult, as this involves many institutions and players.
Formal rules can be easily observed, but informal rules are non-observable, although they
may have a greater influence on the quality of governance and require a deep
understanding of society. Moreover, because the concepts are so broad, the same terms
may be used in different ways.
Despite these difficulties, a large number of indicators have been constructed in recent
years and cover both developed and developing economies. Among the hundreds of
indicators that have emerged, the most widely used are policy, composite and perception-
based indicators.
2.1.1. Institutional factors
The first strand of governance indicators aims to measure some aspects of good
governance through institutional factors. By shaping the economic environment and
influencing the behaviour of economic agents, formal and informal institutions have an
impact on long-term growth. They are also associated with good development outcomes,
in particular poverty reduction. The World Bank Governance Matters indicators have been
pioneers in this area. They are based on expert assessments and surveys of firms and are
updated every year. They cover different areas of governance, ranging from citizens’
freedom to political stability and regulatory effectiveness. These indicators are constructed
in such a way that their average across all countries is always zero and the standard
deviation is always one. As a result, their scale is arbitrary and they cannot be used to
monitor changes in governance levels for a given country. Moreover, these indicators are
subject to very large measurement errors. To address this issue, they are usually reported
together with confidence intervals. However, despite all the precautions taken in the
publications, these indicators are sometimes misused in comparisons over time or time-
series analysis. The World Bank also publishes country information through its country
policy and institutional assessment, which is based on the World Bank staff’s assessment,
but only part of this is publicly available.
The composite and sub-indicators of Governance Matters indicators are now widely
reported in the press and used in academic research. These indicators are timely and cover
a wide range of countries. Transparency in the methodology and in the source used has
significantly improved over the years. Since 2006, underlying data from virtually all the
individual data sources are available so that it is possible to replicate the data.
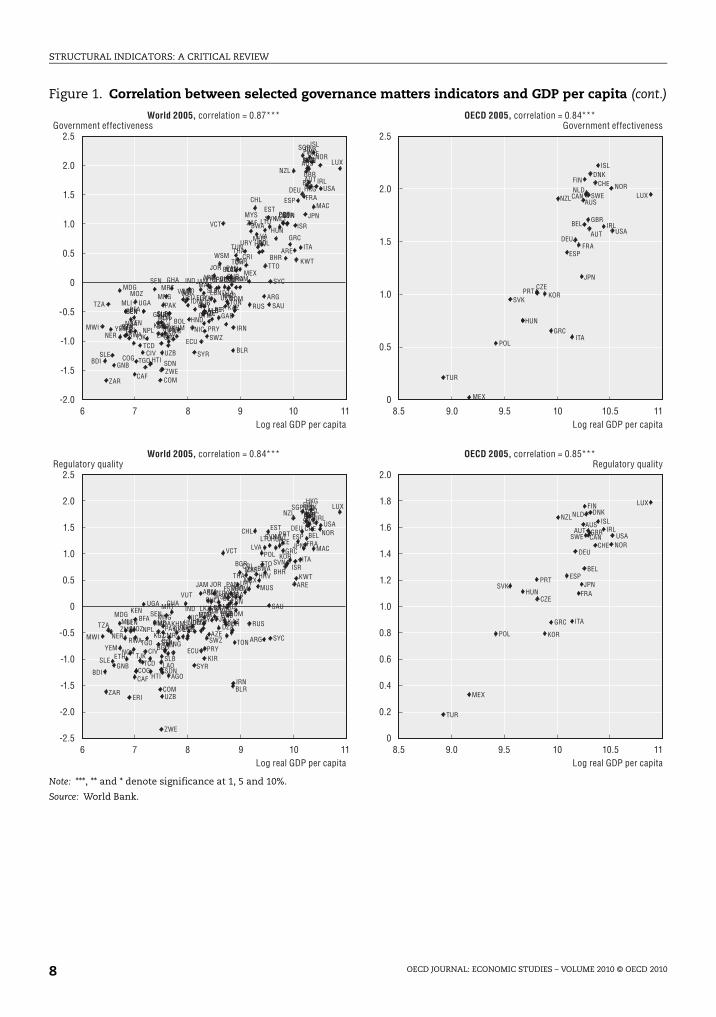
Governance indicators are strongly correlated with the current level of national
income per capita (Table 3, Figure 1), whether the sample covers the world or is restricted
to the OECD. By contrast, correlations between those indicators and GDP per capita growth
are much lower and sometimes not significant. This is consistent with the concepts of
absolute and conditional convergence (Barro and Sala-i-Martin, 1991; Sala-i-Martin, 1995;
Furceri, 2006). Correlations should nonetheless be interpreted with caution as they do not
control for the effects of additional variables.

STRUCTURAL INDICATORS: A CRITICAL REVIEW
OECD JOURNAL: ECONOMIC STUDIES – VOLUME 2010 © OECD 20106
However, the use of these indicators can be questioned on a number of grounds (Arndt
and Oman, 2006):
● The indicators are inherently subjective and not grounded in theory. As a result, the
same indicator can lead to very different interpretations.
● The data rely on a large variety of sources consisting of surveys of firms and individuals,
as well as the assessments of commercial risk-rating agencies, non-governmental
organisations and a number of multilateral aid agencies and other public sector
organisations. The reliability of these sources is variable. In total the dataset draws on
33 sources.
● The indicators embody large measurement errors. For some developing countries, the
indicator relies on a limited number of surveys, increasing further the risk of
measurement error. To partially address these issues, confidence intervals around the
main World Bank indicators are published. A change in an indicator over time is
significant only when the confidence intervals of the new and old indicators do not
overlap.
● The indicators do not permit the identification of trends over time. The changing
composition of many of the indicators means that the indicator cannot be reliably used
to compare levels of governance over time in a given country or among countries. This
implies that monitoring of progress is not possible.
● The aggregation procedure assigns less weight to the sources that are less correlated
with other sources. Typically, more weight is given to expert assessment and firm
surveys than to population surveys, which often carry no weight. This suggests that
measurement errors are uncorrelated across sources and are a questionable
assumption. Moreover, weights attributed to different sources vary between countries,
lowering cross-country comparability.
Table 3. Correlation between governance indicators and GDP per capita
log (GDP per capita)Year
World OECD
Voice and accountability 0.73*** 0.82*** 2005
Political stability 0.73*** 0.82*** 2005
Government effectiveness 0.87*** 0.84*** 2005
Regulatory quality 0.84*** 0.85*** 2005
Rule of law 0.83*** 0.86*** 2005
Control of corruption 0.82*** 0.81*** 2005
Corporate Illegal corruption 0.75*** 0.8*** 2005
Corporate legal corruption 0.52*** 0.69*** 2005
Bribe –0.2*** 0.01 2005
Corruption perception index 0.8*** 0.8*** 2005
Corruption (WDI) –0.28*** 2005
Property rights (doing business) –0.53*** –0.2 2008
Political constraint (Henniz, 2006) 0.31*** 0.29 2004
Polity IV 0.42*** 0.7*** 2005
State fragility Index –0.88*** –0.46*** 2001
Note: ***, ** and * denote significance at 1, 5 and 10%.Source: OECD Secretariat.

STRUCTURAL INDICATORS: A CRITICAL REVIEW
OECD JOURNAL: ECONOMIC STUDIES – VOLUME 2010 © OECD 2010 7
Figure 1. Correlation between selected governance matters indicators and GDP per capita
Note: ***, ** and * denote significance at 1, 5 and 10%.
Source: World Bank.
2.0
1.5
1.0
0.5
-0.5
0
-1.0
-1.5
-2.5
-2.0
2.0
1.5
1.0
0.5
0
-0.57 9 6 78 11 1110 8 9 106
2.0
1.5
1.0
0.5
-0.5
0
-1.0
-1.5
-2.5
-2.0
2.0
1.5
1.0
0.5
0
-1.5
-0.5
7 9 9.08.5 9.58 11 1110 10 10.56
AGO
ALB
ARE
ARG
ARM
AUSAUT
AZEBDI
BEL
BEN
BFA BGD
BGR
BHR
BLR
BLZ
BOL
BRA
BWA
CAF
CANCHE
CHL
CHNCIV
CMRCOG
COL
COM
CPV
CRICZE
DEU
DJI
DNK
DOM
DZA
ECU
EGY
ERI
ESPEST
ETH
FIN
FJI
FRA
FSM
GAB
GBR
GEO
GHA
GINGMB
GNB
GRC
GTM
GUY
HKG
HND
HRV
HTI
HUN
IDN
IND
IRL
IRN
ISL
ISR
ITA
JAM
JOR
JPN
KAZ
KEN
KGZ
KHM
KIR
KOR
KWT
LAO
LBNLKA
LSO
LTU
LUX
LVA
MAC
MARMDA
MDG
MEX
MKD
MLI
MLT
MNGMOZ
MRT
MUS
MWI
MYS
NAM
NER
NGA
NIC
NLDNOR
NPL
NZL
PAK
PAN
PERPHL
PNG
POL
PRT
PRY
ROM
RUS
RWA SAU
SDN
SEN SGPSLB
SLE
SLVSTP SUR
SVKSVN
SWE
SWZ
SYC
SYRTCDTGO
THA
TJK
TON
TTO
TUN
TUR
TZA
UGA
UKR
URY
USA
UZB
VCT
VNM
VUT
WSM
YEM
ZAF
ZAR
ZMB
ZWE
AUS
AUTBEL
CAN
CHE
CZE
DEU
DNK
ESP
FIN
FRA GBR
GRCHUN
IRLISL
ITAJPN
KOR
LUX
MEX
NLDNORNZL
POL
PRT
SVK
SWE
TUR
USA
AUS
AUT
BEL
CAN
CHE
CZEDEU
DNK
ESP
FIN
FRAGBR
GRC
HUN
IRL
ISL
ITA
JPN
KOR
LUX
MEX
NLD
NORNZL
POL
PRT
SVK
SWE
TUR
USA
AGO
ALB
ARE
ARGARM
AUS
AUT
AZE
BEL
BEN
BFA
BGR
BHR
BLRBLZ
BOL
BRA
BWA
CAF
CAN
CHE
CHL
CHNCMR
COG
COM
CPV
CRI
CZEDEU
DJI
DNK
DOM
DZA
ECUEGYERI
ESP
EST
FIN
FJIFRA
FSM
GABGBR
GEO
GHA
GIN
GMB
GNB
GRC
GTM
GUY
HKG
HND
HRV
HUN
IDN
IND
IRL
IRN
ISL
ISR
ITA
JAMJOR
JPN
KAZ
KENKGZ
KHM
KIR
KOR
KWT
LAO
LBN
LSO
LTU
LUX
LVA
MAC
MARMDA
MDGMEX
MKD
MLI
MLT
MNG
MOZ
MRT
MUS
MWI
MYS
NAM
NER
NIC
NLD
NORNZL
PAN
PERPHL
PNG
POL
PRT
PRY
ROM
RUS
RWA SAU
SEN
SGP
SLB
SLE
SLV
STPSUR
SVK
SVN
SWE
SWZ
SYC
SYR
TCD
THA
TON
TTO
TUN
TUR
TZA UKR
URY
USA
VCT
VNM
VUT
WSM
ZAFZMB
BDI
BGD
CIV
COL
ETH
HTI
LKA
NGA
NPL
PAK
SDN
TGO
TJKUGA
UZB
YEM
ZAR
ZWE
Log real GDP per capitaLog real GDP per capita
Voice and accountability Voice and accountabilityWorld 2005, correlation = 0.73*** OECD 2005, correlation = 0.82***
Log real GDP per capitaLog real GDP per capita
Political stability Political stabilityWorld 2005, correlation = 0.65*** OECD 2005, correlation = 0.65***
STRUCTURAL INDICATORS: A CRITICAL REVIEW
OECD JOURNAL: ECONOMIC STUDIES – VOLUME 2010 © OECD 20108
Figure 1. Correlation between selected governance matters indicators and GDP per capita (cont.)
Note: ***, ** and * denote significance at 1, 5 and 10%.
Source: World Bank.
2.5
2.0
1.5
1.0
0.5
-0.5
0
-1.0
-1.5
-2.0
2.5
2.0
1.5
1.0
0.5
07 9 8.5 9.0 9.58 11 1110 10 10.56
2.5
2.0
1.5
1.0
0.5
-0.5
0
-1.0
-1.5
-2.5
-2.0
2.0
1.0
1.2
1.4
1.6
1.8
0.8
0.6
0.4
0
0.2
7 9 8.5 9.0 9.58 11 1110 10 10.56
ALB
ARE
ARG
ARM
AUS
AUT
AZE
BEL
BENBFA
BGR BHR
BLZBRA
BWA
CANCHE
CHL
CHNCOLCPV
CRI
CZE
DEU
DNK
DOMDZA
EGY
ESPEST
FIN
FJI
FRA
FSM
GBR
GEO
GHA
GRC
GUY
HKG
HRV
HUN
IDN
IND
IRL
ISL
ISR
ITA
JAM
JOR
JPN
KAZKIR
KOR
KWT
LBNLKA
LSO
LTU
LUX
LVA
MAC
MARMDG
MEX
MKDMLI
MLT
MNGMOZMRT
MUS
MYS
NAM
NLDNOR
NZL
PAK
PAN
PER
PHL
POL
PRT
ROM
RUS SAU
SEN
SGP
SLB
SLV
SUR
SVK SVN
SWE
SYC
THA
TON
TTO
TUN
TUR
TZA UGAUKR
URY
USA
VCT
VNMVUT
WSM
ZAF
AGO
ALBAZE
BDI
BEN
BGD
BLR
BOL
CAF
CIV
CMR
COG
COM
DJI
ECU
ERIETH
GAB
GIN
GMB
GNB
GTMHND
HTI
IRNKEN KGZ KHM
LAO
MDAMWI
NER
NGANICNPL PNG PRY
RWA
SDN
SLB
SLE
STP
SWZ
SYRTCD
TGO
TJK
UZB
YEM
ZAR
ZMB
ZWE
AUS
AUT
BEL
CAN
CHE
CZE
DEU
DNK
ESP
FIN
FRA
GBR
HUN
IRL
ISL
JPN
KOR
LUXNLD NOR
NZL
PRTSVK
SWE
USA
GRCITA
MEX
POL
TUR
ALB
ARE
ARG
ARM
AUSAUT
AZE
BDI
BEL
BEN BFA
BGD
BGRBHR
BLZ
BOL
BRA
BWA
CAN
CHECHL
CHN
CIV
CMR
COG
COL
CPV
CRI
CZE
DEU
DJI
DNK
DOM
DZA
ECU
EGY
ESPEST
ETH
FIN
FJI
FRA
FSM
GAB
GBR
GEO
GHA
GIN
GMB
GNB
GRC
GTMGUY
HKG
HND
HRV
HTI
HUN
IDN
IND
IRLISL
ISRITA
JAM JOR
JPN
KAZ
KEN
KGZ
KHM
KIR
KOR
KWT
LAO
LBNLKA
LSO
LTU
LUX
LVA MAC
MARMDA
MDG
MEX
MKD
MLI
MLT
MNG
MOZ
MRT
MUS
MWI
MYS
NAM
NER
NGA
NIC
NLD
NOR
NPL
NZL
PAK
PANPER
PHL
PNG
POL
PRT
PRY
ROM
RUS
RWA
SAU
SDN
SEN
SGP
SLBSLE
SLV
STP
SUR
SVK
SVN
SWE
SWZ SYC
SYRTCD
TGO
THA
TJK
TON
TTO
TUN
TUR
TZA
UGAUKR
URY
USA
VCT
VNM
VUT WSM
YEM
ZAF
ZMB
AGO
BLRCAF
COMERI
IRN
UZBZAR
ZWE
AUSAUT
BEL
CANCHE
CZE
DEU
DNK
ESP
FIN
FRA
GBR
GRC
HUN
IRLISL
ITA
JPN
KOR
LUX
NLD
NOR
NZL
POL
PRTSVK
SWE USA
MEX
TUR
Log real GDP per capitaLog real GDP per capita
Government effectiveness Government effectivenessWorld 2005, correlation = 0.87*** OECD 2005, correlation = 0.84***
Log real GDP per capitaLog real GDP per capita
Regulatory quality Regulatory qualityWorld 2005, correlation = 0.84*** OECD 2005, correlation = 0.85***

STRUCTURAL INDICATORS: A CRITICAL REVIEW
OECD JOURNAL: ECONOMIC STUDIES – VOLUME 2010 © OECD 2010 9
2.1.2. Public finances and tax
Given the size of government and its role in the economy, the contribution of
government to national economic growth is of great significance (Folster and Henrekson,
2001; Alfonso and Furceri, 2008). Moreover, transparent budgeting institutions foster
debate between different alternative policies. However, there are few reliable sources of
comparative public management data. To fill this gap, twice a year, beginning in 2009, the
OECD has published Government at a Glance. Information on the budget process,
decentralisation and public sector efficiency has been gathered through questionnaires
collected by the OECD. In addition, composite indicators measuring compliance with OECD
good practice for the quality of regulatory management systems, according to
16 dimensions, have been calculated. The indicators rely on a principal component
analysis using 1998 and 2005 data, and have then been interpolated to cover the
period 1998-2006. The data will be updated using the 2008 questionnaire. Data are available
for all OECD countries except Luxembourg, Poland and Slovakia, and are subject to peer
review. The first component of the principal component analysis gathers information on
institution, tool and capacity building, and preliminary results suggest that this indicator
is well correlated with economic outcomes such as employment, GDP or labour
productivity.
Another promising project to measure the quality of public finances along several
dimensions is under way at the European Commission. Some composite measures have
also been developed by the Centre of Budget and Policy Priorities (open budget index) and
the Heritage Foundation (fiscal freedom), but their simplicity renders their interpretation
difficult. Finally, the World Bank has constructed a perception-based indicator of
government effectiveness in its Governance Matters publication.
Figure 1. Correlation between selected governance matters indicators and GDP per capita (cont.)
Note: ***, ** and * denote significance at 1, 5 and 10%.
Source: World Bank.
2.5
2.0
1.5
1.0
0.5
-0.5
0
-1.0
-1.5
-2.0
2.5
2.0
1.5
1.0
0.5
0
-1.0
-0.5
7 9 8.5 9.0 9.58 11 1110 10 10.56
ALB
ARE
ARG
ARM
AUSAUT
AZE
BEL
BENBFA
BGR
BHR
BLZ
BRA
BWA
CAN
CHE
CHL
CHN
COL
CPV
CRICZE
DEU
DNK
DOMDZA
EGY
ERI
ESP
EST
ETH
FIN
FJI
FRA
FSM
GAB
GBR
GEO
GHA
GMB
GRC
GUY
HKG
HND
HRV
HUN
IND
IRL
IRN
ISL
ISR
ITA
JAM
JOR
JPN
KIRKOR
KWT
LBN
LKA
LSO
LTU
LUX
LVA
MAC
MAR
MDA
MDG
MEX
MKDMLI
MLT
MNG
MOZ MRT
MUS
MWI
MYS
NAM
NIC
NLD
NOR
NPL
NZL
PAN
PER
PHL
POL
PRT
ROM
SAU
SEN
SGP
SLV
STP
SUR
SVK
SVN
SWE
SWZ
SYC
SYR
THA
TON
TTO
TUNTUR
TZAUGA
UKR
URY
USA
VCT
VNM
VUT
WSM
ZAF
ZMB
AGO
ALBAZE
BDI
BGD
BLR
BOL
CAF
CIV
CMR
COG
COMDJI
ECU
ETH
GINGNB
GTM
HTI
IDN
KAZKEN
KGZ KHM
LAONER
NGA
NPLPA K PER
PNG PRYRUS
RWA
SDN
SLBSLE
SWZ
TCD
TGOTJK
UZB
YEM
ZAR ZWE
AUSAUT
BEL
CAN
CHE
CZE
DEU
DNK
ESP
FIN
FRA
GBR
GRCHUN
IRL
ISL
ITA
JPN
KOR
LUX
MEX
NLD
NORNZL
POL
PRT
SVK
SWE
TUR
USA
Log real GDP per capitaLog real GDP per capita
Regulatory quality Regulatory qualityWorld 2005, correlation = 0.83*** OECD 2005, correlation = 0.86***

STRUCTURAL INDICATORS: A CRITICAL REVIEW
OECD JOURNAL: ECONOMIC STUDIES – VOLUME 2010 © OECD 201010
The structure of tax systems also matters for growth (Johansson et al., 2008; Arnold,
2008). A lot of data are available on the structure of the tax system, its efficiency and its
redistributive impact (at least for some types of tax) in OECD publications. Updated
information on the level and the structure of tax is available in Tax and Benefit and in
Revenue Statistics for OECD countries. This includes standard data on corporate, income or
consumption tax revenue and rates. More sophisticated indices such as the C-efficiency
index, which seeks to capture the efficiency of consumption tax, are also constructed at
the OECD. Information on tax rates can also be found in the OECD tax database, but the
country coverage is usually limited and corporate rates are available only for specific
groups of firms.
2.1.3. Property rights
Property rights refer to the degree to which private property is protected by
institutions and policy. The overall effect on investment remains an empirical question.
Moreover, the cost of reforming property rights can be high and can slow the reform
process. Several measures of property rights are available. The Heritage Foundation index
is the most widely used and is an assessment of the degree to which the country protects
property rights and facilitates private contracting. Other indicators of property rights are
commonly used in the literature, such as the indicator of protection against the risk of
expropriation from the International Country Guide Risk. An indicator of investor
protection is also available in the World Bank’s Doing Business data base. This indicator is
updated every year, covers a large number of countries and is based on official or quasi-
official sources. The data are also subject to peer review. It is correlated with the level of
GDP per capita, but the coefficient of correlation is small, especially when the analysis is
restricted to the group of OECD countries (Figure 2). In addition, the Doing Business data
Figure 2. Correlation between doing business (property rights) and GDP per capita
Note: ***, ** and * denote significance at 1, 5 and 10%.
Source: World Bank.
1.2
1.0
0.6
0.8
0.4
0.2
0
0.9
0.8
0.7
0.6
0.5
0.4
0
0.1
0.2
0.3
7 9 8.5 9.0 9.58 11 1110 10 10.56
TUR
MEXPOL HUN
CZE
GRC
PRT
ESP
NZL
ITA
FIN
JPN
BELFRA
NLDGBR
SWEISL
AUSAUTCAN
DNK
IRL
CHENORUSA
LUX
ZAR
AFG
ERIMDG
TGO
MWI
NER
BFA
MLI
NGA
HNDPAK
MDA
GIN
NIC
PHL
IDN
ALBECU
MDV
CHN
GEO
ROMBLZ
TUNBGR
CRI
BWA
ZAF
SWZGABURY
HRVARG
LTU
CHL
EST
MUS
SVN
ISR
SGP
HKG
TUR
MEXPOL
HUN
CZE
GRC
PRT
ESP
NZL
ITA
FIN
JPN
BELFRA
NLDGBR
SWE
ISL
AUSAUT
CAN
DNK
IRL
CHENOR
USA
LUX
Log real GDP per capitaLog real GDP per capita
Doing business PRI Doing business PRIWorld 2005, correlation = -0.53*** OECD 2005, correlation = -0.20***

STRUCTURAL INDICATORS: A CRITICAL REVIEW
OECD JOURNAL: ECONOMIC STUDIES – VOLUME 2010 © OECD 2010 11
base focuses on specific geographical areas and types of firms, and may thus not be fully
representative of property rights at the national level. Among indicators of property rights,
the development of new technology has focused attention on intellectual property rights.
Indeed, strong perceived property rights encourage firms to invest, but at the same time
may slow the diffusion of technology. The first indicator of intellectual property rights was
developed by Ginarte and Park (1997).
2.1.4. Political institutions
Political institutions, including the type of regime or the electoral system, through
their effect on the country political stability and/or government spending, are also crucial
in investment decisions and long-term growth. Coding on the form of government and
measure of government stability is currently available in many databases. In particular, the
Polity IV project and the World Bank Database on Political Institutions gather updated
information on a large set of countries. Other frequently used indicators cover civil and
political rights and are based on expert assessments.
The Polity IV data set has a broad geographical and temporal scope. The correlation
with the level of GDP per capita for countries is significant but not high. Each annual
update of the Polity data series includes a systematic re-examination of country coding
over the previous five years and a review of cases that have raised concerns and resulted in
specific inquiries by data users. The underlying methodology is transparent. The
construction of the overall Polity IV indicator ultimately relies on points that are assigned
to qualify certain features of the political system (e.g., on competitiveness of executive
recruitment). This has the benefit of ensuring an equal treatment across countries and
comparability over time, but also means the weights are arbitrarily imposed.
The World Bank’s Database on Political Institutions data set contains objective
information on different features of the political system and electoral rules. It is based on
official sources. The more aggregate variables in this data base code the political regime
using only three categories: direct presidential, strong president elected by assembly and
parliamentary. These indicators may not be sufficiently precise to help in discriminating
between political systems in OECD countries (Figure 3).
2.1.5. Corruption
Another strand of governance indicators has sought to measure corruption, i.e., the
abuse of public office for private gains. This is an outcome of poor governance. It is found
to influence a number of fundamental economic aggregates (Lambsdorff, 1999). In
particular, corruption discourages private investment and distorts resource allocation.
Reducing corruption is also found to have positive side effects, such as increasing the
effectiveness of public spending. But measuring corruption is difficult, as those with direct
knowledge of corruption are likely to keep silent about it. In particular, the extent to which
political decisions are influenced by corruption is very difficult to estimate, as it lies
outside the direct experience of citizens and small businesses.
A wide range of perception-based corruption indicators are currently available, using
information from expert and business surveys. Two indicators are worth mentioning: the
Corruption Perception Index (CPI) from Transparency International and the control of
corruption index from Governance Matters. In response to the criticism that corruption
indicators underestimate the extent of corruption in developed economies, Kaufmann
et al. (2008) have also assessed the importance of legal1 and illegal corruption. Both the CPI

STRUCTURAL INDICATORS: A CRITICAL REVIEW
OECD JOURNAL: ECONOMIC STUDIES – VOLUME 2010 © OECD 201012
and the control of corruption indicators are timely and appear well correlated with the
level of GDP per capita, although clear income threshold effects are visible (Figure 4). The
control of corruption index suffers nonetheless from the same limitations as the other
indicators of Governance Matters (see above).
The corruption perception index from Transparency International is probably the
most widely used and the one with the broadest geographical coverage, though the
coverage can vary over time. It is a subjective index. Despite its label, this indicator does
not measure the actual level of corruption, but provides a country ranking according to the
degree of perceived corruption among public officials and politicians. The indicator is
published together with standard errors, casting some light on the uncertainties
surrounding the data. Information on its methodology and sources is easily accessible.
However, the measure lacks consistency over time. The sources used for the CPI are indeed
sometimes discontinued over the years with no reason even though the source is available.
Only two sources have been used in every year the index has been published. It is also
difficult to interpret the year-on-year change of score in the CPI, which could reflect the
fact that different points of view have been collected and different questions asked rather
than a change in the reality of corruption in a country. According to Transparency
International, the CPI measure is a ranking that cannot be used as a measure of corruption:
indeed, it emphasised the rank ordering of countries over internal reforms in countries.
This means that this indicator cannot be used as an indicator of reform effort. In addition,
this indicator suffers from selection bias (OECD, 2006). Finally the indicator draws on
12 sources, with different degrees of reliability.
Figure 3. Correlation between Polity IV political indicator and GDP per capita
Note: ***, **and * denote significance at 1, 5 and 10%.
Sources: Polity IV project and World Bank.
15
5
10
0
-5
-15
-10
11
7
8
9
10
7 9 8.5 9.0 9.58 11 1110 10 10.56
GMBMRT
PAKCOG
ZWE
SDN CMRTJK
YEM TCDCAF UGA
BFAETHTZA
DJI KHM DZAKGZ MYSNGA
ZARSLEZMBLKA ARM
MWIBDINERGNBMLIBENMOZCOMBGDECU GUYUKR NAM
MDG HNDSLV LBNCOLTURRUS
KENSEN GHABOLLSONICIDNGTMPRYPHLDOMBRAMEXLVAARGMKDPANTHABGRROMZAFCHLBWAHRVSVK
MNG URY CRIMUSPOLLTUTTOHUNPRTCZESVNGRCNZLISRESPITADEUJPNAUSBELFINSWENLDGBRCANAUTDNKCHEIRLNORUSA
SAU
SGP
SWZUZB
ERI LAOVNM CHN
BLR KWTNPL MAR KAZ
SDNTUN
RWA
MWIBDINERGNBMLIBENMOZCOM
ESTLBNCOLTURRUS
MDAGHABOLLSONICIDNGTMPRYPHLDOM
INDJAMALBPER MKDPAN THABGRROMZAFCHLBWAHRVCRIMUSLTUTTOHUNPRTCZESVNGRCNZLISRESPITADEUJPNAUSBELFINSWENLDGBRCANAUTDNKIRLNORUSA
JORGINAGO
EGYGAB
SYR AZEBHR
TGO
KORFRA
GEO
SVK
MEX KOR
HUNPRT GRC
TUR
FRA
POL CZE NZLESPITADEUJPNBELSWENLDGBRCANAUT DNKCHE IRLNORUSA
Log real GDP per capitaLog real GDP per capita
Polity PolityWorld 2005, correlation = 0.42*** OECD 2005, correlation = 0.70***

STRUCTURAL INDICATORS: A CRITICAL REVIEW
OECD JOURNAL: ECONOMIC STUDIES – VOLUME 2010 © OECD 2010 13
2.1.6. Link with economic performance
The link between selected governance indicators and economic growth, or other
measures of economic performance, has been examined in depth (Easterly, 2005). In
general, high-quality governance institutions are found to matter for economic
performance (Table 4). However, the direction of causality is not always clear: “deep”
institutions are also highly endogenous, and it is not at all easy to identify their causal role
Figure 4. Correlation between selected indicators of corruption and GDP per capita
Note: ***, ** and * denote significance at 1, 5 and 10%.
Sources: World Bank, Transparency International.
3.0
2.5
2.0
1.5
1.0
0.5
-0.5
0
-1.0
-1.5
-2.0
3.0
2.5
2.0
1.5
1.0
0.5
0
-1.0
-0.5
7 9 8.5 9.08 11 1110 9.5 10.0 10.56
10
9
8
7
5
6
4
3
0
1
2
12
10
8
6
4
0
2
7 9 9.08.5 9.58 11 1110 10 10.56
ARE
ARGARM
AUSAUT
BEL
BFA
BGR
BHR
BLZBRA
BWA
CAN
CHE
CHL
COL
CPV CRICZE
DEU
DNK
DZAEGYERI
ESP
EST
FIN
FJI
FRA
FSM
GBR
GEOGHA
GRC
GUY
HKG
HRV
HUN
IND
IRL
IRN
ISL
ISR
ITA
JAM
JOR
JPN
KIRKOR
KWT
LBN
LKALSO
LTU
LUX
LVA
MAC
MARMDG
MEXMKDMLI
MLT
MNG
MRT
MUSMYSNAM
NIC
NLD NORNZL
PANPER
PHL
POL
PRT
ROM
RWA
SAU
SEN
SGP
SLBSLV
SURSVK
SVN
SWE
SWZ
SYC
S
THA TTO
TUNTUR
UKR
URY
USA
VCT
VUTWSM
ZAF
AGO
ALB
ARM
AZEBDIBEN
BGDBLR
BOL
CAF
CHN
CIV
CMRCOG
COM
DJIDOM
ECUETH
FJIGAB
GINGMB
GNB
GTM
GUY
HND
HTI
IDN KAZKEN KGZ
KHMLAO
MDA
MOZ
MWI NER
NGA
NICNPL
PAK
PHL
PNG
PRY
RUS
RWA
SDN
SLE
STPSWZ
SYR
TCD
TGO
TJKTON
TZA UGA
UKR
UZB
VNMYEM
ZAR
ZMB
ZWE
AUS AUT
BEL
CAN
CHE
CZE
DEU
DNK
ESP
FIN
FRA
GBR
GRC
HUN
IRL
ISL
ITA
JPN
KOR
LUX
MEX
NLD NOR
NZL
POL
PRT
SVK
SWE
TUR
USA
ARE
ARGARM
AUS AUT
BEL
BEN
BFA
BGR
BHR
BLZ
BWA
CAN
CHE
CHL
CHN
COLCRI CZE
DEU
DNK
DOMDZA
EGY
ESP
EST
FIN
FJI
FRA
GAB
GBR
GHA
GMB
GRC
HKG
HRV
HUN
IND
IRL
IRN
ISL
ISR
ITA
JAM
JOR
JPN
KOR
KWT
LBNLKALSO
LTU
LUX
LVA
MARMDAMDG
MEX
MLI
MLT
MNGMOZ
MUS
MWI
MYS
NAM
NLDNOR
NZL
PANPER POL
PRT
ROMRWASAU
SEN
SGP
SLV
SUR
SVK
SVN
SWE
SWZ
SYC
TUN
TUR
TZA
URY
USA
YEM
ZAF
AGO
ALB
G
AZEBDI
BGD
BLRBOL
CIVCMR
ECUERI
ETHGEO
GMBGTMGUYHND
HTI
IDN
KAZ
KENKGZKHM
G OW
NER
NGA
NICNPL
PAK
PHLPNG
PRY
RUSSDN
SLESWZ
TCD
TJK
UGA UKR
UZB
VNMYEM
ZAR
ZMBZWE
AUS AUT
BEL
CAN
CHE
CZE
DEU
DNK
ESP
FIN
FRA
GBR
GRC
HUN
IRL
ISL
ITA
JPN
KOR
LUX
MEX
NLDNOR
NZL
POL
PRT
SVK
SWE
TUR
USA
Log real GDP per capitaLog real GDP per capita
Control of corruption Control of corruptionWorld 2005, correlation = 0.82*** OECD 2005, correlation = 0.81***
Log real GDP per capitaLog real GDP per capita
Corruption perception index Corruption perception indexWorld 2005, correlation = 0.80*** OECD 2005, correlation = 0.80***
STRUCTURAL INDICATORS: A CRITICAL REVIEW
OECD JOURNAL: ECONOMIC STUDIES – VOLUME 2010 © OECD 201014
with respect to income levels or economic growth (Glaeser et al., 2004; Acemoglu et al.,
2005). Moreover, the role of geographic factors and trade openness appears to be closely
interrelated with institutions, making their identification difficult (Rodrick et al., 2004;
Boulhol and de Serres, 2008). In addition, there appear to be important threshold effects,
with good institutions (e.g., the absence of corruption) having very little effect at the two
extremes of the income scale. Finally, it should be noted that the nature and limits of
composite governance indicators are not always fully grasped by users, weakening the
rigour and credibility of many studies. In addition, the results found in the literature are
usually sensitive to changes in the econometric model used, to the variables included and
to the underlying assumptions.
Table 4. Governance and economic growth
Institutional factors Indicator or methodology and main results
North (1990, 2005) Indicator: Formal and informal institutions (culture and unwritten values)The paper demonstrates the importance of a system of governance and its interaction with the behaviour of economic
and political organisations for long-term economic growth, enhancement of human welfare and societal development.Globerman and Shapiro (2002) Indicator: Aggregate of the six Governance Matters indicators
Countries that fail to achieve a minimum threshold of effective governance are unlikely to receive much FDI, and above that threshold the quality of governance infrastructure is an important determinant of the amount received.
Kaufmann and Kraay (2002) Indicator: Six Governance Matters indicatorsGood governance tends to promote growth. However growth, per se, does not tend to promote better governance.
Kaufmann et al. (2008) Institutions appear to play an important role in economic development, and countries with higher levels of GDP per capita have much higher quality institutions, according to many measures.
Johansson et al (2008) Methodology: Macro- and micro-based analysisThe structure of the tax system has an impact on growth.
Property rightsJaumotte and Pain (2005) Indicator: Cross-country index of intellectual property rights developed in Ginarte and Park (1997) and updated in Park
and Singh (2002)Intellectual property rights have little effect on R&D spending.
Knack and Keefer (1995); Mauro (1995); Acemoglu, Johnson and Robinson (2001)
Less secure property rights are correlated with lower aggregate investment and slower economic growth.
Political factorsPrzeworski et al. (2000) Indicator: Use objective criteria for distinguishing on a yearly basis between democratic and non-democratic
governments (with two sub-categories: authoritarian and bureaucratic dictatorship) for 141 countries between 1950 and 1990
Democratic and non-democratic governments tend to grow on average at the same rate, but population grows faster in non-democracies so that GDP per capita grows more rapidly in democracies. Existence of a poverty trap: in the poorest countries, democracy makes no difference to economic growth.
Persson and Tabellini (2004) Constitutional rules shape economy policy.Persson and Tabellini (2003) Methodology: Panel data from 1960 covering about 500 elections in over 50 democracies
A broad classification of electoral rules into proportional and majoritarian does not seem to be strongly correlated with economic performance. It appears nonetheless that a parliamentary form of government is associated with better performance and better growth-promoting policies, measured by indexes for broad protection of property rights and of open borders in trade and finance. The negative effect of presidentialism is present only among the democracies with lowest scores for the quality of democracy.
The authors classify countries in two groups according to the electoral formula and estimate the extent of electoral cycles in different specifications, including fixed country and time effects as well as a number of time-varying regressors. Governments in democracies that use plurality rule cut taxes and government spending during election years — the magnitude of both cuts is of the order of 0.5% of GDP. In proportional representation democracies, tax cuts are less pronounced, and no spending cuts are observed.
Milesi-Ferretti, Perotti and Rostagno (2002); Persson and Tabellini (2003, 2004);
Relying on different data, these papers show that a statistically significant (but smaller) effect of the electoral system remains after controlling for other determinants of social security and welfare spending, such as the percentage of the elderly in the population, per capita income and the age and quality of democracy.
Gradstein (2008) Method: Theoretical modelLow-quality institutions, concentration of political power and material wealth and underdevelopment are persistent over
time. The possibility of two developmental paths is exhibited: with concentration of political and economic power, low-quality institutions and slow growth; and a more equal distribution of political and economic resources, high-quality institutions and faster growth.

STRUCTURAL INDICATORS: A CRITICAL REVIEW
OECD JOURNAL: ECONOMIC STUDIES – VOLUME 2010 © OECD 2010 15
2.2. Society
2.2.1. Health
Health can affect growth through several channels. First, health affects labour
productivity, since healthier workers can work harder and for a longer period of time. Second,
health favours human capital accumulation, since healthier students on average have higher
cognitive functioning. Third, health encourages physical capital accumulation, since healthier
workers who work for a longer period of time increase saving (for retirement) and thus
investment, and since the increase in labour input from healthier workers will increase the
marginal product of capital. Fourth, health influences population growth.
Health indicators can be subdivided into policy and outcome indicators. Health policy
indicators are a combination of health care resources, lifestyle and socio-economic
factors.2 Health care resources usually are separated into monetary resources (public
spending on health) and non-monetary resources (number of physicians, hospitals,
medical machinery, etc.). While from a theoretical point of view health care resources are
positively linked to health outcome indicators, the evidence is not conclusive from an
empirical point of view.3 In contrast, socio-economic factors (such as education) and
lifestyle factors (tobacco, alcohol and nutrition) have been found to be strongly related to
health outcomes. Data on health policy indicators are easily accessible and can be used to
assess their impact on health outcomes (see the annex in Furceri and Mourougane, 2009).
However, they suffer from endogeneity problems in relation to outcome indicators and
GDP growth. Thereby, they have to be used very carefully in that context.
Outcome indicators aim to measure health outcomes. Those that have been usually
considered in the literature are: mortality/longevity indicators (life expectancy at various
ages), mortality indicators adjusted for the presence of a particular disease and quality of
life, and other health-related indicators, such as public satisfaction for the health care
system.4 Different international organisations such as the OECD, World Health
Organization and World Bank publish data on many of these outcome indicators, and data
are available for a long timespan. The variable that has been used most in the literature on
health and growth is a performance measure, life expectancy at birth. Data on life
expectancy are available from official sources (OECD, IMF, World Bank, Eurostat and WHO)
Table 4. Governance and economic growth (cont.)
Institutional factors Indicator or methodology and main results
Marshall and Cole (2008) Indicator of state fragilityA fairly strong relationship is found between income and the fragility of states in the global system. However, a wide
variance in fragility scores at any level of incomes is also observed.CorruptionLambsdorff (1999) Method: Overview of the literature
Corruption affects a variety of economic indicators such as government expenditures, total investment, capital flows and foreign direct investment, international trade, foreign aid and GDP per capita.
Kraay and Nehru (2004) Indicator: CPIA indicators from 1997 to 2001Significant inverse correlation between the quality of a country’s institutions and probability of debt distress.
Welsh (2008) Indicator: Transparency International average perceived corruption indicatorsThis article uses self-rated subjective well-being as an empirical approximation of general welfare and shows that cross-
national welfare is affected by corruption not only indirectly through GDP, but also directly through non-material factors.
Kaufmann et al. (2008) Indicator of legal corruptionGovernance and corruption issues are key constraints to investment and business and are particularly significant in
assessing countries’ overall positions.
Source: OECD Secretariat.

STRUCTURAL INDICATORS: A CRITICAL REVIEW
OECD JOURNAL: ECONOMIC STUDIES – VOLUME 2010 © OECD 201016
and over a large timespan and for a broad set of countries. Quality-adjusted life years have
been developed to refine gross measures of health outcomes such as life expectancy, but
they are not exempted from methodological problems.
These indicators have been found in many studies to be positively linked to GDP per
capita, GDP growth and total factor productivity (TFP) growth, although it is unclear in
which direction the causality goes (Table 5).5 On the one hand, life expectancy at birth
clearly improves when living standards increase, but on the other hand life expectancy at
birth can raise incentives to invest in education and increase labour supply if it extends the
working life. The latter effect could be particularly important in economies where the
population is ageing rapidly. Although micro studies based on individual and household
data found a positive link between health outcomes and economic performance, the
evidence of a link at the aggregate level is much less clear for developed countries (Price
et al. 2008; Dormont et al. 2008). The weaker evidence found for developed countries could
be due to a non-linear relationship, positive at low levels of development and insignificant
or negative at higher levels. Moreover, it should be noted that the use of these indicators to
assess the impact on growth has to be dealt with carefully, since problems of endogeneity
and omitted variable bias may arise.
Table 5. Selected results on health and economic performance
Indicator or methodology and main results
Barro (1996) Indicator: Life expectancyMain result: The paper shows significant effects of health on growth for a panel of 84 countries from 1965
to 1990.Methodology: 3SLS; controlling for human capital and other covariates
Barro and Lee (1994) Indicator: Life expectancyMain result: The paper shows significant effects of health on growth for a panel of 90 countries from 1965
to 1985.Methodology: SUR and random effects; controlling for human capital and other covariates
Barro and Sala-i-Martin (1995) Indicator: Life expectancyMain result: The paper shows significant effects of health on growth for a panel of 90 countries from 1965
to 1985.Methodology: SUR and random effects; controlling for human capital and other growth and governance
covariates
Bhargava, Jamison, Lau and Murray (2001) Indicator: Adult survival rateMain result: The paper shows significant effects of health on growth for a panel of 92 countries from 1965
to 1990.Methodology: Dynamic random effects; controlling for fertility and other growth covariates
Bloom, Canning and Malaney (2000) Indicator: Life expectancyMain result: The paper shows significant effects of health on growth for a panel of 92 countries from 1965
to 1990.Methodology: Pooled OLS; controlling for working age and growth covariates
Bloom and Williamson (1998) Indicator: Life expectancyMain result: The paper shows significant effects of health on growth for a panel of 78 countries from 1965
to 1990.Methodology: Pooled OLS; controlling for growth covariates
Caselli, Esquivel and Lefort (1996) Indicator: Life expectancyMain result: The paper shows significant effects of health on growth for a panel of 91 countries from 1960
to 1985.Methodology: GMM; controlling for human capital
Finlay (2007) Indicator: Adult mortalityMain result: The paper shows significant effects of health on growth for a panel of 62 countries from 1960
to 2000.Methodology: 2SLS; controlling for human capital, fertility and other growth covariates

STRUCTURAL INDICATORS: A CRITICAL REVIEW
OECD JOURNAL: ECONOMIC STUDIES – VOLUME 2010 © OECD 2010 17
2.2.2. Education
Investment in human capital at all ages is crucial for long-term growth and is often
considered as a prerequisite to development (Table 6).
Data on early education and childcare are available in the OECD Family database,
though it is mostly limited to childcare support, public spending on childcare or
enrollment. No indication on the quality of the services is currently available on a cross-
country basis.
For primary and secondary education, the OECD Education at a Glance database is a rich
source of information and is updated every year. These data can be complemented by
UNESCO data for non-OECD countries. In addition, the Programme for International
Student Assessment (PISA) score, which is based on a series of tests passed by 15-year-old
Table 5. Selected results on health and economic performance (cont.)
Indicator or methodology and main results
Gallup and Sachs (2000) Indicator: Life expectancyMain result: The paper shows significant effects of health on growth for a panel of 91 countries from 1960
to 1985.Methodology: GMM; controlling for human capital
Sachs and Warner (1997) Indicator: Life expectancy and life expectancy squaredMain result: The paper shows significant effects of health on growth for a panel of 97 countries from 1965
to 1990.Methodology: OLS; controlling for human capital, governance and growth covariates
Suhrcke and Urban (2006) Indicator: Cardio-vascular diseaseMain result: The paper shows significant effects of health on growth for a panel of 74 countries from 1960
to 2000, especially for rich countries.Methodology: GMM; controlling for growth covariates
Source: OECD Secretariat.
Figure 5. Correlation between life expectancy and GDP per capita
Note: ***, ** and * denote significance at 1, 5 and 10%.
Sources: World Bank, OECD.
90
85
80
70
75
65
55
60
50
45
40
84
82
80
78
76
72
74
7 9 9.0 9.58 11 11.510 10 10.5 116
PRTKOR
GRC
JPN
DEUFIN
FRA
GBR
AUS
BEL
SWE
DNK
CAN
CHE
IRL
USA
NOR
LUX
MEX
POL
SVK
HUN
CZE
ESPITA
AUT
MEXPOLSVK
HUN
PRT
CZE
KOR
ESPITAGRC
JPN
DEUFINFRAGBRAUSBELSWE
DNKAUTNLDCANCHE
IRLUSA
NOR
GNB
ERINER
SLE
ETH
CAF
MWI
MOZ
TGO
RWA
TMPMDG
UGA
NPLMMR
MLIBFAHPC
LDC
TZA
BGD
GMB
GIN
COM
GHA
ZMB
HTI
BEN
LSO
LIC
KEN
STP
KHM
TCD
TJK
SENSLB
CIV
SDN
MRT
KGZ
SSA
NGA
LAO
DJI
CMR
UZB
PNG
SAS
VNM
PAK
YEM
MDA
NIC
IND
CPV
MNGGUY
PHL
FSMHNDIDNVUT
COG
TON
GEO
LKA
MARWSM
BTN
LMC
AGO
BOL
PRYEAP
MDV
SYR
GTM
CHN
LMY
ARM
FJI
JOR
SWZ
AZEEGY
NAM
MIC
SLVDOM
ALB
UKR
COLJAMBLZ
BIH
VCTMNA
TUN
PERSUR
ECU
THADZA
MKDMNELACLCA
BRA
ZAF
BLR
SRB
KAZ
WLD
CRI
URY
ECAIRN
BGRROM
PAN
LBN
VENMUS
UMCTUR
ARGMYS
RUS
BWA
CHL
SYCLBY
LVA
HRV
GAB
LTUEST
TTO
OMN
MLTISR
SVNCYPNZL
NOC
GNQ
EMUHICOEC
BHR
ISLHKGMACSGP
KWTBRN
ARE
MEXPOLSVK
HUN
PRT
CZE
KOR
ESPITAGRC
JPN
DEUFINFRAGBRAUSBELSWE
DNKAUTNLDCANCHE
IRLUSA
NOR
TGOTMPMDG
NPL
MLILDC
BGD
GMBGHAHTI
BEN
KHM
SENSLBMRT
KGZ
LAO
UZB
SAS
VNM
PAK
MDA
NICCPV
MNG
PHL
FSMHNDIDNVUT
TON
GEOMARWSM
BTN
LMC
PRYEAP
MDV
SYR
GTM
CHNARM
FJI
JORAZEEGY
MIC
SLVDOM
UKR
COLJAMBLZ
BIH
VCTMNA
TUN
PERSUR
ECU
THADZA
MKDMNELACLCA
BRA
BLR
SRB
WLD
URY
IRN
BGRROM
PAN
LBN
VENMUS
UMCTUR
ARGMYS
SYCLBY
LVA
HRV
LTUEST
OMN
MLTISR
SVNCYPNZLEMUHICOEC
ISLHKGMACSGP
KWTBRN
ARE
Log real GDP per capitaLog real GDP per capita
Life expectancy at birth Life expectancy at birthWorld 2005, correlation = 0.80*** OECD 2005, correlation = 0.70***
STRUCTURAL INDICATORS: A CRITICAL REVIEW
OECD JOURNAL: ECONOMIC STUDIES – VOLUME 2010 © OECD 201018
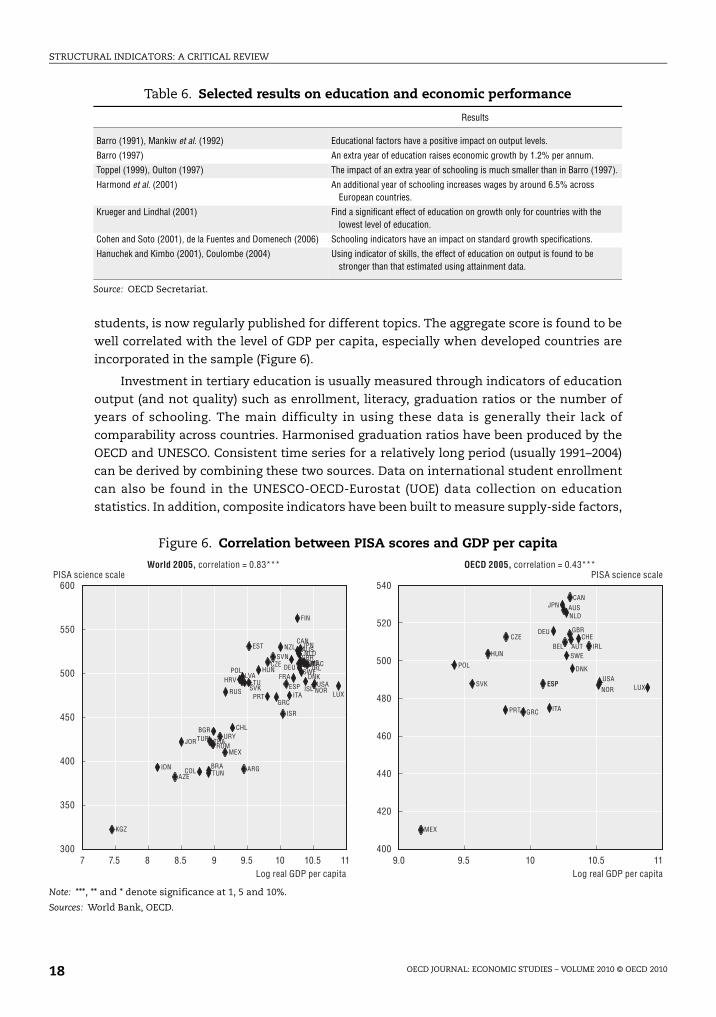
students, is now regularly published for different topics. The aggregate score is found to be
well correlated with the level of GDP per capita, especially when developed countries are
incorporated in the sample (Figure 6).
Investment in tertiary education is usually measured through indicators of education
output (and not quality) such as enrollment, literacy, graduation ratios or the number of
years of schooling. The main difficulty in using these data is generally their lack of
comparability across countries. Harmonised graduation ratios have been produced by the
OECD and UNESCO. Consistent time series for a relatively long period (usually 1991–2004)
can be derived by combining these two sources. Data on international student enrollment
can also be found in the UNESCO-OECD-Eurostat (UOE) data collection on education
statistics. In addition, composite indicators have been built to measure supply-side factors,
Table 6. Selected results on education and economic performance
Results
Barro (1991), Mankiw et al. (1992) Educational factors have a positive impact on output levels.
Barro (1997) An extra year of education raises economic growth by 1.2% per annum.
Toppel (1999), Oulton (1997) The impact of an extra year of schooling is much smaller than in Barro (1997).
Harmond et al. (2001) An additional year of schooling increases wages by around 6.5% across European countries.
Krueger and Lindhal (2001) Find a significant effect of education on growth only for countries with the lowest level of education.
Cohen and Soto (2001), de la Fuentes and Domenech (2006) Schooling indicators have an impact on standard growth specifications.
Hanuchek and Kimbo (2001), Coulombe (2004) Using indicator of skills, the effect of education on output is found to be stronger than that estimated using attainment data.
Source: OECD Secretariat.
Figure 6. Correlation between PISA scores and GDP per capita
Note: ***, ** and * denote significance at 1, 5 and 10%.
Sources: World Bank, OECD.
600
550
500
400
450
350
300
540
520
500
480
460
400
420
440
8 109.5 9.0 9.598.5 11 1110.5 10 10.57 7.5
MEX
POL
SVK
HUN
PRT
CZE
GRC
ESPITA
DEU
JPNAUS
BELSWE
NLDGBR
CAN
AUT
DNK
CHEIRL
NORUSA
KGZ
IDNAZE
JOR
TUNBRA
THA
BGR
ROMURY
RUS
CHL
LVA
ARG
LTU
EST
SVNNZL
ISR
FRA
FIN
ISL
MACBELAUT
LUX
COL
TUR
HRV
POL
SVK
HUN
CZE
ESP
DEU
JPNCAN
AUS
BELSWE
NLD
DNK
CHEIRL
NOR
USALUX
MEX
PRT GRC
ESP
ITA
GBR
AUT
Log real GDP per capitaLog real GDP per capita
PISA science scale PISA science scaleWorld 2005, correlation = 0.83*** OECD 2005, correlation = 0.43***
STRUCTURAL INDICATORS: A CRITICAL REVIEW
OECD JOURNAL: ECONOMIC STUDIES – VOLUME 2010 © OECD 2010 19
such as a summary measure of the institutional set-up of tertiary education, or demand-
side factors such as the internal rate of return to education (Oliveira Martins et al., 2007).
These data are available for many OECD countries, but only for some years (2005–2006 for
the supply-side indicator and 2001 for the internal rate of return).
2.3. Labour market
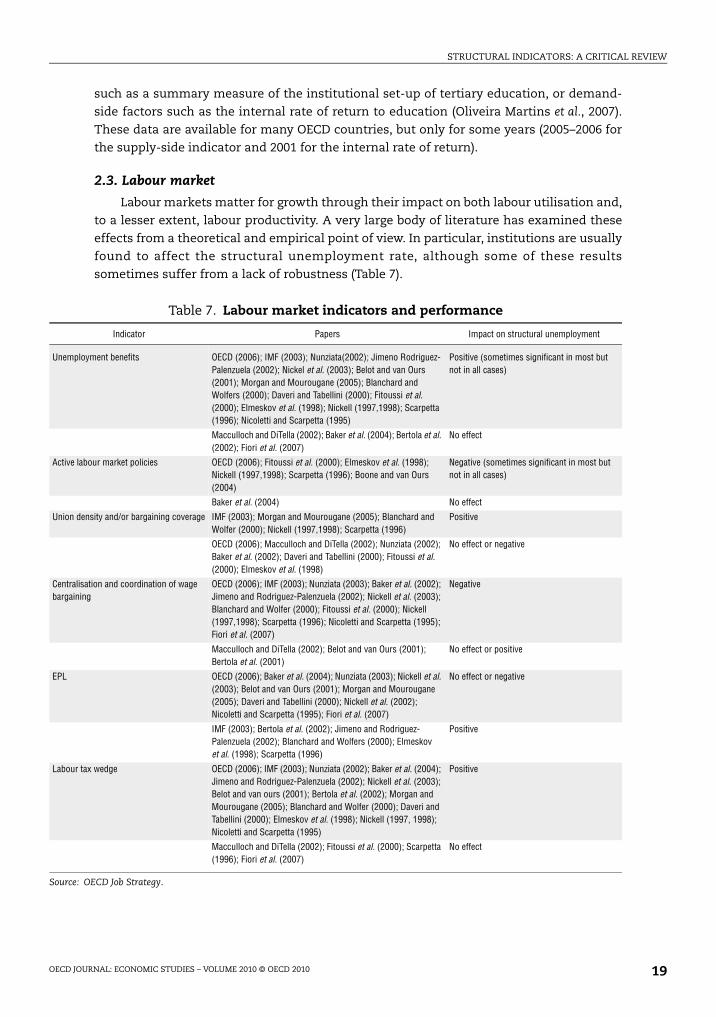
Labour markets matter for growth through their impact on both labour utilisation and,
to a lesser extent, labour productivity. A very large body of literature has examined these
effects from a theoretical and empirical point of view. In particular, institutions are usually
found to affect the structural unemployment rate, although some of these results
sometimes suffer from a lack of robustness (Table 7).
Table 7. Labour market indicators and performance
Indicator Papers Impact on structural unemployment
Unemployment benefits OECD (2006); IMF (2003); Nunziata(2002); Jimeno Rodriguez-Palenzuela (2002); Nickel et al. (2003); Belot and van Ours (2001); Morgan and Mourougane (2005); Blanchard and Wolfers (2000); Daveri and Tabellini (2000); Fitoussi et al. (2000); Elmeskov et al. (1998); Nickell (1997,1998); Scarpetta (1996); Nicoletti and Scarpetta (1995)
Positive (sometimes significant in most but not in all cases)
Macculloch and DiTella (2002); Baker et al. (2004); Bertola et al. (2002); Fiori et al. (2007)
No effect
Active labour market policies OECD (2006); Fitoussi et al. (2000); Elmeskov et al. (1998); Nickell (1997,1998); Scarpetta (1996); Boone and van Ours (2004)
Negative (sometimes significant in most but not in all cases)
Baker et al. (2004) No effect
Union density and/or bargaining coverage IMF (2003); Morgan and Mourougane (2005); Blanchard and Wolfer (2000); Nickell (1997,1998); Scarpetta (1996)
Positive
OECD (2006); Macculloch and DiTella (2002); Nunziata (2002); Baker et al. (2002); Daveri and Tabellini (2000); Fitoussi et al. (2000); Elmeskov et al. (1998)
No effect or negative
Centralisation and coordination of wage bargaining
OECD (2006); IMF (2003); Nunziata (2003); Baker et al. (2002); Jimeno and Rodriguez-Palenzuela (2002); Nickell et al. (2003); Blanchard and Wolfer (2000); Fitoussi et al. (2000); Nickell (1997,1998); Scarpetta (1996); Nicoletti and Scarpetta (1995); Fiori et al. (2007)
Negative
Macculloch and DiTella (2002); Belot and van Ours (2001); Bertola et al. (2001)
No effect or positive
EPL OECD (2006); Baker et al. (2004); Nunziata (2003); Nickell et al. (2003); Belot and van Ours (2001); Morgan and Mourougane (2005); Daveri and Tabellini (2000); Nickell et al. (2002); Nicoletti and Scarpetta (1995); Fiori et al. (2007)
No effect or negative
IMF (2003); Bertola et al. (2002); Jimeno and Rodriguez-Palenzuela (2002); Blanchard and Wolfers (2000); Elmeskov et al. (1998); Scarpetta (1996)
Positive
Labour tax wedge OECD (2006); IMF (2003); Nunziata (2002); Baker et al. (2004); Jimeno and Rodriguez-Palenzuela (2002); Nickell et al. (2003); Belot and van ours (2001); Bertola et al. (2002); Morgan and Mourougane (2005); Blanchard and Wolfer (2000); Daveri and Tabellini (2000); Elmeskov et al. (1998); Nickell (1997, 1998); Nicoletti and Scarpetta (1995)
Positive
Macculloch and DiTella (2002); Fitoussi et al. (2000); Scarpetta (1996); Fiori et al. (2007)
No effect
Source: OECD Job Strategy.

STRUCTURAL INDICATORS: A CRITICAL REVIEW
OECD JOURNAL: ECONOMIC STUDIES – VOLUME 2010 © OECD 201020
Both policy and outcome indicators have been developed to monitor labour markets
and are already well covered in the literature and in works published by international
organisations (such as Going for Growth published by the OECD). Policy indicators produced
at the OECD cover a vast range of labour market institutions ranging from employment
protection legislation to data on trade unions. These data are generally available for
specific years only and suffer from serious limitations (e.g., EPL measure is a de jure
measure and does not reflect effective employment protection). These data are usually
constructed only for OECD countries and sometimes for large non-member countries.
Other institutional variables such as unemployment benefit generosity or replacement
rates are more timely but usually constructed for certain household or worker types. By
contrast, a lot of detailed information is available for OECD countries and over a long time
span on active labour market policies and labour taxes. Marginal effective tax rates are also
regularly computed for different household types. Data on minimum wages are available in
the OECD minimum wage database for countries that have a national statutory minimum
wage.
Other international institutions also publish data on labour market institutions. A
large set of institutional variables is collected in the European Commission’s LABREF
database and the ILO Laborsta database. Qualitative information on the wage system is
freely available on the EIRO website. Perception-based measures on worker motivations
and industrial disputes can also be found in the Global Competitiveness Report which is
updated every year. In addition, time series for selected institutional data such as EPL have
been constructed by Allard (2005) and Amable et al. (2007), but the method applied to
construct these indicators is questionable.6
Outcome indicators include data on employment, unemployment, hours worked and
labour force participation. Data are usually fact-based, timely and have broad country
coverage. Efforts have been made over the years to harmonise the data across countries.
Moreover, a breakdown by gender, age, skill and sector is also available. The structural (or
equilibrium) unemployment rate is a different type of outcome indicator as it is non-
observable. It can be estimated using different methodologies, e.g., the OECD Economics
Department uses a core price Phillips curve and Kalman filter technique. Indicators of the
implicit tax on retirement have also been developed and regularly updated by the OECD.
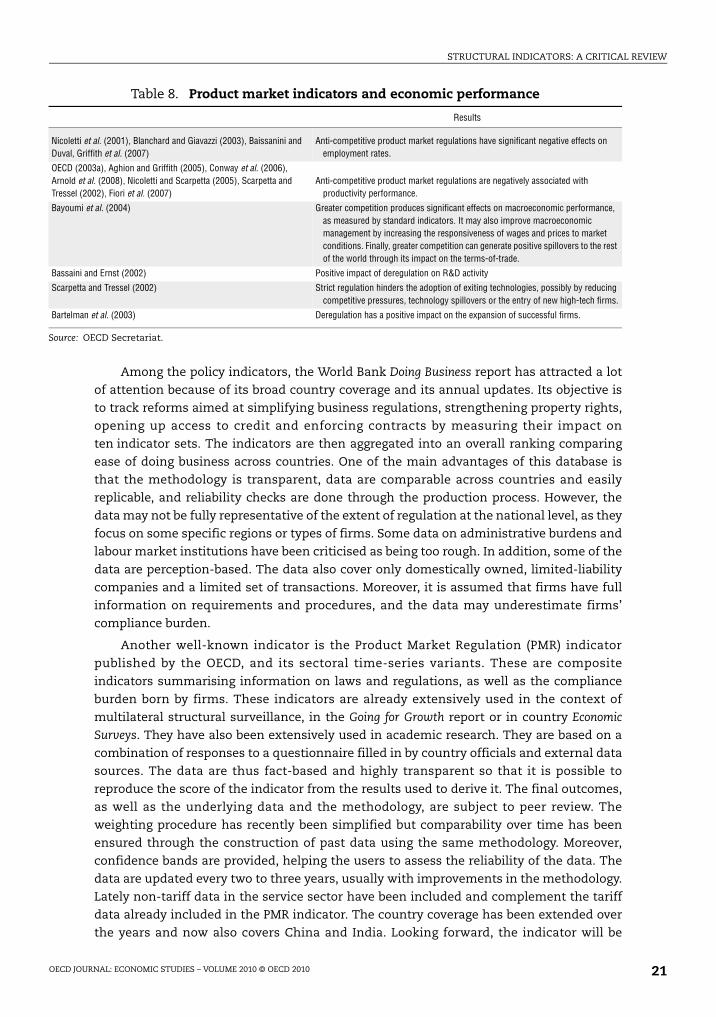
2.4. Product markets
Well-functioning product markets affect positively productivity and consumer welfare
through various channels (Table 8). Indeed, competition in product markets boosts
efficiency in three ways. First, it enhances allocative efficiency. Second, productive
efficiency or x-efficiency, i.e., the ability of firms to produce output at minimum resource
costs, can also be increased. Third, competition influences the incentives to innovate and
invest, so-called dynamic efficiency. In addition, increased competitive pressures can spur
employment growth. At the same time, regulations are important to address market
failures stemming, for instance, from asymmetries of information and externalities. But
they also increase firms’ compliance costs.
A large number of indicators have been developed to measure access to markets and
the degree of competition. They are usually based on questionnaires and can be either
perception- or fact-based. Although they are usually considered as policy indicators,
composite measures sometimes aggregate policy and performance sub-indicators.
STRUCTURAL INDICATORS: A CRITICAL REVIEW
OECD JOURNAL: ECONOMIC STUDIES – VOLUME 2010 © OECD 2010 21
Among the policy indicators, the World Bank Doing Business report has attracted a lot
of attention because of its broad country coverage and its annual updates. Its objective is
to track reforms aimed at simplifying business regulations, strengthening property rights,
opening up access to credit and enforcing contracts by measuring their impact on
ten indicator sets. The indicators are then aggregated into an overall ranking comparing
ease of doing business across countries. One of the main advantages of this database is
that the methodology is transparent, data are comparable across countries and easily
replicable, and reliability checks are done through the production process. However, the
data may not be fully representative of the extent of regulation at the national level, as they
focus on some specific regions or types of firms. Some data on administrative burdens and
labour market institutions have been criticised as being too rough. In addition, some of the
data are perception-based. The data also cover only domestically owned, limited-liability
companies and a limited set of transactions. Moreover, it is assumed that firms have full
information on requirements and procedures, and the data may underestimate firms’
compliance burden.
Another well-known indicator is the Product Market Regulation (PMR) indicator
published by the OECD, and its sectoral time-series variants. These are composite
indicators summarising information on laws and regulations, as well as the compliance
burden born by firms. These indicators are already extensively used in the context of
multilateral structural surveillance, in the Going for Growth report or in country Economic
Surveys. They have also been extensively used in academic research. They are based on a
combination of responses to a questionnaire filled in by country officials and external data
sources. The data are thus fact-based and highly transparent so that it is possible to
reproduce the score of the indicator from the results used to derive it. The final outcomes,
as well as the underlying data and the methodology, are subject to peer review. The
weighting procedure has recently been simplified but comparability over time has been
ensured through the construction of past data using the same methodology. Moreover,
confidence bands are provided, helping the users to assess the reliability of the data. The
data are updated every two to three years, usually with improvements in the methodology.
Lately non-tariff data in the service sector have been included and complement the tariff
data already included in the PMR indicator. The country coverage has been extended over
the years and now also covers China and India. Looking forward, the indicator will be
Table 8. Product market indicators and economic performance
Results
Nicoletti et al. (2001), Blanchard and Giavazzi (2003), Baissanini and Duval, Griffith et al. (2007)
Anti-competitive product market regulations have significant negative effects on employment rates.
OECD (2003a), Aghion and Griffith (2005), Conway et al. (2006), Arnold et al. (2008), Nicoletti and Scarpetta (2005), Scarpetta and Tressel (2002), Fiori et al. (2007)
Anti-competitive product market regulations are negatively associated with productivity performance.
Bayoumi et al. (2004) Greater competition produces significant effects on macroeconomic performance, as measured by standard indicators. It may also improve macroeconomic management by increasing the responsiveness of wages and prices to market conditions. Finally, greater competition can generate positive spillovers to the rest of the world through its impact on the terms-of-trade.
Bassaini and Ernst (2002) Positive impact of deregulation on R&D activity
Scarpetta and Tressel (2002) Strict regulation hinders the adoption of exiting technologies, possibly by reducing competitive pressures, technology spillovers or the entry of new high-tech firms.
Bartelman et al. (2003) Deregulation has a positive impact on the expansion of successful firms.
Source: OECD Secretariat.

STRUCTURAL INDICATORS: A CRITICAL REVIEW
OECD JOURNAL: ECONOMIC STUDIES – VOLUME 2010 © OECD 201022
enriched by the integration of the indicator of sectoral regulator independence which is
found to be closely related to investment in infrastructure (Sutherland et al., 2009).
The Business Competitiveness Index (BCI) produced by the World Economic Forum is
a composite indicator constructed using a combination of survey and hard indicators,
including a measure of intellectual property protection and the stringency of
environmental regulation. Their focus is on capturing factors that matter for
competitiveness at the micro-economic level. The construction process is fully
transparent. However, the selection of the different indicators is nonetheless not
straightforward and some may be strongly inter-correlated (e.g., intellectual property
protection and property rights). Finally, the weights are determined using factor analysis at
a lower level of aggregation and regression on GDP per capita at a higher level of
aggregation. It is unclear whether the ranking from the BCI is robust to an alternative
weighting choice. Finally, there is no information on measurement errors.
Overall, past analysis points to a strong correlation between these various indicators
for OECD countries. The correlation between the ease of doing business and the OECD
product market regulation indicator is 0.7.
A new indicator is the questionnaire-based measure of whether a sector is subject to
incentive price regulation, generally in the form of a price cap,7 constructed by the OECD.
The indicator is available for all OECD countries except Poland and Greece over the period
end 2007 to early 2008. The sectoral coverage varies across countries. Thus far there is no
plan to update the questionnaire. The methodology is transparent and the data have been
subject to peer review. There is evidence that this indicator has a positive impact on
investment in infrastructure in the presence of an independent regulator (Sutherland et al.,
2009), even though the indicator does not account for quality changes in infrastructure.
Indicators summarising the main features of the regulatory institutions have been
constructed in Høj (2007a). The indicators cover both general and sector-specific
competition polices.
A large number of outcome indicators (e.g., firm creation and destruction) are also
available but most of the time at a national or sectoral level and updated only infrequently.
Indices of concentration (such as the Herfindal index) are sometimes computed, but not on
a regular basis or for a sufficient number of countries. Mark-ups have also been developed
in OECD studies and elsewhere (Høj et al., 2007b).
2.5. Infrastructure
The impact of infrastructure on output (and output growth) is difficult to pin down and
the direction of causality hard to determine empirically (Table 9). However, there is some
empirical evidence that investment has positive effects that go beyond the impact to be
expected from a larger capital stock (Sutherland et al., 2009). In particular, infrastructure
investment appears to have on average a stronger long-term effect on growth at lower
levels of provision, though the effect is different between developing and developed
countries. It should be noted, however, that the definition of infrastructure varies from one
study to another.
Data on infrastructure available over a relatively long time period and comparable
across countries are scarce. Capital stock data published by national statistical offices lack
harmonisation. They can usually be complemented by physical measures of infrastructure

STRUCTURAL INDICATORS: A CRITICAL REVIEW
OECD JOURNAL: ECONOMIC STUDIES – VOLUME 2010 © OECD 2010 23
provision, but the latter cannot be easily aggregated. Moreover these measures fail to
capture the quality of infrastructure.
A composite indicator measuring how countries exploit the potential benefits of
Public and Private Partnerships (PPPs) have recently been developed by the OECD. The data
are available for 19 countries, though not for the United Kingdom, which has made
extensive use of PPPs in the past. Data are questionnaire-based. No update is, however,
currently planned.
2.6. International trade
The last three decades have witnessed rapid economic integration. This has spurred
the development of economic analysis on the effects of trade on growth and living
standards, both from a theoretical and an empirical point of view.
From a theoretical point of view, there are different channels through which trade can
stimulate growth and improve living standards. First, according to the theory of
comparative advantages, trade based on specialisation increases domestic output due to
higher productivity. Second, trade is a means to increase worldwide competition in
production and to enhance efficiency. Third, trade guarantees a greater choice of products.
Fourth, it expands potential markets and permits domestic firms to take advantage of
economies of scale. Fifth, trade allows the diffusion of knowledge and technological
innovation.
From an empirical point of view there is a large literature showing that economies that
are more open to international trade have higher rates of growth, as a result of higher
investment, human capital accumulation, higher technology diffusion and sustained gains
in factor productivity.8
These empirical works, however, differ in the approach of measuring trade openness.
In particular, it is possible to classify the empirical research investigating the relation
between trade and growth in two branches: those that use policy indicators as measures of
trade openness, and those that use outcome indicators (in terms of trade intensity).
Trade policy indicators describe the institutional features of a country’s attitude
toward the rest of the world. The most common policy indicators are tariff barriers (or the
effective tariff). However, there are many different policy instruments, i.e., non-tariff
barriers (such as quotas, exemptions, special permits and discriminatory practices) which
can affect trade and which can be considered a better proxy for trade openness, especially
in developed countries.9 Thus, other indicators such as the one provided by the Heritage
Foundation, Sachs and Warner (1995) and Wacziarg (2001) have used both tariff and non-
Table 9. Infrastructure and economic performance
Results
Ford and Poret (1991) Infrastructure can have a growth-enhancing effect but the relation is weak and unstable.
Bonaglia et al. (2000) Infrastructure makes a positive contribution to productivity in some Italian regions.
Kozerec et al. (2001) There is a strong positive contribution of telecom and electricity, gas and water to productivity in the United States and Europe.
Sutherland et al. (2009) There is evidence that infrastructure has a positive effect that goes beyond the expected impact from capital stock.
Hurlein (2006), Bougheas et al. (2000), Sutherland et al. (2009)
There is evidence that the link between infrastructure and growth is non-linear.
Source: OECD Secretariat.

STRUCTURAL INDICATORS: A CRITICAL REVIEW
OECD JOURNAL: ECONOMIC STUDIES – VOLUME 2010 © OECD 201024
tariff barriers to construct an indicator for trade openness. The main advantage of these
indicators is the (almost) absent problem of endogeneity with respect to growth. In
contrast, the main limitation is their limited availability, and the fact that they usually
reflect the legal framework in which agents operate, but not the effective degree of
protection they face.
A policy indicator of trade openness has been constructed by the Heritage Foundation.
The indicator is transparent in the way it is constructed and data are available for a very
broad set of countries (161) from 1995 to 2007, based on well-documented sources.10 The
indicator is based on both trade and non-tariff barriers. While this has an advantage over
other indicators based exclusively on tariff barriers, it has the main disadvantage that non-
tariff barriers are difficult to construct and often require subjective judgments. However,
the indicator is positively correlated with outcome indicators such as GDP’s share of total
exports and imports, and it shows a strong and positive correlation with GDP per capita.11
This suggests that the indicator is reliable (measures what it pretends) and matters for
living standards.
An alternative would be to restrict the construction of the indicator to tariff barriers.
The OECD collects tariff data for most of its member countries. However, the outcome does
not seem to be well correlated with openness, suggesting that abstracting from non-tariff
barriers would lead to a serious bias and lower the usefulness of the data.
Another policy indicator is the FDI restrictiveness index constructed by Golub (2003)
and updated in Koyama and Golub (2006). The indicator is available for OECD economies
and 13 non-OECD economies. It covers three categories of restrictions: limitations on
foreign ownership, screening or notification procedures and management or operational
restrictions.
Outcome indicators describe the volumes and values of existing trade. The outcome
indicator that has been mostly used to investigate the relation between trade and growth
is export growth (see Table 10) and the share of total exports and imports to GDP. Other
indicators of the same type are the structure-adjusted trade intensity (which is the ratio of
real imports plus real exports to real GDP, corrected for transportation costs, country size
and country income) and the ratio of imports to aggregate consumption. These indicators
are all fact-based, and easy to construct. Moreover, many international organisations
collect data on exports and imports (differentiated by structure, destination and origin)
and these indicators are easy to compute. The main drawback of this type of indicator is
the endogeneity problem with respect to growth (Frankel and Romer, 1995).
Table 10. Trade growth and economic performance: Effects of real export growth on real GDP growth
Average coefficient value 0.220
Median coefficient value 0.189
Average t-statistic 3.460**
Maximum coefficient value 1.851
Minimum coefficient value –1.433
Average standard error 0.021
Average 95% confidence interval 0.042
Average Kurtosis distribution 11.502
Average skewness –0.134
Note: **Significant at the 95% level. Based on 196 regressions.Source: Lewer and Van den Berg (2003).
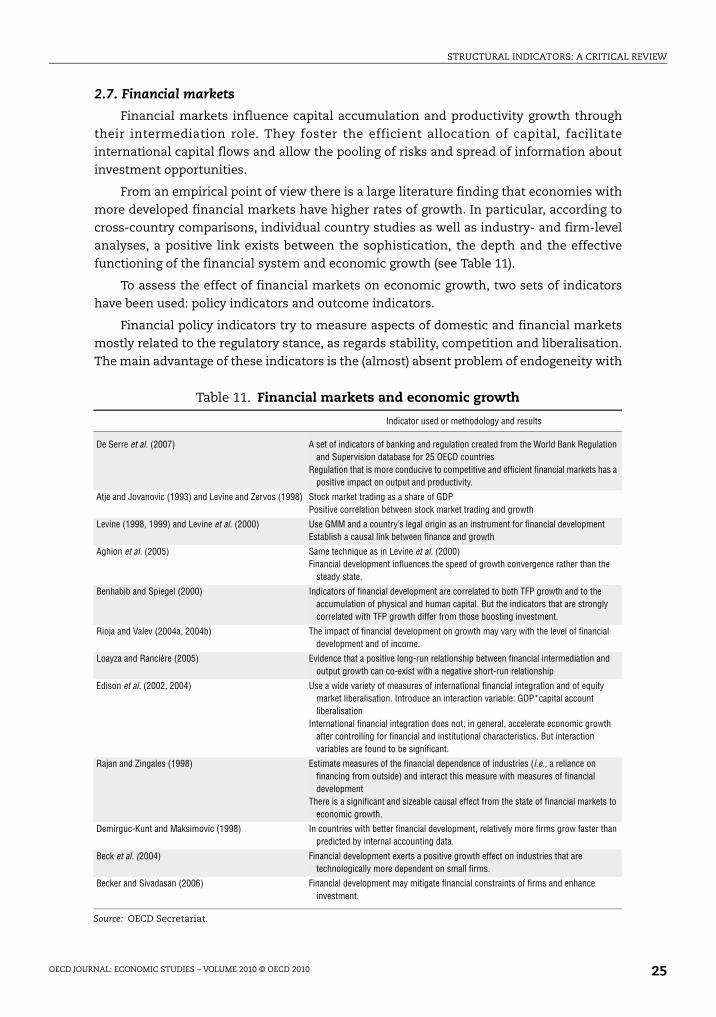
STRUCTURAL INDICATORS: A CRITICAL REVIEW
OECD JOURNAL: ECONOMIC STUDIES – VOLUME 2010 © OECD 2010 25
2.7. Financial markets
Financial markets influence capital accumulation and productivity growth through
their intermediation role. They foster the efficient allocation of capital, facilitate
international capital flows and allow the pooling of risks and spread of information about
investment opportunities.
From an empirical point of view there is a large literature finding that economies with
more developed financial markets have higher rates of growth. In particular, according to
cross-country comparisons, individual country studies as well as industry- and firm-level
analyses, a positive link exists between the sophistication, the depth and the effective
functioning of the financial system and economic growth (see Table 11).
To assess the effect of financial markets on economic growth, two sets of indicators
have been used: policy indicators and outcome indicators.
Financial policy indicators try to measure aspects of domestic and financial markets
mostly related to the regulatory stance, as regards stability, competition and liberalisation.
The main advantage of these indicators is the (almost) absent problem of endogeneity with
Table 11. Financial markets and economic growth
Indicator used or methodology and results
De Serre et al. (2007) A set of indicators of banking and regulation created from the World Bank Regulation and Supervision database for 25 OECD countries
Regulation that is more conducive to competitive and efficient financial markets has a positive impact on output and productivity.
Atje and Jovanovic (1993) and Levine and Zervos (1998) Stock market trading as a share of GDPPositive correlation between stock market trading and growth
Levine (1998, 1999) and Levine et al. (2000) Use GMM and a country’s legal origin as an instrument for financial developmentEstablish a causal link between finance and growth
Aghion et al. (2005) Same technique as in Levine et al. (2000)Financial development influences the speed of growth convergence rather than the
steady state.
Benhabib and Spiegel (2000) Indicators of financial development are correlated to both TFP growth and to the accumulation of physical and human capital. But the indicators that are strongly correlated with TFP growth differ from those boosting investment.
Rioja and Valev (2004a, 2004b) The impact of financial development on growth may vary with the level of financial development and of income.
Loayza and Rancière (2005) Evidence that a positive long-run relationship between financial intermediation and output growth can co-exist with a negative short-run relationship
Edison et al. (2002, 2004) Use a wide variety of measures of international financial integration and of equity market liberalisation. Introduce an interaction variable: GDP*capital account liberalisation
International financial integration does not, in general, accelerate economic growth after controlling for financial and institutional characteristics. But interaction variables are found to be significant.
Rajan and Zingales (1998) Estimate measures of the financial dependence of industries (i.e., a reliance on financing from outside) and interact this measure with measures of financial development
There is a significant and sizeable causal effect from the state of financial markets to economic growth.
Demirguc-Kunt and Maksimovic (1998) In countries with better financial development, relatively more firms grow faster than predicted by internal accounting data.
Beck et al. (2004) Financial development exerts a positive growth effect on industries that are technologically more dependent on small firms.
Becker and Sivadasan (2006) Financial development may mitigate financial constraints of firms and enhance investment.
Source: OECD Secretariat.

STRUCTURAL INDICATORS: A CRITICAL REVIEW
OECD JOURNAL: ECONOMIC STUDIES – VOLUME 2010 © OECD 201026
respect to growth. Moreover, while until the last decade data were not easily available,
today many organisations have undertaken (IMF, World Bank) or in the process of
undertaking (OECD) projects to construct databases on financial policy indicators.
Similarly, the importance of financial liberalisation for living standards and economic
growth has encouraged independent organisations (such as the Heritage Foundation) to
build their own policy indicators.
Outcome indicators describe the depth, the efficiency and the concentration of
domestic financial markets, and the degree of financial liberalisation. The Fraser Institute
has constructed an index that measures the freedom to exchange with foreigners called
Economic Freedom of the World. With regard to the domestic financial market, Beck et al.
(2007) construct perhaps the most comprehensive data set of indicators that measure the
size, activity and efficiency of financial intermediaries and markets (some of these
indicators are, for example, financial market capitalisation, bank concentration, net
interest rate margin, credit and bank deposits and other measures of financial depth). With
regards to international finance, outcome indicators often follow the same methodology of
trade outcome indicators. Examples of these indicators are: the financial liberation
indicator (overall stock of external liabilities and assets to GDP) and the financial freedom
indicator (the share of portfolio equity and FDI to GDP, and the share of equity liabilities in total
liabilities).12 Data on the variables used to calculate the indicators are from official sources
(IMF, World Bank) and are available for a large time span and very broad set of countries.
Moreover, the indicators seem to matter for living standards. In fact, they are positively and
significantly associated with GDP, both across countries and over time (Figure 7).
While all these indicators are easy to measure and can be used to assess the
implication of the financial structure and liberalisation on growth, their main drawback is
the presence of endogeneity problems with respect to growth. Thus, their use to assess the
impact of financial markets on growth has to be considered jointly with the use of policy
indicators (as instruments).
2.8. Reform and composite indicators
Measuring progress in structural reforms is crucial to formulate policy
recommendations. Information on individual reforms is currently collected by the
European Commission in its MICREF database for EU countries. These data often come
from other international organisations or one-off studies. Indicators of reform intensity
have been constructed as the average of labour (or product) market institutions for OECD
countries (Høj et al., 2006). There have been some interesting attempts to construct
summary measures of reform progress by aggregating variables in different areas (Lora and
Panizza, 2002; Eicher and Röhn, 2007). These indicators suffer from the drawbacks
associated with composite indicators, in particular, the difficulty of interpreting them and
the arbitrariness of the chosen weights. It also remains to be seen whether these indicators
could be updated at a sufficient frequency to allow a regular monitoring of progress.
Among the composite indicators that cover a large number of areas, it is worth
mentioning the Global Competitiveness Index from the World Economic Forum, which
takes into account both macroeconomic and microeconomic foundations of
competitiveness. Its scope is very large in terms of areas covered and country coverage. The
indicator is a weighted average of indicators gathered in 12 pillars.13 Weights of the
different pillars depend on the country’s level of development, but robustness checks
suggest that the index is not sensitive to the weights. This indicator is regularly updated.

STRUCTURAL INDICATORS: A CRITICAL REVIEW
OECD JOURNAL: ECONOMIC STUDIES – VOLUME 2010 © OECD 2010 27
However, regular changes in the methodology (in terms of data source or composition of
the index)14 cast doubts on its comparability over time.
3. ConclusionThe analysis undertaken in this paper has identified a number of areas that matter for
living standards, but are currently not well captured by existing indicators. Although
Figure 7. Correlation between selected indicators of financial developments and GDP per capita
Note: ***, ** and * denote significance at 1, 5 and 10%.
Sources: World Bank, IMF.
100
90
80
70
50
60
40
30
0
10
20
100
50
40
30
80
90
70
60
20
0
10
7 9 9.08.5 9.58 11 1110 10 10.56
ALB
AREARG
SUAARM
AUT
AZE
BEL
BENBFA
BGR
BHR
BLR
BLZ
BOL
BRA
BWA
CAF
CAN
CHE
CHL
CHN
CIV
CMRCOG
COL
CPVCRI
CZE
DEUDJI
DNK
DOMDZA
ECU
EGY
ESP
EST
ETH
FIN
ARFIJF
GAB
GBR
GEO
GHA
GIN
CRGBMG
GTMGUY
HKG
VRHDNH
HTI
HUN
IDNIND
IRLISL
ISR
ITAJAMJOR
JPNKAZ
KENKGZ
KHM
KORKWT
LBN
LKA
LSO
LUXUTL
LVA
MAR
MDAMDG
MEXMKD
MLI
MLT
MNGMOZ
SUMTRM
SYMIWM
NAMNER
NGA
NIC
NLD
NOR
NPL
NZL
PAK
PANPER
PHL
POL
PRTPRYROM
RUS UASAWR
SEN
SGP
SLE
SLV
SUR
SVK
SVN
SWE
SWZTCD
TGO
THA
TTO
TUNTUR
TZAUGA
UKRURY
USA
VNMYEM
ZAFZMB
BGD IRNGNB LAOSYRTJKUZBZWE
AUS
AUTBELCAN
CHECZE
DEU
DNK
ESPFIN
FRA
GBR
GRC
HUN
IRLISL
ITA
JPN
KOR
LUX
MEX
NLD
NOR
NZL
POL
PRT
EWSKVS
TUR
USA
20
18
16
14
12
8
10
6
4
2
07 98 11106
CANGBRNZL
DEU USAZAF
SGP
ITACHL
FRAJPN
MEXTHA
PER
ARG ISRMYS
TURIDN
MAR PHL
KOREGYPAK
COLLKA
BRAZWE
BGD
INDNPL
VENGHA
Log real GDP per capita
Financial liberalization World 1996, correlation = 0.65***
Log real GDP per capitaLog real GDP per capita
Financial freedom Financial freedomWorld 2005, correlation = -0.21*** OECD 2005, correlation = -0.32*

STRUCTURAL INDICATORS: A CRITICAL REVIEW
OECD JOURNAL: ECONOMIC STUDIES – VOLUME 2010 © OECD 201028
numerous indicators in these areas are currently available, there is still a clear need for the
development of new policy indicators. Governance is clearly a domain that matters for
living standards, but is currently absent in the framework. However, existing good
governance measures are mostly perception-based and cannot be credibly used for policy
recommendations. Further work will be required to develop fact-based indicators in
several dimensions of governance. It will be particularly helpful to construct an indicator
of property rights and continue to work on developing indicators of government
management systems.
Depending on their use, the question of the regular update of these indicators can also
be vital. Most of the structural indicators are, however, usually developed in the context of
a one-off study and/or are not updated at regular intervals. This prevents their use in
empirical work where time series are needed or in a surveillance process where reform
progress is closely monitored.
Notes
1. Legal corruption is corruption that is undertaken within the legal framework.
2. It could be argued, nonetheless, that only a part of these two dimensions is purely policy-driven.
3. See, for example, Berger and Messer (2002), Self and Grabowski (2003), Soares et al. (2007), Joumardet al. (2008).
4. See Joumard et al. (2008).
5. See Bloom et al. (2004) and Jamison et al. (2005) for a review of studies assessing the impact ofhealth on economic growth.
6. In particular, it can be argued that the additional information used to derive the new indicatorcannot be easily assigned to EPL sub-indicators.
7. The regulator specifies a price basket that can increase in line with an exogenous measure of inputcosts minus measures of efficiency gains.
8. In particular, Wacziarg (2001) considers six channels through which trade affects growth:1) macroeconomic policy quality, 2) government size, 3) price distortions from the existence ofblack market premium, 4) investment share of GDP, 5) technology, and 6) foreign directinvestment. His results show that the most important channel is investment, accounting for 63%of trade’s total effect on growth, while the technology channel and the stabilising channel accountfor the rest of the effect. For other empirical results see Lewer and Van den Berg (2003), whichpresents a critical survey of the literature on this topic.
9. Existing standards or regulations regarding safety or environmental issues are another form ofnon-tariff barriers. These barriers may be more stringent for developed countries than moretraditional forms of non-barriers.
10. The authors used the following sources to determine scores for trade policy, in order of priority:World Bank, World Development Indicators 2007 and Data on Trade and Import Barriers: Trends in AverageTariff for Developing and Industrial Countries 1981-2005; World Trade Organization, Trade PolicyReviews, 1995-2007; Office of the US Trade Representative, 2007 National Trade Estimate Report onForeign Trade Barriers; World Bank, Doing Business 2008; US Department of Commerce, CountryCommercial Guide, 2004-2007; Economist Intelligence Unit, Country Report, Country Profile, andCountry Commerce, 2004-2007; and official government publications of each country.
11. The indicator has a strong and positive relation both over time and cross country with GDP percapita. It is important to stress, however, that cross-country variation is the most important sourceof variability.
12. See Lane and Milessi-Ferretti (2007).
13. Institutions, macroeconomy, health, primary education, higher education and training, goodsmarket efficiency, labour market efficiency, financial market sophistication, technologicalreadiness, market size, business sophistication and innovation.

STRUCTURAL INDICATORS: A CRITICAL REVIEW
OECD JOURNAL: ECONOMIC STUDIES – VOLUME 2010 © OECD 2010 29
14. For instance, the exchange rate has been recently removed from the index.
References
General
Furceri, D. and A. Mourougane (2009), “Taking Stock of Existing Structural Policy and OutcomeIndicators”, OECD Economics Department Working Papers, No 676.
Loayza, N. and R. Soto (2003), “On the Measurement of Market-Oriented Reforms”, World Bankresearch paper, December.
Wölfl, A. (2009), “Ten Years of Product Market Reform in OECD Countries”, OECD Economics DepartmentWorking Papers, No. 695.
Governance
Acemoglu, D., S. Johnson and J. Robinson (2001), “The Colonial Origins of Comparative Development:An Empirical Investigation”, American Economic Review 91(5), pp. 1369-1401.
Acemoglu, D., S. Johnson and J. Robinson (2005), “Institutions as the Fundamental Causes of Long-RunGrowth”, in Handbook of Economic Growth, eds P. Aghion and S. Durlauf, Elsevier Book, Oxford.
Alfonso, A. and D. Furceri (2008), “Government Size, Composition, Volatility and Economic growth”,European Central Bank Working Paper Series 849.
Arndt, C. and C. Oman (2006), “Use and Abuse of Governance Indicators”, Development Center Studies.
Arnold, J. (2008), “Do Tax Structures Affect Aggregate Economic Growth? Empirical evidence from apanel of OECD countries”, OECD Economics Department Working Papers, No. 643.
Barro, R. and X. Sala-i-Martin (1991), “Convergence Across States and Regions”, Papers 629, Yale,Economic Growth Center.
Boulhol, H. and A. de Serres (2008), “Have Developed Countries Escaped the Curse of Distance?”, OECDEconomics Department Working Papers, No. 610.
Easterly, W. (2005), “National Policies and Economic Growth: A Reappraisal”, in the Handbook ofEconomic Growth, edited by P. Aghion and S. Durlauf.
Folster, S. and Henrekson, M. (2001), “Growth Effects of Government Expenditure and Taxation in RichCountries”, European Economic Review, Elsevier, Vol. 45(8), pp. 1501-1520.
Furceri, D. (2006), “Beta and Sigma-convergence: A Mathematical Relation of Causality”, EconomicsLetters, 89 (2), 212-215.
Glaeser, E., F. Lopez-de-Silanes and A. Schleifer (2004), “Do Institutions Cause Growth?”, Journal ofEconomic Growth, 9, pp. 271-303.
Globerman, S. and D. Shapiro (2002), “Global Foreign Direct Investment Flows: The Role of GovernanceInfrastructure”, World Development, Vol. 30.
Gradstein, M. (2008), “Institutional Traps and Economic Growth”, International Economic Review, Vol. 49,No. 3, August.
Jaumotte, F. and N. Pain (2005), “Innovation in the Business Sector”, OECD Economics DepartmentWorking Papers, No. 459.
Johansson, A., C. Heady, J. Arnold, and L. Vartia (2008), “Taxation and Economic Growth”, OECDEconomics Department Working Papers, No. 620.
Kaufmann, D. and A. Kraay (2002), “Growth without Governance”, Economia, 3, pp. 169-229.
Kaufmann, D., A. Kraay and M. Mastruzzi. (2008), “Governance Matters VII:Aggregate and IndividualGovernance Indicators 1996-2007”, World Bank Policy Research Working Paper 4654.
Kaufmann, D. (2008), “Corruption, Governance and Security: Challenges for the Rich Countries and theWorld”, World Bank Governance Matters, Chapter 2.1.
Kraay, A. and V. Nehru (2004), “When is External Debt Sustainable?”, World Bank Policy Research WorkingPaper No. 3200.
Knack, S. and P. Keefer (1995), “Institution and Economic Performance: Cross-Country Tests UsingAlternative Institutional Measures.”Economics and Politics, 7, pp. 207-227.
STRUCTURAL INDICATORS: A CRITICAL REVIEW
OECD JOURNAL: ECONOMIC STUDIES – VOLUME 2010 © OECD 201030
Lambsdorff, J. (1999), “Corruption in Empirical Research – A Review”, Transparency International WorkingPaper.
Marshall, M. and B. Cole (2008), Global Report on Conflict, Governance and State Fragility 2008, ForeignPolicy Bulletin: The Documentary Record of United States Foreign Policy (2008), 18:3-21 CambridgeUniversity Press.
Mauro, P. (1995), “Corruption and Growth”, Quarterly Journal of Economics, CX, pp. 681-712.
Milesi-Ferretti, G.M., R. Perotti and M. Rostagno (2002), “Electoral Systems and Public Spending”, TheQuarterly Journal of Economics, May.
Nicoletti, G. and F. Pryor (2006), “Subjective and Objective Measures of Governmental Regulations inOECD Nations”, Journal of Economic Behaviour and Organization, Vol. 59, pp. 433-449.
North, D.C. (1990), Institutions, Institutional Change and Economic Performance, Cambridge UniversityPress, Cambridge, United Kingdom.
North, D.C. (2005), Understanding the Process of Economic Change, Princeton University Press, New Jersey.
OECD (2005), “Handbook on Constructing Composite Indicators: Methodology and User Guide”, OECDStatistics Working Papers 2005/3.
Persson, T. and G. Tabellini (2003), The Economic Effects of Constitutions.Cambridge, MA: MIT Press.
Persson, T. and G. Tabellini (2004), “Constitutional Rules and Economic Policy Outcomes”, AmericanEconomic Review, 94, pp. 25-46.
Przeworski, A., M.E. Alvarez, J.A. Cheibub and F. Limongi (2000), Democracy and Development: PoliticalInstitutions and Well-Being in the World, 1950-1990, Cambridge University Press, Cambridge, UnitedKingdom.
Rodrick, D., A. Subramanian and F. Trebbi (2004), “Institution Rule: The Primary of Institutions overGeography and Integration in Economic Development”, Journal of Economic Growth 9, pp. 131-165.
Sala-i-Martin, Xavier (1996), “The Classical Approach to Convergence Analysis”, Economic Journal,Vol. 106(437), pp. 1019-36.
Welsh, H. (2008), “The Welfare Costs of Corruption”, Applied Economics, 40, pp. 1839-1849.
Society
Barro, R.J (2001), “Human Capital and Growth”, American Economic Review, Vol. 91(2), pp. 12-17.
Barro, R. (1996), “Health and Economic Growth”, mimeo. Cambridge, MA: Harvard University.
Barro, R. (1997), Determinants of Economic Growth: a Cross-Country Study, MIT Press, Cambridge.
Barro, R. and J. Lee (1994), “Sources of Economic Growth”, Carnegie-Rochester Conference Series on PublicPolicy 40, pp. 1-46.
Barro, R. and X. Sala-i-Martin (1995), Economic Growth, New York: McGraw-Hill.
Bhargava, A., D. Jamison, L. Lau and C. Murray (2001), “Modeling the effects of Health on EconomicGrowth”. Journal of Health Economics, 20(3), pp 423-440.
Berger, M. and J. Messer (2002), “Public Financing of Health Expenditure, Insurance, and HealthOutcomes”, Applied Economics, Vol. 34, No. 17, pp. 2105-2113.
Bloom, D.E. and D. Canning,(2005), “Health and Economic Growth: Reconciling the Micro and MacroEvidence”, mimeo, Harvard School of Public Health.
Bloom, D.E., D. Canning and P.N. Malaney (2000), “Demographic Change and Economic Growth inAsia”, Population and Development Review, 26, pp. 257-290.
Bloom, D.E., D. Canning and J. Sevilla. (2004), “The Effect of Health on Economic Growth: A ProductionFunction Approach”, World Development XXXII, pp. 1-13.
Bloom, D.E. and J.G. Williamson (1998), “Demographic Transitions and Economic Miracles in EmergingAsia”, World Bank Economic Review, 12(3), pp. 419-455.
Caselli, F., G. Esquivel and F. Lefort (1996), “Reopening the Convergence Debate: A New Look at CrossCountry Growth Empirics”, Journal of Economic Growth, 1,363-389.
Cohen, D. and M. Soto (2001), “Growth and Human Capital: Good Data, Good Results”, CEPR DiscussionPaper No. 3025.

STRUCTURAL INDICATORS: A CRITICAL REVIEW
OECD JOURNAL: ECONOMIC STUDIES – VOLUME 2010 © OECD 2010 31
Coulombe, S., J.F. Tremblay and S. Marchand (2004), “Literacy Scores, Human Capital and Growthacross Fourteen OECD Countries”, Statistics Canada.
de la Fuente, A. and R. Doménech (2006), “Human Capital in Growth Regressions: How muchDifference does Data Quality Make?”, Journal of the European Economic Association 4(1), pp. 1-36.
Dormont, B., J. Oliveira Martins, F. Pelgrin and M. Suhrcke (2008), “Health Expenditure, longevity andGrowth”, prepared for the IX Annual Conference of the Fondazione Rodolfo de Benedetti on Health,Longevity and Productivity, held at Limone sul Garda May 2007.
Finlay, J. (2007), “The Role of Health in Economic Development”, PGDA Working Papers.
Jamison, Dean, T., Lawrence J. Lau and Jia Wang (2005), “Health’s Contribution to Economic Growth inan Environment of Partially Endogenous Technological Progress” in Guillem Lopez- Casasnovas,Berta Rivera, and Luis Currais, eds., Health and Economic Growth, Cambridge, MA: MIT Press.
Gallup, J. and J. Sachs (2000), “The Economic Burden of Malaria”. Working Paper No. 52, Center forInternational Development, Harvard University, Cambridge,MA.
Hanushek, E. and D. Kimko (2000), “Schooling, Labor-Force Quality and the Growth of Nations”,American Economic Review 90(5), pp. 1184-208.
Harmon, C., I. Walker and N. Westergaard-Nielsen (2001), “Introduction” in C. Harmon, I. Walker andN. Westergaard-Nielsen, eds, Education and Earnings in Europe: A Cross-Country Analysis of the Returnsto Education, Edward Elgar, Cheltenham, pp. 1-37.
Joumard, I., C. André, C. Nicq and O. Chatal (2008), “Health Status Determinants: Lifestyle,Environment, Health Care Resources and Efficiency”, OECD Economics Department Working Papers,No 627.
Krueger, A. and M. Lindahl (2001), “Education for Growth: Why and for Whom?”, Journal of EconomicLiterature 39, pp. 1101-1136.
Mankiw, G., D. Romer and D. Weil (1992), “A Contribution to the Empirics of Economic Growth”,Quarterly Journal of Economics, pp. 407-37.
Oliveira Martins, J., R. Boarini, H. Strauss, C. de la Maisonneuve and C. Saadi (2007), “The PolicyDeterminants of Investment in Tertiary Education”, OECD Economics Department Working Papers,No. 576.
Oulton, N. (1997), “Total Factor Productivity Growth and the Role of Externalities”, National InstituteEconomic Review (162),pp. 99-111.
Price, R., E. Erlandsen and I. Joumard (2008), “Spending Efficiency in Health Care and EconomicGrowth”, Osaka Economic Papers, Vol. 58, No. 2, September.
Self, S. and R. Grabowski (2003), “How Effective is Public Health Expenditure in Improving OverallHealth? A Cross-country Analysis”, Applied Economics, Vol. 35, pp. 835-845.
Sachs, J. and A. Warner (1997), “Sources of Slow Growth in African Economies”, Journal of AfricanEconomics 6, pp. 335–337.
Soares, R.R. (2007), “Health and the Evolution of Welfare across Brazilian Municipalities”, Journal ofDevelopment Economics, Vol. 84, pp. 590-608.
Suhrcke, M. and D. Urban (2006), “Are Caridiovascular Diseases Bad for Economic Growth?”, CEifoWorking Paper 1845.
Topel, R. (1999), “The Labour Market and Economic Growth”, in O. Ashenfelter and D. Card, eds, TheHandbook of Labour Economics, North Holland, Amsterdam, Ch. 44.
Labour markets
Allard, G. (2005), “Measuring Job Security over Time: In Search of a Historical Indicator”, Instituto deEmpresa Working Paper WP05-17.
Amable, B., L. Demmou and D. Gatti (2007), “Employment Performance and Institutions: New Answersto Old Question”, IZA Discussion Paper 2731.
Baker, D., A. Glyn, D. Howell and J. Schmitt (2004), “Labour Market Institutions and Unemployment: aCritical assessment of Cross-Country Evidence”, forthcoming in D. Howell (ed.), FightingUnemployment: The Limits of Free Market Orthodoxy, Oxford University Press, Oxford.
Belot, M. and J. Van Ours (2001), “Unemployment and Labor Market Institutions: An EmpiricalAnalysis”, Journal of the Japanese and International Economy, Vol. 15, No. 4.
STRUCTURAL INDICATORS: A CRITICAL REVIEW
OECD JOURNAL: ECONOMIC STUDIES – VOLUME 2010 © OECD 201032
Blanchard, O. and J. Wolfers, J. (2000), “The Role of Shocks and Institutions in the Rise of EuropeanUnemployment: The Aggregate Evidence”, The Economic Journal, Vol. 110, pp. C1-C33.
Bertola, G., F. Blau and L. Kahn (2002), “Labor Market Institutions and Demographic EmploymentPatterns”, NBER Working Paper No. 9043, July.
Boone, J. and J. Van Ours (2004), “Effective Active Labor Market Policies”, IZA Discussion Paper, No. 1335,November.
Daveri, F. and G. Tabellini (2000), “Unemployment, Growth and Taxation in Industrial Countries”,Economic Policy, Vol. 0, Issue 30, April.
Fitoussi, J.P., D. Djestaz, E.S. Phelps, G. Zoega (2000), “Roots of the Recent Recoveries:Labor Reforms orPrivate Sector Forces?”, Brookings Papers on Economic Activity, 1:2000, p 237-256.
Elmeskov, J., J.P. Martin and S. Scarpetta (1998), “Key Lessons for labour Market Reforms: Evidence fromOECD Countries’ Experiences”, Swedish Economic Policy Review, Vol. 5, pp. 205-252.
International Monetary Fund (2003), “Unemployment and Labor Market Institutions: Why Reforms PayOff”, World Economic Outlook, Chapter IV, April.
Jimeno, J.F. and D. Rodriguez-Palenzuela (2002), “Youth Unemployment in the OECD: DemographicShifts, Labour Market Institutions, and Macroeconomic Shocks”, European Central Bank WorkingPaper 155.
Macculloch, R. and R. Di Tella (2002), “The Consequences of Labor Market Flexibility: Panel EvidenceBased on Survey Data”, Harvard NOM Research Paper No. 03-47.
Morgan, J. and A. Mourougane (2005), “Structural Unemployment and Labour Market Institutions inEurope”, Scottish Journal of Political Economy, Vol. 52, No. 1, February.
Nickell, S., L. Nunziata and W. Ochel (2003), “Unemployment in the OECD since the 1960s: What do weknow?”, mimeo, Bank of England.
Nickell, S.J. (1997), “Unemployment and Labor Market Rigidities: Europe versus North America”, Journalof Economic Perspectives, Vol. 11, No. 3, pp. 55-74.
Nickell, S. (1998), “Unemployment: Questions and Some Answers”, The Economic Journal, Vol. 108,Issue 448, May.
Nunziata, L. (2002), “Unemployment, Labour Market Institutions and Shocks”, Nuffield College WorkingPapers in Economics, 2002-W16.
OECD (2006), “Boosting Jobs and Incomes: Policy Lessons from Reassessing the OECD Jobs Strategy”,free material available on-line at www.oecd.org/document/56/0,3343,en_2649_33927_36998072_1_1_1_1,00.html,Paris.
Scarpetta, S. (1996), “Assessing the Role of Labour Market Policies and Institutional Settings onUnemployment: a Cross Country Study”, OECD Economic Studies, No. 26 1996/1, pp. 43-97.
Product markets
Arnold, J., G. Nicoletti and S. Scarpetta (2008), “Regulation, Allocative Efficiency and Productivity inOECD Countries: Industry and Firm-Level Evidence”, OECD Economics Department Working Papers,No. 616.
Aghion, P. and R. Griffith (2005), Competition and Growth Reconciling Theory and Evidence, MIT Press.
Bassanini, A. and R. Duval (2006), “Employment Patterns in OECD Countries: Reassessing the Role ofPolicies and Institutions”, OECD Economics Department Working Papers, No 486, June.
Bassanini, A. and E. Ernst (2002), “Labour Market Institution, Product Market Regulation andInnovation: Cross-countries Evidence”, OECD Economics Department Working Papers, No. 316, January.
Blanchard, O. and F. Giavazzi (2003), “Macroeconomic Effects of Regulation and Deregulation on Goodsand Labour Markets”, Quarterly Journal of Economics, Vol. 118, No. 3, pp. 879-907.
Bayoumi, T., D. Laxton and P. Pesenti (2004), “Benefits and Spillovers of Greater Competition in Europe:A Macroeconomic Assessment”, NBER Working paper No. 10416, April, Cambridge.
Bartelsman, E., S. Scarpetta and F. Schivardi (2003), “Comparative Analysis of Firm Demographics andSurvival Micro-level Evidence for the OECD Countries”, OECD Economic Department Working Papers,No. 348.
Conway, P., D. De Rosa, G. Nicoletti and F. Steiner. (2006), “Regulation, Competition and ProductivityConvergence”, OECD Economics Department Working Paper No. 509, September.
STRUCTURAL INDICATORS: A CRITICAL REVIEW
OECD JOURNAL: ECONOMIC STUDIES – VOLUME 2010 © OECD 2010 33
Griffith, R., R. Harrison and G. Macartney (2007), “Product Market Reforms, Labour Market Institutionsand Unemployment”, Economic Journal, 117, March, C142-C166.
Høj, J. (2007a), The Competition Law and policy Indicator, OECD Economics Department Working Papers,No. 568.
Høj, J., M. Jimenez, M. Maher, G. Nicoletti and M. Wise (2007b), “Product Market Competition in theOECD Countries: Taking Stock and Moving Forward”, OECD Economics Department Working Papers,No. 575.
OECD (2003a), “What Drives Productivity Growth at the Industry Level?”, in The Source of EconomicGrowth in OECD Countries, Chapter 3, Paris.
Nicoletti, G., A. Bassanini, E. Ernst, S. Jean, P. Santiago and P. Swaim. (2001), “Product and LabourMarket Interaction in OECD Countries”, OECD Economics Department Working Papers, No. 312,December.
Nicoletti, G. and S. Scarpetta (2003), “Regulation Productivity and Growth: OECD Evidence”, OECDEconomics Department Working Papers, No. 347, January.
Scarpetta, S. and T. Tressel (2002), “Productivity and Convergence in a Panel of OECD Industries: DoRegulations and Institutions Matter?”, OECD Economics Department Working Papers, No. 342,September.
Infrastructure
Bougheas, S., P. Demetriades and T. Mamuneas (2000), “Infrastructure, Specialization, and EconomicGrowth”, Canadian Journal of Economics, 33 (2), pp. 506-522.
Ford, R., and P. Poret (1991), “Infrastructure and Private-Sector Productivity”, OECD Department ofEconomics and Statistics Working Papers, No. 91.
Bonaglia, F., E. La Ferrara and M. Marcellino (2000), “Public Capital and Economic Performance:Evidence from Italy”, Giornale degli Economisti 60.
Koszerek, D., K. Havik, K. McMorrow, W. Röger, and F. Schönborn (2007), “An Overview of the EU KLEMSGrowth and Productivity Accounts”, European Economy Economic Papers, No. 290.
Hurlin, C. (2006), “Network Effects of the Productivity of Infrastructure in Developing Countries”, WorldBank Policy Research Working Paper Series No. 3808.
Sutherland, D., S. Araujo, B, Egert and T. Kozluk (2009), “Infrastructure Investment: Links to Growthand the Role of Public Policies”, OECD Economics Department Working Papers, No. 686.
Financial markets
Aghion, P., P. Howitt and D. Mayer-Foulkes (2005), “The Effect of Financial Development onConvergence: Theory and Evidence”, Quarterly Journal of Economics, Vol. 120.
Atje, R. and B. Jovanovic (1993), “Stock Markets and Development”, European Economic Review, Vol. 37.
Beck, T., A. Demirguc-Kunt, L. Laeven, and R. Levine (2004), “Finance, Firm Size, and Growth”, NBERWorking Paper 10983.
Becker, Bo and J. Sivadasan (2006), “The Effect of Financial Development on the Investment Cash FlowRelationship: Cross-Country Evidence from Europe”, European Central Bank Working Paper No. 689.
Benhabib, J. and M.M. Spiegel (2000), “The Role of Financial Development in Growth and Investment”,Journal of Economic Growth, Vol. 5.
Demirgüç-Kunt, A. and V. Maksimovic (1998), “Law, Finance and Firm Growth”, Journal of Finance,Vol. 53.
de Serres, A., S. Kobayakawa, T. Sløk and L. Vartia (2006), “Regulation of Financial Systems andEconomic Growth”, OECD Economics Department Working Papers, No. 506.
Edison, H., M. Klein, L. Ricci and T. Sløk, (2004), “Capital Account Liberalization and EconomicPerformance: Survey and Synthesis”, IMF Staff Papers, Vol. 51.
Edison, H., R. Levine, L. Ricci and T. Sløk, (2002), “International Financial Integration and EconomicGrowth”, Journal of International Money and Finance, Vol. 21.
Levine, R. and S. Zervos (1998), “Stock Markets, Banks and Economic Growth”, American EconomicReview, Vol. 88.
STRUCTURAL INDICATORS: A CRITICAL REVIEW
OECD JOURNAL: ECONOMIC STUDIES – VOLUME 2010 © OECD 201034
Levine, R. (1998), “The Legal Environment, Banks and Long-run Economic Growth”, Journal of MoneyCredit and Banking, Vol. 30.
Levine, R. (1999), “Law, Finance and Economic Growth”, Journal of Financial Intermediation, Vol. 8.
Levine, R., N. Loayza and T. Beck (2000), “Financial Intermediation and Growth: Causality and Causes”,Journal of Monetary Economics, Vol. 46.
Loayza, N. and R. Ranciere (2005), “Financial Development, Financial Fragility and Growth”, IMFWorking Paper No. WP/05/170.
Rajan, R.G., and L. Zingales, (1998), “Financial Dependence and Growth”, American Economic Review,Vol. 88.
Rioja, F. and N. Valev (2004a), “Finance and the Sources of Growth at Various Stages of EconomicDevelopment”, Economic Inquiry, Vol. 42.
Rioja, F. and N. Valev (2004b), “Does One Size Fits All? A Re-examination of the Finance and GrowthRelationship”, Journal of Development Economics, Vol. 74.
International Trade
Frankel, J. and D. Romer (1995), “Trade and Growth: An Empirical Investigation”, NBER WorkingPapers 5476.
Golub, S. (2003),Measures of Restrictions on Inward Foreign Direct Investments for OECD Countries,OECD Economics Department Working Papers, No. 357.
Koyama, T. and S. Golub (2006), “OECD’s FDI Regulatory Restrictiveness Index: Revisions andExtensions to More OECD Economies”, OECD Economics Department Working Papers, No. 525.
Lewer, J. and H. Van den Berg (2003), “How Large is International Trade’s Effect on Economic Growth?”,Journal of Economic Surveys, 17 (3), pp. 363-396.
Sachs, J. and D. Warner (1995), “Economic Reform and the Progress of Global Integration”, HarvardInstitute of Economic Research Working Papers 1733, Harvard – Institute of Economic Research.
Wacziarg, R. (2001), “Measuring the Dynamic Gains from Trade”, World Bank Policy Research Paper 2001.
Reform and composite indicator
Eicher, T. and O. Röhm (2007), “Institutional Determinants of Economic Performance in OECDCountries – An Institutions Climate Index”, CESifo DICE Report 1/2007.
Høj, J., V. Galasso, G. Nicoletti and T-T. Dang (2006), “The Political Economy of Structural Refoms:Emprirical Evidence from OECD Countries”, OECD Economics Department Working Papers, No.501.
Lora, E. and U. Panizza (2002), “Structural Reforms in Latin America Under Scrutiny”, Inter-AmericanDevelopment Bank research Department.