review and assessment of air pollution effects …
TRANSCRIPT

REVIEW AND ASSESSMENT OF AIR POLLUTION EFFECTS AND
THEIR RECORDED TRENDS
REPORT BY THE WORKING GROUP ON EFFECTS
OF THE UNECE CONVENTION ON LONG-RANGE
TRANSBOUNDARY AIR POLLUTION


iii
REVIEW AND ASSESSMENT OF AIR POLLUTION EFFECTS AND
THEIR RECORDED TRENDS
2004 SUBSTANTIVE REPORT Technical Report prepared by the Bureau of the Working Group on Effects, in collaboration with the International Cooperative Programmes (ICPs) and the Task Force on the Health Aspects of Air Pollution, with the assistance of a consultant Mr. G. Fenech and the secretariat for the Convention on Long-range Transboundary Air Pollution. Contributions from the following individuals are particularly acknowledged:
M. Krzyzanowski (Task Force on the Health Aspects of Air Pollution); B. L. Skjelkvåle and J. L. Stoddard (ICP Waters); M. Lorenz, T. Haußmann and V. Mues (ICP Forests); L. Lundin, L. Bringmark and M. Forsius (ICP Integrated Monitoring); G. Mills and H. Harmens (ICP Vegetation); V. Kucera and J. Tidbald (ICP Materials); J.-P. Hettelingh and T. Spranger (ICP Modelling and Mapping).
Cover page photograph(s) (and copyrights): Printed in 2004 Copyright: publisher ISBN

iv
Preface It is a great pleasure to introduce you to the report on "Review and Assessment of Air Pollution Effects and Their Recorded Trends". This report addresses significant elements for the work under the Convention on Long-range Transboundary Air Pollution and is the contribution of the Working Group on Effects to and support for the expected reviews or revisions of protocols to the Convention. At the same time it is a timely contribution to the 25th anniversary of the Convention on Long-range Transboundary Air Pollution. In 2001 the Bureau of the Working Group on Effects suggested to its International Cooperative Programmes (ICPs), the Joint Task Force on the Health Aspects of Air Pollution and the Joint Expert Group on Dynamic Modelling to prepare a substantive report on the effects-related work under the Convention for presentation to the Executive Body in 2004. It agreed that the main purpose of this report should be to present a summary of results of effects research and long-term monitoring. As a consequence we are pleased to present in this report a comprehensive review of the status of air pollution effects with views back to the time when the region-wide monitoring work was initiated and ahead to future scenarios. All ICPs submitted their critical assessments building on long-term time series of monitoring data, taking into account new available scientific knowledge and covering a widened spectrum of pollutants. Links to EMEP supplied related information including deposition trends. Based on the comprehensive databases of the monitoring programmes, the report provides recorded trends of air pollution effects on human health, ecosystems and corrosive materials including information on first signs of recovery in the environment. They demonstrate clearly that the emission reductions of major air pollutants achieved so far have already led to significant improvements in the status of certain receptors. There is significant evidence that further improvements can be achieved by pursuing this strategy as the basis for future strategies of emission reduction in international partnership. To provide such comprehensive and condensed information as a basis for political decisions was only possible due to the broad participation of Parties who generously supported the effects-oriented programmes and their intensive cooperation. Harold Dovland Heinz-Detlef Gregor Chair for the Executive Body Chair for the Working Group on Effects of the Convention

v
Table of Contents
PREFACE ...............................................................................................................................IV
TABLE OF CONTENTS........................................................................................................ V
EXECUTIVE SUMMARY.................................................................................................. VII
INTRODUCTION.................................................................................................................... 1
CHAPTER I EVOLUTION OF THE EFFECTS-RELATED WORK OF THE CONVENTION ........................................................................................................................ 3
1.1 ORGANIZING THE SCIENTIFIC SUPPORT FOR THE CONVENTION ........................................ 4 1.2 THE 1994 SULPHUR PROTOCOL: THE FIRST EFFECTS-BASED APPROACH .......................... 6 1.3 THE 1999 GOTHENBURG PROTOCOL: THE MULTI-EFFECT APPROACH .............................. 7 1.4 THE 1998 PROTOCOL ON HEAVY METALS....................................................................... 9 1.5 THE 1998 PROTOCOL ON PERSISTENT ORGANIC POLLUTANTS ...................................... 10
CHAPTER II STATUS AND TRENDS.............................................................................. 11 2.1 CHANGES IN EMISSIONS AND POLLUTION LEVELS .......................................................... 11
Sulphur ...................................................................................................................... 11 Nitrogen..................................................................................................................... 13 Ground-level ozone ................................................................................................... 14 Particulate matter...................................................................................................... 14 Heavy metals: lead, cadmium and mercury .............................................................. 14 Persistent organic pollutants..................................................................................... 15
2.2 EFFECTS OF AIR POLLUTION ON HUMAN HEALTH ........................................................... 16
Particulate matter...................................................................................................... 17 Ozone......................................................................................................................... 18 Nitrogen dioxide ........................................................................................................ 18 Heavy metals ............................................................................................................. 19 Persistent organic pollutants..................................................................................... 21
2.3 EFFECTS OF AIR POLLUTION ON SURFACE WATERS ........................................................ 23
Empirical trends in surface water chemistry ............................................................ 23 Aquatic biological recovery from acidification......................................................... 28 Concerns about nitrogen ........................................................................................... 29 Future changes in surface waters ............................................................................. 29
2.4 EFFECTS OF AIR POLLUTION ON FORESTS....................................................................... 30
Defoliation................................................................................................................. 31 Needle and leaf chemistry ......................................................................................... 33 Nutrient imbalances .................................................................................................. 33 Risks due to elevated deposition of sulphur and nitrogen......................................... 33 Case studies of observed effects on forests ............................................................... 34

vi
2.5 EFFECTS OF AIR POLLUTION ON VEGETATION ................................................................ 36 Effects of ozone on crops – visible injury.................................................................. 36 Effects of ozone on crops – reduced biomass............................................................ 38 Effects of ozone on semi-natural vegetation.............................................................. 40 Critical levels for exposure of vegetation to ozone ................................................... 40 Heavy metals in mosses and white clover ................................................................. 41
2.6 INTEGRATED MONITORING OF ECOSYSTEMS .................................................................. 43
Acidification studies .................................................................................................. 43 Development and testing of dynamic models ............................................................ 44 Nitrogen-related effects............................................................................................. 45 Heavy metals in forested and aquatic ecosystems..................................................... 46 Use of ecosystem data for the evaluation of climate change impacts ....................... 47
2.7 EFFECTS OF AIR POLLUTION ON MATERIALS .................................................................. 47
Trends in corrosion damage...................................................................................... 48 Mapping corrosion rates ........................................................................................... 50 Acceptable corrosion rates........................................................................................ 51 Metals released by corrosion .................................................................................... 51
2.8 MODELLING AND MAPPING OF AIR POLLUTION EFFECTS AND RISKS............................... 52
Derivation of critical loads and levels ...................................................................... 52 Areas at risk of acidification and eutrophication...................................................... 53 Updating the maps for critical thresholds................................................................. 54 Dynamic modelling.................................................................................................... 54 Critical loads of heavy metals ................................................................................... 57
CHAPTER III CONCLUSIONS ......................................................................................... 59
CHAPTER IV CHALLENGES ........................................................................................... 63 3.1 AIR POLLUTION AND HUMAN HEALTH............................................................................ 63
Particulate matter...................................................................................................... 63 Ozone......................................................................................................................... 63 Heavy metals and persistent organic pollutants ....................................................... 64
3.2 AIR POLLUTION AND ECOSYSTEMS ................................................................................ 64
Acidification .............................................................................................................. 64 Eutrophication........................................................................................................... 64 Ground-level ozone ................................................................................................... 65 Heavy metals ............................................................................................................. 65
3.4 AIR POLLUTION AND MATERIALS .................................................................................. 66
3.5 INTERACTIONS AND SYNERGIES .................................................................................... 66
REFERENCES ....................................................................................................................... 67

vii
Executive Summary The history leading to the Convention on Long-range Transboundary Air Pollution can be traced back to the 1960s, when the link between sulphur emissions in Europe and the acidification of lakes in Scandinavia was first suspected by scientists. The link became more established in the 1970s, as evidence increasingly showed that pollutants could travel hundreds of kilometres from their point of emission to affect air quality and ecosystems far away. The Convention was the first multilateral treaty aimed to protect the environment against the growing threat of acid precipitation and photochemical smog. It was adopted in 1979 and entered into force in 1983. Eight protocols followed, specifying further commitments by Governments to control air pollution. The need to have sound scientific underpinning of future decisions on controlling air pollution was fully recognized at the adoption of the Convention. As a result:
The Cooperative Programme for Monitoring and Evaluation of the Long-range Transmission of Air Pollutants in Europe (EMEP) was recognized within the text of the Convention itself; and
In April 1981, the Working Group on Effects was established to address the
effects of sulphur compounds and other major air pollutants on human health and the environment.
In the early years of the Convention, discussions on the damage of air pollution on forests and freshwaters, as well as the harmful effects on materials and on human health, provided the driving force for action and the development of the early protocols. International Cooperative Programmes (ICPs) were established under the Working Group on Effects to carry out more detailed studies and to begin long-term monitoring of affected ecosystems and materials. Today, there are six ICPs, each headed by a lead country, organized by a task force and served by an international programme centre, and the Task Force on the Health Aspects of Air Pollution, established jointly by the World Health Organization (WHO) and the Executive Body. Their work proceeds in parallel with the atmospheric science work of EMEP and the work of the Working Group on Strategies and Review related to the potential needs for reviewing and revising existing protocols or for preparing new protocols. The objective of this report is to present an assessment of the present status of air pollution effects and their recorded trends based, in large part, on long-term results of the work by the ICPs and the Task Force on Health of the Working Group on Effects. The report aims to provide the Executive Body with summarized and assessed effects-based data and information needed for the forthcoming review of the protocols to the Convention. Evolution of the effects-related work of the Convention While effects of air pollution always were a major consideration in the development of protocols, the early protocols did not use effects to define Parties’ obligations for emission reductions. For example, the 1985 Sulphur Protocol adopted a flat-rate approach; it established commitments by Parties to reduce their annual sulphur emissions by 30%. The

viii
1988 Protocol on Nitrogen Oxides adopted a mix of measures. Parties would limit their nitrogen oxide emissions and apply best available technology to major new sources. Large-scale cooperative monitoring networks were established by ICPs from the mid-1980s, building on existing national programmes, and provided systematic observational evidence for and insight into air pollution effects on various receptors. Recognition that there might be opportunities to use effects more directly in setting emission targets was first included in the 1988 Protocol on Nitrogen Oxides. It stated in article 2 that "further steps to reduce national annual emissions of nitrogen oxides" should take into account "internationally accepted critical loads", the quantitative estimate of the exposure to one or more pollutants below which significant harmful effects on specified sensitive elements of the environment do not occur according to present knowledge. Establishing critical loads required an important effort. A large number of scientific workshops and other expert meetings identifying pollution receptors and thresholds were held during the late 1980s and 1990s. A manual was developed to guide the Parties in using recommended methods to calculate and map critical loads in a harmonized manner. Each Party was responsible for gathering its country-specific data. Eventually, critical loads of acidity for forest soils and surface waters were compiled and mapped for Europe and so were their exceedances (the deposition which exceeds critical loads). Using integrated assessment models, a task force under the Working Group on Strategies evaluated the results from integrated models using critical loads data in conjunction with meteorological information, emissions data and abatement costs. It produced a number of emission reduction scenarios to support negotiations for the 1994 Protocol on Further Reduction of Sulphur Emissions. The 1994 Sulphur Protocol was the first effects-based instrument to set air pollutant emission controls for achieving the desired environmental protection at lowest costs for the countries involved. In contrast to the earlier protocols, it takes into account the ability of the environment to withstand certain levels of pollution while assigning to each country a different emission reduction target in the form of an emission ceiling. Describing exceedances of critical loads of acidity (the excess deposition over the critical load) was subsequently further developed to allow combinations of sulphur and nitrogen depositions. Critical loads for the eutrophying effect of nitrogen on terrestrial ecosystems were also derived. The formulations of critical loads were thus advanced to account for both acidifying and eutrophying effects simultaneously. In addition, critical levels of ozone for the protection of human health and plants were developed. The effects-based approach was subsequently used for the 1999 Gothenburg Protocol, a multi-pollutant and multi-effect protocol. This Protocol simultaneously addresses acidification, eutrophication and ground-level ozone by setting emission ceilings for four pollutants: sulphur, nitrogen oxides (NOx), ammonia and volatile organic compounds (VOCs). Two protocols to the Convention were adopted in 1998 to address air pollutants not covered by the earlier protocols. The 1998 Protocol on Heavy Metals addresses the environmental concerns associated with the long-range transport of heavy metals. It focuses initially on cadmium, lead and mercury, but includes provisions for adding other metals in future if

ix
considered necessary. The Protocol aims to cut emissions of the three priority metals from industrial sources, combustion processes and waste incineration. The 1998 Protocol on Persistent Organic Pollutants (POPs) aims to control the release into the environment of a number of pesticides, industrial chemicals (such as PCBs) or substances (such as dioxins) unintentionally formed in waste incineration and combustion processes. The Protocol lists 16 substances and includes provision for substances to be added or current obligations to be modified as new information is obtained. Neither of these two protocols uses an effects-based approach but work is under way to determine the feasibility of using a critical loads approach for some heavy metals. Status and trends Human health effects of air pollution There is a large body of evidence suggesting that exposure to air pollution, even at the levels commonly achieved nowadays in European countries, leads to adverse health effects. In particular, exposure to pollutants such as particulate matter (PM) and ozone has been found to be associated with increases in hospital admissions for cardiovascular and respiratory disease and mortality in many cities in Europe and other continents. In 2002, the World Health Organization (WHO) estimated that close to 100,000 deaths annually are associated with long-term exposure to air pollution.
Particulate matter There is strong evidence to conclude that fine particles (commonly measured as particulate matter <2.5 µm, PM2.5) are more hazardous than larger ones (coarse particles) in terms of mortality and cardiovascular and respiratory effects. Fine particles are strongly associated with mortality and other effects such as hospitalization for cardio-pulmonary disease. There is sufficient concern also about the health effects of coarse particles to justify their control. Epidemiological studies on large populations have been unable to identify a threshold concentration below which ambient PM has no effect on health. Even at the lowest end of the observed PM2.5 concentration range, some – the most susceptible – subjects are at risk. Amongst the characteristics found to be contributing to the toxicity of particles are metal content, presence of polyaromatic hydrocarbons (PAHs), other organic components and the size fractions, both the small (<2.5 µm) and extremely small size (<0.1 µm). However, the Task Force on Health has concluded that it is not possible to quantify the relative importance of the main PM components for effects on human health at this stage.
Ozone Recent epidemiological studies have strengthened the evidence that there are short-term ozone effects on mortality and respiratory illness. Also, there are effects related to long-term ozone exposure, e.g. reduced lung function growth in children. There is little evidence from short-term epidemiological studies to suggest a threshold ozone concentration at the population level. Long-term studies do not indicate a threshold either.

x
Heavy metals The Task Force on the Health Aspects of Air Pollution has reviewed information on the sources, chemical properties and spatial distribution of pollution from cadmium, lead and mercury, and has evaluated the potential health effects in Europe. Food is the main source of cadmium exposure in the general population, responsible for about 99% of the total intake in non-smokers. Kidney and bone are the critical target organs following chronic environmental exposure to cadmium. There is strong evidence that, though the atmospheric deposition is relatively small, cadmium is accumulating in soils and catchments under certain environmental conditions, thus increasing the risk of future exposure through food. Soil and dust are significant sources of exposure to lead, particularly for young children. Children are the critical population due to the possible effects of lead on neuro-behavioural development. Food uptake is the main pathway of exposure in the general population though the present environmental exposure to lead may be considered as relatively safe for adults. Present data on the concentrations of lead in air and estimates of the daily intake of lead with food suggest a decreasing trend of environmental lead exposure, in particular in countries where lead has been eliminated from petrol. Long-range transboundary transport of anthropogenic mercury is a considerable contributor to mercury concentrations in the environment. However, estimating the risks from dietary exposure to mercury resulting from the deposition of mercury to soil is difficult to quantify. The mercury content in fish often exceeds the recommended limit in many countries.
Persistent organic pollutants The persistent organic pollutants (POPs) cover a large number of chemicals, which break down slowly in the environment and are likely to travel over long distances. Many POPs accumulate in the fat of animal tissue. At high enough levels, they may have adverse effects on wildlife and on human health, including effects on reproduction, development, and resistance to disease. The Task Force on Health reviewed the health risks of POPs and identified those for which long-range transport contributed significantly to exposure and health risks. Furthermore, the Task Force performed a brief hazard assessment for various POPs identifying the main gaps in information necessary for risk assessment. Effects of air pollution on ecosystems
Surface waters For surface waters, the ultimate goal of emissions controls is biological recovery, or the return of sensitive species that have been eliminated during the course of acidification. This will occur only when the water quality is sufficiently good. This is one reason for the focus of ICP Waters on chemical data. Another is that water chemistry data are much more readily available than biological data. Biological data are nevertheless required because ecosystems may not return to an earlier stage, but will reflect the present physical, chemical and biological environment.
xi
The most significant finding in the regional trend analysis carried out by ICP Waters is the almost universal decrease in sulphate concentrations in lakes and streams in regions throughout Europe and North America. This result, based on 15 years of data, provides clear evidence of the environmental benefits resulting from SO2 emission reductions. In contrast to sulphate, changes in nitrate concentrations are modest. Fewer than half of the regions exhibited a significant regional trend – either increasing or decreasing. The combined result of the decrease in sulphate and the modest changes in nitrate is that surface water acidity has generally decreased. Evidence of a biological response to decreased surface water acidification is, so far, not uniform throughout the region. Signs of recovery are observed for invertebrates in the Scandinavian countries and in Canadian lakes formerly affected by a large local emission source, while at the most acidified Central European sites improvements in water quality have not yet reached a level where widespread effects on biology can be detected. Predictions, both by steady-state and dynamic models, indicate that surface water chemistry will continue to improve. Comparing the nitrogen and sulphur depositions in 1990 to site-specific critical loads of acidity for 72 European ICP Waters sites shows that there were exceedances at 51 of the sites. Implementation of current emission reduction plans reduces to 32 the number of the sites still expected to have exceedances in 2010. Dynamic models predict the site-specific timescale of the recovery. Nitrogen deposition remains a concern. About half of the ICP Waters sites exhibit a high degree of nitrogen saturation. The 1999 Gothenburg Protocol will slow down the process, but nitrogen will continue to accumulate in terrestrial ecosystems and thus increase the risk of saturation in the long term.
Forests Forest condition in Europe has been deteriorating for more than two decades. Studies in the early 1980s revealed widespread forest damage across Europe. At that time, media reports of predictions of a large-scale forest dieback due to air pollution generated grave concern among the general public. More than two decades of forest damage research and 17 years of monitoring forest condition in Europe have since led to a more differentiated view; recent forest damage is explained by means of synergistic effects of a range of natural and anthropogenic factors with air pollution playing a predisposing, accompanying and locally triggering role. Defoliation is used as an indicator for numerous environmental factors affecting tree vitality. The assessment of the trends in crown condition, since 1986, at some 6000 sample plots of the level I programme (large-scale monitoring) by ICP Forests has revealed a clear overall increase in defoliation. After a transient recuperation in recent years, the deterioration now seems to be resuming. This overall trend, however, shows high spatial and temporal variation. Chronic excess input of nitrogen to forest ecosystems causes nutrient imbalances which, in turn, increase the sensitivity of plants to climatic factors, such as frost or drought, and susceptibility to parasite attacks. Approximately half of 109 ICP Forests level II plots showed nutrient imbalances. The plots are part of the ICP Forests level II network of 860 intensive monitoring sites but not all the sites have all the data necessary to check for nutrient imbalances. The results are consistent with results from a modelling study of approximately 230 ICP Forests level II sites which concluded that at 45% of sites nitrogen deposition was

xii
sufficient to cause nutrient imbalance. The same study concluded that nitrogen deposition at 92% of the sites was such that nitrogen would continue to accumulate in the soils, thus moving the ecosystems toward nitrogen saturation in the long term.
Vegetation Field surveys and bioindicator studies have provided important evidence for the significance of ozone as a phytotoxic pollutant across Europe. ICP Vegetation has been monitoring the frequency of incidences of ozone injury on ozone-sensitive species each spring and summer since 1994. Ozone injury has been recorded at every site in the network of 35 sites across Europe and 2 sites in the United States most years and several times per year at many of the sites. Ozone injury was also detected on the foliage of over 20 agricultural and horticultural crops, including lettuce, chicory and spinach for which such foliar damage results in loss in commercial value. At many of the ICP Vegetation biomonitoring sites, participants have also detected a reduction in the biomass of a sensitive biotype of white clover, relative to that of a resistant biotype. No trends in incidences of injury or biomass change have been detected, possibly reflecting the large year-to-year variation in ozone pollution. For crops and forest trees, exposure indices were developed that provide a more biologically realistic representation of the exposure of plants to ozone than indices that are based on ozone concentration alone. The new exposure indices take into account the influence of humidity on the uptake of ozone by the plant. This is important because, for a given ozone concentration, ozone uptake in dry air can be much less than that for the same plants exposed to ozone on a humid day. The new indices are used to improve estimates of critical levels. Unlike concentration-based critical levels, the new relationships between yield and ozone uptake can be used to estimate yield loss. The analysis of heavy metal concentrations in mosses provides a surrogate, time-integrated measure of the spatial patterns of heavy metal deposition from the atmosphere to terrestrial systems, and is easier and cheaper than conventional precipitation analysis. The ICP Vegetation heavy metals in mosses survey provides data on concentrations of ten metals (arsenic, cadmium, chromium, copper, iron, lead, mercury, nickel, vanadium, zinc) in naturally growing mosses throughout Europe. The resulting maps show an east-to-west decrease in metal concentrations in mosses, related in particular to industrial emissions. Former industrial sites and historic mines accounted for the location of some high concentrations in areas without contemporary industries. Long-range transboundary transport appears to account for elevated concentrations of heavy metals in areas without local emission sources, such as lead in Southern Scandinavia. A preliminary comparison of the 1995 and 2000/2001 surveys indicates a general decline in the concentrations of arsenic, cadmium, lead and vanadium in mosses.
Integrated monitoring of ecosystems The ICP Integrated Monitoring network of approximately 50 sites in Europe and one in Canada has been set up especially to understand the dynamics and processes of ecosystem changes, and thus to determine the causes of the changes. It provides inputs for the development, testing and calibration of dynamic models. The data, when used in conjunction with data sets from the more regionally extensive ICPs, provide an integrated hierarchical structure for evaluating the impacts of air pollutants on the European scale. The ICP Integrated Monitoring data are used to better understand acidification, eutrophication and other nitrogen-related effects, as well as the cycling and effects of heavy metals in ecosystems.

xiii
Input-output budget calculations carried out at ICP Integrated Monitoring sites inform about possible accumulation or release of sulphur, nitrogen, base cations and aluminium in the ecosystem. Calculations for 21 ICP Integrated Monitoring sites in Europe indicate that soils at these sites are recovering from high sulphur inputs in the past by releasing more sulphate than they currently receive. The calculations also document the production of acidity related to the deposition and cycling of nitrogen at the sites. Long-term data sets of observations at ICP Integrated Monitoring sites were used to test the performance of dynamic models and improve them. Model simulations, based on these data sets, indicate that recovery of soil and water quality from acidification is determined by both the amount and the time of implementation of emission reductions. Extending the target year for emission reductions causes a delay in the ecosystem recovery in the shorter term (less than 30 years). For the long-term response, the magnitude of emission reductions is more important than the timing of the reduction. Model development is still needed regarding several key processes, particularly nitrogen dynamics and relations to climate change. For many decades, large regions of North America and Europe have received elevated deposition of nitrogen compounds. ICP Integrated Monitoring sites improve our understanding of the nitrogen cycle and predictions of long-term effects of chronic excess nitrogen deposition. Effects of air pollution on materials Materials selected for study by ICP Materials are representative of both technical materials and also materials used in objects of cultural heritage. They include metallic materials, stone, paint coatings, electric contact materials, glass and polymeric materials. Reductions of corrosion rates for many materials observed in the period 1987-1995 at 39 sites have been in the order of 30–70%. They are a result of the decreases in sulphur dioxide concentrations in ambient air during the same period. In the past this pollutant has been the dominating factor causing degradation to materials and objects of cultural heritage. Recent data show a break in the decreasing corrosion trend, with no evident further decrease for more and more sites. This is because the corrosion is due not only to SO2 but also to a mixture of sulphur and nitrogen compounds, ozone and particulate matter. This multi-pollutant situation is also the reason for the corrosion rates in urban areas being considerably higher than those in surrounding rural regions. The corrosion rate in central Stockholm, for example, was about three times higher than at the rural site in Aspvreten, situated 80 km to the south-east. The eight-year dose-response functions – developed by ICP Materials – are, at present, the best available functions to use for mapping procedures on both national and European scales. A number of countries have produced maps of the increased risk of corrosion to materials using these functions. Also, an approach similar to the critical levels approach has been developed in order to use the functions for setting emission targets. Calculations have been made, for example, to determine what levels of SO2 would be required in order to maintain corrosion rates at 1.5 times (or twice) the background corrosion rate. The resulting "acceptable levels" of SO2 for several of the materials are quite low compared to critical levels for most ecosystems and human health.

xiv
Case studies have shown that there is a substantial release of some metals (e.g. copper and zinc) to the biosphere as a result of weathering and especially due to acidifying pollutants. Metal release to the environment was quantified in countries where stock of materials at risk was available. Modelling and mapping of air pollution effects and risks European databases of critical loads and levels used to support effects-based protocols were compiled by ICP Modelling and Mapping. The analysis of exceedances using the database used to support the 1999 Gothenburg Protocol predicted that, after implementation of the Protocol, both the magnitude of exceedances and their geographical extent would be substantially less than in 1990 for acidity, but only slightly less for nutrient nitrogen. The ultimate goal of non-exceedance would not be reached in large parts of Europe. The European databases of critical loads of acidity and of nutrient nitrogen were updated in 2003/2004. Generally, the new values have not changed substantially from the ones that were used in 1999. The new maps of exceedances, however, show higher remaining exceedances in 2010 than expected in the original assessment for the 1999 Gothenburg Protocol. These exceedances are mainly due to an improved EMEP deposition model, the finer resolution of a new EMEP grid and the use of ecosystem-dependent deposition. Updating the concentration-based critical levels of ozone for agricultural crops, semi-natural vegetation and forest trees, and using a more biologically realistic representation of the exposure of crops to ozone, also provide improved estimates of the projected exceedances of critical levels of ozone after full implementation of the Protocol. For the first time, in 2003, the European database of critical loads of acidity was extended to include parameters needed for dynamic modelling. Dynamic models provide information on time delays of ecosystem damage – or recovery – caused by changes in acidifying deposition. A very simple dynamic model is being proposed for application at the European scale. First tests have shown the need to improve the performance at the European level. Linking dynamic models and integrated assessment models requires information about "target years", i.e. the timeline for environmental goals to be met. A series of workshops under the Convention in the past decade have contributed to improving methodologies to derive critical limits and critical loads of heavy metals, in particular lead, cadmium and mercury, for terrestrial and aquatic ecosystems. A study in 2002 in several European countries showed that the aim of producing maps of critical loads and their exceedances was not unrealistic. After further improvement of the methodology, European maps of critical loads and their exceedances could be produced by 2005. Conclusions
Monitoring has been vital to show the widespread damage from air pollution in Europe and North America. In some cases, it is beginning to show the first signs of recovery;
Recovery is particularly evident in the monitoring of lakes and streams and in the
corrosion rates for many materials;

xv
Ozone damage is widespread and has not shown any trends with time;
The sound science of the effects programmes' data and models and their improvements
can continue to be expected providing better predictions and support for further policies;
Even after implementation of existing protocols there will still be problems:
Acidification Steady-state as well as dynamic model predictions indicate additional measures are required to protect all sensitive ecosystems;
Eutrophication Many forest areas show signs of nutrient imbalance and leaching
of nitrate. Similarly, many aquatic sites are nitrogen saturated. Planned emission reductions will not prevent further nitrogen accumulation;
Ozone Current levels of ozone in many European and North American cities have
adverse health effects. Materials, including objects of cultural heritage, corrode faster and are soiled more rapidly in urban centres. Current levels of ozone continue to affect vegetation;
Particulate matter Current levels of particulate matter have adverse health effects.
The particles also contribute to the corrosion of materials in urban areas;
Heavy metals Though emissions of lead, cadmium and mercury have been cut, these metals will continue to accumulate in soils and are expected to reach concentrations which affect biota. The cadmium content of agricultural soils is of concern because of its possible effects on human health.
The range of effects-oriented activities has effectively covered most of the priority
issues of the Convention since the 1980, but continued reassessment is needed to ensure continued focus;
The effects-based approach is seen as an effective way to continue developing policies
to optimize emission reductions for meeting environmental goals at the lowest total cost;
The interaction between science and policy has resulted in close interrelations between
the two and has facilitated the application of scientific knowledge in national and international pollution reduction programmes;
Participation of Parties in the work of the effects-oriented programmes has been crucial
to their success, while the current structure of the Convention helps the evaluation and application of the results.
Challenges The work under the Convention has gained wide acceptance mainly because it has been based on the best available scientific knowledge. Further progress requires uncertainties to be reduced in important areas such as: the understanding of nitrogen cycles and the effects of

xvi
chronic elevated nitrogen deposition on aquatic and terrestrial ecosystems; the effects of PM and ozone on human health; biological recovery from acidification; the material effects in a multi-pollutant environment; and the combined effects of air pollutants together with the possible effects of climate change on vegetation and ecosystems. Assessing whether pollution abatement measures are having their desired effect requires an ongoing commitment to long-term monitoring. The range of effects-oriented activities has effectively covered most of the priority issues of the Convention since the 1980. The international scientific effort carried out under the aegis of the Convention should continue. It has played a vital role in developing the scientific foundation for the work under the Convention and it is required to monitor and assess future progress resulting from implementation of the protocols as well as to provide information for their review and possible revision. It is through international cooperation and coordinated effort that innovative approaches were developed and adopted, and that Convention-wide databases on air pollutant effects were built. However, continued reassessment of the activities is needed to ensure continued focus. Parties are urged to continue their involvement through their domestic scientific programmes, through active participation by their experts and through their support for the ICPs and Tasks Forces, whose importance in coordinating the international effort is vital. Parties have played a key role in developing the effects-related work to a point where it contributes directly to policy decisions and provides the potential to contribute their input in the future too.

1
Introduction The year 2004 marks the twenty-fifth anniversary of the Convention on Long-range Transboundary Air Pollution. Significant progress has been achieved during those years. There have been advances in negotiating a number of protocols that specify commitments by Governments to control air pollution and progress in monitoring transboundary air pollution and its effects. The development of the successive protocols shows increased refinement, from the flat-rate emission controls in the early protocols to effects-based pollution abatement strategies in the 1999 Gothenburg Protocol, considering simultaneously multiple pollutants and multiple effects. The Convention has encouraged international cooperation in scientific research and monitoring activities. It has intensified international exchange of knowledge, information and data and, by establishing the International Cooperative Programmes, developed international cooperation in studying the effects of air pollution. This report presents an assessment of the status of air pollution effects and their recorded trends. The assessment is based, in a large part, on long-term results of the work by the International Cooperative Programmes (ICPs) and Task Forces of the Working Group on Effects. It aims to provide the Executive Body with summarized and assessed effects-related data and information needed for the forthcoming reviews of the existing protocols to the Convention. The reviews will assess the effectiveness of existing protocols, the status of their implementation and their impact on the state of the environment and human health. This report focuses on environmental and health effects of air pollution. A companion report, published by the Cooperative Programme for Monitoring and Evaluation of the Long-range Transmission of Air Pollutants in Europe (EMEP), provides detailed information about trends in emissions, deposition and ambient air concentrations of air pollutants. Chapter I presents a short description of the protocols to the Convention. It focuses, in particular, on the evolution of the protocols in relation to existing knowledge on effects and on the development and application of an effects-based approach, based on the concept of critical loads and levels, to derive cost-effective pollution abatement strategies. Chapter II provides information on the status and recorded trends of health and environmental effects of air pollution. It focuses on relatively recent information that is likely to be particularly relevant in the context of the review of protocols. Chapter III presents conclusions and recommendations for consideration by the Executive Body and Parties to the Convention. Chapter IV describes challenges for the future work of the Convention. It uses information provided in Chapter II to identify problems – or potential problems – posed by existing levels of air pollution and for which the current research and monitoring programmes have yet to resolve some important uncertainties.


3
Chapter I Evolution of the effects-related work of the Convention The history of the Convention on Long-range Transboundary Air Pollution, hereafter referred to as the Convention, can be traced back to the 1960s, when scientists demonstrated the interrelationship between sulphur emissions in continental Europe and the acidification of Scandinavian lakes. The 1972 United Nations Conference on the Human Environment in Stockholm signalled the start for active international cooperation to combat acidification. Between 1972 and 1977, several studies confirmed the hypothesis that air pollutants could actually travel thousands of kilometres before deposition and damage occurred. This implied that international cooperation was necessary to solve problems such as acidification. The Convention was the first multilateral treaty to protect the atmospheric environment against the growing threat of acid precipitation and photochemical smog. It was adopted in 1979 at a High-level Meeting within the framework of the Economic Commission for Europe (ECE) on the Protection of the Environment and it entered into force in 1983. Eight protocols followed, specifying further commitments by Governments to control pollution:
(i) The 1984 Protocol on Long-term Financing of the Cooperative Programme for Monitoring and Evaluation of the Long-range Transmission of Air Pollutants in Europe (EMEP) that entered into force on 28 January 1988;
(ii) The 1985 Protocol on the Reduction of Sulphur Emissions or their
Transboundary Fluxes by at least 30 per cent that entered into force on 2 September 1987;
(iii) The 1988 Protocol concerning the Control of Emissions of Nitrogen Oxides or
their Transboundary Fluxes that entered into force on 14 February 1991; (iv) The 1991 Protocol concerning the Control of Emissions of Volatile Organic
Compounds or their Transboundary Fluxes that entered into force on 29 September 1997;
(v) The 1994 Protocol on Further Reduction of Sulphur Emissions that entered
into force on 5 August 1998; (vi) The 1998 Protocol on Persistent Organic Pollutants that entered into force on
23 August 2003; (vii) The 1998 Protocol on Heavy Metals that entered into force on 29 December
2003;
(viii) The 1999 Protocol to Abate Acidification, Eutrophication and Ground-level Ozone that has not yet entered into force.

4
1.1 Organizing the scientific support for the Convention At the adoption of the Convention it was fully recognized that it would be necessary to have sound scientific underpinning of future decisions on controlling air pollution. The Cooperative Programme for the Monitoring and Evaluation of the Long-range Transmission of Air Pollutants in Europe (EMEP) that was established before adoption of the Convention was included within the text of the Convention itself and funded through its first Protocol. The secretariat for the Convention was established at the United Nations Economic Commission for Europe (UNECE). A Working Group on Effects of Sulphur Compounds was established by the Signatories of the Convention and had held two meetings prior to the Convention’s entry into force, the first being in April 1981. This work was continued, as described in the work-plan of the first session of the Executive Body held in June 1983, by a Working Group on Effects that was to address the effects of sulphur compounds and other major air pollutants on human health and the environment – a mandate that continues to the present day. In the early years of the Convention there was much discussion on the damage of air pollution on forests and freshwaters as well as the harmful effects on materials. Collaboration with the World Health Organization (WHO) was also initiated, in order to investigate effects on human health. These discussions, stimulated by reports from the Working Group on Effects, provided the driving force for action and the development of the early protocols. Soon, International Cooperative Programmes (ICPs) were established under the Working Group on Effects to carry out more detailed studies and to begin long-term monitoring of affected ecosystems and materials (Figure 1.1). 16.8.2004 MPJ 4th DRAFT Note: all official starting years (=1st TF meeting, ≠ establishment date) have been checked
number of participating Parties as of 9 June 20041979 1980 1981 1982 1983 1984 1985 1986 1987 1988 1989 1990 1991 1992 1993 1994 1995 1996 1997 1998 1999 2000 2001 2002 2003 2004
Working Group on EffectsICP Forests 40
ICP Waters 19ICP Materials 19
ICP Vegetation 31ICP Modelling and Mapping (formely: Task Force on Mapping) 25
ICP Integrated Monitoring 21Joint Task Force on Health 14
Task Force on Integrated Assessment Modelling of the Working Group on Strategies and Review
1999 Gothenburg Protocol 121998 POPs Protocol 201998 Heavy Metal Protocol 21
1994 Sulphur Protocol 251991 VOC Protocol 21
1988 Nitrogen Oxides Protocol 281985 Sulphur Protocol 22
1984 EMEP Protocol 411979 Convention 491979 1980 1981 1982 1983 1984 1985 1986 1987 1988 1989 1990 1991 1992 1993 1994 1995 1996 1997 1998 1999 2000 2001 2002 2003 2004
= protocol in force number of ratifications as of 17 August 2004 Figure 1.1. Major organizational developments of effects-related work during the first 25 years of the Convention. The starting years of the programmes are based on the date of the first Task Force meeting. The protocols in boldface are directly effects-based (see text)

5
Today there are six ICPs reporting to the Working Group on Effects and a Joint Task Force on Health, between WHO and the Executive Body, that reports through the Working Group (Figure 1.2):
(i) ICP on Assessment and Monitoring of Air Pollution Effects on Forests (ICP Forests);
(ii) ICP on Integrated Monitoring of Air Pollution Effects on Ecosystems (ICP
Integrated Monitoring);
(iii) ICP on Effects of Air Pollution on Materials, including Historic and Cultural Monuments (ICP Materials);
(iv) ICP on Modelling and Mapping of Critical Levels and Loads and Air Pollution
Effects, Risks and Trends (ICP Modelling and Mapping);
(v) ICP on Effects of Air Pollution on Natural Vegetation and Crops (ICP Vegetation);
(vi) ICP on Assessment and Monitoring of Acidification of Rivers and Lakes (ICP Waters);
(vii) Joint Task Force on the Health Aspects of Air Pollution (Task Force on
Health). Their work proceeds in parallel with the atmospheric science work of EMEP and with continued deliberations on strategies and policies under the Working Group on Strategies and Review. In recent years, an Implementation Committee has begun to consider how Parties are complying with their obligations under the protocols to the Convention.
Figure 1.2. The structure of intergovernmental bodies, expert groups and scientific centres under the Convention on Long-range Transboundary Air Pollution
ProgrammeCoordinating
Centre
ProgrammeCentre
CoordinationCentre
for Effects
Main ResearchCentre
ProgrammeCentre
ProgrammeCentre
Implementation Committee
WHOBonn
ICPForests
Task Force
ICPIntegrated Monitoring
Task Force
ICPModelling and Mapping
Task Force
ICPMaterials
Task Force
ICPVegetationTask Force
ICPWaters
Task Force
Task ForceHealth
Working Group onEffects
Task ForceEmission Inventories
and Projections
Task ForceMeasurementand Modelling
ChemicalCoordinating
Centre
MeteorologicalSynthesizingCentre-West
MeteorologicalSynthesizingCentre-East
Task ForceIntegrated
Assessment Modelling
CentreIntegrated
Assessment Modelling
EMEPSteering Body
Expert groupon ammonia
Expert groupon POPs
Network of Expertson Benefits and
Economic Instruments
Expert groupon techno-economic issues
Expert groupon Heavy Metals
Working Group onStrategies and Review
Executive Body

6
1.2 The 1994 Sulphur Protocol: the first effects-based approach While the early protocols were not "effects-based" – i.e. they did not use effects of air pollution to define Parties’ obligations for emission reductions – effects were nevertheless the major driving force in their development. However, it was recognized that there might be opportunities to use effects more directly in setting emission targets. So in 1988, the Protocol on Nitrogen Oxides identified, in its basic obligations, that "further steps to reduce national annual emissions of nitrogen oxides" should take into account of "internationally accepted critical loads", the quantitative estimate of the exposure to one or more pollutants below which significant harmful effects on specified sensitive elements of the environment do not occur according to present knowledge. This provided a stimulus for new work on critical loads. It started in the late 1980s and resulted in the negotiation and adoption of the 1994 Oslo Protocol on Further Reduction of Sulphur Emissions, the first international instrument based on the critical loads approach. It takes into account the ability of the environment to withstand pollution while, on the basis of this, assigning to each country a different emission reduction target in the form of an emission ceiling. This is in contrast to earlier protocols which used a flat-rate approach, a fixed percentage of emission reductions or measures based on the use of best available technology. To make such abatement strategies cost-effective integrated assessment models brought together information on critical loads (or environment quality objectives derived from critical loads), emission data, patterns of atmospheric transformation and dispersion of emissions and costs of control measures. From these data, the models calculated the distribution of emission reductions that would achieve given environmental objectives at the least cost for Europe as a whole. A critical load was defined in the 1994 Sulphur Protocol in the same way as already in the 1988 Protocol on Nitrogen Oxides. Establishing a critical load requires access to huge collections of data on the receptors of pollution in order to make quantitative estimates of maximum tolerable exposure. Deriving critical loads required that receptors of the pollution be identified. For the Protocol elements of the aquatic or terrestrial ecosystems were considered. Next, pollution thresholds needed to be identified, those concentrations below which the receptor was not affected – according to the available scientific knowledge. The process of deriving critical loads required a large number of workshops and other expert meetings, during the late 1980s and 1990s (see Annex I). There, various pollution receptors were considered and thresholds identified. The thresholds were generally in the form of chemical targets derived from experimental evidence or practical field experience – by observing changes in the vegetation, fauna and biodiversity, for example. These thresholds were then used to derive critical loads. Convention-wide collaboration to ensure a common approach for deriving and mapping critical loads was achieved through a network of national focal centres (NFCs), under an international mapping programme established with a Task Force under the Working Group on Effects in 1989. A Coordination Center for Effects provided scientific and technical support. The programme developed a Mapping Manual to describe the recommended methods to be used by Parties to the Convention. It is updated regularly to reflect advances in knowledge

7
and is available on the internet. The Parties, in turn, were responsible for compiling and reporting their national critical loads data. For the 1994 Sulphur Protocol, critical loads of sulphur for soils and surface waters were compiled (Hettelingh et al. 1992, 1995). The resulting critical load database consisted of contributions by NFCs and, using data from various European databases, calculations of critical loads for countries that were unable to provide national data (De Smet et al. 1997). The database was used to produce European maps of critical loads of sulphur and their exceedances (the deposition which is above the critical loads), using the EMEP 150 km x 150 km grid cell map. The Convention's Task Force on Integrated Assessment Modelling used critical loads data in conjunction with meteorological information, emissions data and abatement costs to produce a number of scenarios to support the protocol negotiations (Amann et al. 1999). During negotiations, a number of model-generated scenarios were produced and evaluated and the Working Group on Strategies ultimately settled on a "60 percent gap closure" scenario as the most appropriate basis for negotiations. This aimed at reducing differences between the 1990 depositions and critical loads by at least 60 per cent in every EMEP grid cell in Europe. It was chosen primarily because it appeared to offer a relatively high level of ecosystem protection for the overall cost. The scenario resulted in a different emission reduction requirement for each country. The map of critical sulphur deposition is displayed in Annex 1 of the Protocol. 1.3 The 1999 Gothenburg Protocol: the multi-effect approach The effects-based approach used for the 1994 Sulphur Protocol was also used to negotiate the 1999 Gothenburg Protocol. This protocol simultaneously addresses acidification, eutrophication and ground-level ozone by setting emission ceilings for 2010 for four pollutants: sulphur, nitrogen oxides (NOx), volatile organic compounds (VOCs) and ammonia. An integrated assessment model based on the effects of each country’s emissions and on the costs of emission reduction measures guided the negotiations of emission reductions for each European Party. The sensitivity of different ecosystems was a key factor in the modelling exercise, given the long-term goal of the Protocol to protect ecosystems from air pollution. Compared to the 1994 Sulphur Protocol, the 1999 Gothenburg Protocol presented new challenges to science. The formulation of critical loads had to recognize that: • Both sulphur and nitrogen compounds – either oxidized (i.e. NOx) or reduced (i.e.
ammonia) – contribute to acidification; • Deposition of a small amount of nitrogen, which can be taken up by vegetation or
immobilized, is not detrimental to ecosystems; • Deposition of nitrogen – when it exceeds the critical load for nutrient nitrogen –
contributes to eutrophication.

8
The method used to develop strategies to reduce exceedances of critical loads of acidity used for the 1994 Sulphur Protocol was further developed to include combinations of sulphur and nitrogen emission reductions. In addition, critical loads for the eutrophying effect of nitrogen on terrestrial ecosystems were derived and included in the strategy development. The formulations of critical loads were thus advanced to account for both acidifying and eutrophying effects simultaneously. Another challenge resulted from the need to include ground-level ozone in the Protocol. Critical levels had to be determined for exposure to ozone. A critical level is defined as "concentration of pollutants in the atmosphere above which direct adverse effects on receptors, such as human beings, plants, ecosystems or materials, may occur, according to present knowledge". Moreover, abatement strategies had to recognize that both NOx and VOCs contribute to the formation of ozone. It is calculated that the full implementation of the protocol in 2010 will reduce sulphur emissions by 63%, nitrogen oxides by 41%, ammonia by 17% and VOC emissions by 40% compared to 1990. Based on estimates made at the time, the area in Europe with excessive levels of acidification will shrink from 93 million hectares in 1990 to 15 million hectares after full implementation of the Protocol. The area with excessive levels of eutrophication will fall from 165 million hectares in 1990 to 108 million hectares. The number of days with excessive ozone levels will be halved; it is estimated that life-years lost as a result of decreased ozone exposure will be about 2,300,000 lower in 2010 than in 1990 and that there will be approximately 47,500 fewer premature deaths resulting from ozone and particulate matter in the air. The projected exceedances of critical loads for acidification and eutrophication are shown in figures 1.3 and 1.4, respectively, using the reference years of the 1999 Gothenburg Protocol: 1990 and 2010.
molcha-1a-1
no exceedance0 - 200200 - 400400 - 700700 - 1000> 1000
Exceedance of acidity CLs 1990
Dep-data: EMEP/MSC-WCCE/MNP
molcha-1a-1
no exceedance0 - 200200 - 400400 - 700700 - 1000> 1000
Exceedance of acidity CLs 2010
Dep-data: EMEP/MSC-WCCE/MNP
Figure 1.3. Exceedance of critical loads of acidity due to sulphur and nitrogen depositions in 1990 (left) and 2010 (1999 Gothenburg Protocol (right)). The unit is moles of charge (molc), or acid equivalents (eq), per hectare per year

9
molcha-1a-1
no exceedance0 - 200200 - 400400 - 700700 - 1000> 1000
Exceedance of nutrient CLs 1990
Dep-data: EMEP/MSC-WCCE/MNP
molcha-1a-1
no exceedance0 - 200200 - 400400 - 700700 - 1000> 1000
Exceedance of nutrient CLs 2010
Dep-data: EMEP/MSC-WCCE/MNP
Figure 1.4. Exceedance of critical loads of nutrient nitrogen in 1990 (left) and 2010 (1999 Gothenburg Protocol (right)). The unit is moles of charge (molc), or acid equivalents (eq), per hectare per year 1.4 The 1998 Protocol on Heavy Metals The 1998 Protocol on Heavy Metals addresses the environmental concerns associated with the long-range transport of heavy metals. It focuses initially on cadmium, lead and mercury, and it includes provisions for adding more metals in future if international action is needed. The protocol aims to cut emissions of the three priority metals from industrial sources (e.g. iron and steel industry, non-ferrous metal industry), combustion processes (e.g. power generation, road transport) and waste incineration. It sets limits for emissions from stationary sources and suggests best available techniques to achieve these limits. It requires countries to phase out leaded petrol and introduces measures to lower emissions of mercury from products such as batteries. The Protocol addresses concerns that heavy metals are known to have adverse effects on the environment and they have also been associated with human health effects. High levels of some heavy metals can cause blood disorders and may affect liver, kidneys, and circulatory and nervous systems. High concentrations of mercury in fish pose a risk to human health and development of the foetus, and in several countries people are advised to avoid eating fish from lakes with high mercury levels. There are strong indications that high concentrations of some metals (lead, cadmium, copper, zinc and mercury) affect the decomposition of organic matter in forests and impair the recycling of important forest nutrients. Effects on birds and wildlife include the risk of reproductive problems through exposure to mercury in contaminated prey and neurobehavioral effects on vision, coordination and movement. Work is under way to determine the feasibility of using a critical loads approach for some heavy metals (see Chapters II and IV for details).

10
1.5 The 1998 Protocol on Persistent Organic Pollutants The 1998 Protocol on Persistent Organic Pollutants (POPs) was adopted and signed as a result of the concern that POPs are resistant to degradation and therefore persistent in the environment. They possess toxic properties and have been associated with a wide range of adverse effects on human health and the environment. POPs bioaccumulate in fatty tissues of animals and humans, and their ability to biomagnify (or build up) in the food chain can result in concentrations of concern for humans and wildlife at distances both far from and near to the point of emission or discharge. The objective of the Protocol is to control, reduce or eliminate discharges, emissions and losses of POPs to the environment. Three main sources of air pollution contribute to the accumulation of POPs in the environment: the use of certain pesticides, the manufacture and use of certain chemicals (such as pentachlorophenols, PCBs) and the unintentional formation of certain substances (such as dioxins) in waste incineration, combustion, metal production and from mobile sources (such as automobile engines). The Protocol lists 16 substances and includes a process to allow for substances to be added or current obligations to be modified as new information is obtained.

11
Chapter II Status and trends Emissions of air pollutants, including those covered by the protocols of the Convention, increased during the industrialization of Europe and North America. The environmental movement in the second half of the twentieth century slowed down or even reversed the trends in emissions. This has resulted in decreased ambient concentration and deposition of these pollutants. Nevertheless, effects of air pollutants on ecosystems are often the result of decades of deposition, which has passed through or accumulated in the ecosystems, and reducing or reversing them will also require several decades. However, direct air pollution effects, such as those of ozone, could be reduced quicker as the effect mechanisms are different. 2.1 Changes in emissions and pollution levels The Cooperative Programme for Monitoring and Evaluation of the Long-range Transmission of Air Pollutants in Europe (EMEP) provides information to the Convention about emissions of a number of air pollutants, their fate through the atmosphere and their eventual deposition. Significant reductions in emissions of air pollutants have been achieved during the 25 years existence of EMEP. Sulphur From 1980 to 2000, there has been a considerable decrease in sulphur emissions over most parts of Europe. The overall reduction has been nearly 70%, but there are large differences in achievements between countries and regions. The overall change in sulphur emission in Europe is shown in Figure 2.1. Figure 2.1. Annual emissions of SO2 in Europe 1980 to 2000 (in kilotons), for all countries, including (yellow line) and excluding (green line) marine and natural emission sources. The straight line is the official data; the dotted line is experts’ estimates, differing only slightly on the European scale
0
10000
20000
30000
40000
50000
60000
70000
1975 1980 1985 1990 1995 2000 2005

12
The emission decrease has resulted in reduced pollution levels in the atmosphere, both in terms of concentrations in ambient air and in deposition. Comparison of sulphur deposition in 1980 and in 2000 (Figure 2.2) shows a remarkable decrease. a) b) Figure 2.2. Total deposition of sulphate for (a) 1980 and (b) 2000 (Source: EMEP)

13
Nitrogen a) b) Figure 2.3. Total deposition of nitrogen for (a) 1980 and (b) 2000 (Source: EMEP)

14
The 1980–2000 period has also witnessed a reduction in emissions of nitrogen oxides in Europe. The overall reduction amounts to 25% for that period. Differences between regions are, however, far more significant than for sulphur: Some countries and regions have reduced their emissions by 40–50%, e.g. Germany, Poland and Switzerland. The decrease in the main part of Western Europe is around 30%. In Southern Europe as a whole, the emissions have not changed, and in several Mediterranean countries they have actually increased. Ammonia emissions have shown the least reductions. These data are also subject to larger uncertainties than the emissions of sulphur and nitrogen oxides. The overall reduction for Europe is estimated at approximately 20%, with large differences between regions. The reduction in nitrogen emissions is reflected in the maps (Figure 2.3) showing the spatial distribution of total nitrogen deposition in 1980 and 2000. Ground-level ozone Ozone levels are generally highest in central and Southern Europe. This is not surprising in view of the fact that ozone is formed by photochemical reactions and thus closely linked to the regional weather condition, which also explains the large day-to-day, season-to-season and year-to-year variability in the concentration of ozone in ambient air. A reduction in peak ozone values during the 1990s is reported from several regions in Europe. This declining trend of the peak values is, to some extent, countered by a gradual rise in background ozone – stations in the north and west report increasing hemispheric background annual concentrations of 0.3–0.5 ppbv (parts per billion in volume). Particulate matter Particles in air are a growing concern in Europe, mainly because of the risk they pose for human health. Awareness on their transboundary nature led to their inclusion in the EMEP programme in 1999. Since then, measurements on PM10 (particulate matter with diameter <10 µm) have been reported to EMEP from an increasing number of sites. Particles are not only emitted directly to the atmosphere e.g. as combustion residues or by mechanical processes such as erosion, corrosion and materials abrasion (primary particles), they are also formed in the air via oxidation and reaction between gases (secondary particles). Available information from national studies indicate that there have been substantial reductions made in particle emissions. The sulphate, nitrate and ammonium part of the particle mass has so far not decreased in proportion to sulphur dioxide, nitrogen oxides and ammonia emission reductions. Heavy metals: lead, cadmium and mercury Emissions of lead, cadmium and mercury were all reduced in Europe during the period 1990–2000. Lead emissions have decreased by 60 to 70 % between 1990 and 2000 due primarily to the phase out of lead in petrol. Cadmium emissions decreased by 30–40% and anthropogenic mercury emissions were reduced by 50%. As a result, there were corresponding reductions in concentration of these metals in ambient air, and their deposition (Figure 2.4).

15
Figure 2.4. Trends of (a) lead, (b) cadmium, and (c) mercury emissions and deposition in Europe in the period 1990–2001 Persistent organic pollutants EMEP has gathered information on national emissions, on source-exposure relationships, transboundary fluxes and established trends for selected persistent organic pollutants. There are decreasing trends in emission as well as depositions and concentrations for various hexachlorobenzenes (HCBs), pentachlorophenols (PCBs), and polycyclic aromatic hydrocarbons (PAHs) from 1990 to 2000. Examples are shown in figures 2.5 and 2.6.
a) b)
c)

16
Figure 2.5. For benzo(a)pyrene (B(a)P) the (a) emissions and (b) deposition flux over land
Figure 2.6. Comparison of PCB emission dynamics (a) with concentrations in air and contents in soils (b), averaged over the EMEP grid. Calculations are with constant emission from 1995 2.2 Effects of air pollution on human health In 2003, WHO published a review that takes into account new evidence uncovered by the rapid progress in research on health effects of the most common air pollutants (particulate matter, ozone, nitrogen dioxide). Further evaluation of these pollutants was published by WHO in 2004. The WHO review concluded that there is a large body of evidence suggesting that exposure to air pollution, even at the levels commonly achieved nowadays in European countries, leads to adverse health effects. In particular, exposure to pollutants such as particulate matter (PM) and ozone has been found to be associated with increases in hospital admissions for cardiovascular and respiratory disease and mortality in many cities in Europe and other continents. WHO estimated that close to 100,000 deaths annually are associated with long
a) b)
a) b)

17
term exposure to air pollution (WHO 2002). Even if a fraction of these impacts is due to the long range transfer of the pollution, these impacts should be prevented. Particulate matter The term PM is equivalent to the term atmospheric aerosol and defines a suspension of air-borne solid particles and/or droplets of various sizes. Size and chemical composition are regarded as the most important characteristics of such particles. A single particle usually contains a mixture of chemical and physical (solid, liquid) constituents. The PM10 concentration is the mass per volume unit (µg/m3) of particles with an aerodynamic diameter smaller than 10 micrometer (µm). The larger particles contained in the PM10 size fraction reach the upper part of the lung. The smaller particles of this size fraction (in particular PM2.5 and PM1.0) penetrate more deeply into the lung and reach the alveolar region. PM is often differentiated by chemical constituents (e.g. sulphates, heavy metals, organics) as well as by source-related constituents (e.g. diesel soot) (EC 2004). Fine particles (commonly measured as PM2.5) are strongly associated with mortality and other endpoints such as hospitalisation for cardio-pulmonary disease. A smaller body of evidence suggests that coarse mass (particles between 2.5 and 10 µm) also has some effects on health. There is strong evidence to conclude that fine particles (<2.5 µm, PM2.5) are more hazardous than larger ones (coarse particles) in terms of mortality and cardiovascular and respiratory endpoints in panel studies. This does not imply that the coarse fraction of PM10 is innocuous. In toxicological and controlled human exposure studies, several physical, biological and chemical characteristics of particles have been found to elicit cardiopulmonary responses. Amongst the characteristics found to be contributing to toxicity in epidemiological and controlled exposure studies are metal content, presence of PAHs, other organic components and both small (<2.5 µm) and extremely small size (<0.1 µm). (WHO 2003a) Some data suggest that different components that contribute to PM2.5 mass may not be equally hazardous, however it is currently not possible to quantify the contributions of different PM components to health effects from exposure to ambient PM. (WHO 2004) Even at the lowest end of the observed PM2.5 concentration range, some – the most susceptible – subjects are at risk. Epidemiological studies on large populations have been unable to identify a threshold concentration below which ambient PM has no effect on health. The risk of mortality due to cardio-respiratory diseases and lung cancer increases linearly within the observed range of PM2.5 observed in the studied population (i.e. between 7 and 30 µg/m3 measured as an annual average). The Task Force on Health endorsed the decision to apply the relative risk for all causes of mortality estimated for the average exposure level in the extended American Cancer Society cohort study (Pope et al. 2002), i.e. the relative risk increases by 6 percent (the 95% confidence interval is 2–11 percent) for each 10 µg/m3 increase of PM2.5 concentration. In short-term studies, elderly subjects and subjects with pre-existing heart and lung disease were found to be more susceptible to effects of ambient PM on mortality and morbidity (illness).

18
In panel studies, asthmatics have also been shown to respond to ambient PM with more symptoms, larger lung function changes and with increased medication use than non-asthmatics. PM is also related to reduced lung growth in children. Only recently have investigators begun to separately address health effects of coarse particles (PM10–PM2.5). There is limited evidence that coarse particles are associated independently of PM2.5 with mortality in time series studies. A few studies have investigated the effect of long-term exposure to coarse particles on life expectancy without producing evidence of altered survival. There is evidence that coarse particles are independently associated with morbidity endpoints such as respiratory hospitalisations in time series studies. Considerations of particle dosimetry, chemistry and toxicology provide evidence of adverse health effects of coarse PM. Therefore, there is sufficient concern about the health effects of coarse particles to justify their control. (WHO 2004) Ozone Recent epidemiological studies have strengthened the evidence that there are short-term ozone (O3) effects on mortality and respiratory morbidity. There is new epidemiological evidence on long-term ozone effects suggesting that long-term O3 exposure reduces lung function growth in children. At levels currently observed in Europe, the evidence linking O3 exposure to asthma incidence and prevalence in children and adults is not consistent. There is little evidence for an independent long-term O3 effect on lung cancer or total mortality. In controlled human exposure studies, repeated daily, short term exposures of healthy and mildly asthmatic subjects to O3 attenuates the acute lung function and, to a lesser extent the inflammatory response, reaching a maximum over three to five days and with a recovery over four to seven days after the end of the exposure. Broncho-alveolar lavage demonstrate that mucosal damage and inflammation continue despite adaptation documented by lung function and clinical assessment The plausibility of chronic damage to the human lung from prolonged O3 exposure is supported by the results of a series of chronic animal exposure studies. They indicate persistent cellular and morphometric changes produced by long-term O3 exposures in the terminal bronchioles and proximal alveolar region and the functional changes consistent with a stiffening of the lung of the experimental animals. There is little evidence from short-term epidemiological studies to suggest a threshold ozone concentration at the population level. Long-term studies do not indicate a threshold either. From human controlled exposure studies, which generally do not include especially sensitive subjects, there is evidence for a threshold for lung damage and inflammation at about 60 to 80 ppb for short-term exposure (6.6 hours) with intermittent moderate exercise. Nitrogen dioxide In most urban locations where the epidemiological studies are conducted, the nitrogen oxides that yield NO2 are emitted primarily by motor vehicles. NO2 (and other nitrogen oxides) is a

19
precursor for a number of harmful secondary air pollutants, including nitric acid, fine particles and photo-oxidants (including ozone). Health risks from nitrogen oxides may potentially result from NO2 itself or its reaction products including ozone and secondary particles. Epidemiological studies of NO2 exposures from outdoor air are limited in being able to separate these effects. In recent epidemiological studies of the effects of combustion-related (mainly traffic generated) air pollution, NO2 has been associated with adverse health effects even when the annual average NO2 concentration is at or below 40 µg/m3, the current guideline value. There is evidence from toxicological studies that long-term exposure to NO2 at concentrations higher than current ambient concentrations has adverse effects. Uncertainty remains over the significance of NO2 as a pollutant with a direct impact on human health at current ambient air concentrations. However, the WHO working group recommended that the WHO annual specific guideline value of 40 µg/m3 should be retained or lowered (WHO 2004). Heavy metals
Cadmium In both the European Union and worldwide, approximately 85–90% of total airborne cadmium emissions arise from anthropogenic sources, mainly from smelting and refining of non-ferrous metals, fossil fuel combustion and municipal waste incineration. Food is the main source of cadmium exposure in the general population, which is responsible for about 99% of the total intake in non-smokers. Cigarette smoking can double the daily intake of cadmium. The annual contribution of long-range transboundary air pollution to the actual cadmium content in the topsoil may reach the contribution due to the use of phosphate fertilizers. Present data on the concentration of cadmium in the air and daily intake of cadmium with food suggest a decreasing trend of environmental exposure to cadmium. Nevertheless, though the yearly input fluxes of cadmium are small compared to the present stores, there is strong evidence that cadmium is still accumulating in soils and catchments under certain environmental conditions. Since relatively strong correlation exists between cadmium contents in soil and crops, in particular wheat, which takes large portion of human food in the UNECE geographical region, this bears the risk of future increasing exposure through food. Kidney and bone are the critical target organs following chronic environmental exposure to cadmium. The main critical effects include an increased excretion of low molecular weight proteins in urine as a result of proximal tubular cell damage, and increased risk of osteoporosis. An increased risk of lung cancer has also been reported following inhalation exposure in occupational settings. Present average concentrations of cadmium in the renal cortex in the general population in Europe at the age of 40–60 years are in the range 15–40 mg/kg. These values are only 4–12 times lower than the critical levels estimated in cadmium workers for the induction of tubular dysfunction (180 mg/kg) and very close to the critical level of 50 mg/kg estimated by a study in Belgium. Any further increase in the dietary intake of cadmium owing to an accumulation of the metal in agricultural soils will further narrow the gap to these critical levels. It is thus imperative to maintain a zero balance for cadmium in agricultural soils by controlling and restricting inputs from fertilizers (including sewage sludge) and atmospheric emissions. Since emissions from industry are currently decreasing,

20
attention must be focused on the emissions from waste incineration, which are likely to increase in the future (WHO 2000).
Lead Lead in the environment may derive both from natural and anthropogenic sources. Lead and its compounds may enter the environment at any point during the mining, smelting, processing, use, recycling or disposal. In the past, leaded petrol constituted the most important source of atmospheric lead in Europe and North America, and it still remains an important source of exposure in those countries where leaded gasoline is still used. Soil and dust are significant sources of exposure to lead, particularly for young children. Food uptake is the main pathway of exposure in the general population. The yearly addition of lead to the surface from atmospheric sources is small in comparison to the present pool of the metal in soils and catchments, but further accumulation occurs. However, there is no clear and significant relationship between lead in soils and food crops. While in areas around point sources of lead the lead levels in plants and food can be elevated, it can be concluded that the long-range transboundary air pollution has only minor influence on the exposure of the population to lead through food uptake. The likelihood of occurrence of the health effects is referred, both in adults and children, to the concentration of lead in blood (Pb-B). The geometric mean of Pb-B concentrations in adults is much lower than the Pb-B level associated with the most sensitive effects. Therefore, the present environmental exposure to lead could be considered as rather safe to adults. In adults, the critical systems include the haematopoietic and the peripheral nervous systems. In children, it is the central nervous system. The possible effects of lead on the central nervous system are likely to develop under specific conditions of exposure, such as living in close vicinity to point sources of emission, exposure to lead paint flakes or to lead-contaminated soil. Children constitute the critical population due to the possible effects of environmental lead exposure on the neuro-behavioural development. Based on current data on environmental exposure, including concentration values of 200 ppm (parts per million) of lead in soil and dust, the recently published model of the United States Environmental Protection Agency predicts a relatively small probability (1.5%) that exposed children will have blood lead levels in excess of 100 µg/l. It should be noted however, that the value of Pb-B 100 µg/l cannot be recognized as the threshold for the possible influence of lead on the cognitive functions. Present data on the concentration of lead in air, daily intake of lead with food and Pb-B suggest a decreasing trend of environmental lead exposure, in particular in the countries where lead has been eliminated from gasoline.
Mercury Mercury can be present in the air in several physico-chemical forms: elemental, particulate, gaseous oxidized inorganic and gaseous oxidized organic mercury. Mercury is deposited to the soil mainly as metal and inorganic salts; on arrival this is initially complexed by organic acids. Methylation and demethylation activity takes place, also causing some revolatilization of volatile forms of mercury (metallic and methylated). Long-range transboundary transport of anthropogenic mercury is a considerable contributor to mercury concentrations in the environment.

21
The critical organ after exposure to mercury vapours is the nervous system and the critical effects include hand tremor, and increased memory impairments. Effects on kidneys were also observed at low exposure levels in susceptible subjects. There is also a slight subjective and objective evidence of autonomic dysfunction. Mercury concentrations in atmospheric air (below 0.01µg/m3) an order of magnitude lower than the WHO Air Quality Guidelines of 1 µg/m3 as an annual average. It seems therefore that a direct risk from inhalation exposure can be neglected. However, present knowledge suggests that effects on the immune system at lower exposure levels cannot be excluded. The effects of methylmercury on the adult differ both quantitatively and qualitatively from the effects observed after prenatal or, possibly, postnatal exposure. The critical organ is the nervous system and the critical effects include developmental neurological abnormalities in infants, and paraesthesia in adults. The estimation of the risk of dietary exposure to mercury resulting from the deposition of mercury in the soil is at present difficult to quantify due to the not well understood, complex dynamics of mercury in soil and water and the factors that influence the biomagnification of methylmercury concentration in predatory fish. The mercury content in fish often exceeds 0.5 mg/kg fresh weight, which is the recommended limit in many countries. To prevent possible health effects in the future, WHO Air Quality Guidelines recommend keeping ambient air levels of mercury as low as possible. Persistent organic pollutants The Task Force on Health reviewed health risks of several persistent organic pollutants ,and identified those where long-range transport contributed significantly to exposure and health risks, at a process involving expert review of accumulated evidence and series of working group meetings, conducted between May 2000 and May 2002 (WHO 2003b). The risks associated with the following groups of substances were reviewed: pentachlorophenol (PCP), DDT, lindane (HCH), hexachlorobenzene (HCB), heptachlor, polychlorinated dibenzodioxins and dibenzofurans (PCDD/Fs), polychlorinated biphenyls (PCBs), polycyclic aromatic hydrocarbons (PAHs). The conclusions related to health hazard characterization and to the assessment of health implications relative to long-range transboundary air pollution of this group of pollutants were presented in Task Force on Health reports to Working Group on Effects and are summarized below. The Task Force on Health also performed a short hazard assessment for polychlorinated terphenyls (PCTs), polybrominated diphenylethers (PBDEs), polybrominated dibenzodioxins and furans (PBDD/Fs), short chain chlorinated paraffins (SCCPs) and ugilec, identifying main gaps of information necessary for risk assessment.
Pentachlorophenol (PCP) The health characterization of PCP indicates a potential for a number of human health effects associated with low-level chronic exposure via the oral route. Some of these effects have been seen as result of occupational exposure. It is also known that man-made PCPs introduced into the environment have the potential for long-range atmospheric transport and may reach human foodstuffs and drinking water. Nevertheless, further research is needed to assess the significance of long-range transboundary air pollution as a significant pathway leading to human exposure via the oral route.

22
Dichlorodiphenyltrichloroethane (DDT) Intake through the diet may approach or even exceed the provisional tolerable daily intake (0.01 mg/kg body weight), particularly in tropical and developing countries where DDT is still used for public health purposes (or even used illegally). In these countries, local use represents the main source of exposure. High levels of exposure also occur within the Convention geographical area. These include the Inuit populations of Arctic regions, where DDT has not been used for decades or has never been used. The main source of exposure in this case, and the consequent health implications, are mainly related to long-range transboundary air pollution.
Hexachlorocyclohexanes (HCH) Large reservoirs of HCH exist in the environment, which suggests that it potentially takes a long time for environmental levels to reflect any action taken. Health hazard characterization has identified a range of health effects related to exposure to γ-HCH by the oral route. Some might be relevant to observed environmental exposures. The oral route is the most relevant for sources of long-range transboundary air pollution. Taking into account the uncertainties of the information, and specifically the level of exposure at which human health can be affected, HCH may be considered a possible risk to health through the long-range transboundary air pollution.
Hexachlorobenzene (HCB) HCB is still released to the environment in the Convention region, mainly as a result of unintentional emission from waste incineration and as a by-product of various manufacturing processes. Health hazard characterization has identified a number of effects potentially related to low-level chronic exposure via the oral route. Food is the most relevant means of exposure related to sources of long-range transboundary air pollution.
Heptachlor It appears that the general population is not at risk from heptachlor derived from long-range transboundary air pollution, although highly exposed groups such as some breastfed infants and Inuit in the Arctic may be at risk. Long-range transport represents the most important source of heptachlor found in the terrestrial and aquatic food chains in remote regions, although the environmental concentrations in those regions are likely to be very low since contemporary use is limited.
Dioxins and dioxin-like polychlorinated biphenyls As human exposure levels often exceed the tolerable daily intake (1–4 pg TEQ/kg body weight), the weight of evidence suggests an increased risk of harmful health effects in the general population, especially for breastfed infants and populations with specific diets. Since the chemical and physical properties of PCDD/PCDFs and dioxin-like PCBs make them susceptible to long-range transboundary air pollution, it is expected to contribute significantly to exposure and health risks.
Polychlorinated biphenyls (PCB) As human PCB exposure, including both dioxin-like and non-dioxin-like congeners, may reach estimated lowest observed adverse effect levels for neurodevelopmental effect in infants (0.014–0.9 µg/kg body weight per day) for neurodevelopmental effects in infants, the weight of evidence suggests an increased health risk from current exposures. Lack of congener-specific exposure and toxicity data limits the possibilities for indicating which congeners are
23
responsible for the effects. Since the chemical and physical properties of PCBs make them susceptible to long-range transboundary air pollution, they are expected to contribute significantly to exposure and health risks, especially in remote areas.
Polycyclic aromatic hydrocarbons (PAH) The weight of evidence from epidemiological studies based on inhalation and occupational exposure to PAHs suggests an increased risk of harmful health effects, mainly lung cancer. The excess lifetime risk of lung cancer that can be attributed to long-range transboundary air pollution is low compared to the risk due to exposure from local sources. 2.3 Effects of air pollution on surface waters For surface waters, the ultimate goal of pollutant emission controls is biological recovery, or the return of sensitive species that have been eliminated during the course of acidification. Biological recovery will only occur when the water quality is sufficiently good to allow sensitive species to recover. This is one reason for the focus of the ICP Waters programme on chemical data. Another reason is that water chemistry data are so much more available than biological data. Biological data are nevertheless required because ecosystems may not return to an earlier stage, but will reflect the present physical, chemical and biological environment. Empirical trends in surface water chemistry Trends are reported for aggregations of ICP Waters sites because the strongest evidence that emissions control programs are having their intended effect would be from a consistent pattern of recovery (decreasing sulphate and increasing pH and alkalinity) across a large number of sites. For the trend analyses, the geographical regions (Figure 2.7) were defined according to a number of objectives, e.g. similar geology, soil characteristics, rate of deposition (Skjelkvåle et al. 2004). The most significant finding in the regional trend analysis is the almost universal decrease in sulphate concentrations in lakes and streams throughout Europe and North America (Figure 2.8) (Skjelkvåle et al. 2003, 2004). This result, based on 15 years of data from the ICP Waters programme, confirms the results of earlier analyses (Stoddard et al. 1999, Skjelkvåle et al. 2001). A trend of decreasing sulphate concentrations in surface waters has been commonly observed also at the sites of ICP Integrated Monitoring (Forsius et al. 2001, Moldan et al. 2001).
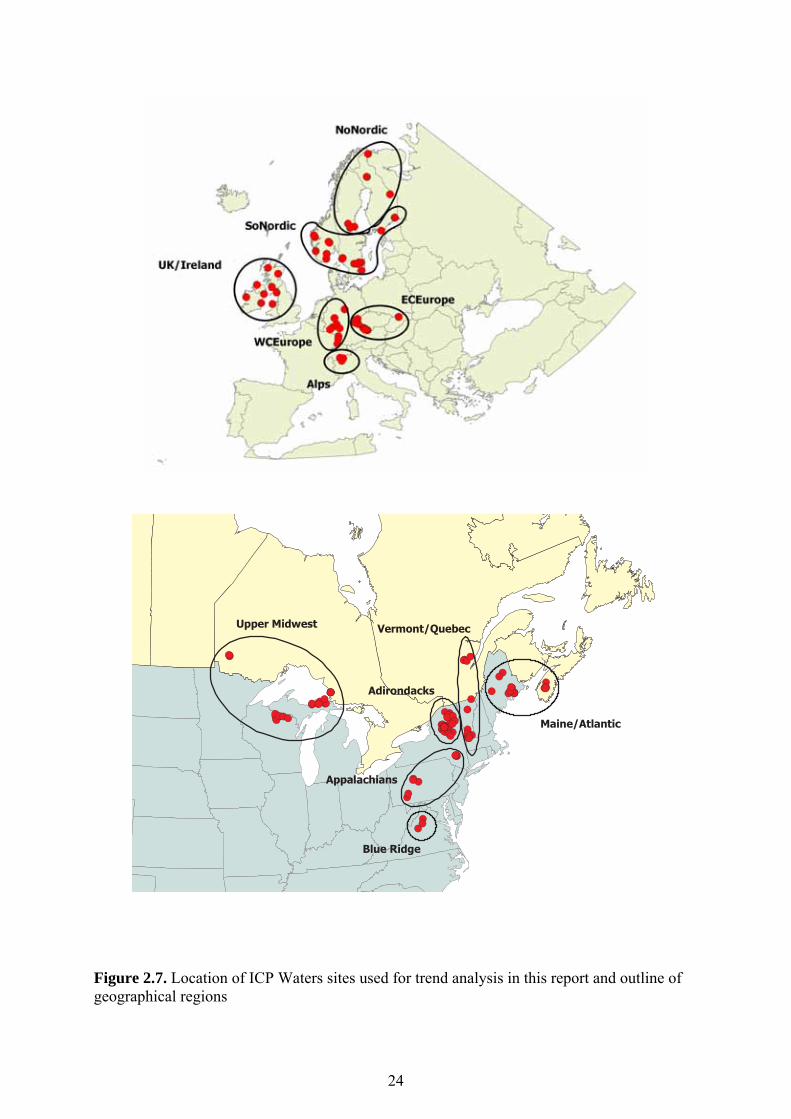
24
��������
������������������������������������������������������������������������������������������������
��
����
��
����������
��
����
����������
��
��
������������ ��������������������
����
����������
����
��
��
����
��������
��������
����������
������
����������
�� �����
��� ������ � � �������� � �
�����������
���� ���������
Figure 2.7. Location of ICP Waters sites used for trend analysis in this report and outline of geographical regions

25
Figure 2.8. Distributions of slopes for sulphate trends in ICP Waters regions in Europe and North America. Each box shows the 25th to 75th percentiles range of slopes; the median slope is indicated by the line in the box. The 10th and 90th percentiles, as well as the 5th and 95th percentiles (dots) are also shown. Abbreviated region names are: ECE = East-Central Europe; NoN = Northern Nordic; SoN = Southern Nordic; UK/I = United Kingdom and Ireland; WCE = West-Central Europe; Atl = Maine and Atlantic Canada; VT/Que = Vermont and Quebec; Adk = Adirondack Mountains; Apps = Appalachian Plateau; MidW = Upper Midwestern U.S. and Canada; BR = Virginia Blue Ridge Fewer than half of the ICP regions exhibited significant regional trend – i.e. either increasing or decreasing – in nitrate (Figure 2.9). Over the period from 1990 to 2001, ICP Waters sites have shown decreasing nitrate concentrations in the Adirondack Mountains, Appalachian Mountains and the Virginia Blue Ridge (all in North America), and increasing nitrate in the Alps. In all other regions, individual sites show either decreasing or increasing nitrate, with no clear regional pattern. These declines, however, need to be interpreted cautiously. The time period of data analysed is on the order of a decade. In contrast, long-term catchment’s responses to nitrogen deposition may occur on the time-scale of centuries, rather than decades.

26
Figure 2.9. Distributions of slopes for nitrate trends in ICP Waters regions in Europe and North America. Interpretation of box and whiskers, as well as regional abbreviations, are as in Figure 2.8 All of the ICP Waters regions show some tendency toward decreasing base cation concentrations (Ca+Mg). Base cation concentrations are important to the alkalinity and pH of the water. When, for example, rates of Ca+Mg decline are equal, or nearly equal, to rates of sulphate and nitrate decline, then chemical improvement (increasing alkalinity and pH) is impeded. In the European regions, rates of Ca+Mg decrease are moderate (often insignificant), and always smaller than those for sulphate. One important exception is the U.K. and Ireland, where rates of sulphate and Ca+Mg decline were nearly equal for the time period 1990–2001 – this has important implications for improvements in acidity in this region. Rates of Ca+Mg decline in North America tend to be larger than in Europe, and in some cases are in the same range as sulphate declines. Decreasing base cation trends in surface waters have been commonly observed also at the ICP Integrated Monitoring sites (Forsius et al. 2001, Moldan et al. 2001). Because sulphate is declining regionally in almost all regions covered by ICP Waters, and nitrate is either declining or unchanged in all but one region, there is a increase in the key indicators of recovery from acidification: Gran alkalinity (measured), charge-balance ANC (calculated) and pH (decline in H+). Gran alkalinity is a measured variable that indicates the water’s ability to buffer acidic inputs. ANC (acid neutralizing capacity) is calculated as an approximation for alkalinity. Charge-balance ANC is defined as the equivalent sum of base
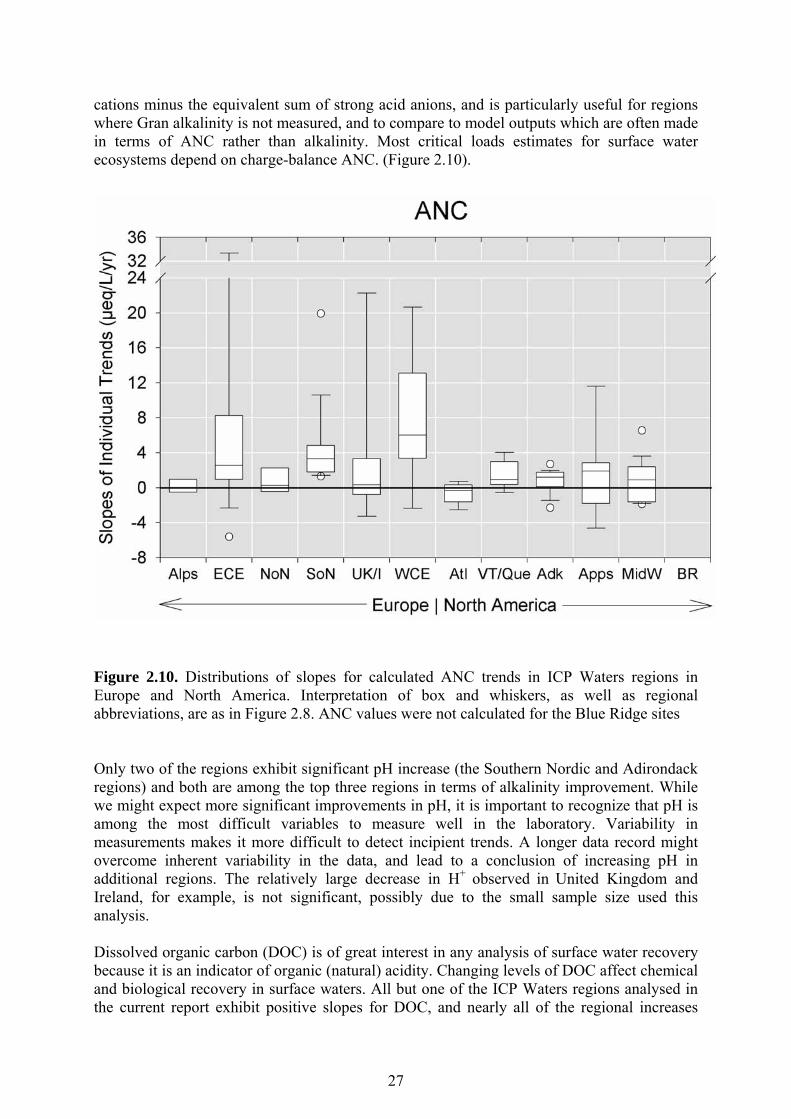
27
cations minus the equivalent sum of strong acid anions, and is particularly useful for regions where Gran alkalinity is not measured, and to compare to model outputs which are often made in terms of ANC rather than alkalinity. Most critical loads estimates for surface water ecosystems depend on charge-balance ANC. (Figure 2.10).
Figure 2.10. Distributions of slopes for calculated ANC trends in ICP Waters regions in Europe and North America. Interpretation of box and whiskers, as well as regional abbreviations, are as in Figure 2.8. ANC values were not calculated for the Blue Ridge sites Only two of the regions exhibit significant pH increase (the Southern Nordic and Adirondack regions) and both are among the top three regions in terms of alkalinity improvement. While we might expect more significant improvements in pH, it is important to recognize that pH is among the most difficult variables to measure well in the laboratory. Variability in measurements makes it more difficult to detect incipient trends. A longer data record might overcome inherent variability in the data, and lead to a conclusion of increasing pH in additional regions. The relatively large decrease in H+ observed in United Kingdom and Ireland, for example, is not significant, possibly due to the small sample size used this analysis. Dissolved organic carbon (DOC) is of great interest in any analysis of surface water recovery because it is an indicator of organic (natural) acidity. Changing levels of DOC affect chemical and biological recovery in surface waters. All but one of the ICP Waters regions analysed in the current report exhibit positive slopes for DOC, and nearly all of the regional increases

28
were significant. The previous report on trends in surface waters (Skjelkvåle et al. 2000) was one of the first to note the widespread increases in DOC now being observed throughout Europe and North America. These increases may be coupled to warmer climate, particularly to elevated summer temperatures – although the mechanism for observed changes is uncertain. It may in part also be related to declining acid deposition. The increase in DOC is a possible example of the confounding influence of climate change. Aquatic biological recovery from acidification Evidence of a biological response to reduced surface water acidification is so far, not uniform throughout the study area. Signs of recovery are observed for invertebrates in lakes and rivers in several European countries (Czech Republic, Germany, United Kingdom, Norway, Sweden), and in Canadian lakes formerly affected by a large local emission source. Meanwhile, at the most acidified central Europe sites, improvements in water quality have not yet reached a level where widespread effects on biology can be detected. Biological recovery will occur when the water quality is sufficient to allow sensitive species to recover. Reported improvements support such a sequential process, however ecosystems may not return to an earlier stage, but will reflect the present physical, chemical and biological environment. More data collected in an uniform way with large geographical coverage are strongly needed to explore this further. In Canada, SO2 emissions from nickel smelters at Sudbury, Ontario have been reduced by more than 90% over the last 30 years. With improving water quality, biological recovery has been observed in some lakes for several groups of organisms, including fish, zooplankton, phytoplankton and benthos (Gunn and Keller 1990, Keller et al. 1999). Such recovery is still at an early stage however. Studies of Sudbury lakes are beginning to yield an understanding of chemical and biological lake recovery processes at a time when evidence of aquatic recovery from acidification is only starting to emerge from other acid-affected areas of the North America and Europe. In the Czech Republic, the first signs of zooplankton recovery have been observed in some Bohemian Forest lakes (Kohout 2001, Vrba et al. 2003). In Norway, significant improvements in distribution and absence of acid sensitive invertebrate species have been reported (Raddum et al. 2004). Some formerly acidified watersheds have probably returned to levels where damage is now negligible. In the most acidified areas of Norway, significant improvements have been noted, especially during the 1990s. However, acidic episodes connected with sea-salt deposition and snowmelt confound the recovery process in poorly-buffered systems (Raddum et al. 2001, Raddum and Halvorsen 2002). In Sweden, recovery in invertebrates is occurring in both a highly acidified and a slightly acidified lake (Halvorsen et al. 2002, Raddum et al. 2004). However, there are no reports of widespread biotic recovery in Sweden. In the United Kingdom, evidence for biological recovery is limited, but largely consistent with observed chemical changes. New results from the United Kingdom Acid Monitoring Network (AWMN), however, show mounting evidence of a widespread biological response to declining water acidity in acidified lakes and streams. Epilithic diatoms, aquatic macroinvertebrates, mosses and higher plants show positive trends at many sites. A 100-year record of annual trout catch at Loch Riecawr in Scotland shows an apparent relationship to

29
acidification, with catches decreasing until 1970, and subsequently recovering back to levels observed in the 1930s (Harriman et al. 2001). In the English Lake District, invertebrate species diversity has significantly increased at four out of five investigated streams in response to reduced acidification, with acid-sensitive taxa recorded in 1999 that were absent during 1965–1972 (Tipping et al. 2002). In Germany, the absence of stabilised improvements in aquatic biota probably reflects the lack of chemical recovery. However, initial signs of recovery may be detectable in the re-occurrence of some single macro-invertebrates species that were formerly absent (Alewell et al. 2001, Raddum 2004). Concerns about nitrogen About half of the European ICP Waters sites – found predominantly in Central Europe – exhibit a high degree of nitrogen saturation in 1998. Nitrogen saturation enhances acidification of soils and surface waters. There is a clear connection between nitrogen deposition and stage of nitrogen saturation. Nitrogen deposition is below 10 kgN/ha/year (1 kgN corresponds to 71.4 eq, acid equivalents) in all sites at stages 0 and 1 (little or no saturation). In contrast, no site at stage 3 had deposition below 10 kgN/ha/year. The seasonal pattern of nitrate concentration in stream water provides a measure of the stage of nitrogen saturation, defined as follows:
At stage 0, nitrate concentrations are very low during most of the year and measurable concentrations may only be found during snowmelt or major hydrologic events;
At stage 1, this pattern is amplified and substantial nitrate may leave the
catchment during extreme hydrological events, resulting in peaks of episodically high nitrate concentrations;
At stage 2, the seasonal onset of nitrogen limitation is even further delayed and the period of nitrogen limitation during the growing season is much reduced. There is an increase in nitrate concentrations in base flow to levels as high as those found in deposition;
At stage 3, there is no coherent seasonal pattern in nitrate output.
The foreseen reductions in nitrogen deposition, expected as the result of the 1999 Gothenburg Protocol, will ease the risk of nitrogen saturation. Nevertheless, nitrogen will continue to accumulate in terrestrial ecosystems and thus increase the risk of saturation in the long term. Future changes in surface waters Predictions, by both state-state and dynamic models, indicate that surface water chemistry will continue to improve. Nitrogen and sulphur depositions measured in 1990 and those predicted in 2010, after implementation of the 1999 Gothenburg protocol, were compared to critical loads of acidity calculated for 72 ICP Waters sites, using site-specific information. The number of sites with exceedances is expected to be reduced from 51 in 1990 to 32 in 2010.

30
The results of the critical loads calculations and comparison confirmed that many ICP Waters sites are sensitive to acidification. More specifically, at 46% of the European sites, the critical load of acidity is less than 500 eq/ha/year and 68% of the sites have critical loads less than 1000 eq/ha/year. The corresponding figures for the North American sites are 40 and 75%, respectively. In some regions, surface waters turn out to be more sensitive to acidification than forest soils. Dynamic models can be used to predict the timescale of recovery from acidification. In the chain of events from the deposition of strong acids to the damage to key indicator organisms, there are two major factors that can give rise to time delays. Biogeochemical processes can delay the chemical response in the catchment soils and consequently surface waters, and biological processes can further delay the response of indicator organisms, such as damage to fish. Dynamic models have been developed to reconstruct the past and predict future geochemical trends with respect to acidification of aquatic and terrestrial ecosystems. Dynamic models that can predict lag-times in biological recovery, however, are not yet been developed. Once calibrated and tested with data from a specific catchment, a dynamic model can be used as a tool to look into the future. For example, this was done for the Birkenes catchment, which is among the most acidified sites in Norway. The model-predicted improvements following implementation of the 1999 Gothenburg Protocol were clearly greater than for the 1994 Sulphur Protocol (Jenkins et al. 2003). However, a deposition reduction beyond the current legislation scenario would be needed in order to reach a positive ANC, i.e. in order to get water quality sufficient for sustainable fish populations, and more than a decade would be required to achieve this (Larssen et al. 2002). 2.4 Effects of air pollution on forests Monitoring of deteriorating forest condition in Europe started two decades ago. Early studies of UNECE and Food and Agriculture Organization of the United Nations (FAO) revealed a wide spread of the new types of forest damage across total Europe (Scholz and Lorenz 1984). At that time, predictions of a large-scale forest decline by some scientists were taken up by the media and made the general public fear a catastrophic European-wide forest dieback due to air pollution ("Waldsterben"). However, more than two decades of reductions in pollution levels, forest damage research and 17 years of monitoring forest condition in Europe have led to a more differentiated view. Of the complex and synergistically acting causes a contributing role was ascribed to local air pollution (Schütt 1979). Wentzel (1980) tried to explain defoliation by means of direct impact of sulphur dioxide via the leaves and needles. Increasing evidence of impact of long-range transboundary air pollution, however, led to a range of scientific hypotheses on the effects of atmospheric deposition in forest ecosystems. Ulrich (1981) suggested indirect effects of acidifying air pollutants via the soil and subsequent root damage. Acidifying processes in the forest soil caused by the deposition of sulphur and nitrogen compounds are expected to lead to the release of toxic aluminium ions, which cause tree root damage, and of nutrient base cations. Similar to the direct damage, the indirect damage at the end leads to imbalances concerning nutrient supply of the trees. According to Manion (1981), air pollutants act besides climatic stress, site conditions and biotic agents as pre-disposing and accompanying factors. Chappelka and Freer-Smith (1995), Cronan and Griggal (1997) as well as Freer-Smith (1998) explain recent forest damage by means of synergistic effects of a range of natural and anthropogenic factors with air pollution playing a pre-disposing, accompanying

31
and locally even triggering role. Due to the loss of nutrients and the accumulation of nitrogen, changes in the species composition of the ground vegetation (UNECE&EC 2002) and high nitrate leaching into ground water are expected (Gundersen 2000). Defoliation Defoliation is used as a fast reacting indicator for numerous factors affecting tree vitality, e.g. tree age, weather extremes, biotic factors and air pollution. Assessment of trends in crown condition, since 1986, at some 6000 sample plots of the level I (large scale monitoring) programme by ICP Forests has revealed a clear overall increase in defoliation. After a transient recuperation in recent years, the deterioration now seems to be resuming (Figure 2.11). This overall trend shows high spatial and temporal variation. Comparatively high mean defoliation of Scots pine (Pinus sylvestris) was observed from 1997 to 2002 in Northern Sweden and Norway, the northwest of Estonia, Southern Poland and Belarus, Central Germany and the south of France (Figure 2.12.a). The development of defoliation (Figure 2.12.b) shows deterioration in Northern Spain and in Central Sweden while crown condition recuperated in Belarus, Romania, Southern Poland and parts of Germany and Norway during the period 1997 to 2002.
0
5
10
15
20
25
30
.
1990
1991
1992
1993
1994
1995
1996
1997
1998
1999
2000
2001
2002
2003
year
mea
n de
folia
tion
%
Scots pine Norway spruce
beech European and sessile oak
holm oak maritime pine
Figure 2.11. Development of mean defoliation of the six most frequent species

32
a) b)
Figure 2.12. Differences between medium-term mean defoliation of Scots pine and country specific model values (a) and linear time trends of mean defoliation over time of Scots pine (b). Interpolation is based on 1956 plots continuously assessed from 1997 to 2002 The spatial variability of defoliation is described by the plot specific mean defoliation values over the evaluation period, 1994 to 1999, the "medium-term mean defoliation". Mean defoliation values are statistically corrected for country-wise age effects using a regression model with age, country, and their interaction as predictor variables. The spatial variation of the medium-term mean defoliation of Scots pine and Common beech (Fagus sylvatica) was studied in relation to measured and modelled environmental factors by means of multiple regression analyses for the period from 1994 to 1999 (Table 2.1). Defoliation of Scots pine is significantly positively correlated with the deposition of sulphur (S), i.e. sulphur depositions increase defoliation. There are also indications that ammonium (NH4) increases and that nitrate (NO3) decreases defoliation of Scots pine, but these correlations are not statistically significant. Also not statistically significant are the correlations between the depositions and the defoliation of Common beech. Table 2.1. Relations between medium-term mean defoliation and time constant predictor variables as results of multiple regression analyses
predictor variables
deposition2)
medium-term mean defoliation
R2 No plots
precip. index1) insect fungi S NH4 NO3 age country
pine 61.3 1313 -0.007 +4.7 -4.9 +2.1 +1.1 -0.8 o o spatial variation
beech 41.1 399 -0.027 +4.0 +13.6 +0.2 -7.3 +9.0 o o
significant o country specific value
1) data source: Global Precipitation Climatology Centre (www.dwd.de/research/gpcc) 2) data source: EMEP acid deposition data in the 150 km x 150 km grid (www.emep.int)

33
The ambiguous results concerning ammonium and nitrate are consistent with current knowledge, as nitrogen inputs can fertilize forest ecosystems but also have acidifying effects. Influencing factors other than deposition show clear relationships to defoliation. Higher precipitation is related to lower defoliation. High insect infestations are related to high defoliation. Insect infestations, however, may have been a secondary damage fostered by primary causes. For instance, nitrogen depositions may have increased the concentrations of amino acids in the foliage, thus fostering leave-eating insects. Also, depositions may have caused a physiological weakening, thus predisposing trees to insect attack. Besides spatial variation, also the temporal variation over 6 years was studied with respect to the influencing factors. This yielded a significant positive correlation between the decrease in defoliation of Scots pine and the decrease in sulphur deposition. Needle and leaf chemistry Chemical analyses of tree needles and leaves give valuable insights into tree nutrition, which in turn reflects environmental changes. Since 1987, the elemental foliar composition on 36 Finnish and 71 Austrian level I (large scale monitoring) plots has been determined annually. During the last 15 years, the needle sulphur concentrations have been low in both Austria and Finland. Even at this low level, the proportion of trees in the medium and high sulphur concentration classes decreased, reflecting the reduction of sulphur emissions. In some remote areas in Finland the needle sulphur concentrations have dropped to a level normally found in pristine forests. In Austria, however, 7% of the sampled forests had concentrations above specific national thresholds. Nutrient imbalances Chronic excess input of nitrogen (N) to forest ecosystems causes nutrient imbalances, i.e. deficiencies of the macro-nutrients (K, P, Mg and Ca) relative to N in needles or leaves, which, in turn, increase the sensitivity of plants to climatic factors such as frost or drought, and susceptibility to parasite attacks. Field evidence suggests that approximately half of 109 forest plots providing all necessary calculation information and belonging to the total of 860 level II (intensive monitoring) sites of ICP Forests showed nutrient imbalances. Unbalanced nutrition hardly ever occurred on plots with deposition less than 10 kgN/ha/year (1 kgN corresponds to 71.4 eq) but quite frequently at deposition in excess of 20 kgN/ha/year (De Vries et al. 2002). Risks due to elevated deposition of sulphur and nitrogen Data from more than 230 sites at level II (intensive monitoring) of ICP Forests were used to assess the risk to forest health of elevated deposition of sulphur and nitrogen (UNECE&EC 2002). The results indicated that:
At 33% of the sites, acid deposition (1995–1999 average sulphur plus nitrogen deposition) is such that it increases the concentration of aluminium in soil solution to a level that is toxic to roots. Pine and spruce are clearly more sensitive to aluminium than oak or beech;

34
At 45% of the sites, nitrogen deposition is such that its concentration in the foliage is excessive, thus decreasing the tree’s tolerance to drought, frost, pest and disease;
At 58% of the sites, nitrogen deposition is sufficiently high to have an effect on
the plant diversity in ground vegetation;
At 92% of the sites, nitrogen deposition is such that nitrogen will continue to accumulate in the soils, thus moving the ecosystem toward nitrogen saturation in the long term.
Case studies of observed effects on forests Assessments of forest damage in relation to critical load exceedances have largely been complicated by extreme natural variation in growing conditions (Thomsen and Nelleman 1994). In a later study, the same authors (Nelleman and Thomsen 2001) analyzed radial increment data from tree cores from a total of 31,606 Picea abies plots in Southern Norway from 1954 to 1996. They compared changes in radial increment to varying deposition regimes and changes in critical load exceedances for the same period. They demonstrated a spatial and temporal co-variation between forest growth and both N deposition and acidification, as indicated by acid critical load exceedances. Increases in growth during the 1960–1970s, followed by a subsequent decline in the 1980–1990s, were best explained by combined actions of acidification, nitrogen deposition and climatic stress on forest growth. While forest conditions vary primarily with natural growing conditions, their results suggest that boreal forests are sensitive to moderate levels of nitrogen and sulphur deposition where acidity critical loads are low, and that effects may be observed over relatively short time scales. A Canadian study compared growth rates of forest stands, over a 20-year period, in areas with and without exceedances of critical loads of acidity (Ouimet 2001). It concluded that forest growth was significantly lower at hardwood and softwood stands where deposition exceeds the critical load than at sites where deposition is less than the critical load (Figure 2.13). Figure 2.13. Mean annual growth rate during a 20-yr period for hardwoods and conifers located within areas where critical loads for soil acidification are exceeded (red) or not (green) in Quebec, Canada (Ouimet et al. 2001). Data presented are means adjusted for plot initial volume and stand age. Error bars represent standard errors of the adjusted means. Numbers within columns refer to the number of plots measured in each group
Conifers
28
13
Hardwood
Gro
wth
1970
-90
(m3
ha-1
y-1 )
0
1
2
3
4
553
89
Non-exceeded areaExceeded area

35
In another study, a strong relationship was found between defoliation at more than 100 forest monitoring plots of the Canadian Forest Service’s Acid Rain National Early Warning System (ARNEWS) and exceedances of critical loads of acidity at the sites (Figure 2.14). The plots extended from the foothills of the Canadian Rockies in the west to the Atlantic coast in the east (Moayeri 2001). Figure 2.14. Relationship between field-estimated canopy transparency and exceedances of critical loads of acidity for Canadian Forest Service’s Acid Rain National Early Warning System (ARNEWS) forest plots and their location
20 - 30 (%)
10 - 20 (%)
0 - 10 (%)
30 - 40 (%)
Critical load exceedances (eq ha -1 yr-1)
Can
opy
tran
spar
ency
Y = 15.797 + .041 * X
r2 = 0.77
0
5
10
15
20
25
30
35
40
45
50
-600
-400
-200 0
200
400
600
800
(%)
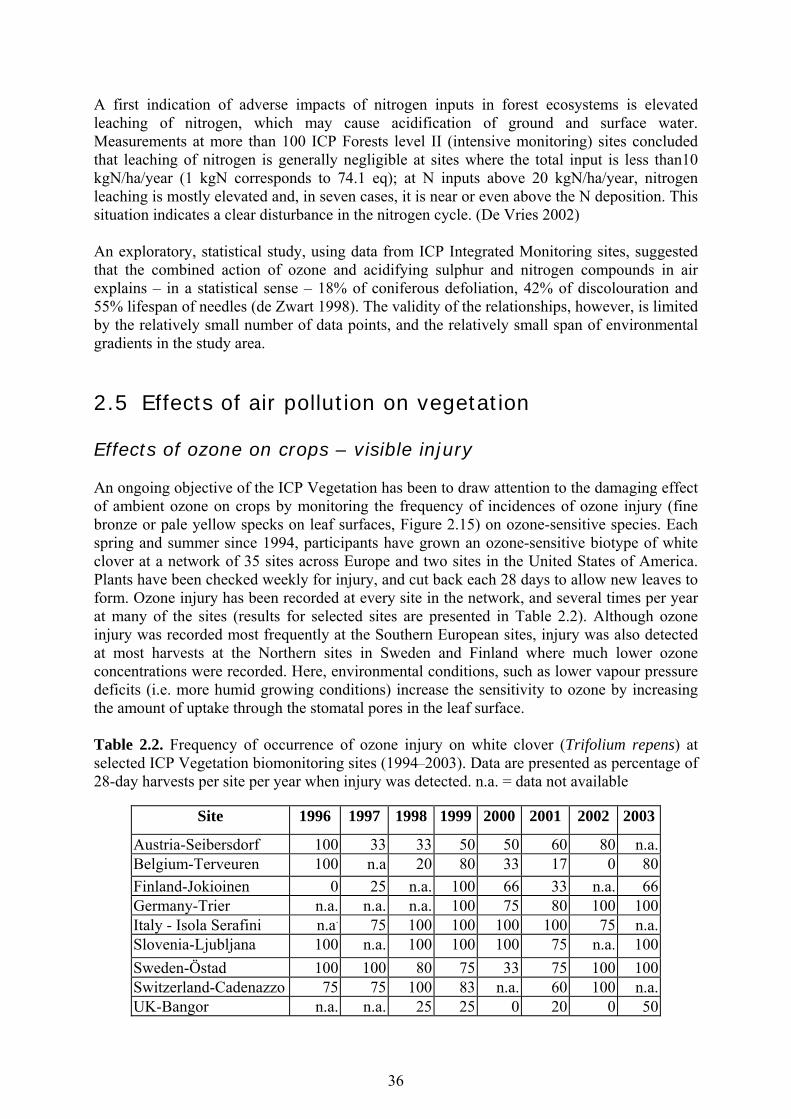
36
A first indication of adverse impacts of nitrogen inputs in forest ecosystems is elevated leaching of nitrogen, which may cause acidification of ground and surface water. Measurements at more than 100 ICP Forests level II (intensive monitoring) sites concluded that leaching of nitrogen is generally negligible at sites where the total input is less than10 kgN/ha/year (1 kgN corresponds to 74.1 eq); at N inputs above 20 kgN/ha/year, nitrogen leaching is mostly elevated and, in seven cases, it is near or even above the N deposition. This situation indicates a clear disturbance in the nitrogen cycle. (De Vries 2002) An exploratory, statistical study, using data from ICP Integrated Monitoring sites, suggested that the combined action of ozone and acidifying sulphur and nitrogen compounds in air explains – in a statistical sense – 18% of coniferous defoliation, 42% of discolouration and 55% lifespan of needles (de Zwart 1998). The validity of the relationships, however, is limited by the relatively small number of data points, and the relatively small span of environmental gradients in the study area. 2.5 Effects of air pollution on vegetation Effects of ozone on crops – visible injury An ongoing objective of the ICP Vegetation has been to draw attention to the damaging effect of ambient ozone on crops by monitoring the frequency of incidences of ozone injury (fine bronze or pale yellow specks on leaf surfaces, Figure 2.15) on ozone-sensitive species. Each spring and summer since 1994, participants have grown an ozone-sensitive biotype of white clover at a network of 35 sites across Europe and two sites in the United States of America. Plants have been checked weekly for injury, and cut back each 28 days to allow new leaves to form. Ozone injury has been recorded at every site in the network, and several times per year at many of the sites (results for selected sites are presented in Table 2.2). Although ozone injury was recorded most frequently at the Southern European sites, injury was also detected at most harvests at the Northern sites in Sweden and Finland where much lower ozone concentrations were recorded. Here, environmental conditions, such as lower vapour pressure deficits (i.e. more humid growing conditions) increase the sensitivity to ozone by increasing the amount of uptake through the stomatal pores in the leaf surface. Table 2.2. Frequency of occurrence of ozone injury on white clover (Trifolium repens) at selected ICP Vegetation biomonitoring sites (1994–2003). Data are presented as percentage of 28-day harvests per site per year when injury was detected. n.a. = data not available
Site 1996 1997 1998 1999 2000 2001 2002 2003
Austria-Seibersdorf 100 33 33 50 50 60 80 n.a.Belgium-Terveuren 100 n.a 20 80 33 17 0 80Finland-Jokioinen 0 25 n.a. 100 66 33 n.a. 66Germany-Trier n.a. n.a. n.a. 100 75 80 100 100Italy - Isola Serafini n.a. 75 100 100 100 100 75 n.a.Slovenia-Ljubljana 100 n.a. 100 100 100 75 n.a. 100Sweden-Östad 100 100 80 75 33 75 100 100Switzerland-Cadenazzo 75 75 100 83 n.a. 60 100 n.a. UK-Bangor n.a. n.a. 25 25 0 20 0 50

37
Figure 2.15. Visible ozone injury on leaves of white clover Some of the participants in the ICP Vegetation carried out systematic surveys of commercial crops for characteristic visible symptoms of ozone damage, on days following visible injury in the clover bioindicator system. Ozone injury was detected on the foliage of over 20 agricultural and horticultural crops, including on crops such as lettuce, chicory and spinach for which such foliar damage results in loss in commercial value (Table 2.3). Although ozone injury was mainly found in Mediterranean countries (Fumigalli et al. 2001), the cases in Table 2.3 also include injury reported from Belgium, France and Switzerland. These surveys also indicated the importance of adequate soil moisture in determining the magnitude of ozone injury. For example, Figure 2.16 illustrates a chicory crop growing in Greece that was severely injured by ozone when irrigated, but uninjured where irrigation was not in use. The documentation of the extent of visible injury due to ozone, both in field surveys and in the bioindicator studies, provides important evidence for the significance of ozone as a phytotoxic pollutant across Europe.

38
Figure 2.16. The chicory crop was severely damaged by ozone on the top portion of the photograph of this field near Athens, Greece, where irrigation is in use, but undamaged in the un-irrigated part (bottom of the photograph) of the field Table 2.3. Commercial agricultural and horticultural crops injured by ambient ozone episodes Agricultural crops Horticultural crops Bean Phaseolus vulgaris Courgette Cucurbita pepo Clover Trifolium repens Chicory Cichorium endivia Corn Zea mays Lettuce Lactuca sativa Grape-vine Vitis vinifera Muskmelon Cucumis melo Peanut Arachis hypogea Onion Allium cepa Potato Solanum tuberosum Parsley Petroselinum sativum Soybean Glycine maxima Peach Prunus persica Tobacco Nicotiana tabacum Pepper Capiscum anuum
Radish Raphanus sativus Wheat Triticum aestivum Triticum durum Red beetroot Beta vulgaris
Spinach Spinacea oleracea Tomato Lycopersicon esculentum Watermelon Citrullus lanatus Effects of ozone on crops – reduced biomass At many of the ICP Vegetation biomonitoring sites, participants have also detected a reduction in the biomass of a sensitive biotype (NC-S) of white clover, relative to that of a resistant biotype (NC-R) (Mills et al. 2000). When the data from the 1996–2002 experiments were combined to make a response function (goodness-of-fit R2=0.58), there was a 5%

39
reduction in the biomass ratio for each 2 ppm.h (parts per million times hours) increase in three month AOT40 (accumulated over a threshold of 40 ppb (parts per billion), Figure 2.17).
y = -0.023x + 1.05R2 = 0.58
0.0
0.2
0.4
0.6
0.8
1.0
1.2
1.4
0 5 10 15 20 25
AOT40 (ppm h)
NC
-S/N
C-R
bio
mas
s ra
tio
Figure 2.17. Response of the biomass ratio of sensitive biotype (NC-S) of white clover to that of a resistant biotype (NC-R) to AOT40 (accumulated ozone exposure over the threshold 40 part per million). A decreasing ratio shows an increasing effect of ambient ozone on the biomass of sensitive biotype of white clover Recent efforts have focussed on establishing relationships between stomatal ozone flux, i.e. the amount of ozone that enters the plant through the stomatal pores, and effects for white clover based on the results of the ICP Vegetation experiments (Mills et al. 2003). Initial analysis has indicated an improved fit compared to AOT40-based relationships. No trends in incidences of injury or biomass change have been detected, reflecting the large year-to-year variation in ozone pollution. An impact pathway approach was used by the ICP Vegetation to quantify the potential effects of ozone on crop yield in Europe in 2010 relative to 1990 (Mills et al. 2003, UNECE 2002). Ozone data were taken from EMEP ozone model results in the 150 km x 150 km grid over Europe and transformed into AOT40 data for four periods of the year, reflecting the growing seasons in different parts of Europe (Northern Europe, Mediterranean, Central and Eastern Europe and North and North-Western Europe). Units of yield change per ppm.h were calculated for 23 agricultural and horticultural crops using functions derived from published data on yield quantity responses to ozone. Taking into account the uncertainties associated with the study (see Mills et al. 2003 for details), the study showed that impacts of ozone on crop yield were predicted to be cut by 30% in 2010 relative to 1990, assuming full compliance with the 1999 Gothenburg Protocol. The highest losses in crop production for 1990, the reference year, were predicted for France, Germany and Italy and of the 23 crops studied, the highest economic losses were associated with wheat (33% of total), potato (21%), sugar beet (10%), pulses (6%), grape (6%) and maize (6%).
40
The study is continuing using the newly derived relationships between stomatal ozone flux and effects for wheat and potato yield that are included in the latest version of the Mapping Manual (Mapping Manual 2004). This will overcome some of the uncertainties associated with fluctuations in climatic and phenological influences on ozone uptake throughout the growth cycle of these two crops. The new study will also apply ozone on a 50 km x 50km grid. Effects of ozone on semi-natural vegetation In 2001 and 2002, the ICP Vegetation conducted a series of pilot studies with species of semi-natural vegetation, with the intention of developing a biomonitoring system similar to that described above for white clover (Buse et al. 2003a). The most promising results have been from exposure of ozone-sensitive and-resistant biotypes of brown knapweed (Centaurea jacea) at 13 sites. Methods of propagating clonal material by tissue culture are being investigated, allowing standard plant material to be distributed to each site in future years. Critical levels for exposure of vegetation to ozone For crops and forest trees, the goal was to develop indices that provide a more biologically realistic representation of the exposure of plants to ozone than the AOT40. The answer was a flux-based exposure index. Whereas AOT40 is based on the ozone concentration in the air at the top of the plant canopy, ozone flux calculations take into account the influence of climatic, pollutant and plant factors on the amount of ozone that enters the plant through the stomatal pores and reaches the sites of action inside the leaf. For example, for a given ozone concentration, ozone uptake in dry air can be less than half that for the same plants exposed to ozone on a humid day. This is because plants naturally reduce the aperture of their stomatal pores in dry air to prevent water vapour loss in potentially desiccating climatic conditions. As a consequence, stomatal uptake or flux of ozone into the plant is also substantially reduced under such conditions compared to the uptake on humid days when the stomatal pores are wide open. Thus, cumulative ozone indices that are flux-based better describe the exposure of plants to ozone than those that are based on the concentration only. The scientific basis of ozone flux modelling methods has been scrutinised and peer-reviewed at several meetings during 2002, 2003 and 2004, and it has been agreed that the scientific work is now sufficiently advanced for the inclusion of flux-based critical levels along with concentration-based critical levels in the new version of the Mapping Manual (www.oekodata.com/icpmapping/html/manual.html). Thus, the Mapping Manual now contains separate flux-based critical levels for wheat, potato and provisionally for forest trees represented by beech and birch. The AOT40-based critical levels have also been reviewed, and in some case changed to keep up with developments in the science of ozone impacts. More information has been provided to define the critical level for agricultural crops, including the use of different time periods for different climatic zones within Europe, and a new critical level for horticultural crops has been added to the Mapping Manual. The critical level for semi-natural vegetation is now considered sufficient to protect the most sensitive annual and short-lived perennial species when grown in a competitive environment; default timing periods and advice for mapping impacts are provided in the Manual. Based on new analysis of published data it was also possible to include a lower AOT40-based ozone critical level for forest trees than was included in the previous version of the Mapping Manual. Additional AOT30-based critical

41
levels of ozone have also been included for agricultural crops and forest trees for use on a European scale by integrated assessment modellers, if this reduces uncertainty in the overall integrated assessment model. A third method is used to describe ozone exposure over the eight days prior to the development of ozone injury and to define the short-term critical level. This method recognises the importance of humidity (vapour pressure deficit) in determining the flux of ozone into the plant and uses a humidity-based function to modify ozone concentration prior to the calculation of AOT30. This exposure index is based on the flux approach, but has been simplified to allow its application by non-specialists. Heavy metals in mosses and white clover
Heavy metal concentration in mosses Following studies in a few country in the mid 1970s, the heavy metals in mosses survey was established in 1980 as a joint Danish-Swedish initiative and has, since then, been repeated at five-yearly intervals with an increasing number of countries and individuals participating. Twenty-eight European countries, almost 7000 sites and about one hundred individuals have been involved in the most recent survey in 2000/2001 (UNECE 2003). The coordination of the most recent survey was handed over from the Nordic Working Group on Monitoring and Data, Nordic Council of Ministers, to ICP Vegetation (Buse et al. 2003b). The survey provides data on concentrations of ten heavy metals (arsenic, cadmium, chromium, copper, iron, lead, mercury, nickel, vanadium, zinc) in naturally growing mosses throughout Europe. The technique of moss analysis provides a surrogate, time-integrated measure of the spatial patterns of heavy metal deposition from the atmosphere to terrestrial systems, and is easier and cheaper than conventional precipitation analysis. The density of the network is much higher than ever can be achieved with monitoring stations of atmospheric deposition. The aims of the survey are to determine patterns of variation in the heavy metal concentration of mosses across Europe, identify the main polluted areas, produce regional maps and further develop the understanding of long-range transboundary pollution. ICP Vegetation used two approaches to mapping (Buse et al. 2003a). Firstly, "dot maps" to indicate the concentration of each heavy metal at individual sampling sites. Secondly, maps which show the mean concentration of each metal within individual grid squares (in the 50 km x 50 km EMEP grid cell map). Examples of the maps for cadmium, lead and mercury are shown in Figure 2.18. There was an east/west decrease in heavy metal concentrations in mosses, related in particular to industrial emissions. Former industrial sites and historic mines accounted for the location of some high concentrations in areas without contemporary industries. Long-range transboundary transport appears to account for elevated concentrations of heavy metals in areas without local emission sources, such as lead in Southern Scandinavia. A preliminary comparison of the 1995 and 2000/2001 survey, using identical sampling sites, indicates a general decline in the concentrations of arsenic, cadmium, lead and vanadium in mosses.
Heavy metals in white clover The heavy metal concentrations of white clover plants was determined from 18 sites in the 1998, 2000 and 2002 ICP Vegetation ozone experiments, to assess heavy metal deposition for lead, cadmium, copper and arsenic (UNECE 2000). Concerns over the contribution from root

42
Figure 2.18. The mean of heavy metal concentration measured in moss samples at sites within the EMEP 50 km x 50 km grid cell for (a) cadmium, (b) lead and (c) mercury
a)
b) c)

43
uptake were largely unsubstantiated for arsenic and lead because these elements are not readily taken up by the plant and there was no relationship between their content in soil and forage. However, the soil type and acidity were important for the uptake of copper and to a lesser extent for cadmium. Clover from the more remote sites had relatively low concentrations of heavy metals, suggesting a low potential deposition from long-range transport. Central European sites, even those that are in predominantly rural locations, had mid-range heavy metal concentrations, most likely resulting from long-range transport. The heavy metal concentrations were highest in (semi-)urban areas. White clover is a good bioaccumulator of heavy metals and it is possible to estimate lead deposition at a site from its concentration in clover (Buse et al. 2003a). 2.6 Integrated monitoring of ecosystems The ICP Integrated Monitoring network has been set up to understand the dynamics and processes of ecosystem changes, and thus to determine the causes of the changes. It also provides key inputs for the development, testing and calibration of dynamic models. Due to the extensive protocols for data collection, only a limited number of such sites have been established; there are approximately 50 sites in the ICP Integrated Monitoring network. In conjunction with the more regionally extensive ICPs, the Working Group on Effects can thus provide an integrated hierarchical structure for evaluation the impacts of air pollutants on the European scale. Piecemeal, intermittent and short-term monitoring does not provide the information on temporal variations required to distinguish natural from anthropogenically-induced effects. Acidification studies Input-output budget studies carried out at intensively studied sites inform about possible accumulation or release of sulphur, nitrogen, base cations and aluminium in the ecosystem. So-called proton (hydrogen ion) mass budgets can be calculated to evaluate the importance of various biogeochemical processes that regulate the acid production and buffering in both the terrestrial and aquatic portions of the ecosystems (Figure 2.19).
Figure 2.19. Proton budget for the Finnish ICP Integrated Monitoring site Hietajärvi (Forsius et al. 1995). The mean annual production (+) and consumption (-) of H+ is shown. H+
dep = deposition of H+; CO2 = dissociation of CO2; Org. acids = dissociation of naturally occurring organic acids; BCupt = base cation uptake by forests; H+
out = output flux of H+; BCwea = base cation exchange and weathering reactions; SO4 ret = retention of SO4; NO3/NH4 = nitrogen transformations
+ -
70
60
50
40
30
20
10
0
+
-H
-flux
meq
m
a-2
-1+
Org. acidsBC upt
NO /NH3 4
CO 2
H dep+
outH +
weaBCSO ret4

44
Input-output and proton budget calculations for 21 ICP Integrated Monitoring sites in Europe indicate that the soils are recovering from the high sulphur inputs in the past (Forsius et al. 2004). ICP Integrated Monitoring documented a net release of sulphate (and associated production of acidity) at most sites and this is consistent with observations from other recent European budget studies (De Vries et al. 2001, Prechtel et al. 2001). They also indicate increased risks of acidification problems at higher N deposition levels. A clear relationship was observed between the deposition inputs and the H+ production from N transformations in the ecosystems, with higher H+ production at higher deposition levels (Forsius et al. 2004). Decreasing sulphate and base cation concentration trends in surface waters have been commonly observed also at the ICP Integrated Monitoring sites (Forsius et al. 2001, Moldan et al. 2001) Several different ecosystem processes can influence the acidification recovery patterns in ecosystems. Data from intensively studied sites, such as those of ICP Integrated Monitoring and ICP Forests – as well as experimental research sites – have been used to assess the importance of such processes. Main confounding factors include:
Desorption of sulphate and mineralization of organically bound S from catchment soils. At a few ICP Integrated Monitoring sites in central Europe, the retained amounts of S in the soil seemed to regulate the sulphur dynamics in the system (Vuorenmaa et al. 2002, Moldan et al. 2001, Prechtel et al. 2001). Similarly, Alewell et al. (2001) detected no major acidification reversal regarding freshwater acidification in low mountain ranges of Germany.
Base cation processes. The general reduction in surface water acid anion
concentrations (mainly sulphate) has led to increases in acid neutralizing capacity, but has also been offset partly by decreases in base cations (Stoddard et al. 1999, Evans et al. 2001, Forsius et al. 2001). Longer term surface water recovery must involve an increase in soil base saturation in the catchment (Likens et al. 1996, Evans et al. 2001). If present or future acid deposition continues to outstrip base cation supply, soil base saturation may continue to fall at some sites (Likens et al. 1996, Evans et al. 2001).
Effects of climate change and the future behaviour of nitrogen in the ecosystem.
Four major climate-related confounding factors that may influence the chemical and biological recovery process are increased frequency and severity of sea-salt episodes; increased frequency and severity of drought and increased rainfall; increased turnover of organic carbon; increased mineralization of nitrogen.
Development and testing of dynamic models Long-term observations of input and output chemistry at intensively monitored catchments provide an important test of the performance of dynamic models. Furthermore, the detailed soil physical and chemical data available for these sites provide for a "best" assessment of model parameters (for example compared to survey data). This makes these model applications as representative as can be expected (Jenkins et al. 2003).

45
Three well-known biogeochemical models (MAGIC, SAFE, SMART) have been calibrated using site data and run using different emission/deposition scenarios. The three models yielded generally consistent results. The similarity of the predictions gives confidence in the use of such models for scenario assessment and other policy-oriented work (Forsius et al. 1998a). Consistent results were also obtained when calculating the critical load for acidity using the steady-state water chemistry method (used for mapping critical loads for surface waters) and the dynamic MAGIC model (Jenkins et al. 2003). The model simulations indicate that recovery of soil and water quality of the ecosystems is determined by both the amount and the time of implementation of emission reductions. The net effect of extending the target year for emission reductions may cause a delay in the ecosystem recovery in the shorter term (<30 years). For the long-term response (>30 years), the magnitude of emission reductions is more important than its timing (Forsius et al. 1998b). At all modelled (MAGIC model) sites (n=6), the improvements in chemistry predicted under the current legislation scenario (1999 Gothenburg Protocol) were clearly greater than for the 1994 Sulphur Protocol providing quantification of the benefits of the stricter emission controls (Jenkins et al. 2003). Model development is still needed regarding several key processes, particularly N dynamics, and relations to climate change. Nitrogen-related effects For many decades, large regions of North America and Europe have received elevated deposition of nitrogen compounds. Nitrogen is usually the growth-limiting nutrient in forest and semi-natural terrestrial ecosystems. Chronic excess nitrogen deposition, however, can lead to "nitrogen saturation" manifest by increased leaching of inorganic nitrogen (generally nitrate). Increased leaching of nitrate enhances acidification of soils and surface waters and the risk of eutrophication of coastal marine areas. In addition, ground water quality may be affected, creating problems for e.g. drinking water use. The reactions of forest ecosystems to nitrogen deposition seem to depend on the particular site and ecosystem conditions (Gundersen 2000). ICP Integrated Monitoring sites improve our understanding of the nitrogen cycle and predictions of long-term effects of chronic excess nitrogen deposition. The ICP Waters sites show a clear relationship between nitrogen deposition in the surrounding terrestrial catchment areas and nitrate concentration in surface water. There are very low levels of nitrate concentration in surface water at sites where nitrogen deposition is below 10 kgN/ha/year (1 kgN corresponds to 71.4 eq), varied concentrations at intermediate deposition, and significant levels at deposition greater than 25 kgN/ha/year. ICP Integrated Monitoring data confirm that low leaching of dissolved inorganic nitrogen generally occurs at deposition levels below about 8–10 kgN/ha/year, and that this value can thus be used as an indicative empirical critical deposition threshold for forested ecosystems (Forsius et al. 2001, MacDonald et al. 2002). Input-output budgets calculations at ICP Integrated Monitoring forested sites, combined with data from other experiments (NITREX and EXMAN), indicate that the risk of nitrate leaching can be predicted, with a reasonable statistical significance, by a combination of key ecosystem variables like N deposition, N concentration in soil organic matter and current year needles, and N flux in litterfall (Anonymous 1995). Another useful indicator for evaluating the risk of nitrogen leaching is the carbon-nitrogen (C/N) ratio in the organic horizon in the soil. In a large European dataset of forested sites

46
(including the ICP Integrated Monitoring sites), where C/N ratios are ≤25 (i.e. when there is little carbon sequestered in the soil relative to the concentration of nitrogen), the risk of nitrate leaching is substantially higher than at sites with a C/N ratio >25, depending on the amount of N deposited (MacDonald et al. 2002). Heavy metals in forested and aquatic ecosystems The ecotoxicological risks associated with elevated heavy metal concentrations in terrestrial ecosystems include (see De Vries et al. 2002):
Reduced microbial biomass and/or species diversity of soil micro-organisms and macrofungi, affecting microbial processes.
Reduced abundance, diversity and biomass of soil fauna, especially invertebrates
such as nematodes and earthworms.
Reduced development and growth of roots and shoots (toxicity symptoms)
decreased nutrient concentrations in foliar tissues (physiological symptoms) and decreased enzymatic activity (biochemical symptoms) of vascular plants including trees.
Heavy metal accumulation followed by possible effects to essential organs on
terrestrial fauna, such as birds, mammals, or cattle in agricultural soils. Those effects are important for cadmium (Cd), copper (Cu), mercury (Hg) and to a lesser extend lead (Pb), which can accumulate in the food chain.
Concern about the atmospheric input of heavy metals (specifically Cd and Pb) to forest ecosystems is mainly related to the impact on soil organisms and the occurrence of bioaccumulation in the organic layer. Another concern is related to the leaching of metals (specifically Cd and Hg) to surface water having an adverse impact on aquatic organisms and causing bioaccumulation in fish, thus violating food quality criteria. In forests, most adverse impacts are to be expected from Pb and Cd, whereas Hg is of primary concern in aquatic systems. The aim of the work on heavy metals at ICP Integrated Monitoring sites is to improve process understanding, collect information for derivation of critical loads and levels, and provide data for model development and applications. This work concerns both pools and fluxes of different heavy metals (e.g. Aastrup et al. 1995 and Ukonmaanaho et al. 2001), work on mercury processes (e.g. Munthe et al. 1998), and experimental studies in soils (Bringmark et al. 1998). Heavy metals are accumulating in soils at several ICP Integrated Monitoring sites, and increased concentrations could, in the long term, mean toxicological risks for terrestrial and aquatic biota. In spite of significant uncertainties in the data, input/output budgets at the sites revealed considerable retention of heavy metals in the catchments often reaching 80–95% of the input amounts. The accumulation was especially pronounced in humus layers and in the downslope moist and wet parts of the catchments (Bringmark et al. 2001). A very large European survey of forest soils showed that cadmium was retained in upper layers of most sites (Rademacher 2001). Acid soils of Northern coniferous forests were losing cadmium in

47
large areas. In contrast, retention of cadmium was associated with calcareous soils with high pH (Bergkvist 2001). Biological effects were observed in South Swedish moor layers due to concentrations of lead and perhaps also mercury (Bringmark et al. 1998). In 5–25% of European forest sites, the metal concentrations could be sufficiently high for probable biological effects (Rademacher 2001). Use of ecosystem data for the evaluation of climate change impacts Long-term and broad-scale research, monitoring and assessment are necessary for understanding environmental phenomena. The data collected at intensive sites such as those of the ICP Integrated Monitoring are useful also in relation to other environmental problems than air pollution, such as climate/global change and changes in biodiversity (Manual for Integrated Monitoring 1998). Data collected at ICP Integrated Monitoring sites have already been used in global change research framework for calculations of e.g. current carbon and nitrogen pools and fluxes in Finnish forest ecosystems (Ilvesniemi et al. 2002), and modelling of climate change impacts on carbon leaching fluxes (Holmberg et al. 2004) (see figure 2.20). Figure 2.20. Modelled change of total organic carbon (TOC) leaching under two climate change scenarios at the ICP Integrated Monitoring site Hietajärvi, Finland 2.7 Effects of air pollution on materials The "International Co-operative Programme on Effects on Materials, Including Historic and Cultural Monuments" was initiated in 1985. The exposure of materials is performed in an international network of test sites covering a wide geographical zone located in countries that are Signatories of the Convention. Two types of exposures are performed, long-term exposures for evaluation of dose/response functions and repeated one-year exposures for evaluation of trend effects. The evaluation of dose/response relationships and trend effects is performed by statistical analysis of data on corrosion of materials and measurements of the environment. Materials have been selected that are representative both for technical materials and materials used in objects of cultural heritage. A wide range of materials is exposed including metallic materials, stone materials, paint coatings, electric contact materials, glass
0
40
80
120
01 04 07 10
Month
TOC
(g/h
a/da
y)
present
small change 1990 - 2055
large change 1990 - 2055

48
materials and polymeric materials. The evaluation of corrosion effects on materials is performed at dedicated sub-centres, each responsible for a material, or group of materials, and for performing all corrosion analyses of this material regardless of where it was exposed. The original 8-year exposure covered the period 1987–1995 and the 4-year multi-pollutant exposure was performed in the period 1997–2001. Trends in corrosion damage Sulphur dioxide has, in the past, been the dominating parameter causing degradation to materials and objects of cultural heritage. During the original 8-year exposure programme, from 1987 to 1995, there was a substantial decrease in the concentration of SO2 in ambient air, a slighter decrease for NO2 while no significant change was observed for ozone (Figure 2.21). During that period, the decrease in corrosion rates for many materials were in the order of 30–70%. This was primarily as a result of the decrease in SO2 concentrations while the effect of decreasing H+ is much smaller.
0
5
10
15
20
25
30
35
40
45
1987 1988 1989 1990 1991 1992 1993 1994 1995
Year
Co
nce
ntr
atio
n /
µg m
-3
O3
NO2
SO2
Figure 2.21. Mean of yearly concentrations of SO2, NO2 and O3 at 39 test sites in the original ICP Materials exposure programme in the period 1987–1995 A comparison of the one-year exposure from the multi-pollutant exposure programme with the one-year exposure from the original programme shows the changes in pollution and corrosion between 1987/1988 and 1997/1998 (Figure 2.22). The reduction for SO2 is almost 70%, for NO2 about 30%, for acidity of precipitation about 40%, while ozone concentration shows no real change. The average reduction in corrosion loss for most materials is between 30% and 50% for the 10-year period. The highest decrease is for zinc (70%) and the lowest for copper (30%). The small decrease for copper may be due to the importance of ozone on the corrosion process, which is unique for copper.

49
0%10%20%30%40%50%60%70%80%90%
100%
Zinc
Carbon st
eel
Paint o
n stee
l
Limes
tone
Bronze
CopperSO2 H+
NO2 O3
unshelteredsheltered
Figure 2.22. The 1997/1987 relation between first year corrosion loss of materials and pollutant concentrations as averages in the original network (1987) and corresponding sites in the multi-pollutant network (1997) of ICP Materials The decreasing corrosion trends have been steady for a long period but recent data show a break in the trend for more and more sites. For carbon steel, for example, at least half of the sites had reached a constant corrosion rate by 2001, with no evident further decrease. This can be illustrated by a comparison of the situation in Prague – where the decreasing SO2 levels from very high initial concentrations are still ongoing and corrosion is decreasing – with Stockholm where the decreasing SO2 from already very low levels in the beginning of the 1990s no more affect the corrosion rate. To investigate this break in the trend, ICP Materials launched a 4-year "multi-pollutant exposure programme". Compared with the original programme, changes were made to the network of test sites. The programme included 30 test sites with on-going measurements in 16 European countries, Israel, Canada and the United States including new sites in Berlin, Paris and London. A comparison of the results of 4-year exposure of bronze in the two programmes illustrates the substantial decrease of corrosion rates at most sites between 1987–1981 and 1997–2001 (Figure 2.23). Comparisons of the rates in urban areas with those in the surrounding rural regions show that the corrosion is considerably higher in urban locations. For example, the corrosion rate in central Stockholm was about 3 times higher than at the rural site in Aspvreten, situated 80 km to the southeast. Taking into account the very low present SO2 concentration in Stockholm, the conclusion is that the elevated corrosion is due not only to SO2 but to a mixture of sulphur and nitrogen pollutants, ozone and particles.

50
Figure 2.23. Mass loss of unsheltered bronze after four years of exposure in the original (1987–1991) and multi-pollutant (1997–2001) programmes Mapping corrosion rates The 8-year dose-response functions – developed by ICP Materials – are, at present, the best available functions to apply for mapping procedures on both national and European scales. A number of countries have produced maps of the increased risk of corrosion to materials using these functions (Figure 2.24).
1991 1994 1997
Figure 2.24. Calculated zinc corrosion after one year of exposure in Sweden. The high values in Southern Sweden are due to a combination of climatic factors and pollutants. The calculations are based on the ICP Materials dose-response function for zinc and they used climatic data as well as data on ambient concentration of SO2, ozone, NO2, acidity of precipitation and amount of chloride in precipitation
0
10
20
30
40
50
60
70
Prague
-Letn
any
Kopist
yÄhtä
ri
Wald
hof-L
ang.
Lange
nfeld
Bottrop
Rome
Casacci
aMila
n
Venice Oslo
Birken
es
Stockh
olm S.
Aspvret
en
Lincoln
Cath.
Madrid
Toledo
Moscow
Lahem
aa
Lisbon
Dorset
Paris
Berlin
Tel Aviv
Svanv
ik
Chaum
ont
Londo
n
Los Ang
eles
Antwerp
s
Mas
s los
s / g
m-2
1987-19911997-2001
Zinc0 g m-2
3.30 g m-2
4.95 g m-2
6.60 g m-2
8.25 g m-2
Zinc0 g m-2
3.30 g m-2
4.95 g m-2
6.60 g m-2
8.25 g m-2

51
Acceptable corrosion rates An approach similar to the critical levels approach has been developed to allow using results obtained by ICP Materials directly in setting emission targets. The critical levels approach per se could not be used because even the lowest concentration of pollutants causes a degradation in materials and, therefore, defining a critical load other than zero would be contrary to its definition. Instead, "acceptable corrosion rates" were defined in relation to the background corrosion rate and used in the dose-response functions to derive acceptable pollution levels. Calculations have been made, for example, to determine what levels of SO2 would be required in order to maintain corrosion rates at 1.5 times (or twice) the background corrosion rate. The results are in Table 2.4. Table 2.4. Mean annual concentration of SO2 in ambient air required in order to maintain corrosion rate at 1.5 times (or twice) the background corrosion rate. Units are µg/m3
N=1.5 N=2 Weathering Steel 5 45 Zinc 12 49 Copper 7 33 Bronze 5 12 Limestone 7 12
The resulting acceptable levels of SO2 for several of the materials are quite low compared to critical levels for most ecosystems and human health. They underline the need of policy actions in order to reduce damage on materials. The results can also be displayed in the form of maps of acceptable pollution levels for the protection of materials and used to identify areas where they are exceeded. Metals released by corrosion Large amounts of metals are used in constructions and products that are essential to our modern society. A significant part of these metals are emitted to the biosphere as the result of weathering – a process enhanced to the presence of acidifying pollutants. The resulting accumulation of metals in urban environments increases the risk of detrimental effects in the long-term. There is concern about metals like cadmium, mercury and lead, that are known to be toxic to living organisms. There is also concern about other metals: chromium, nickel, copper and zinc, for example. The ICP Materials database is suitable for assessing the release of some metals (copper and zinc, for example, for which SO2 is the most important parameter that increases corrosion rates). A map of the copper release rates for Switzerland was done as a case study (Figure 2.25). It shows that it is possible to make quantitative estimates of the flow of a metal in countries or areas where stock of materials at risk is available.

52
Figure 2.25. Map of estimated runoff rates for copper released by corrosion in Switzerland. Unit: g/m2/year, annual mean 2.8 Modelling and mapping of air pollution effects and risks European databases of critical loads and levels used to support effects-based protocols were compiled by the ICP Modelling and Mapping with contributions from Parties, represented by their national focal centres (NFCs), and scientific and technical support from the Coordination Center for Effects. The analysis of exceedances using the database used to support the 1999 Gothenburg Protocol showed that, after implementation, both the magnitude of exceedances and their geographical extent are predicted to be substantially less than in 1990 – for acidity as well as for nutrient nitrogen – but that the ultimate goal of non-exceedance will not be reached in large parts of Europe. Derivation of critical loads and levels The objectives of the ICP Modelling and Mapping are to determine critical loads and levels, and to map geographical areas to determine the scope and extent of pollutant depositions/ concentrations that exceed critical loads/levels. NFCs are responsible for producing the national critical levels/loads data and maps for inclusion in the European maps – at present, 25 countries participate in the programme and have contributed national data – and the Coordination Center for Effects is charged with compiling European critical loads/levels maps and databases. The Coordination Center for Effects uses various European databases on soil, land use, climatic variables, etc., to calculate critical loads for countries that are unable to provide national data.

53
Both sulphur (S) and nitrogen (N) contribute to acidification, and thus no unique acidity critical load can be defined. The combinations of nitrogen and sulphur deposition not causing "harmful effects" lie on the "critical load function" of the ecosystem, which is characterized by three quantities: (a) the maximum allowable deposition of sulphur, CLmax(S), i.e. the highest deposition of S which does not lead to "harmful" acidification in the case of zero nitrogen deposition, (b) the minimum critical load of nitrogen, CLmin(N), which equals to long-term net removal and immobilisation of N, and (c) the maximum "harmless" acidifying deposition of N, CLmax(N), in the case of zero sulphur deposition (Figure 2.27). Excess nitrogen deposition contributes not only to acidification, but can also lead to the eutrophication of soils and surface waters. Thus a critical load of nutrient nitrogen, CLnut(N), has been defined, preventing eutrophication. In most areas of Europe this critical load of nutrient N is smaller than CLmax(N) (see Figure 2.26).
Ndep
Sde
p
CLmin(N) CLmax(N)
CLmax(S)
CLnut(N)
Figure 2.26. Example of a critical load function for S and acidifying N. The grey area indicates pairs of sulphur and nitrogen deposition not causing exceedance of acidity critical loads. Also shown (as dashed line) is an example of a nutrient N critical load, non-exceedance of which is obtained by all N depositions to the left of it ICP Modelling and Mapping regularly updates the Mapping Manual. Intended for use by NFCs, the Mapping Manual details the methods for calculating and mapping critical levels and loads, as well as their exceedances. The updates are based on the conclusions at specialists workshops organized under the auspices of the Convention. Areas at risk of acidification and eutrophication The ICP Modelling and Mapping developed indicators to estimate quantitatively the risk of harmful effects on sensitive elements of the environment and to produce maps. These indicators are based on the difference between the computed deposition and the critical loads in an EMEP grid cell. Two indicators were used in support of the 1999 Gothenburg Protocol:
the average accumulated exceedance (AAE), defined as the area-weighted average of all ecosystem exceedances in a grid cell. The AAE is measure of the magnitude of the exceedance for the grid cell. The gap closure of AAE reduces the sum of the exceedances in each EMEP grid cell by a fixed percentage (Posch et al. 2001, 2001a);

54
the ecosystem protection, which is the percentage of protected areas in the grid cell.
Maps displaying AAE and ecosystem protection are used as yardsticks to assess progress in reducing the acidification and eutrophication problems. Updating the maps for critical thresholds
Critical loads The European databases of critical loads of acidity and critical loads of nutrient nitrogen were updated in 2003/2004. Generally, the new values have not changed substantially from the ones that were used in 1999 but there are regional differences. The new maps of exceedances, however, show higher remaining exceedances in 2010 than expected in the original assessment for the 1999 Gothenburg Protocol. The differences have their main cause in an improved deposition model, the finer resolution of the EMEP grid and the representation of ecosystem-dependant deposition. Critical levels Updating the concentration-based critical levels of ozone for agricultural crops, semi-natural vegetation and forest trees, and using a more biologically realistic representation of the exposure of crops to ozone, also provide improved estimates of the projected exceedances after full implementation of the protocol. Dynamic modelling For the first time, in 2003, the European database of critical loads of acidity was extended to include parameters needed for dynamic modelling. Dynamic models provide information on time delays of ecosystem damage – or recovery – caused by changes of acidifying deposition. These delays are the result of ecosystems not being in equilibrium with present – or projected – depositions; years, decades or even centuries may be required before reaching an equilibrium (steady state). Dynamic models are not new. For 15 to 20 years, scientists have been developing, testing and applying dynamic models to simulate the acidification of soils or surface waters, mostly due to the deposition of sulphur. But it is a relatively new topic for the effects-oriented work under the Convention. Earlier work, e.g. under the ICP Integrated Monitoring, applied existing dynamic models at a few sites for which a sufficient amount of input data were available. The new challenge is to develop and apply dynamic model(s) on a European scale and to integrate them as much as possible with the integrated assessment work under the Convention, in support of the review and potential revision of protocols. In response to the challenge, the Coordination Center for Effects has developed a very simple dynamic model, which incorporates a limited number of key ecosystem processes (Posch et al. 2001, 2003), and a dynamic modelling manual to inform NFCs about the requirements of methodologies for the dynamic modelling of soil and water chemistry. Dynamic models can be used to evaluate the phases of acidification time scales required for achieving a new (steady) state to be achieved. In contrast, the static models to determine

55
critical loads consider only the steady-state condition, in which the chemical and biological response to a change in deposition is complete. When comparing deposition to critical loads, i.e. in the steady-state situation, only two cases can be distinguished:
The deposition is below critical load(s), i.e. does not exceed critical loads;
The deposition is greater than critical load(s), i.e. there is critical load exceedance. In the first case there is no (apparent) problem, i.e. no reduction in deposition is deemed necessary. In the second case there is, by definition, an increased risk of damage to the ecosystem and therefore the deposition should be reduced. A critical load exceedance serves as a warning and tells that deposition should be reduced. It is often assumed that reducing deposition to (or below) critical loads immediately removes the risk of "harmful effects", i.e. that the chemical parameter (e.g. the ratio of aluminium to base cation concentrations in soil solution, Al:Bc), which links the critical load to the effect(s), immediately attains a non-critical ("safe") threshold, and that there is immediate biological recovery as well. But the reaction of soils to changes in deposition is delayed by biogeochemical processes, and it might take decades or even centuries, before equilibrium (steady state) is reached. Dynamic models are needed to estimate the times involved in attaining a certain soil chemical state in response to deposition scenario. In addition to the delay in chemical recovery, there is likely to be a further delay before the "original" biological state is reached, i.e. even if the chemical criterion is met (e.g. Al:Bc<1), it will take time before full biological recovery is achieved. Figure 2.27 illustrates the delays in the development of a (soil) chemical and biological variable in response to a "typical" temporal deposition pattern. Five stages can be distinguished:
Stage 1: Deposition is below the critical load (CL) and the chemical and biological variables do not violate their respective criteria. As long as deposition stays below the CL, this is the "ideal" situation.;
Stage 2: Deposition is above the CL, but the chemical and biological variables are still
below the critical value. There is no risk for "harmful effects" yet since there is a delay before the criteria (threshold) are violated. Therefore, damage has not occurred in this stage, despite the exceedance of the CL. We call the time between the first exceedance of the CL and first violation of the biological criterion (the first occurrence of actual damage) the Damage Delay Time (DDT = t3–t1);
Stage 3: The deposition is above CL and both the chemical and biological criteria are
violated. Measures have to be taken to avoid a (further) deterioration of the ecosystem;
Stage 4: Deposition is below the CL, but the chemical and biological criteria are still violated, and thus recovery has not yet occurred. We call the time between the first non-exceedance of the CL and the subsequent non-violation of both criteria the Recovery Delay Time (RDT = t6–t4);

56
Stage 5: This stage is similar to stage 1. Deposition is below the CL and both criteria are no longer violated. Only at this stage can one speak of full ecosystem recovery.
Figure 2.27. Schematic temporal development of the deposition (top), a soil chemical variable and the corresponding biological response. Also depicted are the critical values of those (chemical and biological) variables and the critical load derived from them. The delay between the (non-)exceedance of the critical load, the (non-)violation of the critical chemical criterion and the crossing of the critical biological response is indicated in grey shades, highlighting the Damage Delay Time (DDT) and the Recovery Delay Time (RDT) of the system Linking dynamic models and integrated assessment models enables the determination of deposition levels (target loads) needed to achieve a prescribed chemistry within a given time (the target year).
Stage 1 Stage 2 Stage 3 Stage 4 Stage 5A
cid
depo
sitio
n
Critical Load
Che
mic
al r
espo
nse
(Al/Bc)crit
Bio
logi
cal r
espo
nse
critical response
timet1 t2 t3 t4 t5 t6
DDT RDT

57
Critical loads of heavy metals The development, under the Convention, of methodologies for deriving critical loads of heavy metals started in the early 1990s (Van den Hout 1994) in anticipation of a possible effects-based support of the 1998 Protocol on Heavy Metals or its later review. A series of UNECE workshops (see Annex I) reflected the development of the basic science on the behaviour and effects of heavy metals, as well as their pools and fluxes in the environment. They contributed to the continuous improvement of methodologies to derive critical limits and critical loads of heavy metals – in particular lead (Pb), cadmium (Cd), and mercury (Hg) – for terrestrial and aquatic ecosystems, and their inclusion in the Mapping Manual. As an alternative to critical loads, an approach to calculate deposition loads that avoid further accumulation of the metals in the ecosystems was discussed and named the "stand-still approach". This approach is however not effects-based and should therefore clearly be distinguished from the critical loads methodologies. For various reasons, the ICP Modelling and Mapping has decided not to model nor map stand-still loads anymore. The critical load of a heavy metal is defined as "the highest total metal input rate, below which harmful effects on human health as well as on ecosystem structure and function will not occur in a long-term perspective, according to present knowledge". Similarly, the critical limit is defined as a concentration threshold, below which significant harmful effects on human health and specified sensitive elements of the environment do not occur, according to present knowledge. A stand-still load is the total metal input that does not lead to no further increase (or decrease) of the metal concentration in the ecosystem.
Critical loads of heavy metals are derived on the basis of a mass balance model, assuming steady-state for the fluxes as well as chemical equilibrium (which is a theoretical situation in an undetermined future) on the concentration level at critical limit.
A peculiarity of the critical load approach for heavy metals is its application not only to natural, but also to agricultural ecosystems. This means that the total anthropogenic input of metals includes pathways other than atmospheric depositions, in particular inputs via fertilisers. A recent call for data has resulted in a preliminary dataset on critical loads and stand-still loads of cadmium and lead using the 50 km x 50 km EMEP grid. Eleven parties provided heavy metal threshold data. Critical loads were submitted by ten parties. Seven parties submitted stand-still loads. Methods and results of this work and preliminary exceedance calculations can be found in a collaborative report of the Coordination Center for Effects and the EMEP Meteorological Synthesizing Centre East (EMEP/MSC-E) (Hettelingh et al. 2002). The study showed that there is a high interest in mapping critical loads of heavy metals, that the necessary data are available in the countries and that the aim of producing European maps of critical loads and their exceedances is not unrealistic.
The methodologies to derive critical limits and loads of heavy metals have been revised in line with conclusions and recommendations drawn from the first attempt of European mapping. Knowledge achieved in the European Union's risk assessment of heavy metals, reflected in technical guidance documents (ECB 2003) and position papers (on Pb, As, Cd and Ni as well as Hg), has also been considered.

58
The most important changes or completions, respectively, of the methodologies are:
Inclusion of effects-based methodologies for Hg (addressing forest humus layers and freshwater ecosystems);
Inclusion of human health aspects (Pb, Cd, Hg);
Application of further sophisticated critical limits for direct effects on biota (Cd and Pb), based on effects of free metal ions in soil solution, and related transfer functions and chemical speciation models;
Exclusion of the release of heavy metals from parent materials by weathering from the mass balance due to relatively low relevance and high uncertainties of those estimates.
The revised methodologies have been tested already in several national studies and confirmed to be feasible for European application after further improvement in specified points. Results of advanced European mapping of critical loads and their exceedances are expected for spring 2005. The necessary steps of this future work are described in more detail in chapter IV.

59
Chapter III Conclusions Monitoring has exposed the extent of effects of air pollution Monitoring shows that air pollution causes widespread damage in Europe and North America: long- and short-term effects on human health; acidification of surface waters and soils; effects on forest health and productivity; eutrophication; plant injury and reduced productivity of crops; accelerated corrosion and soiling of materials. Work by the International Cooperative Programmes (ICPs) and the Task Force on Health has documented the extent and severity of damage and, in some cases, the first signs of recovery. Monitoring reveals the start of recovery in some areas Recovery is particularly evident in terms of improvements in surface water quality, specifically related to an almost universal decrease in sulphate concentrations in lakes and streams. These improvements have led to isolated signs of biological recovery but improvements in water quality have not yet reached a level where widespread effects on biology can be detected. In addition, the reduction in corrosion rates for many materials (in the order of 30–70% during the period 1987–1995) is also attributed to a reduction in sulphur dioxide emissions. Ozone damage is widespread Current levels of ozone also affect crops, by visible injury and reduced biomass, forest trees and semi-natural vegetation over most of Europe and North America. No trends on effects have been detected. Recent results strengthen and refine the scientific basis for the protocols Better data, models and improved dose-response relationships provide a stronger scientific basis for predicting environmental effects, risks and trends, and increase the level of confidence in earlier predictions that air pollution control measures will produce further benefits for sensitive ecosystems and for human health. Such predictions are particularly useful to anticipate continuing problems in slow-reacting ecosystems, e.g. forests and the soils on which they grow. There are still threats Threats related to acidification, eutrophication, ozone, heavy metals and persistent organic pollutants (POPs) will all be reduced as a result of the existing protocols being implemented. Nevertheless, some problems will remain:

60
Acidification: steady-state as well as dynamic model predictions indicate that additional measures are required to protect all sensitive ecosystems from acidification;
Eutrophication: many ICP Forests plots show signs of nutrient imbalance and
elevated leaching of nitrate. Similarly, half of the ICP Waters sites exhibit a high degree of nitrogen saturation. The measures in the 1999 Gothenburg Protocol will ease the problem. Nevertheless, the current commitments are insufficient to prevent further accumulation of nitrogen in ecosystems over the long term;
Ozone: Current levels of ozone in many European and North American cities still
lead to adverse health effects. Also, due to the multi-pollutant environment in urban centres, materials – whether technical materials or materials used in objects of cultural heritage – corrode faster and are soiled more rapidly than in the surrounding rural regions. Current levels of ozone also affect crops, forest trees and semi-natural vegetation over most of Europe and North America;
Particulate matter (PM): Current levels of particulate matter in urban areas in
Europe and North America lead to adverse health effects. The particles also contribute to the corrosion and soiling of materials in urban centres due to the multi-pollutant environment.
Heavy metals: though emissions of lead, cadmium and mercury have been cut,
these metals are expected to continue to accumulate in soils and reach concentrations sufficient to affect biota. The cadmium content of agricultural soils is also of concern because of its possible effects on human health.
More sophisticated models and approaches are available for use More sophisticated models and approaches are available for use, including:
Moving from steady-state to dynamic modelling of acidification processes enables consideration of the time element in the policy process. Dynamic models and the related target loads provide information on the time for ecosystems to acidify or recover, and this can be used to set environmental goals and the corresponding air pollution control measures;
For human health, better assessment of exposure to ozone and particulate matter;
for vegetation, flux-based exposure indicators and better representation of the risk of damage due to exposure to ozone. These all provide better evaluation of environmental and health benefits of control measures;
Methodologies that have been developed, and are being improved, to use the
critical loads approach for selected heavy metals. These are being developed further to provide even better prediction and support to future policies use within the Convention and in wider international forums.

61
Continued reassessment of activities is needed The range of effects-oriented activities has effectively covered most of the priority issues of the Convention since the 1980. There is, however, a need for continued reassessment to ensure continued focus of the activities. The effects-based approach is an effective way of meeting environmental goals The process of combining data on critical loads, emissions, meteorological information and pollution abatement costs has allowed Parties to the Convention to optimize emission reductions to meet environmental goals at the lowest total cost. The scientific community is confident that what has worked well for the 1994 Sulphur Protocol will work well also for the 1999 Gothenburg Protocol, i.e. meeting the emission ceilings for sulphur and nitrogen oxides, ammonia and volatile organic compounds (VOCs) will further reduce damage caused by acid deposition, reduce or prevent damage due to eutrophication and ground-level ozone. There has been useful interaction between science and policy Study of the effects of air pollution has always been a major driving force for the work of the Convention. Using effects more directly in policy development has had major benefits for both policy and science but has led to the need for close interaction between the two. The resulting improvements in knowledge have been successfully applied in national and international programmes to reduce air pollution. Convention-wide participation is important Parties participating in the scientific monitoring, research and modelling programme contribute the essential data that underpin the work of the Convention. ICPs and Task Forces – with support from their lead countries – provide the vital coordination, assistance and direction to the scientific effort. The Working Group on Effects reviews results annually, ensures that they are communicated effectively and agrees on its future programme of work. The current structure of the Convention helps the discussion of these results.


63
Chapter IV Challenges 3.1 Air pollution and human health As described in Chapter II, exposure to air pollution, even at the levels commonly achieved nowadays in European countries, leads to adverse health effects. Exposure to particulate matter (PM), especially its fine fraction PM2.5, and ozone are of particular concern. High levels of exposure to certain persistent organic pollutants (POPs) also occur within the Convention area, including populations of Arctic regions. There is a risk of future exposure to cadmium through some crops and to mercury through fish. Particulate matter Particulate matter resulting from the long-range transport of air pollutants has significant health effects, including reduction of life expectancy in Europe. It has been recommended to estimate impact of the long-range transported component of the exposure to PM2.5. This should be done using risk functions based on the long-term epidemiological study completed in the United States, since there is no appropriate study completed in Europe. For exposure assessment, estimates will be based on the EMEP atmospheric dispersion model, which estimates PM concentrations in the 50 km x 50 km EMEP grid. Information on the place of residence of the population is provided by the International Institute for Applied Systems Analysis (IIASA). It was noted that the EMEP atmospheric dispersion model is currently underestimating the observed PM concentrations, partly due to the fact that mineral dust and secondary organic aerosols are not yet included in the model. Since the knowledge on the role of individual components in producing the health impacts is still very limited, this recognized deficiency in the model increases uncertainty of the impact assessment and, more importantly, may affect efficiency of the pollution reduction strategies designed using the present models. This poses a specific challenge to the research on health effects of various components of PM and to the atmospheric modelling community. Another challenge is the quantification of less severe than mortality, but more common, health outcomes of the pollution, manifested by morbidity or hospital admissions. Scarcity of comparable data on baseline morbidity rates in various European populations makes this work very difficult at present. Ozone It has been noted that the AOT60 concept (accumulated over the threshold ozone concentration 60 ppb (parts per billion) over a specified period), which was used previously by integrated assessment modelling supporting the 1999 Gothenburg Protocol, might not be appropriate any more to account for effects of ozone on human health. This is because effects might occur at levels lower than 60 ppb and a possible threshold, if any, might be close to background levels and not determinable. Therefore, the assessment of health impacts of ozone exposure on mortality will be based on concentration-response association derived from the time-series studies.

64
There are many more days with mildly elevated ozone concentrations than days with very high ozone levels. Therefore, large proportion of the health burden may be expected to occur in the days with mild ozone levels. This may require to reduce ozone concentrations not only when the peaks occur but also on days with lower pollution levels. Assessment of the burden to health due to ozone including all health outcomes known to be linked to the exposure will require internationally comparable information on background morbidity rates, which is currently not available in Europe. Heavy metals and persistent organic pollutants A more precise assessment of risk to health of heavy metals and most of the persistent organic pollutants (POPs) from long-range transport will require a better knowledge on the link between population exposure to these pollutants and their fluxes through the environment. Concerns about new POPs will pose further challenges to the health, exposure assessment and atmospheric sciences, since the data on these substances are scarce and dispersed. 3.2 Air pollution and ecosystems Acidification Reduction in emissions of acidifying pollutants, particularly sulphur, have significantly reduced the threat of acidification for sensitive terrestrial and aquatic ecosystems. Monitoring has revealed improvements in surface water quality and it has showed that also soils are recovering from the high sulphur inputs in the past. Dynamic models applied to specific sites predict that improvements will continue. Maps of critical loads based on recent data indicate that both geographical extent and magnitude of exceedances would be reduced when emission reductions resulting from the 1999 Gothenburg Protocol are in place. Nevertheless, some exceedances will remain. There is a need to continue monitoring the sensitive ecosystems related to the recovery from acidification, focusing in particular on those systems that are most likely to change as a result of changes in deposition. A number of confounding factors that affect recovery and introduce uncertainties related to the predictions have been identified: desorption and mineralization of sulphur, base cation and nitrogen processes and climate change effects. Better knowledge of these factors is needed to improve modelling efforts. Monitoring the biological recovery will be particularly important. Dynamic models of biological recovery have not yet been developed, but could be constructed for individual groups of organisms. For example, sufficient knowledge and data are available for testing a dynamic model of brown trout in Norwegian lakes, macroinvertebrates in streams and microcrustaceans and diatoms in lakes. Eutrophication The threat of eutrophication continues in spite of reductions of nitrogen emissions. Model predictions estimate that, even after full implementation of measures adopted by the 1999 Gothenburg Protocol, exceedances of nutrient nitrogen for sensitive ecosystems in a large area

65
of Europe will remain. These predictions are supported by current observations nutrient imbalances and high degree of nitrogen saturation in terrestrial and aquatic monitoring sites. There should be more efforts in studying the nitrogen cycle in ecosystems, i.e. how and where nitrogen accumulates in ecosystems and the factors that regulate nitrogen saturation. Work at the intensively monitored sites can help answer some of the important questions. The knowledge could be used in the context of extensive monitoring networks and it can contribute to improving estimates of critical loads of nutrient nitrogen as well as to improved nitrogen process descriptions in dynamic models. Our knowledge on the effects of nutrient nitrogen on various elements of the ecosystem should be improved, i.e. to understand the long-term effects of increased nitrogen deposition on ecosystem processes in a representative range of ecosystems. These can include, inter alia, the relation of growth and defoliation to nutrient nitrogen deposition and interaction between nitrogen deposition, forest stand structure and species composition of ground vegetation. Ground-level ozone Field surveys and bioindicator studies have provided important evidence for the significance of ozone as a phytotoxic pollutant across Europe and North America. Reductions in emissions of volatile organic compounds (VOCs) and nitrogen oxides (NOx) are expected to lead to decreasing ozone concentration levels in general. Our ability to predict corresponding environmental benefits for vegetation has recently been improved. New exposure indices were developed, such as the flux-based approach. They provide a more biologically-realistic representation of the exposure of plants to ozone than indices based on concentration only. The latter were used in support of negotiations for the 1999 Gothenburg Protocol. The new exposure indices have been developed for two. Further work is needed to include more crops, (semi-)natural vegetation and forest trees. Heavy metals The 1998 Protocol on Heavy Metals targets three particularly harmful heavy metals: cadmium (Cd), lead (Pb) and mercury (Hg). The Protocol notes that an effects-based approach would integrate appropriate information for the purpose of formulating future optimized control strategies which also take into account economic and technological factors. In this context, the Working Group on Effects focuses on monitoring concentration levels in ecosystem compartments as well as fluxes and their trends, on deriving critical limits for concentrations of these metals, on the calculation of critical loads and their exceedances, development of dynamic models for heavy metals and the release of metals from materials by corrosion. Robust available methodologies for critical load calculations of Pb, Cd, and Hg are expected to result in advanced mapping of critical loads and their exceedances in 2005. The methods currently available enable the calculation and mapping of four types of critical loads:
Ecotoxicological effects in terrestrial ecosystems (Pb, Cd, Hg, with Hg limited to forest humus layers);
Human health effects in terrestrial ecosystems (based on critical limits of Pb, Cd
and Hg for drinking water, and in addition critical limits for Cd in wheat);

66
Ecotoxicological effects in aquatic ecosystems (Pb, Cd, Hg);
Human health effects in aquatic ecosystems (Hg in fish). The science behind the approach is deemed as well developed and sound, although the uncertainties of critical loads calculations of heavy metals are generally higher than for sulphur and nitrogen. The evaluation and quantification of the uncertainties need continued attention in the future. The way to include the information on critical loads of heavy metals in integrated assessment models is still under discussion. 3.4 Air pollution and materials Air pollution accelerates corrosion of materials that are representative both for technical materials and materials used in objects of cultural heritage. The multi-pollutant environment found in most urban centres is the likely reason why the downward trend in corrosion rates is levelling off more and more at the observational sites. The multi-pollutant environment, and elevated concentrations of PM in particular, also contributes to the soiling of materials. The challenge for the scientific community is to develop dose-response functions for the multi-pollutant environment, with a view to derive critical thresholds of selected pollutants for the protection of economically or culturally important materials. Another need is to continue developing methodologies and databases for an economic assessment of the costs or benefits related to effects of air pollution on materials. 3.5 Interactions and synergies The range of effects-oriented activities has effectively covered most of the priority issues of the Convention since the 1980. The current programmes need continued reassessment to ensure the focus on long-range transboundary air pollution effects and to respond to new research and development requirements. In addition, the dialogue between the research and policy-making communities should remain active. The environmental problems caused by individual air pollutants are interlinked to a certain extent. Integrated assessment models have recently addressed several pollutants and problems simultaneously, as was the case for the 1999 Gothenburg Protocol. Other factors are becoming influential, such as the effect of climate change to ecosystem processes and pollutant effects on biodiversity. The overall assessment of air pollutants and other stresses on the environment – in terms of geochemical cycles as well as biological processes – and integrating results in a systematic and comparable manner, e.g. in an integrated assessment model, is one of the major challenges to the effects-oriented scientific community.

67
References Aastrup, M., Iverfeldt, ÅÅ., Bringmark, L., Kvarnäs, H., Thunholm, B. and Hultberg, H.
1995. Monitoring of heavy metals in protected forest catchments. Water Air and Soil Pollution 85: 755-760.
Aastrup, M., Iverfeldt, ÅÅ., Bringmark, L., Kvarnäs, H., Thunholm, B. and Hultberg, H. 1995. Monitoring of heavy metals in protected forest catchments. Water Air and Soil Pollution 85: 755-760.
Amann et al. 1999. Integrated assessment modelling for the protocol to abate acidification eutrophication and ground-level ozone. Publication series Air & Energy, Nr. 132, Dutch Ministry of Environment, November 1999.
Anonymous 1995. Assessment of nitrogen processes on ICP Integrated Monitoring sites. In: 4th Annual Synoptic Report 1995, UNECE ICP Integrated Monitoring. Finnish Environment Agency, Helsinki, Finland, pp. 19-61.
Benton, J., Fuhrer, J., Sanchez-Gimeno, B., Skärby, L. and Sanders, G. E. 1995. Results from the UNECE ICP Crops indicate the extent of exceedance of the critical levels of ozone in Europe. Water, Air and Soil Pollution 85, 1473-1478.
Bergkvist, B. 2001. Water Air and Soil Pollution (Focus) 1(3-4): 371-383. Bringmark, L., Bringmark, E. and Samuelsson, B. 1998. Effects on mor layer respiration by
small experimental additions of mercury and lead. The Science of the Total Environment 213: 115-119.
Bringmark, L. Ruoho-Airola, T., Starr, M., Porvari, P., Verta, M., Lundin, L. and Forsius, M. 2001. Heavy metal in forested reference catchments. In: Occurrence, movements and effects of selected heavy metals, UNECE Convention on Long-Range Transboundary Air Pollution. Document EB.AIR/WG.1/2001/10, pp. 19-22.
Buse, A., Mills, G., Harmens, H., Büker, P., Hayes, F., Williams, P., Emberson, L., Cinderby, S., Ashmore, M., Holland, M. and the participants of the ICP Vegetation. 2003a. Air pollution and vegetation. UNECE ICP Vegetation annual report 2002/2003. ISBN: 1 870393 71 6.
Buse, A., Norris, D., Harmens, H., Büker, P., Ashenden, T., Mills, G. 2003b. Heavy metals in European mosses: 2000/2001 survey. UNECE ICP Vegetation. ISBN: 1 870393 70 8.
Chappelka, A.H. and Freer-Smith, P.H. 1995. Predisposition of trees by air pollutants to low temperatures and moisture stress. Environmental Pollution 87: 105-117.
Cronan, C.S. and Grigal, D.F. 1995. Use of cadmium/aluminium ratios as indicators of stress in forest ecosystems. Journal of Environmental Quality 24: 209-226.
De Smet, P.A.M., Slootweg, J. and Posch, M. 1997. The European background data base for critical loads. In: Posch M., Hettelingh, J.-P., De Smet, P.A.M. and Downing, R.J. (editors): 1997, Calculation and Mapping of Critical Thresholds in Europe. CCE Status Report 1997, RIVM, Bilthoven, The Netherlands, 163 pp (also available on www.rivm.nl/cce)
De Vries, W., Reinds, G.J., Van der Salm, C., Draaijers, G.P.J., Bleeker, A., Erisman, J.W., Auee, J., Gundersen, P., Kristensen, H.L., Van Dobben, H., De Zwart, D., Derome, J., Voogd, J.C.H. and Vel, E.M. Intensive Monitoring of Forest Ecosystems in Europe. Technical Report 2001. UNECE and EC, Geneva and Brussels, Forest Intensive Monitoring Coordinating Institute, 177 pp.

68
De Vries, W., Reinds, G.J., Van der Salm, C., Van Dobben, H., Erisman, J.W., De Zwart, D., Bleeker, A., Draaijers, G., Gundersen, P., Vel, E. and T. Haußmann, T. 2002. Results on nitrogen impacts in the EC and UNECE ICP Forests Programme. Proceedings, Expert Workshop: Empirical Critical Loads for Nitrogen, Bern 11-13, Nov. 2002, pp 199-201. Published by the Swiss Agency for the Environment, Forests and Landscape. Environmental Documentation No. 164.
De Vries, W., Forsius, M., Lorenz, M., Lundin, L., Haußmann, T., Augustin, S., Ferretti, M., Kleemola, S. and Vel, E. 2002. Cause-effect relationships of forest ecosystems- Joint report by ICP Forests and ICP Integrated Monitoring. Federal Research Centre of Forestry and Forest Products (BFH) and Finnish Environment Institute (SYKE). 46 pp.
De Zwart, D. 1998. Multivariate gradient analysis applied to relate chemical and biological observations. In: Kleemola S., Forsius M. (editors) 7th Annual Report 1998. UNECE ICP Integrated Monitoring. The Finnish Environment 217: 15-29. Finnish Environment Institute, Helsinki, Finland. ISBN 952-11-0301-9.
EC 2004. Second position paper on particulate matter. European Communities, Clean Air for Europe (CAFE), Working Group on Particulate Matter (draft).
ECB 2003. Technical Guidance Document on Risk Assessment of Chemical Substances following European Regulations and Directives, Second edition, European Chemicals Bureau (ECB), JRC-Ispra (VA), Italy, April 2003
Emberson, L.D., Ashmore, M.R., Cambridge, H.M., Simpson, D. and Tuovinen, J.-P. 2000. Modelling stomatal ozone flux across Europe. Environmental Pollution 109, 403-413.
Evans, C.D., Cullen, J.M., Alewell, C., Kopacek, J., Marchetto, A., Moldan, F., Prechtel, A., Rogara, M., Vesely, J. and Wright, R.F. 2001. Recovery from acidification in European surface waters. Hydrology & Earth System Sciences 5: 283-298.
Forsius, M, Kleemola, S., Starr, M. and Ruoho-Airola, T. 1995. Ion mass budgets for small forested catchments in Finland, Water Air Soil Pollut. 79, 19-38.
Forsius, M., Alveteg, M., Jenkins, A., Johansson, M., Kleemola, S., Lükewille, A., Posch, M., Sverdrup, H. and Walse, C. 1998a. MAGIC, SAFE and SMART model applications at Integrated Monitoring Sites: Effects of emission reduction scenarios. Water, Air, and Soil Pollution 105: 21-30.
Forsius, M., Guardans, R., Jenkins, A., Lundin, L. and Nielsen, K.E. (editors) 1998b. Integrated Monitoring: Environmental assessment through model and empirical analysis - Final results from an EU/LIFE-project. The Finnish Environment 218. Finnish Environment Institute, Helsinki. 172 pp.
Forsius, M., Kleemola, S., Vuorenmaa, J., and Syri, S. 2001. Fluxes and trends of nitrogen and sulphur compounds at Integrated Monitoring Sites in Europe. Water Air and Soil Pollution 130: 1641-1648.
Forsius, M., Kleemola, S. and Starr, M. 2004. Proton budgets for a network of forested catchments and the impact of nitrogen deposition. Ecological Indicators (accepted).
Freer-Smith, P.H. 1998. Do pollutant related forest declines threaten the sustainability of forests. Ambio 27: 123-131.
Fuhrer, J. 1995. Integration of the ozone critical level approach in modelling activities. Background paper to the EMEP Workshop on the Control of Photochemical Oxidants over Europe, 24-27 October 1995, St. Gallen, Switzerland. Editor: Federal Office of Environment, Forest and Landscape, Berne.
Gundersen, P. 2000. The role of nitrogen in forest ecosystems. In: Fischer, R., De Vries, W., Seidling, W., Kennedy, P. and Lorenz, M. (2000) Forest Condition in Europe. Executive Report 2000. UNECE and EC, Geneva and Brussels, 34p.
69
Gunn, J. M. and Keller W. 1990. Biological recovery of an acid lake after reductions in industrial emissions of sulphur. Nature 345: 431-433.
Halvorsen, G., Heegaard, E. and Raddum, G. G. 2002. Tracing recovery from acidification - a multivariate approach. ICP Waters report 69/2002 SNO 4564-2002, Norwegian Institute for Water Research, 39 pp.
Harriman, R., Watt, A. W., Christie, A. E. G., Collen, P., Moore, D. W, McCartney, A. G, Taylor, E. M and Watson, J. 2001. Interpretation of trends in acidic deposition and surface water chemistry in Scotland during the last three decades. Hydrol.Earth System Sci. 5: 407-420.
Hettelingh, J.-P., Downing, R.J. and De Smet, P.A.M. 1992. The critical loads concept for the control of acidification. In: T.Schneider, T. (editor), Acidification Research: Evaluation and Policy Applications, Elsevier Science Publishers, pp. 161-174.
Hettelingh, J.-P., Posch, M., De Smet, P.A.M. and Downing, R.J. 1995. The use of critical loads in emission reduction agreements in Europe, Water, Air an Soil Pollution 85:2381-2389
Hettelingh, J.-P., Posch, M. and De Smet, P.A.M. 2001. Multi-effect critical loads used in multi-pollutant reduction agreements in Europe. Water, Air and Soil Pollution 130: 1133-1138.
Hettelingh, J.-P., Slootweg, J., Posch, M., Dutchak, S. and Ilyin, I. 2002. Preliminary Modelling and Mapping of Critical Loads of Cadmium and Lead in Europe, RIVM Report 259 101 011, CCE MSC-East Moscow and CCE Bilthoven.
Hettelingh, J.-P., Posch, M. and Slootweg, J. 2003. Status of European critical load and dynamic modelling. In: Posch, M., Hettelingh, J.-P., Slootweg J. and Downing, R.J. (editors) Modelling and Mapping of critical thresholds in Europe, CCE Status Report 2003, Coordination Center for Effects, Netherlands Environmental Assessment Agency, RIVM, report 259101013, Bilthoven, The Netherlands, iv+130 pp. (also available on www.rivm.nl/cce)
Holmberg, M., Forsius, M., Starr, M. and Huttunen, M. 2004. An application of artificial neural networks to carbon, nitrogen and phosphorus concentrations in three boreal streams and impacts of climate change. Ecological Modelling (accepted).
Ilvesniemi, H., Forsius, M., Finér, L, Holmberg, M., Kareinen, T., Lepistö, A., Piirainen, S., Pumpanen, J., Rankinen, K., Starr, M., Tamminen, P., Ukonmaanaho, L. and Vanhala, P. 2002. Carbon and nitrogen storages and fluxes in Finnish forest ecosystems. In: Käyhkö, J. and Talve, L. (editors). Understanding the global system: The Finnish perspective. Finnish Global Change Research Programme, pp. 69-82.
Jenkins, A, Camarero, L., Cosby, B.J., Ferrier, R., Forsius, M., Helliwell, R., Kopacek, J., Majer, V., Moldan, F., Posch, M. Rogora, M., Schöpp, W. and Wright, R.F. A modeling assessment of acidification and recovery of European surface waters. Hydrology and Earth System Sciences 7: 447-455.
Jenkins, A, Larssen, T., Moldan, F., Hruška, J., Krám, P. and Kleemola, S. 2003. Dynamic modelling at ICP IM sites; Model testing against observations and uncertainty. The Finnish Environment 636. Finnish Environment Institute, Helsinki. 37 p. ISBN 952-11-11441-X (PDF).
Karlsson, P.E., Selldén, G. and Pleijel, H. 2003. Establishing Ozone Critical Levels II. UNECE Workshop Report. IVL report B 1523. IVL Swedish Environmental Research Institute, Gothenburg, Sweden. http://www.ivl.se
Kärenlampi, L. and Skärby, L. 1996. Critical levels for ozone in Europe: testing and finalising the concepts. UNECE Workshop Report. University of Kuopio, Dept. of Ecology and Environmental Science.

70
Karlsson, P.E., Uddling, J., Braun, S., Broadmeadow, M., Elvira, S., Gimeno, B.S., Le Thiec, D., Oksanen, E., Vandermeiren, K., Wilkinson, M. and Emberson, L. 2003. New Critical Levels for Ozone Impact on Trees Based on AOT40 and Leaf Cumulated Uptake of Ozone. In: Karlsson, P.E., Selldén, G. and Pleijel, H. (editors) Establishing Ozone Critical Levels II. UNECE Workshop Report. IVL report B 1523. IVL Swedish Environmental Research Institute, Gothenburg, Sweden. http://www.ivl.se
Keller, W.,. Gunn, J.M. and Yan N.D. 1999. Acid rain - perspectives on lake recovery. Journal of Aquatic Ecosystem Health and Recovery 6: 207-216.
Klumpp, A., Ansel, A., Klumpp, G., Belluzzo, N., Calatayud, V., Chaplin, N., Garrec, J.P., Gutsche, H.-J., Hayes, M., Hentze, H.-W., Kambezidis, H. Laurent, O., Peñuelas, J., Rasmussen, S., Ribas, A., Ro-Poulsen, H., Rossi, S., Sanz, M.J., Shang, H., Sifakis, N. and Vergne, P. 2002. EuroBionet: A pan-European biominotoring network for urban air quality assessment. Environmental Science and Pollution Research 9, 199-203.
Kohout L. 2001. Zooplankton of lakes in Bohemian Forest. Unpublished thesis, in Czech. Charles University, Faculty of Science, Prague, 156 pp.
Likens, G.E., Driscoll, C.T. and Busco, D.C. 1996. Long-term effects of acid rain: Response and recovery of a forest ecosystem. Science 272: 244-246.
Larssen, T., Clarke, N.,Tørseth, K. and Skjelkvåle, B. L. 2002. Prognoses for future recovery from acidification of water, soils and forests: Dynamic modeling of Norwegian data from ICP Forests, ICP IM and ICP Waters. SNO 4577-2002, Norwegian Institute for Water Research, 38 pp.
MacDonald, J.A., Dise, N.B., Matzner, E., Armbruster, M., Gundersen, P. and Forsius, M. 2002. Nitrogen input together with ecosystem nitrogen enrichment predict nitrate leaching from European forests. Global Change Biology 8: 1028-1033.
Manion, P.D. 1981. Decline diseases of complex biotic and abiotic origin. Tree disease concept. Prentice Hall, 324-339.
Manual for Integrated Monitoring 1998. Finnish Environment Institute, Helsinki, Finland. Electronic version of the Manual is available at web site: http://www.environment.fi/default.asp?contentid=17110&lan=en
Mapping Manual 2004. The Convention’s Manual on methodologies and criteria for mapping critical levels/loads and geographical areas where they are exceeded. Available on the Internet: http://www.oekodata.com/icpmapping/html/manual.html.
Mills, G., Büker, P., Hayes, F., Emberson, L., Werner, W., Gimeno, B., Fumagalli, I., Köllnert, B., Manes, F., Pihl Karlsson, G., Soja, G. and Vandermeiren, K. 2003. Developing ozone flux-response models for white clover from the ICP Vegetation ambient air monitoring experiment. In: Karlsson, P.E., Selldén, G. & Pleijel, H. (editors). Establishing Ozone Critical Levels II. UN-ECE Workshop Report. IVL Report B 1523. IVL Swedish Environmental Research Institute, Gothenburg.
Moldan, F., Wright, R.F., Löfgren, S., Forsius, M., Ruoho-Airola,T., and Skjelkvåle, B.L. 2001. Long-term changes in acidification and recovery at nine calibrated catchments in Norway, Sweden and Finland. Hydrology and Earth System Sciences 5: 339-349.
Monteith, D. and Evans, C. D. 2001. United Kingdom Acid Waters Monitoring Network. DETR, London. 25 pp.
Moayeri, M.H. 2001. Mass balance related to sustainability of forest biomass production: concepts and applications. Ph.D. Thesis. University of New Brunswick, Fredericton, N.B., Canada.
Munthe, J. Lee, Y.H., Hultberg, H., Iverfeldt, Å., Borg, G. and Andersson, I. 1998. Cycling of mercury and methyl-mercury in the Gårdsjön catchment. In: Experimental reversal of acid rain: The Gårdsjön roof project, 261-276.

71
Nelleman, C. and Thomsen, M.G. 2001. Long-term changes in forest growth: Potential effects of nitroge deposition and acidification. Water, Air, and Soil Pollution 128: 197-205.
Ouimet, R., Duchesne, L., Houle, D. and Arp, P.A. 2001. Critical loads of atmospheric S and N deposition and current exceedances for Northern temperate and boreal forests in Québec. Water, Air and Soil Pollution. Focus 1(1/2): 119-134.
Pleijel, H., Danielsson, H., Ojanperä, K., DeTemmerman, L., Högy, P. and Karlsson, P.E. 2003. Relationships between ozone exposure and yield loss in European wheat and potato – A comparison of concentration based and flux based exposure indices. In: Karlsson, P.E., Selldén, G. and Pleijel, H. (editors) Establishing Ozone Critical Levels II. UNECE Workshop Report. IVL report B 1523. IVL Swedish Environmental Research Institute, Gothenburg, Sweden. http://www.ivl.se
Pope CA III et al. 2002. Lung cancer, cardiopulmonary mortality and long-term exposure to fine particulate air pollution. Journal of American MedicalAssociation 2002; 287:1132-41
Posch M., De Smet, P.A.M., Hettelingh, J.-P. and Downing, R.J. (editors) 2001. Modelling and Mapping of Critical Thresholds in Europe. CCE Status Report 2001, Coordination Center for Effects, National Institute for Public Health and the Environment (RIVM), Bilthoven, The Netherlands, iv+188 pp. (also available on www.rivm.nl/cce)
Posch M., Hettelingh, J.-P. and De Smet, P.A.M. 2001. Characterization of critical load exceedances in Europe. Water, Air and Soil Pollution 130: 1139-1144.
Posch, M., Hettelingh, J.-P. and Slootweg, J. (editors) 2003. Manual for Dynamic Modelling of Soil Response to Atmospheric Deposition, RIVM report 259101012 (also available on www.rivm.nl/cce).
Posch, M. and Hettelingh, J.-P. 2001. From critical loads to dynamic modelling, CCE Status report 2001, Chapter 3. pp.33-41
Prechtel, A., Alewell, C., Armbruster, M., Bittersohhl, J., Cullen, J.M., Evans, C.D., Helliwell, R.C., Kopacek, J., Marchetto, A., Matzner, E., Messenburg, H., Moldan, F., Moritz, F., Vesely, J. and Wright, R.F. 2001. Response of sulphur dynamics in European catchments to decreasing sulphate deposition. Hydrol. Earth Syst. Sci. 5, 311-326.
Rademacher, P. 2001. Atmospheric Heavy Metals and Forest Ecosystems. Federal Research Centre of Forestry and Forest Products (BFH), Germany, 75pp.
Raddum, G. G., Fjellheim, A. and Skjelkvåle, B. L. 2001. Improvements in water quality and aquatic ecosystems due to reduction in sulphur deposition in Norway. Water Air Soil Pollut. 130 : 87-98.
Raddum, G. G. and Fjellheim, A. 2003. Liming of River Audna, Southern Norway. A large scale experiment of benthic invertebrate recovery. AMBIO 32 (3): 230-234
Scholz, F. and Lorenz, M. 1984. Schadensursachen und Wirkungsmechanismen bei den Waldschäden. Allgemeine Forst Zeitschrift 39, 51/51: 1275-1278.
Schütt, P. 1979. Buchen- und Tannensterben, zwei altbekannte Waldkrankheiten von höchster Aktualität. Mitt. d. Deutschen Dendrolog. Gesellschaft 71: 229-235.
Skjelkvåle, B. L., Andersen, T., Halvorsen, G. A., Heegaard, E., Stoddard, J. L. and Wright, R. F. 2000. The 12-year report; Acidification of surface water in Europe and North America; trends, biological recovery and heavy metals. SNO 4208/2000, ICP Waters report 52/2000, Norwegian Institute for Water Research, 108 pp.
Skjelkvåle, B. L., Stoddard, J. L., Jeffers, J. N. R., Tørseth, K., Høgåsen, T., Bowman, J., Mannio, J., Monteith, D., Mosello, R., Rogora, M., Rzychon, D., Veselý, J., Wieting, J., Wilander, A. and Worsztynowicz, A. 2004. Regional scale evidence for improvements in surface water chemistry 1990-2001. Environmental Pollution (in review)

72
Skjelkvåle, B.L. 2003. The 15-Year Report: Assessment and Monitoring of Surface Waters in Europe and North America; Acidification and Recovery, Dynamic Modeling and Heavy Metals. ICP Waters Report 73/2003, Norwegian Institute for Water Research, Oslo, Norway.
Thomsen, M.G. and Nelleman, C. 1994. Isolation of natural factors affecting crown density and crown color in coniferous forests: Implications for monitoring of forest decline, Ambio 23, 251-254
Ulrich, B. 1981. Destabilisierung von Waldökosystemen durch Akkumulation von Luftverunreinigungen. Der Forst- und Holzwirt 36, 21: 525-532.
UNECE 2000. Document EB.AIR/WG.1/2000/8, United Nations Economic Commission for Europe, Geneva.
UNECE 2002. Document EB.AIR /WG.1/2002/10, United Nations Economic Commission for Europe, Geneva.
UNECE 2003. Document EB.AIR/WG.1/2003/8, United Nations Economic Commission for Europe, Geneva.
UNECE&EC 2002. Intensive Monitoring of Forest Ecosystems in Europe. Technical Report 2002. UNECE and EC, Geneva and Brussels, 105 pp.
Ukonmaanaho L., Starr, M., Mannio, J. and Ruoho-Airola, T. 2001. Heavy metal budgets for two headwater forested catchments in background areas of Finland. Environmental Pollution 114: 63-75.
Van den Hout K.D. (editor) 1994. The impact of Atmospheric Deposition of Non-acidifying Pollutants on the Quality of European Forest Soils and the North Sea, Main report of the ESQUAD Project, Ministry of Housing, Spatial Planning and the Environment, Den Haag, The Netherlands.
Vuorenmaa, J., Kleemola, S. and Forsius, M. 2000. Trend assessement of deposition, runoff water fluxes and water chemistry at European ICP Integrated Monitoring sites. Verh. Internat. Verein. Limnol. 27: 384-390.
Wentzel, K.F. 1980. Weißtanne = immissionsempfindlichste einheimische Baumart. Allgemeine Forstzeitschrift 35, 14: 373-374.
WHO 2000: Air Quality Guidelined for Europe, Second Edition. WHO Regional Publications, European Series, No. 91.
WHO 2002: The World Health Report 2002: Reducing risks, promoting healthy life.
WHO 2003a: Health aspects of air pollution with particulate matter, ozone and nitrogen dioxide. WHO 2003 (E79097). http://www.euro.who.int/document/e79097.pdf
WHO 2003b. Joint WHO/Convention Task Force on Health Aspects of Air Pollution. Health risks of persistent organic pollutants from long range transboundary air pollution. WHO 2003 (E78963). http://www.euro.who.int/Document/e78963.pdf
WHO 2004. Health Aspects of Air Pollution - answers to follow up questions from CAFÉ. (In print.)
Wright, R.F., Alewell, C., Cullen, J.M., Evans, C.D., Marchetto, A., Moldan, F., Prechetel, A. and Rogara, M. 2001. Trends in nitrogen deposition and leaching in acid-sensitive streams in Europe. Hydrol. Earth Syst. Sci. 5, 299-310.
Wright, R. F. and Mette C.L. (editors) 2002. Workshop on Models for Biological Recovery from Acidification in a Changing Climate. 9-11 September 2002, Grimstad, Norway. Workshop Report. SNO 4589-2002, Norwegian Institute for Water Research, 42 pp.

73
Annex I List of effects-related meetings under the Convention as compiled from the reports of the Executive Body and the Working Group on Effects. Only the first Task Force meetings of the International Cooperative Programmes (ICPs) of the Working Group on Effects have been included. The list is not exhaustive but attempts to capture the most important meetings. 1981 27-30 April 1981
Geneva, Switzerland
First meeting of the Working Group on Effects of Sulphur Compounds on the Environment
1984 5-8 March 1984
Geneva, Switzerland
Third meeting of the Working Group on Effects
4-6 Jun 1984 Group of experts on cost and benefit analysis 1985 2-4 Oct 1985 Freiburg, Federal
Republic of Germany (FRG)
Workshop on methodologies for assessment and monitoring of air pollution effects on forests
4 Oct 1985 Freiburg, FRG First meeting of the Programme Task Force, International Cooperative Programme (ICP) on Assessment and Monitoring of Air Pollution Effects on Forests
1986 February/ March 1986
United Kingdom Workshop on effects of acid and acidifying compounds on materials
11 Mar 1986 Watford, United Kingdom
First meeting of the Programme Task Force, ICP on Effects of Air Pollution on Materials, Including Historic and Cultural Monuments
27 Apr 1986 Grafenau, FRG First meeting of the Programme Task Force, ICP on Assessment and Monitoring of Acidification of Rivers and Lakes
Apr/May 1986 FRG Two workshops on monitoring of acidification of rivers and lakes (chemical and biological)
5-9 May 1986 Amsterdam International conference on acidification and it policy implications (organized by the government of Netherlands in cooperation with UNECE)
1987 1-3 Dec 1987 Sutton Bonington,
United Kingdom First meeting of the Programme Task Force, ICP on Effects of Air Pollutants and Other Stresses on Agricultural Crops (currently: ICP on Effects of Air Pollution on Natural Vegetation and Crops)
9-11 Feb 1987 Geneva, Switzerland
First session of the Task Force on Integrated Assessment of Costs and Benefits (currently: Task Force in Integrated Assessment Modelling, Working Group on Strategies and Review)
23-26 Jun 1987 Stockholm, Sweden Workshop on integrated monitoring September/ October 1987
Soviet Union Workshop on biomonitoring of acidification of rivers and lakes (ICP Waters)

74
1988 14-18 March 1988
Bad Harzburg, FRG Workshop on critical levels for direct effects of air pollution on forests, crops and materials
21-24 Mar 1988
Skokloster, Sweden Workshop on critical loads for sulphur and nitrogen
5-6 May 1988 Geneva, Switzerland
Designated experts on the extent of acidification in rivers and lakes
5-7 Oct 1988 Finland Workshop on the specification of integrated monitoring, reporting and evaluation procedures
1989 16-17 Jan 1989 Geneva,
Switzerland Consultation of designated experts on the critical load approach
6-9 Nov 1989 Bad Harzburg, FRG First meeting of the Task Force on Mapping of Critical Levels and Loads (currently: ICP Modelling and Mapping of Critical Loads and Levels and Air Pollution Effects, Risks and Trends)
1990 25-27 Jun 1990 Bilthoven,
Netherlands Training session (1st) on mapping critical loads and levels (Coordination Center for Effects – West, Task Force on Mapping of Critical Levels and Loads)
1991 14-16 Jan 1991 Bilthoven,
Netherlands Training session (2nd) on mapping (Coordination Center for Effects – West)
28-31 Oct 1991 Aberdeen, United Kingdom
Workshop on linking hydrochemical and biological models under the pilot programme on integrated monitoring
1992 14-16 Jan 1992 Bilthoven,
Netherlands Workshop of the Coordination Centre for Effects on mapping critical loads and levels
23-25 Mar 1992
Egham, United Kingdom
Workshop on critical levels for SO2, NOx, NH3 and ozone
6-10 Apr 1992 Lökeberg, Sweden Workshop on critical loads for nitrogen 9-11 Sep 1992 Katowice, Poland Workshop of the Coordination Center for Effects on
mapping critical loads and levels 1993 9-10 Feb 1993 Silkeborg,
Denmark First meeting of the Programme Task Force, ICP on Integrated Monitoring of Air Pollution Effects on Ecosystems
16-19 Mar 1993
Madrid, Spain Workshop (4th) of the Coordination Center for Effects
24-26 Mar 1993
Bath, United Kingdom
Workshop on critical levels for buildings and materials, including cultural heritage
March 1993 Madrid, Spain Workshop on review of maps of nitrogen critical loads 29 Jun-2 Jul 1993
Baykalsk, Russian Federation
Workshop on biological monitoring, importance of intercalibration and role of seasonal dynamic processes
17-18 Sep 1993
Prague, Czech Republic
Workshop on integrated monitoring
1-4 Nov 1993 Bern, Switzerland Workshop on critical levels for ozone

75
1994 24-27 Jan 1994 Stockholm, Sweden Joint ICPs meeting 14-17 Mar 1994
Nancy, France Workshop (5th) of the Coordination Center for Effects
9-11 May 1994 United Kingdom Workshop on the economic evaluation of acidification damage
1995 23-24 Feb 1995
Vienna, Austria Workshop on critical loads in alpine regions
6-7 Mar 1995 Oslo, Norway Workshop on effects of nitrogen on integrated monitoring 15-16 Mar 1995
Oslo, Norway Workshop on trends in effects of air pollution on the environment
3 & 7 Apr 1995
Helsinki, Finland Workshop on dynamic modelling (Coordination Center for Effects, Task Force on Mapping of Critical Levels and Loads)
4-6 Apr 1995 Helsinki, Finland Workshop (6th) of the Coordination Center for Effects 1996 18-21 Mar 1996
Budapest, Hungary Workshop (7th) of the Coordination Center for Effects
15-17 Apr 1996
Kuopio, Finland Critical levels for ozone in Europe: testing and finalizing the concepts
10-12 Jun 1996 Eastbourne, United Kingdom
International workshop on health effects of ozone and nitrogen oxides an integrated assessment of air pollution
1997 23 Mar 1997 Dwingeloo,
Netherlands Dynamic model training session (ICP Integrated Monitoring)
21-24 Apr 1997
Galway, Ireland Workshop (8th) of the Coordination Center for Effects
15-19 Sep 1997
Asa, Sweden Workshop on field procedures and statistical layout of vegetation and soil integrated monitoring (ICP Integrated Monitoring)
8-11 Oct 1997 Madrid, Spain Workshop on advanced data analysis for modelling and assessment of biogeochemical effects of air pollution in temperate ecosystems (ICP Integrated Monitoring)
3-7 Nov 1997 Bad Harzburg, Germany
Workshop on critical limits and effects-based approaches for heavy metals and POPs
1998 13 Jan 1998 Wageningen,
Netherlands Workshop on using artificial neural networks to model environmental data
11-14 May 1998
Kristiansand, Norway
Workshop (9th) of the Coordination Center for Effects
25-27 May 1998
Berlin, Germany Workshop on the quantification of the effects of air pollutants on materials
24-25 Aug 1998
Geneva, Switzerland
First meeting of the Joint Task Force on the Health Aspects of Air Pollution
12-13 Oct 1998 Zakopane, Poland Workshop on biological assessment and monitoring (ICP Waters and ICP Integrated Monitoring)

76
1999 11-15 Apr 1999
Gerzensee, Switzerland
Workshop on critical levels for ozone - level II
19 Apr 1999 Wallingford, United Kingdom
Workshop on integrated monitoring
May 1999 Rome, Italy Workshop on national integrated assessment modelling (Task Force on Integrated Assessment Modelling, EMEP)
15-18 Jun 1999 Prague, Czech Republic
Workshop (10th) of the Coordination Center for Effects
12-15 Oct 1999 Schwerin, Germany Workshop on effects-based approaches for heavy metals (Bad Harzburg follow-up workshop, organized by the Task Force on Mapping)
21-25 Nov 1999
Copenhagen, Denmark
Conference on critical loads for acidity and eutrophication: criteria, concepts and biological indicators
2000 5-7 Apr 2000 Edinburgh, United
Kingdom Task Force meeting of the ICP Modelling and Mapping of Critical Loads and Levels and Air Pollution Effects, Risks and Trends (earlier: Task Force on Mapping of Critical Levels and Loads)
10-12 April 2000
Stockholm, Sweden Workshop to examine the scientific need for future revisions to the Protocol to Abate Acidification, Eutrophication and Ground-level Ozone (“Saltsjöbaden I”)
4 May 2000 Vilnius, Lithuania Workshop on integrated monitoring 17-18 May 2000
Brussels, Belgium Workshop on the future development of the forest condition monitoring programme, organized by the European Commission in cooperation with ICP Forests
14-16 Jun 2000 Stockholm, Sweden Workshop on mapping air pollution effects on materials, including stock at risk
3-5 Oct 2000 Ystad, Sweden Expert workshop on dynamic modelling (1st meeting) (currently: Joint Expert Group on Dynamic Modelling)
11-13 Oct 2000 Bratislava, Slovakia Ad-hoc international expert group meeting on effect-based critical limits for heavy metals
2001 19-20 Feb 2001
London, United Kingdom
Workshop (1st) on the measurement and economic valuation of health effects associated with air pollution (Network of Experts on Benefits and Economic Instruments, Working Group on Strategies and Review; earlier: Task Force on Economic Aspects of Abatement Strategies)
19-21 Mar 2001
York, United Kingdom
Workshop on chemical criteria and critical limits for steady-state and dynamic modelling
24-27 Apr 2001
Bilthoven, Netherlands
Workshop (11th) of the Coordination Center for Effects (ICP Modelling and Mapping)
3 May 2001 Rome, Italy Workshop on integrated monitoring 6-8 Nov 2001 Ystad, Sweden Joint Expert Group on Dynamic Modelling (2nd meeting) 2002 24-25 Jan 2002 Laxenburg, Austria Workshop Modelling on uncertainty management in
integrated assessment modelling (Task Force on Integrated Assessment Modelling, EMEP)
18-21 Mar 2002
Lillehammer, Norway
Workshop on heavy metals (Pb, Cd and Hg) in surface waters: monitoring and biological impact (ICP Waters)

77
14-17 Apr 2002
Sorrento, Italy Workshop (12th) of the Coordination Center for Effects
24 Apr 2002 Prague, Czech Republic
Training workshop on dynamic modelling (ICP Integrated Monitoring)
25 Apr 2002 Prague, Czech Republic
Workshop on integrated monitoring
16-19 Jun 2002 Harrogate, United Kingdom
Ad hoc expert panel meeting on modelling of ozone flux and deposition to vegetation (ICP Vegetation and EMEP)
2-4 Oct 2002 Netherlands Workshop (2nd) on the valuation of ecosystem benefits from air pollution abatement (Network of Experts on Benefits and Economic Instruments, Working Group on Strategies and Review)
6-8 Nov 2002 Sitges, Spain Joint Expert Group on Dynamic Modelling (3rd meeting) 11-13 Nov 2002
Bern, Switzerland Workshop on empirical critical loads for nitrogen deposition on (semi-) natural ecosystems
19-22 Nov 2002
Gothenburg, Sweden
Workshop on Establishing ozone critical levels II
December 2002
Berlin, Germany Expert meeting on critical limits for heavy metals and methods for their application
2003 8 May 2003 Helsinki, Finland Workshop on integrated monitoring 12-14 May 2003
Munich, Germany Workshop on release of heavy metals from materials due to corrosion
19-21 May 2003
Tartu, Estonia Workshop (13th) of the Coordination Center for Effects
Autumn 2003 Sweden Workshop on critical limits for heavy metals Autumn 2003 Netherlands Workshop on air pollution damage to materials, in particular
to cultural heritage (Network of Experts on Benefits and Economic Instruments, Working Group on Strategies and Review)
October 2003 Strausberg, Germany
Expert panel meeting on heavy metals (ICP Modelling and Mapping)
6-8 Nov 2003 Sitges, Spain Joint Expert Group on Dynamic Modelling (4th meeting) 26-28 Nov 2003
Gothenburg, Sweden
Workshop on base cation deposition (Working Group on Effects and EMEP)
2-4 Dec 2003 Berlin, Germany Expert meeting on critical limits for heavy metals and methods for their application
2004 4-5 Mar 2004 Potsdam, Germany Workshop on critical loads for heavy metals 29-30 Mar 2004
Brussels, Belgium Workshop on mercury and its environmental problems
6 May 2004 Molln, Austria Workshop on integrated monitoring 24-25 May 2004
Laxenburg, Austria Workshop (14th) of the Coordination Center for Effects
25-27 Oct 2004 Gothenburg, Sweden
Review and assessment of European air pollution policies (“Saltsjöbaden II”)
28-29 Oct 2004 Sitges, Spain Joint Expert Group on Dynamic Modelling (5th meeting)