reverse logistics - current chain and analyse
TRANSCRIPT

REVERSE LOGISTICS – CURRENT CHAIN AND ANALYSIS
Project Report in Jerónimo Martins
Carla Sofia Bessa de Sousa
Project Report Master in Management
Supervised by: Professor Catarina Judite Morais Delgado
Tutor in Jerónimo Martins: Ana Rita Pereira
2019

i
Biographical Note
Carla Sofia Bessa de Sousa, born on September 25, 1996 in Castelões de Cepeda, Paredes.
Carla grew up and lived in Sobrosa and attended the Secondary School of Paredes until the
moment she entered the university.
Her adolescence was marked by extracurricular activities, such as swimming, Classical Ballet
Dance and theatre. It was these activities that allowed her to grow happily and develop the
tools that would help her face the challenges that were approaching.
She entered the Economics course at the University of Minho in Braga, and it was during
this period that she had her first experience outside Portugal, studying for a semester at the
University of Milano Bicocca in Milan as part of the Erasmus Programme. The six months
lived there were an extremely enriching period of intense personal and academic learning.
In 2017, she would join the Faculty of Economics of the University of Porto, opting for the
Master of Management, fully taught in English and where this master’s dissertation is
included. The second year of the master’s degree was marked by the development of this
company project in partnership with the Jerónimo Martins Group, and by Carla’s entrance
into the labor market in another company, the Mota-Engil Group as a Trainee in the
Financial and Logistics Areas.

ii
Acknowledgements
Firstly, I would like to express my gratitude to Jerónimo Martins and Dr. Rui Matos for the
possibility of finalizing my master’s degree together with this leading company and a very
special thanks to Ana Rita Pereira for her orientation, availability and tireless support
throughout the course of this study.
A particular appreciation to the employees of the Reverse Logistics warehouse and from the
stores, for the time provided in interviews and demonstrations of the work carried out.
I would like to thank my family, my parents Carla and José and my sisters Marina and Joana
for all the essential support they have given me over the past year.
To my boyfriend Pedro Vinhas, I would like to thank him for his patience, support and
encouragement during the production period of this work.
To my co-workers at Mota-Engil, I would also like to thank them for their support and care.
I would also like to thank my supervisor, Professor Catarina Delgado, for her orientation in
the development of this dissertation.
Finally, the support of ERDF – European Regional Development Fund through the
Operational Programme for Competitiveness and Internationalisation - COMPETE 2020
Programme and the Portuguese funding agency, FCT - Fundação para a Ciência e a
Tecnologia within project POCI-01-0145-FEDER-031821 is acknowledged.

iii
Abstract
Reverse Logistics (RL) start appearing some decades ago, first as an extra expense without
any utility, but as the competitive advantages began to be visible, as well as the economic and
operational benefits, and in the relations with the diverse organizational partners, increasingly
more companies began to adopt RL practices. This concept means the process of return of
products and materials from de point of consumption or selling, to the primary supplier or
another point of collection, in order to recover some value from it. This matter implies a
concern of companies with all the entire life cycle of the product. More that apply legislation
rules, there is a growing concern and pressure from consumers, suppliers and the whole
society itself, to make companies take responsibility for what they sell and/or produce.
Taking a real case of a company in Portugal, Jerónimo Martins, this project intends to
describe what is actually being done on this area. The first objective here is to Know the
company, the area and the motivations and benefits perceived by the company. Additionally,
the objectives that follow are to Describe and Understand, by realizing what type of
processes exist, how products return and what is their recovery plan. By mapping this
information and by exploring the difficulties that appear in the daily operations, its intend to
propose improvement guidelines to increase the overall efficiency of this reverse supply
chain in the company. This thesis also expects to fill the lack of real case studies in the
literature on Reverse Logistics, by providing new literature for both investigators, society and
business partners, showing what is happening on this area, how reverse logistics can be a
competitive advantage and what can be the next steps.
Keywords: Reverse Logistics, Processes Description, Competitive Advantage and
Improvement.

iv
Resumo
A Logística Inversa começou a surgir há algumas décadas, primeiro como uma despesa extra
e sem qualquer utilidade, mas à medida que as vantagens competitivas começaram a ser
percecionadas, bem como os benefícios económicos e operacionais, e nas relações com os
diversos parceiros organizacionais, cada vez mais empresas começaram a adotar práticas de
logística inversa. Este conceito significa o processo de devolução de produtos e materiais
desde o ponto de consumo ou venda, ao fornecedor primário ou outro ponto de recolha, de
forma a recuperar algum valor do mesmo. Esta questão implica uma preocupação das
empresas com todo o ciclo de vida do produto. Mais do que aplicar a legislação, há uma
crescente preocupação e pressão dos consumidores, fornecedores e de toda a sociedade para
que as empresas assumam a responsabilidade pelo que vendem e/ou produzem.
Tomando um caso real de uma empresa em Portugal, Jerónimo Martins, este projeto
pretende descrever o que está efetivamente a ser feito nesta área. O primeiro objetivo é
Conhecer a empresa, a área e as motivações e benefícios percebidos pela empresa.
Adicionalmente, os objetivos que se seguem são Descrever e Compreender, através da
perceção do tipo de processos que existem, como os produtos retornam e qual é o seu plano
de recuperação. Ao mapear essas informações e explorar as dificuldades que surgem nas
operações diárias, pretende-se propor diretrizes de melhoria para aumentar a eficiência geral
dessa cadeia reversa de suprimentos na empresa. Esta tese também pretende suprir a falta de
estudos de caso reais na literatura sobre Logística Reversa, fornecendo nova literatura para
pesquisadores, sociedade e parceiros de negócios, mostrando o que está acontecendo nessa
área, como a logística reversa pode ser uma vantagem competitiva e quais podem ser os
próximos passos.

v
Table of Contents
1. Introduction ............................................................................................................................................ 1
1.1 General Framework ..................................................................................................................... 1
1.2 Main Objectives ............................................................................................................................ 3
1.3 Structure .......................................................................................................................................... 3
2. Literature Review................................................................................................................................... 4
2.1 Theoretical framework: Supply Chain and Sustainability ............................................... 4
2.2 Reverse Logistics .......................................................................................................................... 6
2.2.1 Reverse Logistics: Definition and Scope .......................................................................... 6
2.2.2 Why? Drivers for organizations having Reverse Logistics practices ....................... 8
2.2.3 Why? Return Reasons for Reverse Logistics .....................................................................11
2.2.4 What? Types and Characteristics of Returns ................................................................13
2.2.5 How? Processes and Activities of Reverse Logistics ..................................................14
2.2.6 Who? Actors in Reverse Logistics Practices ..................................................................18
2.2.7 Costs of Reverse Logistics ..................................................................................................18
2.3 Retail Sector and Reverse Logistics Management ...........................................................19
2.4 Chapter Summary .......................................................................................................................20
3 Methodology .........................................................................................................................................22
3.1 Research Methodology .............................................................................................................22
3.2 Process of Data Collection and Analysis .............................................................................23
3.3 General and Specific Objectives ............................................................................................23
4 Case Description ..................................................................................................................................25
4.1 Jerónimo Martins ........................................................................................................................25
4.2 Contextualization .......................................................................................................................26
5 Discussion and Analysis of Results ...............................................................................................29
5.1 Characterization of Alfena Logistics Center and the Reverse Logistics
Warehouse ..................................................................................................................................................29

vi
5.1.1 Evolution of the Reverse Logistics Area in the North of Portugal .........................32
5.2 Drivers for Reverse Logistics and Benefits ........................................................................33
5.3 Types of Returns.........................................................................................................................36
5.3.1 Area of Returns (AR) ............................................................................................................37
5.3.2 Area of Transportation Assets (ATAS) ............................................................................44
5.3.3 Other Reverse Flows Identified .........................................................................................47
5.3.4 Summary of Types of Returns ...........................................................................................47
5.4 Difficulties Identified ................................................................................................................49
5.4.1 Difficulties at Stores’ level ...................................................................................................52
5.5 Monetary Costs and Gains.......................................................................................................52
5.6 Improvement Guidelines .........................................................................................................54
5.6.1 Improvements that require Investment and a Superior Decision: .........................54
5.6.2 Improvements that require Investment, a Superior Decision and Time ..............56
5.6.3 Improvements that do not require Investment, but Time and a Superior
Decision ..................................................................................................................................................57
6 Conclusion .............................................................................................................................................60
6.1 Main Contributions....................................................................................................................60
6.2 Limitations and Future Work .................................................................................................63
7 References ..............................................................................................................................................64
8 Annexes ..................................................................................................................................................67

vii
Index of Tables
Table 1 - Summary of the dimensions identified by Brito and Dekker (2003) - Own
elaboration .......................................................................................................................................... 8
Table 2 - Jerónimo Martins Business Segments ........................................................................ 25
Table 3 - Distribution of Human Resources associated with Reverse Logistics Operations
............................................................................................................................................................ 30
Table 4 – Volumes of waste collected - Country and Alfena Logistics Center - 2018 ........ 44
Table 5 - Volumes managed according to KPIs from 2014 to 2018 (values in units of
product) ............................................................................................................................................. 48
Table 6 - Volumes of Managed Merchandise – 2018 (values in units of product) ............... 49
Table 7 - Costs and Gains associated with the Reverse Logistics Warehouse 2013 and 2018
............................................................................................................................................................ 53
Table 8 – Application of the Five Dimensions of Brito and Dekker (2003) to the Jerónimo
Martins case ...................................................................................................................................... 61

viii
Index of Figures
Figure 1 - Driving triangle for reverse logistics (Brito & Dekker, 2003) ................................. 9
Figure 2 - Multi-perspective framework for RL implementation (Govindan & Bouzon,
2018) .................................................................................................................................................. 11
Figure 3 - Possible moments of return in the product’s life (Ait-Kadi, Chouinard, Marcotte,
& Riopel, 2012) ................................................................................................................................ 14
Figure 4 - Forward and Reverse Flows and Processes (adapted from Agrawal, Singh, and
Murtaza (2015)) ................................................................................................................................ 15
Figure 5 - Types of Collection Processes (adapted from Agrawal et al. (2015)) ................... 16
Figure 6 - Centralized vs Decentralized Network Models (adapted from C. Deloitte (2014))
............................................................................................................................................................ 18
Figure 7 - Steps of Methodology ................................................................................................. 22
Figure 8 - Three Stages of the Project ........................................................................................ 24
Figure 9 - Evolution of the Number of Pingo Doce Stores .................................................... 26
Figure 10 - Plant of the Reverse Logistics Warehouse in the Alfena Logistics Centre ....... 32
Figure 11 - Map of Operations of the Reverse Flow of Seasonal Returns and Regrouping
............................................................................................................................................................ 41
Figure 12 - Map of Operations of the Reverse Flow of Recyclable Waste ........................... 43
Figure 13 – Number of Ecopoints in the country and associated with the Alfena Logistics
Center ................................................................................................................................................ 44
Figure 14 - Map of Operations of the Reverse Flow of Transportation Assets ................... 45
Figure 15 – Distribution of Sales of Transportation Assets by Type ..................................... 46

ix
Abbreviations and Acronyms
ALC – Alfena Logistics Center
AR - Area of Returns
ATAS – Area of Transportation Assets
JM – Jerónimo Martins
LC – Logistics Center
LCM - Logistics Chain Management
LM – Logistics Management
RL – Reverse Logistics
RLW – Reverse Logistics Warehouse
SC – Supply Chain
SCM – Supply Chain Management
SD - Sustainable Development
SSCM - Sustainable Supply Chain Management
TAS – Transportation Assets

1
1. Introduction
This first chapter intends to present the lector the general framework of the theme, the
motivation, as well as explain the main objective of the project and its structure.
1.1 General Framework
This dissertation project results from a partnership with Jerónimo Martins (JM), under
the Academic Thesis Program, which aims a collaboration between universities and the company
with the objective of developing new and relevant approaches for the food retail sector. The
program it is variable-length stage, which allows the trainee to interact on-the-job with the
business reality and improve their technical and transversal skills. Every year, themes and
challenges identified by the different business areas of the group are proposed. These
challenges lead the trainee to delve into the retail universe, thereby developing solutions to
the challenges posed. The information collected in this process, as well as the results
obtained, constitute subsequently the final thesis work required. The challenge selected for
this dissertation is “Reverse Logistics: Assessing the Current Chain and Opportunities”, and the
company gave freedom to how the topic could be developed. Being so, the purpose of this
work is to describe the Reverse Logistics practices that are present in this company and
analyze them critically. This internship does not constitute a work stage, allowing only the
student access to the facilities and its work records.
In recent decades, the increased competitiveness of the market and the shift of power
from seller to customer has led retailers to focus increasingly on managing their Supply
Chains (SC) in an attempt to make them as efficient and profitable as possible. In the 1990s,
the need to serve the customer more and better led to Logistics and Supply Chain
Management (SCM) becoming essential skills in the retail market (Fernie & Sparks, 2004).
Therefore, the growing interest in these areas, allied to the major environmental concerns of
society, has aroused a growing interest in the concept of Reverse Logistics and its practices.
This is evident at the academic level, with the growing number of articles and publications
made in the main newspapers and magazines in the field (Rubio, Chamorro, & Miranda,
2008). On the other hand, retail companies are facing increasing uncertainty about consumer
demand, as seasonality of sales and ongoing promotional campaigns throughout the year, a
common feature of the largest retail chairs, make it even more difficult to predict the volume

2
of demand accurately. In response to this uncertainty in demand, ensuring that the quantity
of items in stock is sufficient and that the company will not incur excessive purchase costs,
establishing return contracts with suppliers for surplus goods is an extremely important
measure for retail (A. Taylor, 2002). Consequently, it is becoming increasingly important to
improve the way in which reverse logistics is managed within each company, so that it ceases
to be labeled as “the forgotten child of the supply chain” (Morrell, 2001).
The implementation of an effective and efficient reverse logistics chain is crucial not only
for the retail company itself, but for all other market players, such as primary suppliers and
customers themselves. Since only with an efficient system will it be possible to achieve the
multiple benefits derived from this area and minimize the costs of its processes (Jack, L.
Powers, & Beitelspacher, 2010). Even so, it can be said that reverse logistics has always been
done in any business, even under another name, in greater or smaller quantity, with more or
less developed processes, in stores or in warehouses, with more or less costs / gains
associated and with more or less efficiency. This combination of factors depends, among
other reasons, on the know - how that exists within the company on the subject, on the effort
applied by managers in solving problems and improving processes and on the initial and
continuous investment that the company is willing to make.
With high business volumes and great prospects of growth, retail appears in Portugal as
one of the most attractive and competitive markets in the country. In 2018, retail sales1 in
Portugal accounted 20.945 million euros2, representing around 10%2 of Portuguese GDP3.
Jerónimo Martins is one of the leaders in Portugal, along with Sonae, where efficiency and
planning are key words in the day to day of all its collaborators. No company can survive
and be a leader if it does not keep up with the constant evolution and the new and ever more
demanding needs of society. Therefore, and given both the current size and the growth of
the group, dealing with returns and any other type of return in the most efficient way
possible, it is crucial and an ongoing task. As will be seen, it holds benefits at various levels,
both in the relations with customers and suppliers, in the efficiency obtained between the
departments within the group, and even in the reduction of costs and direct monetary gains,
that can only be achieved in this logistics area. Jerónimo Martins is one of the more relevant
retail companies in Portugal and Reverse Logistics has been proving that, more than an
1 Includes food and non-food retail sectors. 2 Data collected from Associação Portuguesa de Empresas de Distribuição (APED). 3 Gross Domestic Product.

3
aspiration in the business world, it is a reality that must continually be investigated and
perfected by organizations, where Jerónimo Martins is no exception.
1.2 Main Objectives
In order that to all the research and work to develop with the greatest focus and rigor,
general and specific objectives must be established, as well as a research problem. However,
in this introductory chapter, it is only important to highlight the main objective of this work,
which is to provide the company with detailed and precise information on how this area of
reverse logistics works and provide guidelines for improvements.
1.3 Structure
Given that, this project results from a partnership with a real company, and both the
presented data and the challenges / problems are real, and the proposed improvements can
effectively be implemented, this dissertation constitutes a Company Project. In order to
achieve the proposed objectives, the present project study will be organized into six chapters.
In the first chapter, we present an overview of the study, from the context of the study
and its relevance, both to the organization under study and to society in general, to the main
objective and structure of the project.
In the second chapter, a bibliographical review will be carried out on the main aspects
related to Reverse Logistics, with the most relevant studies in the field being presented.
In the following chapter, the methodology used to produce the project is presented and
described in detail. The objectives of the work and the way in which data collection and
analysis have been made will also be presented here.
The fourth chapter describes the case, the company under analysis, and the department
targeted in the project. A brief contextualization is provided before the discussion of results.
The following chapter consists of the project itself, with the analysis and discussion of
results, which includes the presentation of process maps and guidelines for improvements.
Finally, in sixth and last chapter, a brief conclusion will be made, with the main results
obtained, the limitations of the research, and showing how this project can be as an example
for other companies in the sector and be an asset to the academic environment.

4
2. Literature Review
In this second chapter, a literature review on reverse logistics is conducted. The main
objective is to present to the reader the main dimensions of this concept, as well as its
evolution over time, also emphasizing its growing importance. It will begin the framing of
the theme, followed by an evolution of the concept of RL, and a framework developed by
Brito and Dekker (2003) will be used to describe the five main dimensions of the study of
RL, followed by an analysis of logistics costs and a brief contextualization of the retail sector.
The chapter ends with a presentation of the most relevant studies carried out so far.
2.1 Theoretical framework: Supply Chain and Sustainability
Allied with globalization, there was a need for efficiency and for provide a better service
to the final consumer, which led to the development of the concept of Supply Chain
Management, especially by large retail companies but also by the academic community
(Fernie & Sparks, 2004). According with Ganeshan and Harrison (1995), the so-called
traditional supply chain is a set of physical and information facilities, responsible for the
provision and transformation of materials into intermediate products and then final
products, and for their distribution to the final consumer. The supply chain exists in the form
of a manufacturing company, or provider of services and products, and its complexity
depends on the industry and from organization to organization.
It was during the nineties that the paradigm of company management changed, and the
success of a business began to depend on a company’s ability to integrate an extensive
network of business relationships into its management (Lambert, Cooper, & D. Pagh, 1998).
In 2013, the Council of Supply Chain Management Professionals (CSCMP, 2013), define SCM as
“the planning and management of all activities involved in sourcing and procurement, conversion, and all
logistics management activities. Also includes coordination and collaboration with channel partners, which
can be suppliers, intermediaries, third-party service providers, and customers (...) It includes all of the logistics
management activities noted above, as well as manufacturing operations, and it drives coordination of processes
and activities with and across marketing, sales, product design, finance and information technology”.
Regarding the Logistics Chain Management (LCM), this is a subject that has received
significant attention over the years, and includes a set of procedures that aim to efficiently
and effectively integrate suppliers, manufacturers, warehouses, and stores, with the objective

5
of produce and distribute products, in the right quantities and at the right time and place,
minimizing costs and meeting the service requirements expected by the final consumer
(David Simchi-Levi, Kaminsky, & Simchi-Levi, 2003). In addition, the CSCMP establish
Logistics as “that part of supply chain management that plans, implements, and controls the efficient,
effective forward and reverse flow and storage of goods, services, and related information between the point of
origin and the point of consumption in order to meet customers’ requirements. Logistics management activities
typically include inbound and outbound transportation management, fleet management, warehousing,
materials handling, order fulfillment, logistics network design, inventory management, supply/demand
planning, and management of third party logistics services providers” (CSCMP, 2013). Logistics
Management (LM) integrates logistics activities with other functions, including marketing,
sales, manufacturing, finance, and information technology, and this definition constitutes
one of the most complete one, since it considers the reverse flow of goods, services and
information (CSCMP, 2013). It is important to note that, although directly related, the
concepts of Supply Chain and Logistics are different, as are their management (Frazelle,
2002).
In recent years, the exhaustive exploitation of the planet’s natural resources and the
growing social awareness of environmental problems have started to shape the way in which
SCM is faced by companies. As a result, sustainability has become a fundamental factor to
take into account in Supply Chain Management (Barbosa-Povoa, 2009). The concept of
Sustainable Development (SD) is relatively new, and was defined by the World Commission on
Environment and Development (WCED, 1987) as the “development that meets the needs of the present
without compromising the ability of future generations to meet their own needs”. In 2008, the authors
Seuring and Müller (2008) conducted a study, through which they analyzed 191 papers
published between 1994 and 2007, in order to identify the major issues raised by specialists
for Sustainable Supply Chain Management (SSCM). The authors defined the SSCM as the
entire management of material, information and capital flows, while considering the three
dimensions of sustainability, economic, environmental and social. The same study also
highlighted the high costs and the complexity and coordination effort required as the main
barriers to a sustainable supply chain management.
In an uncertain context of product demand, and with increasing environmental pressure
on supply chain management, the need to incorporate Reverse Logistics within companies
is becoming evident. Although costly, the implementation of these practices may result in

6
economic benefits, namely with the recovery of products, and in greater flow flexibility that
tends to create a more profitable network (Cardoso, Barbosa-Póvoa, & Relvas, 2013).
2.2 Reverse Logistics
2.2.1 Reverse Logistics: Definition and Scope
Activities such as the return, recycling and recovery of products dates from long ago, and
terms such as “Reverse Channels” or “Reverse Flows” have already appeared in the literature of
the 1970s, but mostly in the scope of recycling (Guiltinan & Nwokoye, 1974) (Ginter &
Starling, 1978). The research of Quesada (2003) goes back even further, and points Terry
(1869) and Beckley and Logan (1948) as one of the main and first authors to address returns,
but without referring to them as Reverse Logistics Flows.
The use of the concept of Reverse Logistics as such, took some years, being Murphy and
Poist (1988) pioneering authors in this field, defining RL as “the movement of goods from a consumer
towards a producer in a channel of distribution”. Through this definition, these authors pointed out
the direction to follow, and which flows to consider as Reverse Logistics flows. From this
concept, two aspects can be concluded: first, any product that meets the given condition is
considered part of the RL flows; second, the agent identified as “producer” is not necessarily
the original producer. Doubts about this concept may arise regarding the Reverse Logistics’
distribution channel, as being the one previously used in the forward flow or another one
created for this purpose (Quesada, 2003).
In 1992, the first international publication of the definition of reverse logistics was made
by the Council of Logistics Management (CLM), with Stock (1992) defining RL as “… the
term often used to refer to the role of logistics in recycling, waste disposal, and management of hazardous
materials; a broader perspective includes all relating to logistics activities carried out in source reduction,
recycling, substitution, reuse of materials and disposal.”. From this year on, the concept and the
proper practice of it acquired more relevance, more specifically with the works of Stock
(1992), Stock (1998), Tibben-Lembke and Rogers (1998), Brito and Dekker (2003) and de
Brito, Dekker, and Flapper (2003)
Soon after, Pohlen and Farris (1992) wondered about the real meaning of “recyclable” in
the definition, and drew their attention to whether or not recyclable materials had to return
through the same supply channel.
7
A year later, Kopicki (1993) relied on previous concepts to define RL as “a broad term
referring to the logistics management and disposing of hazardous or non-hazardous waste from packaging and
products. It includes reverse distribution (…) which causes goods and information to flow in the opposite
direction of normal logistics activities”.
In the end of the nineties, Reverse logistics was presented as an extension of the
traditional logistics chain, defined as “the process of planning, implementing, and controlling the
efficient, cost effective flow of raw materials, in-process inventory, finished goods and related information from
the point of consumption to the point of origin for the purpose of recapturing value or proper disposal”
according with Tibben-Lembke and Rogers (1998). This definition already includes part of
the process involved and the objectives of these particular flows. According to the authors,
the redesign of packaging, reduction of energy used and pollution from transport, although
important, do not constitute activities of RL but the so-called “Green Logistics”. In this
research, it is recognized, however, the environmental benefits as drivers of reverse logistics,
but if there is no movement of goods, then is not RL (Tibben-Lembke & Rogers, 1998).
In 2004, the article Logistics – Capturing Value in the Extended Supply Chain (M. Fleischmann,
van Nunen, Graeve, & Gapp, 2004) complements the research of Tibben-Lembke and
Rogers (1998), and presents potential ways to recapture value, after the different products
pass through the so-called traditional supply chain. Among others, the return of excess stock
to primary suppliers, the return of used items for sale in secondary markets or their
reintegration into the supply chain, as is the case of pallets and boxes, the return of damaged
goods for recovery and possibility of reintegration, or simply the return of items for recycling.
More recently, the researchers Pokharel and Mutha (2009) addressed reverse logistics, as
including waste management, recycling and reuse of materials, and the recovery of
components or products. This approach and the concept of RL itself, imply a change in the
paradigm of the life cycle of products. Traditionally, the life cycle of a product has included
the period between its production and its end-of-life (“cradle-to-grave”). Nowadays, with the
growing interest in this concept and its introduction into the strategic and operational
decisions of organizations, the life cycle of a product has increased by encompassing the
recovery phase, after the end of its useful life, and its reintegration into the supply chain
(“cradle-to-cradle”).
If in the old days, the concept of reverse logistics was seen more as a cost, more as a job
or more as a department for the company to manage, and apparently, of no use or return

8
associated with it, nowadays, this idea has changed. Companies, given the current
competitive environment, cannot afford to neglect reverse logistics as part of their supply
chain and operations strategy. (Deloitte, 2014).
Once understood the evolution of the concept of Reverse Logistics over the last decades,
it is essential to understand what it depends on and how its application happens in a company
and in the corresponding supply chain. Brito and Dekker (2003) have developed a
framework, where they identify and describe five essential dimensions around Reverse
Logistics:
Why to receive?
Intends to identify the drivers that lead an organization to adopt Reverse Logistics practices, which means, to receive the products back.
Why to Return?
Aims to determine the reasons that lead products and materials to be returned, that is, the reasons for reverse flows.
What? Intends to determine which goods, products and materials, are returning and their main characteristics.
How?
Intends to describe how reverse logistics works in practice. Processes and operations aimed at recovering some type of value, as well as a description of these recovery options.
Who? It aims to identify the actors in these practices, internal and external to the organization and the functions performed.
Table 1 - Summary of the dimensions identified by Brito and Dekker (2003) - Own elaboration
The authors provide a detailed description for each of these dimensions based on papers
published until the date of this research. Since then, many works have been conducted
exploring the concept and related aspects. In the following sections, these dimensions will
be discussed in detail4.
2.2.2 Why? Drivers for organizations having Reverse Logistics practices
The literature has over the years pointed out driving factors to explain the growing
interest of organizations in the implementation of reverse logistics within their supply chains.
Carter and Ellram (1998) created a model that illustrates the influencing forces of Reverse
4 The dimensions themselves were introduced by Brito and Dekker (2003), but references from before and
after this work will be used.

9
Logistics. These forces identified constitute four organizational entities, the suppliers, the
buyers, the government and the competitive environment. This model was widely recognized
as the first comprehensive RL framework (Hazen, Hall, & Hanna, 2012).
Later, Brito and Dekker (2003), in their research, found that companies began to include
Reverse Logistics because either 1) they could profit from it; and/or because 2) they should
do so; and/or because 3) they felt socially motivated to do so. Figure 1 illustrates the idea:
• Economic Factors: A RL system can bring direct gains to the organizations, from the
reduced use of raw material, the increase of value added through the recovery processes,
or with the reduction of disposal costs, and the sale to secondary markets of returned
materials or products. Even if the profit is not clear and immediate, an organization can
benefit from reverse logistics (indirect gains), through marketing and creating a green
image, for strategic and competitive objectives, as a strategic step of preparation and
prevention for legislation, and the processes of return and recovery can also be used to
improve relationships with customers and suppliers.
• Legislation: The legislation here refers to any governmental recommendation that
indicates whether a company should accept returns and if, and how it should treat them.
In Europe legislation has been developed in this context, associated with recycling,
packaging and producer responsibility for the goods produced. In fact, customers have
the right to return products, and so, companies are legally obliged to accept back those
products. This is also perceived as a way to attract clients.
• Corporate citizenship: This motivation is related to the set of values and principles that
encourage the company or the organization to be involved in a responsible way in a
Figure 1 - Driving triangle for reverse logistics (Brito & Dekker, 2003)

10
reverse logistics process. In fact, many organizations have extensive programs of social
responsibility, where social and environmental issues are priority.
Over the years, many authors propose new dimensions, new drivers and new frameworks
to explore the main influencers for organizations to implement RL processes. Berrone,
Álvarez Gil, Husillos, and Lado (2007) state that that RL programs result from a combination
of organizational factors (the availability of resources), individual factors (the strategic
posture of the decision maker) and external pressures (from consumers, suppliers,
governmental and non-governmental organizations, etc.). In addition, the integration of RL
in supply chains is increasingly used as a strategy for companies, to increase profits, to
promote sustainability and to increase customer satisfaction (Du & Evans, 2008).
Bouzon, Spricigo, Rodriguez, Queiroz, and Cauchick Miguel (2015) based on the analysis
of 25 scientific papers, identifies 11 main drivers distributed in three groups: External –
General Environment, External – Operational Environment and Internal. It should be noted
that the existence of these drivers varies according to the sector, size of the organisation and
the country in which it operates (Agrawal et al., 2015). From this analysis, and based on a
sample of 38 articles, it may be concluded that the most frequently addressed factors are
those of governmental origin (Legislation), those associated with clients/consumers and the
economic/financial ones.
More recently, Govindan and Bouzon (2018) has developed a review based on forty-four
papers made so far, accessed and classified according to their structural dimensions and
analytical categories. From this analysis, it result (See Annexes 1 and 2):
• 8 types of stakeholders, including: Government, Customers, Society/Community,
Market/Competitors, Suppliers, Organization (focal company/stakeholders),
Employees and Media;
• 37 drivers classified by internal or external, related with one or more stakeholders and
classified into eight groups, including: Policy related issues, Governance and SC process
related issues, Management related issues, Market and competitor related issues,
Technology and infrastructure related issues, Economic related issues, Knowledge
related issues and Social related issues;
• 36 barriers classified as internal and external, related with one or more stakeholders and
classified into seven groups, including: Technology and infrastructure related issues,

11
Governance and supply chain process related issues, Economic related issues,
Knowledge related issues, Policy related issues, Market and competitor related issues,
Management related issues.
The resulted information served as basis for the development of a multi-perspective
framework. This framework (Figure 2) presents the main pressures/drivers and barriers from
the previous lists, for implementation of a Reverse Logistics system, from four perspectives,
including organizational perspective (OP), social perspective (SP), governmental perspective
(GP) and customers’ perspective (CP). The main drivers include Regulatory Pressure for
product (GP), Green consumerism (CP), Economic Viability (OP) and Corporate
Citizenship pressure (SP). In addition, the main barriers are included in the Organizational
Perspective, including Lack of personnel technical skills and the Low involvement of top
management, and Lack of specific laws (GP) and Difficulties with supply chain members
(CP) (Govindan & Bouzon, 2018).
2.2.3 Why? Return Reasons for Reverse Logistics
According with Brito and Dekker (2003), the reasons that lead a product to return, vary
mainly with the origin of the reverse flow, along the supply chain.
Figure 2 - Multi-perspective framework for RL implementation (Govindan & Bouzon, 2018)

12
Therefore, there are reasons5 at the level of the manufacturer, distributor/retailer and
customer, as follows:
• Manufacturing Reasons: It includes components or products that have to be recovered
in the production phase. The main reasons are when there is an excess of raw material,
when there are failures in quality control and when overproduction occurs.
• Distribution Reasons: It refers to the returns that originate in the distribution phase.
Includes product recalls (with safety or healthy problems), commercial returns (unsold
products, seasonal nature, wrong/damage deliveries), stock adjustments (redistribution
of stocks between warehouses and/or stores) and functional returns (transportation
assets (TAS) that continuously move back and forward in the supply chain).
• Customer Reasons: Returns that had origin after the product reach the final customer.
The customer may return the product because the product does not meet consumer
requirements, commercial returns (reimbursement guarantees or warranty returns),
product is defective (need for repair service), end of useful life for the customer, or
general end-of-life.
Based on previous studies, M. Fleischmann et al. (2004) combine the reasons for discards
and consequently for reverse logistics into two groups: the existence of agreements for
returns of excess products and the extended responsibility of producers for end-of-life
products. In addition, in the retail sector, retailers are forced to return items because of
uncertainty in demand and because of constant devolutions from final customers (Chen,
Daugherty, & Landry, 2009).
More recently, it has been pointed out as a reason for the return, the existence of
monetary incentives or specific regulations, to encourage collection. Examples are the
payment of a deposit at the moment of purchase, which will be returned with the delivery of
the product or packaging to the company again, or the existence of exchange programmes
for used products that generate discounts on new purchases (Grant, Trautrims, & Wong,
2015).
5 The reasons for returns identified by Brito and Dekker (2003) are in line with the types of returns already identified by Rogers, Lambert, Croxton, and García-Dastugue (2002) which will be described in detail.

13
2.2.4 What? Types and Characteristics of Returns
According to Rogers et al. (2002), there are different types of returns with unique
characteristics and challenges. Accordingly, the different types of returns were grouped into
five categories as follows:
• Consumer Returns: Returns due to consumer regret or product defects. The buyer is
allowed to return, as companies believe that with liberal return policies, sales will increase.
• Marketing Returns: Companies in a forward position in the supply chain return
products to companies back in SC, such as retailers returning to manufacturers (or
suppliers) products they were not able to sell, with quality issues, or to replenish
inventory. Includes damaged goods in transit, in warehouses or in stores returned by
intermediate companies (not end consumers).
• Asset Returns: Include the recovery or reallocation of an asset such as a container,
pallet, box or rack that companies expect to see returning to be reused in the Supply
Chain forwards. It also includes the recovery of used or end-of-life
materials/components for reuse in the production process.
• Product recall: Returns due to quality or safety issues, either by government order or at
the initiative of the manufacturer.
• Environmental: Includes the disposal of hazardous products and materials and other
materials in order to comply with environmental legislation. Government guidelines on
disposal options are essential for this type of reverse logistics to happen.
In this dimension, Brito and Dekker (2003) considered the type of product being
discarded or returned and its relevant characteristics in the return process. They refer to the
composition, deterioration and pattern of use as the most relevant characteristics.
• Composition: It refers to the number and type of components or materials, whether
they are hazardous, and the size of the product. These factors may influence how the
products are recovered and how they are transported (Brito & Dekker, 2003; Gungor &
Gupta, 1999). The level of homogeneity of the product will affect recycling, and the more
homogeneous the good, the easier the recycling will be (Bonev, 2012).
• Deterioration: In the deterioration process, it is important to consider the velocity of
the process, the ease of repair, and the economic depreciation of the product. These

14
factors will mainly affect the value resulting from the recovery process of the product
after its return (Bonev, 2012; Brito & Dekker, 2003).
• Pattern of use: This factor includes the location of collection and the intensity and
duration of use of the product. It covers the factors that may affect the forecast of
quantities to be collected and the planning and frequency of these collection processes
(Brito & Dekker, 2003).
Based on these main factors, were discriminated the product categories of: consumer
goods, industrial goods, spare-parts, packaging and distribution items, civil objects, chemicals
and oils, and other materials as scraps (Brito & Dekker, 2003).
All these aspects should be carefully analyzed by the organization, so that an efficient
integration of a RL structure and adequate collection plans is possible, making the recovery
of value as complete as possible. Each type of return requires a specific treatment and there
are several stages in the life cycle of a product, where it can be returned to the different actors
in the supply chain and from there to the original producer (Figure 3). The products can be
returned in anyone of these stages, and therefore, it’s difficult to predict with precision the
quantities returned at each time (Ait-Kadi et al., 2012).
2.2.5 How? Processes and Activities of Reverse Logistics
Knowing the drivers for organizations, the reasons for the return and the types of
products and materials that return, it is necessary to understand how all the reverse logistics
activity is conducted along the supply chain and how the value of products and materials is
recovered. Based on work done over the years (Agrawal et al., 2015; Brito & Dekker,
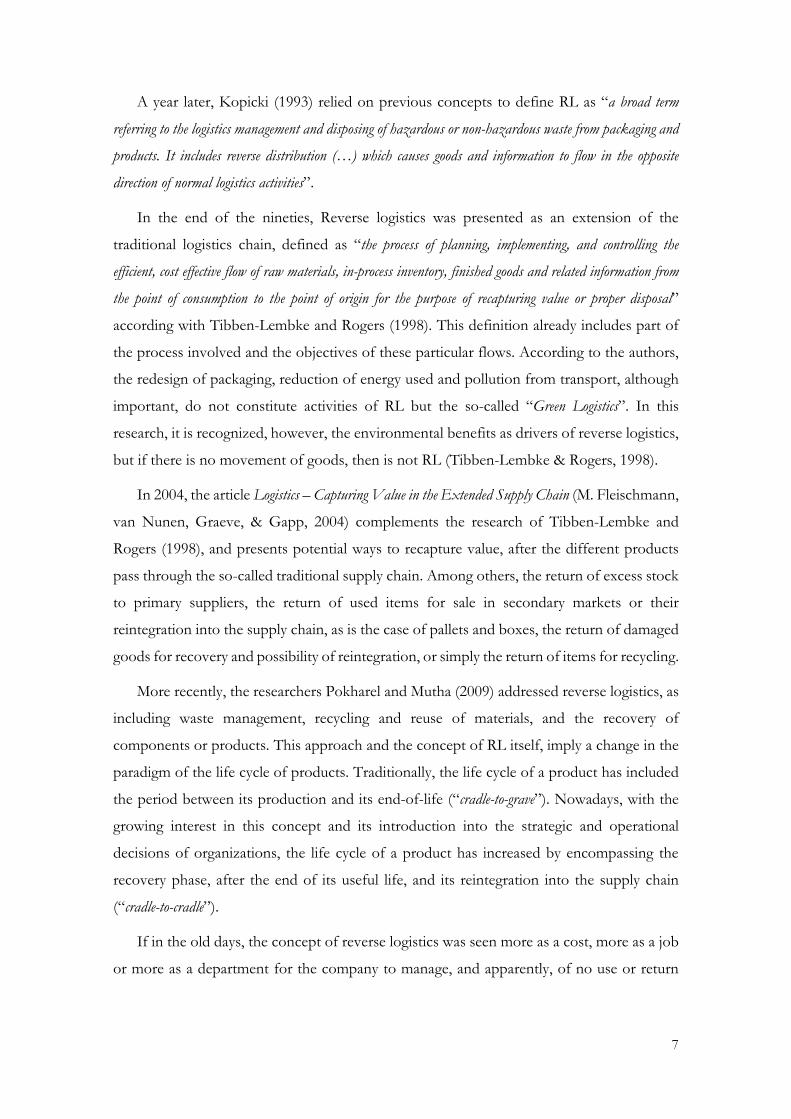
2003)four key processes are identified as presented in Figure 4.
Figure 3 - Possible moments of return in the product’s life (Ait-Kadi, Chouinard, Marcotte, & Riopel, 2012)
15
1. Product Acquisition: The Reverse Logistics activity begins with a process of acquisition
of products, components, materials or used packaging from the end user so that they
integrate the reverse flow for processing. This return is usually made by consumers and
retailers (Agrawal et al., 2015), but any intermediate actor in the supply chain can generate
reverse flow of goods (Brito & Dekker, 2003). This process presents high uncertainty
regarding the quantities collected, the type of product and the frequency with which they
are returned (Moritz Fleischmann et al., 1997). The entity receiving the good must assess
and decide whether or not, it enters the reverse flow of the SC. “Gate Keeping”
represents the decision and entry of the article into the flow and is considered a critical
factor by Ravi and Shankar (2005).
2. Collection: Collection refers to the activity of bringing the products to a point of
recovery (Brito & Dekker, 2003), that is, the moment when a company takes possession
of the returns (Agrawal et al., 2015), transports them (when necessary) and delivers them
to the facilities for inspection and sorting. Kumar and Putnam (2008) discussed three
collection methods (Figure 5), from consumers directly to producers, from consumers
through retailers to producers, and from consumers to producers via third party
companies. The choice of the collection method depends on the quantities returned and
on the cost structure that the company has associated for that logistics (Atasu, Toktay,
& Van Wassenhove, 2013).
Figure 4 - Forward and Reverse Flows and Processes (adapted from Agrawal, Singh, and Murtaza (2015))

16
3. Inspection and Sorting: Different types of products can integrate this reverse flow, for
different reasons and with different recovery plans (Tibben-Lembke & Rogers, 1998). At
this stage, all collected products are inspected, and their appearance, physical condition
and quality are evaluated, in order to decide the type of recovery plan will be implemented
(Agrawal et al., 2015; Brito & Dekker, 2003).
4. Disposition: The last RL case involves a decision on the recovery plan to be followed.
The authors Thierry, Salomon, Van Nunen, and Van Wassenhove (1995) initially
identified as resolution alternatives the reuse of the product, product recovery and waste
management and Tibben-Lembke and Rogers (2002) along with the previous ones,
introduce also the product upgrade and the material recovery. The literature is replete
with alternatives for recovery, which will be discussed later on.
These flows can be incorporated into the structure of the traditional Supply Chain, or
carried out through a channel dedicated solely to RL management, or through a hybrid
structure between the two previous alternatives. The decision and design of these structures
is referred to as Reverse Logistics Network Design (Srivastava, 2006).
The main objective of product recovery management is, between different alternatives,
to make the best possible economic and ecological value recovery of the returned products
and materials, and with that reduce the amounts of waste (Thierry et al., 1995). Five common
disposal alternatives for returned products and materials are widely discussed by academics,
including re-use, repair, remanufacturing, recycling, and disposal (Agrawal et al., 2015; Brito
& Dekker, 2003; Thierry et al., 1995).
Figure 5 - Types of Collection Processes (adapted from Agrawal et al. (2015))

17
The recovery of a good can be carried out with the product in the same state in which it
was collected (Direct Recovery) or after undergoing some transformation or modification
(Brito & Dekker, 2003; Thierry et al., 1995). In the first case, direct recovery, the quality of
the products is close to “as good as new” (Brito & Dekker, 2003), and therefore are reintegrated
almost immediately into the direct supply chain, through re-distribution, or re-sale in the
same market or to a secondary market, or through reuse, as is the case with pallets and
packaging (Thierry et al., 1995; Tibben-Lembke & Rogers, 1998).
In the second case, recovery via transformation or modification can take place at several
levels (Agrawal et al., 2015; Brito & Dekker, 2003; Thierry et al., 1995):
• Repair: At the level of the product, where a repair is carried out in order for the product
to be returned to the consumer.
• Remanufacturing and/or Refurbishing: At the level of parts and modules, the
product, when possible and if possible, is improved, acquired higher quality and can be
reused or resold.
• Recycling: The used product being at the end-of-life, can be remanufactured and
recycled, and its materials reused for the future.
• Disposal: In case it is not possible to extract value from the recovery of the goods
through one of the mentioned alternatives, it remains to proceed with the elimination of
the products and materials from the supply chain. The elimination process can,
nonetheless, to recover some value through donations or for energy production, through
biomass or biofuels (Papargyropoulou, Lozano, K. Steinberger, Wright, & Ujang, 2014).
A study carried out by C. Deloitte (2014) identifies 4 strategic decisions for the way of
doing reverse logistics in an organization. Taking into account organizational capabilities and
objectives, decision makers select an appropriate approach6, disposition methods, network
models and execution plan. The last two aspects are especially important. An organization
may choose between a centralized and a decentralized approach (Figure 6), and decision takes
into consideration the product life cycle, the product value and cost and the volume and
geographic distribution of returns. The execution plan relates to execute all the reverse
logistics process “in-house” or by outsourcing.
6 Reverse logistics as a cost center (focus on improving customer experience) or profit center (focus on revenue generation).

18
2.2.6 Who? Actors in Reverse Logistics Practices
The responsibility of Reverse Logistics does not belong only to one entity within the
Supply Chain, but to the entire SC, and may also include other entities external to the
organization or company. Accordingly, three groups of actors were distinguished (Brito &
Dekker, 2003; Fuller, Allen, Polonsky, & Mintu-Winsatt, 1995):
• Forward Supply chain actors: includes the producer, the suppliers, wholesaler and
retailer.
• Specialized Reverse Chain Players: includes jobbers, recycling specialists, etc.
• Opportunistic Players: includes for example charity organizations.
2.2.7 Costs of Reverse Logistics
Reverse Logistics represents a significant part of an organization’s cost structure, ranging
between 0,1% to 1% of the sales volume of a product and leading to an annual and global
cost of $ 200 billion. Additionally, a properly managed reverse logistics chain has the potential
to recover 32% of the original product value (Deloitte, 2014).
If returned goods are not disposed of quickly, or require a long period of time to recover
value, the cost of handling and storage increases, resulting in financial losses. Based on that,
Panigrahi, Kar, Fen, Hoe, and Wong (2018) described the main costs associated with the
practice of reverse logistics in a company, as follows:
• Processing Costs: represents the main challenge for the retail industry, and includes the
costs of processing the returned item.
• Logistics Costs: includes costs related to movement and handling of returned products.
Includes costs for freight, handling and warehouse storage.
Figure 6 - Centralized vs Decentralized Network Models (adapted from C. Deloitte (2014))

19
• Replacement Costs: when the returned product involves the issuance of a credit, or
exchange for another product.
• Assets Depreciation Cost: associated with return goods that may have to be re-stocked,
refurbished or sold as waste.
2.3 Retail Sector and Reverse Logistics Management
Historically, small businesses have provided for the supply of the entire population, with
a retail market characterized by a large number of small establishments. In the 1980s, there
was a great growth in distribution in Portugal, with consumers searching for larger stores and
enjoying a greater variety of products, food and non-food, in a single space and at more
competitive prices. In 1986, Portugal joined the European Economic Community 7 (EEC),
which boosted the growth of imports and exports, and allowed the portuguese population
to access products of higher quality and sophistication.
The distribution sector is divided into two sub-sectors with interconnected activities, the
wholesale sub-sector and the retail one, the first concerns the first activities in the supply
chain and the second relates to direct contact with the final consumer (Mendes, 2005). This
previous study presents a decision support methodology for evaluating potential locations of
small to medium sized food retail stores, based on sales forecasting models. The location is
considered as a critical factor and different types of retail outlets are identified, Specialized
Stores, Discount and Hardiscount Supermarkets, Hypermarkets, Large Supermarkets, Convenience
Stores, Proximity Supermarkets and Traditional Stores.
Grocery retailers were the first to pay attention to product returns and develop reverse
logistics processes inside their supply chains. This inclusion also led to the development of
customer support and reclamation centres, and centralized reverse logistics centres for
returns management (Vijayan, Kamarulzaman, Mohamed, & Abdullah, 2014)
A recent study named State of Retail Returns (Optoro, 2018) reviews the state of retail
returns globally, based on a survey of the 120 largest retail companies in the United States.
The main findings are described:
7 European Economic Community (EEC) was an organization founded in 1957, with the aim of establishing a common European market.
20
• The impact of returns on U.S. retailers is greater each year, and has been estimated to be
around $380 billion in merchandise.
• About 49% of retailers offer free return policies.
• Many retailers still lack a solid strategy for returns and this is not a priority in the industry.
• More than 50% of respondents said they had no way to report or control their returns.
• About 68% of respondents assumed to have no corporate or representative area to deal
with Reverse Logistics and only 30% quantified the costs associated with returns.
• Technologies are beginning to be present in return management, and 23% of retailers
already use a technology solution.
• It has been shown that a positive experience with returns encourages a repeat purchase
by the consumer, with 69% of respondents supporting this conclusion.
• Even if consumers expect that companies act on social and environmental issues (86%),
returns continue to be disposed of without adequate treatment (around 36% of returns
volume). In the USA, there are about 5 billion pounds of waste landfills per year.
• Approximately 75% of the companies surveyed believe that by improving their reverse
logistics system, it will be possible to achieve positive organizational and environmental
impacts and 82% consider Reverse Logistics as a very important element to consider.
In 2018, wholesale and retail trade in Portugal amounted to 43.519,6 million euros. In
the same year, food and non-food retail totalled 20.945 million euros, 3.4% more than the
previous year, and food alone accounted 12.403 million euros. The top three food categories
with the highest growth were Frozen Food (6.1%), Perishables and Snacks (4.1%) and
Grocery (4.0%). In addition, the weight of promotions in food retail continued to increase,
representing 46.4% of sales and the weight of own brands was around 33.6%, while
manufacturers’ brands accounted for 66.4% of sales. In non-food retail, capital goods
increased by 5.9%, namely telecommunications equipment, which grew by 9.5%.
Entertainment and stationery grew 5.1%, fuels sold by distribution companies increased sales
by 4.7% (to 3,633 million euros), and clothing registered a 2% increase (APED),
2.4 Chapter Summary
Studies around Reverse Logistics and its dimensions have been extensive, especially in
recent decades. Considering the literature review accomplished, some ideas were concluded:

21
• Efficient Supply Chain Management is crucial to the management of an organization and
to the creation of value for the different stakeholders.
• Given the global environmental situation in which we live, following a sustainable
strategy in SC is essential and requires the implementation of reverse logistics practices.
• Reverse logistics is the opposite of the so-called traditional supply chain, since it includes
all the processes that bring the used products and materials, through a distribution
channel to the retailer, supplier or producer.
• The study on Reverse Logistics, however relatively recent, is extensive and conclusive in
relation to its necessity. However, before implementation, the characteristics of the
sector and the country where the company operates should be taken into account.
• The main drivers that lead an organization to implement RL are organizational
(economic advantages and recovery of value), social (social pressure and to be a green
company), governmental (comply with legislation) and to meet the needs of consumers
and organizational partners.
• The reasons for a product’s return relate to the consumer, to the distributor/retailer, to
the manufacturer, as a result of monetary incentives or as a result of legislation obliging
end-users to make the return.
• The key processes of Reverse Logistics include product acquisition, collection, inspection
and sorting and recovery. In addition, the main recovery plans include repair, reuse,
remanufacturing, recycling and disposal.
• The actors in this process can be internal or external to the organization, and is not the
responsibility of a single area or department, but of the whole Supply Chain.
• In the past, retail appeared in the form of a large number of small businesses close to the
population. In the 1980s, small businesses began to be replaced by large chains with
larger stores and a wide variety of products.
• Retail in Portugal represents close to 10% of GDP and sales through promotions
represent almost 50% of total sales in this sector.
• Returns can have great weight in an organization and in a country’s own economy (in the
USA, returns are estimated to be around $380 billion).
• Even though the impact of Reverse Logistics is already recognized by organizations and
employees, its implementation still remains far from what it could and should be.

22
3 Methodology
This chapter will describe the methodology used in the development of this work, as well
as the methods of data collection and analysis in order to respond to the proposed research
problem and related objectives.
3.1 Research Methodology
As previously mentioned, the purpose of this work is the characterization and evaluation
of the current reverse logistic chain in one of the main leaders in retail sector, Jerónimo
Martins. To accomplish this project, the following fundamental steps were followed:
Figure 7 - Steps of Methodology
The methodology of this investigation is mainly qualitative, describing the case selected,
answering the question “How is”, and making use of investigative methods such as direct
observation, analysis of documents provided and interviews with the responsible and
operational warehouses and stores. The information collected and analyzed is essentially
qualitative, but not exclusively (Saldaña, 2011). In a qualitative research, the objective is to
achieve a qualitative understanding of the underlying reasons and motivations surrounding
the problem of the study sample, usually small samples, as is the case of the present study
area, in a single company. This provides knowledge and understanding of the circumstances
and the environment around the selected problem. The collection of data may or may not
be structured, and as a result, it is expected to perceive the state of the case under study
(Malhotra, 2010).
This project tends to follow a study case methodology that is a strategy of investigation,
translated in the comprehension of the presented case and in its unique characteristics
associated to the topic in study. This type of research usually combines data collection
methods such as documents, interviews, questionnaires and observation (Eisenhardt, 1989).
Also, according to the methodology identified in Creswell and Poth (2017), this project is
Step 1:Contextualization and structure of
the project
Step 2:Theoretical Framework:
Literature review
Step 3:Definition of the
research methodology
Step 4:Characterization of the case study
Step 5:Main data and
results discussion

23
classified as a case study8 given that it tends to follow the following steps: 1) description and
analysis of one or more cases; 2) understanding of the processes raised; 3) study of an event;
4) use of various sources of information such as interviews, observation and documentation
and 5) analysis of the information obtained.
3.2 Process of Data Collection and Analysis
The collection of data occurred along four months, from October of 2018 to January of
2019 in order to achieve the goals of the investigation. In view of the fact that the author of
this project is a full-time employee in a company other than the partner company of this
research, data collection took place on Saturdays, holidays and other punctual days during
this period.
The primary phase of data collection consisted on access private records, from
documents to multimedia material, both at company level and at the level of the department
on which the study is conducted. Given the opening of the company, for the possibility to
be present regularly in the work of research facilities, the main techniques used were direct
observation and interviews with employees from warehouse and stores. These interviews
were recorded in audio for later transcription and use of the collected information.
All the information presented in this work, from quantitative data to the qualitative data
of interviews (See Annex 12) and observation processes, were confirmed and verified by the
collaborators, and by the tutor indicated by the company to follow up the investigation.
Note: The Jerónimo Martins Group provided several documents for analysis during the research. In
this sense, the quantitative and qualitative data presented in chapters 4 and 5 will not be referenced.
3.3 General and Specific Objectives
The present work is related to the need of an organization to know itself better, to clarify
its processes, its strengths and weaknesses, and through this partnership, find ways to
improve. The company has processes already designed and properly implemented, which
even reaching its main objective, to give an appropriate end to each article or waste that
returns, present weaknesses. The activities are carried out in a natural way, although many of
8 The report also presents as other alternatives to Narrative Research, Phenomenology, Grounded Theory, Ethnography in addition to the Case Study, which is the one that is closest to the methodology of this project.

24
the participants are not aware of the entire reverse logistics process. This work is intended
to provide the company with a clear and correct representation of all existing reverse logistics
processes, characterizing and explaining these same processes in all their dimensions, and
furnish the company with guidelines for improvements. Although improvements are
presented in this work, these will not be the main objective, but one of them. In short, three
fundamental stages of the project are considered: Know, Describe and Understand and
Analyze.
First Phase: Intends to provide general information about the company under study
and more specifically about the target department of this investigation, including a
contextualization, a characterization of the physical space and benefits that the organization
recognize, for having and want to improve these processes.
Second Phase: comprehend a deep look into the reverse logistics practices of the
company. All processes and types of returns will be identified, described in detail and
mapped. The objectives for this part include, describe and understand:
• What kind of products and materials return and why?
• How they return?
• What are the logistic monetary costs and gains associated with it?
Third Phase: The aim is to analyze the performance of the processes, mostly to identify
existing daily difficulties. Based on this, guidelines for improvements will be presented that
are primarily aimed at correcting these same difficulties, and that can promote the overall
efficiency of this chain.
Realizing how the various processes of reverse logistics of a giant Portuguese company
in the retail sector works, we intend also to be possible to make known the benefits of
implementing this kind of logistics to other companies as well as provide new literature on
the topic.
Know Describe and Understand Analyze
Figure 8 - Three Stages of the Project

25
4 Case Description
The fourth chapter of this work presents the Jerónimo Martins Group, the company that
promoted the challenge for this project and where the internship took place. The history of
the company, its mission and values, and its main business areas will be presented here. At
last, the theme of this project will be contextualized in the company.
4.1 Jerónimo Martins
The history of Jerónimo Martins began in 1792, when a young Galician with a great
entrepreneurial spirit opened a modest store in Chiado. His name was Jerónimo Martins and
after 227 years, he still gives his name to one of the greatest food specialists in the world.
Currently, the JM group is a Portuguese food distribution and specialized retail business
group, present in Portugal, Poland and Colombia. Over two centuries of experience and
accumulated knowledge, JM has a solid position, both in the markets where it operates and
internationally, having occupied in the annual study Global Powers of Retailing (Deloitte, 2019)
the 56th position in the ranking of the world’s largest retailers. The main segment is food
distribution, being the leader in Portugal with the Pingo Doce and Recheio brands and the
leader in Poland with the Biedronka brand, where it has operated since 1997. Its activity in
Colombia began in 2013, with the Ara stores and is a market with high growth prospects.
There are more than 3,800 stores that generated more than € 16 million in sales in 2018. In
addition to these brands, JM has more than 40 own brands that weigh on sales volumes, in
Pingo Doce this weight is 34% and in Biedronka it is 41%.
* includes the remaining sales that were not included in any of the previous brands M – Million
Brand
Description
Stores
Sales (€)
Food
Distribution
Super Stores and Hypermarkets in Poland 2900 11.691 M
Super Stores and Hypermarkets in Portugal 432 3.835 M
Cash & Carry in Portugal 42 980 M
Food stores in Colombia 532 599 M
Specialized
Retail
Health and Beauty Stores in Poland
230 207 M
Chocolate and Confectionery Stores in Portugal
24
25 M*
Kiosks and confectioneries in Portugal 22
Table 2 - Jerónimo Martins Business Segments

26
The group’s mission is to satisfy the interests of its shareholders and the needs of its
stakeholders, through a strategy focused on the creation of value along with a sustainable
development. The company’s approach is based on the promotion of health through food,
respect for the environment, responsible purchasing and support for communities, being a
reference employer for its more than 100.000 employees. Major steps have been taken in all
these areas and in improving the service provided to the consumer. Address society’s needs
and changes is the daily goal of the group, its employees and business partners.
It was in 1980 that JM in partnership with the Delhaize Group set up the Pingo Doce
Company with a clear strategy of exploring the supermarket segment. In the following
decades, several acquisitions followed with the aim of strengthening its market position,
namely the acquisition of Plus Group in 2008 and the absorption of the Feira Nova brand
partially in 2008 and 2010. The growth of the Pingo Doce brand is visible both in the growth
in the number of stores and in the constant increase in its sales volumes, in 2008 of € 2.503
M and in 2018 of € 3.835 M. Currently, the Pingo Doce chain supports an area of 506.754
m2, with 432 stores spread over 300 locations throughout the country.
4.2 Contextualization
Jerónimo Martins reaches the homes of the Portuguese through 7 logistics distribution
centres9 , from the north to the south of the country, each one operating independently, and
supplying 474 Pingo Doce, Recheio and Caterplus stores. The 432 Pingo Doce stores account
with an average of 700.000 daily visits, motivated, among other reasons, by a unique store
space, the quality and variety of products and the proximity to the customers. What is
9 There are 2 logistics centres in the North (Alfena and Vila do Conde), 4 in the Centre e and 1 in the Algarve
0
100
200
300
400
500
2005 2006 2007 2008 2009 2010 2011 2012 2013 2014 2015 2016 2017 2018
Figure 9 - Evolution of the Number of Pingo Doce Stores

27
unknown, however, is that this quality and variety of products is achieved through sustainable
relationships with suppliers, which in turn, are achieved through the existence of logistics
centres and product return points, the so-called Return Warehouses or Reverse Logistics
Warehouses10.
Additionally, the loyalty and admiration of customers towards the company derives from
the same quality and variety of products that are available in all stores, and also from the
existence of customer support areas, which aim to strengthen relationships of trust and
proximity with customers. In this direction, a specific customer support area was also created,
the “Provedoria do Cliente Jerónimo Martins”. Created in 2005, this area represents and defends
the rights of the more than 4 million customers who visit the group’s stores every day,
representing a last resort for clients, to analyze and deal with complex and structural
situations that have not previously been solved by the traditional service channels, such as
stores or customer support services. Only in 2017, the mentioned department registered
1.909 new processes, representing a decrease of 4% compared to 2016, and 33 processes
transited from the previous year, totaling 1.942 managed in that year. These areas are
intrinsically linked to the process of returning and exchanging products by customers, either
by manufacturing errors or by the mere fact that the product does not correspond to
customer expectations. All Pingo Doce’ stores allow the return of products, which may
return to public sale, be eliminated in store, or return to the supplier. In any of these cases,
this process of return is considered reverse logistics
On the other hand, several stores have collection points for end-of-life products and
materials such as electronic equipment, oils and capsules. This kind of return is also
considered as part of the reverse logistics flow. Without realizing it, RL is actively present in
our daily life. Each time a product or material retreats in the traditional supply chain, it
initiates a set of operations seeking to recover value from them, or at least, give these
products/materials an appropriate and responsible disposition. Returns, devolutions and
exchanges have existed since the beginning of JM. However, neither the volumes of returns
were as large as now, nor the knowledge about the benefits of an efficient RL chain existed
from the beginning.
It was in 2012, which gave one of the most recent impulses in this area. The business
group conditioned by the crisis established earlier in Portugal, decided to change its
10 In portuguese: “Armazéns de Devoluções ou de Logística Inversa”.

28
commercial strategy to meet the needs of the consumer, making a more continuous use of
promotional campaigns. All this strategic adjustment, complemented with the increase in the
number of stores, came to generate great constraints and challenges at the logistic level. In a
particular way, the area of returns saw its return volumes increase significantly, and this
implied looking at RL with different eyes in order to make the most of it. The oldest data on
volumes of returns worked are for 2014, transportation assets (TAS11) and goods included
in the amount of 23.474.546 units compared to 40.529.580 units in 201812.
Currently, JM is one of the leading market leaders in Portugal, and is seen as one of the
companies that most bets on the development of its logistics operations. At the level of RL
in the north of the country, and as a result of the group’s growth, the strategic change
mentioned above and the increase in volume of returns, the group had to start developing in
this area, but it was only in 2012 that the first warehouse was born for returns’ management.
This part of the logistics was developing over the following years, and the company began
to realize that it could have returns with it, reducing costs and making logistics operations
more efficient. Since then, has been betting heavily on this area, developing increasingly own
and self-directed work spaces within the logistic centers and with teams solely dedicated to
dealing with these flows, as well as norms and procedures. More recently, the Alfena Logistics
Center (ALC), in operation since April 2017, was built with this area in mind, and has a
structured warehouse, the Reverse Logistics Warehouse (RLW)13 and a team dedicated to
processing returns. It should be noted that the reverse flows in the Recheio and Caterplus
stores are managed internally by the same teams in charge of supplying goods for
consumption. Therefore, the RL of these stores does not pass through the RLW, so we will
address the topic, excluding the RL practices of these stores, focusing only on the practices
associated with the Pingo Doce stores.
11 TAS - Transportation Assets (includes pallets, boxes, or any other goods transportation article). 12 Values based on the KPI’s (Key Performance Indicators) elaborated annually. 13 In the work environment, the entire Reverse Logistics Warehouse is addressed only as a Returns Warehouse. However, for a better understanding of the work, it will be referred to as Reverse Logistics Warehouse.

29
5 Discussion and Analysis of Results
A detailed analysis of the current situation of Reverse Logistics in the Jerónimo Martins
group will be carried out in this chapter. In a business context, reverse logistics is first and
essentially associated with the existence of returns, referring to any product or material that
makes the flow contrary to that which is directed to the final consumer. Given the size of
the group, this analysis will be made according to all the information collected from the
reverse logistics warehouse, in the logistic center of Alfena, where the internship project was
held, which also represents the group’s most recent venture, and the more advanced in
logistical terms. The operations associated here also represent most of the group’s RL
operations, associated with the food retail and given the similarity of operation of all logistics
centers, this dissertation will reflect what happens in this company in global.
Over the next pages, I intend to describe in a detailed but concise way all the activities
and processes related to reverse logistics, in all its dimensions, as described in Chapter 2 of
the literature review. The chapter begins with a characterization of the physical space where
the RL processes take place and their benefits recognized by the company. Then, are
described all the reverse flows identified, from the reasons of return, to the phases of the
return processes and resolutions of each flow, which will be complemented by maps of
operations. The operational difficulties identified and the costs and logistical gains inherent
in these activities will also be described. In a final phase, and based on all the information
presented, will be pointed out viable opportunities for improvement and that make sense
both in the operational and organizational perspectives.
It should be noted that all the information presented in this chapter results from what
was observed and apprehended during the internship, the documents consulted and the
opinions of the collaborators, expressed in the interviews performed. Thus, only the
subchapters of the difficulties and improvements bring the opinion of the project author.
5.1 Characterization of Alfena Logistics Center and the Reverse
Logistics Warehouse
The Alfena Logistics Center of Jerónimo Martins, has been operating since April 2017,
after one year of environmental impact assessment and project, followed by two years of
work, in a global investment of about € 75 million. The main objective of this venture is to

30
be a point of communication and provisioning of the north and central area of the country.
Located in a strategic position, occupies a total area of 100.000 square meters, of which
70.000 are covered area, and has at all 170 discharge docks. This center operates 24 hours a
day, 6 days a week, supplying 175 Pingo Doce stores, 16 Recheio stores and 1 Caterplus
store, from the north and center of the country. In this center, (See Annex 3) there are five
warehouses, each with its operational manager and a team of operators.
• The Stock Warehouse counts with a team of 145 people, and with an area of
approximately 20.000 square meters. It includes all kinds of non-perishable goods and
has mostly in stock the branded products, which cannot be miss ed for selling.
• The JIT14 Warehouse has a team of 160 people with an area of 23.000 square meters. It
is divided into three areas of non-perishable goods, food, non-food and beverages.
• The Fruit and Vegetable Warehouse has a team of 68 people and an area of 10.000 square
meters. It is a refrigerated warehouse (8ºC), being the main articles treated, fruits,
vegetables, eggs and cod.
• In the Fresh Fish Warehouse, there is a team of 26 people and an area 10.500 square
meters. It is a refrigerated warehouse (4ºC) responsible for fresh fish.
The Reverse Logistics Warehouse of the ALC is an independent warehouse of the rest,
which works together with the logistics center of Vila do Conde, with a total team of 38
people, distributed by 3 daily shifts of 8 hours each, 6 days a week. Table 3 shows the
distribution of human resources allocated to this logistics, including an operational manager,
2 Administrative and 35 operatives15.
Global
RLW – TAS Area
RLW –Area of Returns Warehouse in Vila do Conde
• 1 Operational Manager
• 2 Administratives
• 7 Operatives – morning
• 6 Operatives – afternoon
• 2 Operatives – night • 4 Operatives – TAS
Washing
• 5 Operatives – morning
• 3 Operatives – afternoon
• 8 Operatives – Day
14 JIT – Just in Time 15 The operatives are responsible for all operations from the reception to the expedition of goods or TAS, respectively.
Table 3 - Distribution of Human Resources associated with Reverse Logistics Operations
31
Unlike all other areas of logistics, witch the purpose is to deliver and supply products to
their customers, reverse logistics makes these same products and/or materials return. The
RLW is in constant contact with the other warehouses, working as a communication point
between them, Pingo Doce stores and suppliers. This space brings several benefits and is
responsible in practical terms, by:
• Support the remaining warehouses and stores in everything that may be necessary. It
includes the storage function of TAS and merchandise and the management of returns
to suppliers;
• Organize and control any reverse flow of non-perishable materials and goods associated
with the other LC warehouses and stores. The management of these flows is based on
the idea of centralization, defined as “the collection of a certain type of products or residues, from
different locations moving towards the same physical space, in this specific case, the RLW 16”.
Like any other space or area of the group, also this reverse logistics area in ALC required
a previous study on what physical conditions should have space, as well as equipment and
human resources needed. The study, however, was based mainly on the “general knowledge”
that the workers and managers had on the subject. The RLW is located near the
administrative building and does not have any passage covered as connection with the other
buildings. The warehouse has a total area of 6.000 square meters, works at room temperature
and is divided with a physical separation in two equal parts: the Area of the TAS and the
Area of Returns. The first has 8 unloading docks and in addition to the employees
themselves, there are 1 of the company CHEP17, 3 of the company LPR15 and 8 of the
company IFCO15, to which JM gives this space, and in return can use the TAS when
necessary18. Each of these working groups has their space duly separated and organized
(Zone 4). The second area has 2 unloading docks, has a space for loads and discharges, a
space for counting and inspection of the prescribed goods and a storage space. At the time
of the study, in order to determine the necessary storage space, it was taken into account the
quantity of pallets waiting to be lifted, the number of pallets waiting for the conference, and
a space to support the stores, for seasonal articles. The study resulted in a total space for the
16 Transcribed expression from one of the interviews. 17 CHEP, LRP and IFCO are suppliers of Transportation Assets, such as pallets, boxes and containers. 18 It is possible that a monetary compensation paid by Jerónimo Martins to these external companies is associated here, in exchange for the use of TAS. However, it is not possible to confirm this information.
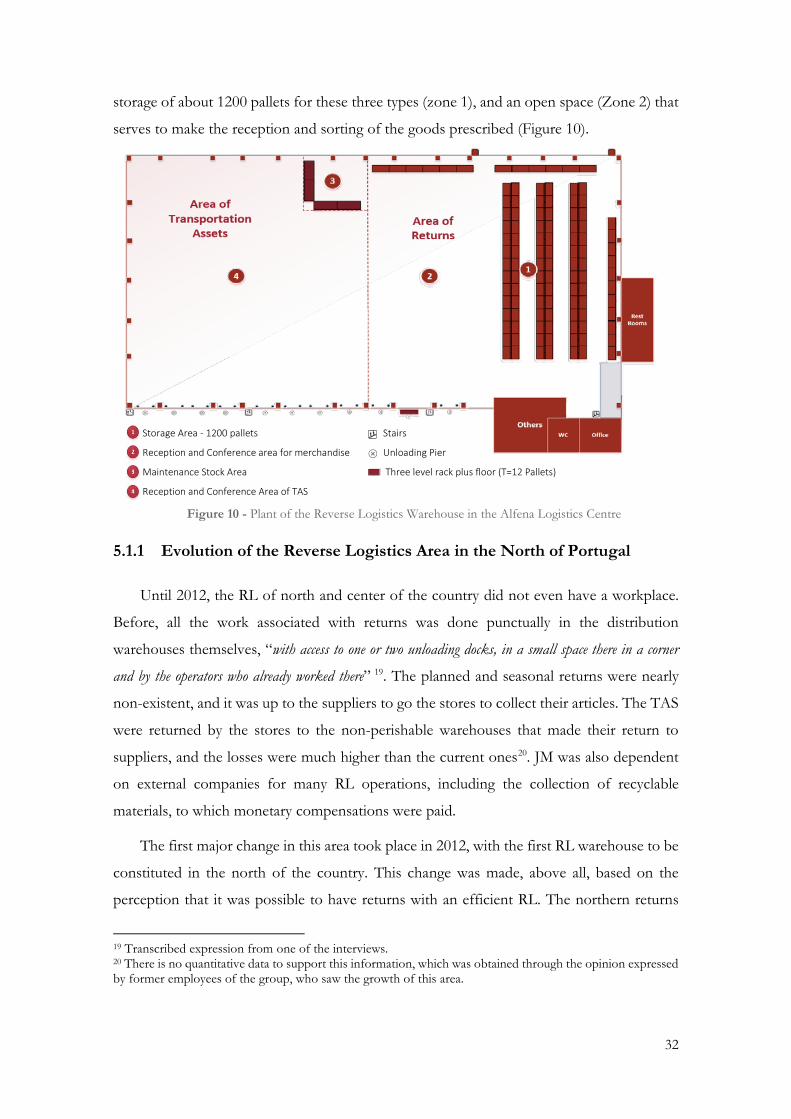
32
storage of about 1200 pallets for these three types (zone 1), and an open space (Zone 2) that
serves to make the reception and sorting of the goods prescribed (Figure 10).
5.1.1 Evolution of the Reverse Logistics Area in the North of Portugal
Until 2012, the RL of north and center of the country did not even have a workplace.
Before, all the work associated with returns was done punctually in the distribution
warehouses themselves, “with access to one or two unloading docks, in a small space there in a corner
and by the operators who already worked there” 19. The planned and seasonal returns were nearly
non-existent, and it was up to the suppliers to go the stores to collect their articles. The TAS
were returned by the stores to the non-perishable warehouses that made their return to
suppliers, and the losses were much higher than the current ones20. JM was also dependent
on external companies for many RL operations, including the collection of recyclable
materials, to which monetary compensations were paid.
The first major change in this area took place in 2012, with the first RL warehouse to be
constituted in the north of the country. This change was made, above all, based on the
perception that it was possible to have returns with an efficient RL. The northern returns
19 Transcribed expression from one of the interviews. 20 There is no quantitative data to support this information, which was obtained through the opinion expressed by former employees of the group, who saw the growth of this area.
Storage Area - 1200 pallets Stairs
Reception and Conference area for merchandise Unloading Pier
Maintenance Stock Area Three level rack plus floor (T=12 Pallets)
Reception and Conference Area of TAS
Figure 10 - Plant of the Reverse Logistics Warehouse in the Alfena Logistics Centre

33
began to be treated independently in three spaces (warehouses), Guardeiras, Laúndos and
Vila do Conde. In the first two there was room for collection and treatment of TAS, and in
Vila do Conde for the collection and treatment of TAS and merchandise. Since then, the
work began to be more efficient and less dependent on external assistance, and with some
income starting to be obtained with the sale of damaged pallets, but there was still a long
road to be made. Human and material resources were reduced, limited space and operations
dispersed by distant locations. There was a real need to centralize all operations and stocks,
which only became more visible over the years, and even though know - how about the area
was not the desired, the company knew that it was necessary to do better. This reverse
logistics warehouse has been the answer to years of inefficiency and needs. Currently, the
participants in this process of reverse logistics in the group (north), include the team of 38
people who operates in the RLW and the warehouse of Vila do Conde, the employees of the
stores and the other warehouses of the logistic center, the primary suppliers, the companies
organizations that receive donations and buyers from damaged pallets. The role of each of
these is presented in the following sections.
“It was in the last 5/6 years that we began to develop this warehouse and it is still something that is being
built and being implemented in the culture of the company, the collaborators and the stores, but there is clearly
a tendency to evolve (...) The biggest difficulty is undoubtedly to make known to our customers (the stores) the
best way to work so that everyone win with this (...) Change mindsets, change concepts at the level of people,
about the importance that this warehouse has, which is new, is growing, but already has so much dependent
on it (...) It is necessary to look at this as something that will help and not as something that only bothers
and creates problems. This mentality still exists, especially in stores”.
Operational Manager (November 2018)
5.2 Drivers for Reverse Logistics and Benefits
As mentioned, only in the last decade, the benefits of making an efficient and correct RL
began to be perceived by the group, resulting in drastic changes in the way returns would be
dealt with. In 2012 there was the first major change in this area, and in 2017 it can be said
that the JM was affirmed in relation to the way It sees RL. Giving its own space to
devolutions and means to work, the company hoped to improve itself in all possible aspects,
operational and organizational. The ALC, and in particular this reverse logistics warehouse
came to bring challenges, but above all, benefits. This warehouse constitutes a recent area of

34
logistics, and as other logistical areas does not exist to generate profit, but to work in favor
of the company’s activity and as such, implies initial investment and operating costs, which
then has returns, even more or less direct. Following, we describe those that since 2012 were
the main motivations, identified by the company and collaborators, to do RL and above all
to make an efficient RL, and that proved as unique benefits inherent to this area:
• Compliance with the company’s needs in this area and legislation
There is no legislation forcing a company to have this space or this type of processes,
but there are internal needs, flows to be processed, goods to be returned and transportation
assets that have to circulate, which is the main reason for RL existence. On the other hand,
there is great social pressure so that companies to be responsible for the end-of-life of their
products, and in this sense, there is legislation that obliges Pingo Doce stores to accept the
return of any item marketed or to exchange when the product is damaged, or simply because
the product does not correspond to expectations. Also complaints about the state of the
product, must be accepted and investigated, and proving the existence of a non-conformity,
the stores are obliged to withdraw the affected items from sale and proceed with their return
to the supplier or make an appropriate disposal of them.
• Support to other Warehouses
RLW provides a huge service to support the other warehouses of the logistic center,
assisting them in daily life at various levels:
⋅ The remaining warehouses no longer have to manage and stock boxes and pallets, as
they are now concentrated and treated (received and dispatched) in one place (RLW);
⋅ Assuming the work of TAS washing;
⋅ Ensure that all boxes and pallets supplied for transportation of goods are in the
appropriate state for use;
⋅ Management of the sale of damaged pallets;
In general, RLW allows all work to be more organized and efficient, leaving employees
and managers of the remaining warehouses to be “less overworked”.
• Support to Stores
The stores also saw their work facilitated with the creation of this area of RL:

35
⋅ Until centralization of returns, each supplier should move to each store to collect the
goods. From the moment when the stores make all their returns to RLW, the supplier
starts to move to a single location to perform the collection. In this way, the stores no
longer have to store the items for return until the arrival of the suppliers, releasing space
for other goods, and no longer have to perform this same return and to follow their
conference, saving time, space and resources.
⋅ Throughout the year, there are several stores that go through periods of remodeling, only
in 2018 were 10 stores21 that were in this process, and received the support of the reverse
logistics warehouse of the north, namely for the storage of goods.
• Improving relationships with suppliers:
What happens countless times, is that for different reasons, products must be returned
from stores. In fairs and seasonal campaigns, the stores are stocked in high quantities of
products of various brands, sizes and formats, which are often anticipated as soon as they
will not be sold completely. On other occasions, goods must be collected by manufacturing
errors. For many years, at the end of these campaigns, or when identifying these errors, each
supplier should go to each store to collect their products. This constraint affected contractual
relations, both in terms of price and quantities provided that were established with suppliers.
The existence of this area for RL in the logistic centers has facilitated this situation. The
means of transport used to supply the stores, when returning to the logistic centers, began
to be used to transport the products that should be returned to the suppliers, being stored
there for later collection. Each supplier would make a single trip to a single location to collect
their goods and could even resell the returned items. This has become an aspect to be taken
into account in contract negotiations, giving more margin and financial advantages to JM,
which could also risk more when establishing collection arrangements if there is no consumer
adherence. This also allowed small suppliers who previously could have difficulties in
fulfilling these collection obligations, to become JM partners.
• Strengthen relationships with customers
The group’ stores are the mirror of the relationships that JM maintains with its suppliers.
The collection pre-agreements that could be established with suppliers together with
negotiating margins, have allowed lower prices, translated into quantity, quality, variety of
21 There were 10 stores in North Logistics (associated with the Alfena Logistics Centre).

36
marketed products and stronger promotional campaigns. Since 2012, the group’s strategy has
been to provide a unique consumer shopping experience, based on variety and low prices,
which has become possible early on, with the existence of a more efficient reverse logistics.
On the other hand, consumer’s knowledge of the company’s sustainable practices, namely,
the treatment of returns of goods and materials waste, incentive campaigns for recycling,
waste management and concern for the end-of-life of the products, promotes their loyalty
and confidence in the brand.
• Make the company’s image healthier and more sustainable
The whole group is recognized for its sustainable policies, environmental concerns and
with the environments in which it operates. Pingo Doce stores constantly promote recycling
practices and need to adequately address end-of-life products, in particular electronic
products. The fact that the recycled volumes are growing, only shows that the message is
reaching consumers, and that there is confidence in the brand. The existence of RL of this
dimension also allows continuous donations to various institutions, and many of the
monetary returns obtained from recycling are destined to social support.
• Reduce Costs
In 2012, JM realized that reorganizing and creating spaces and teams of RL, could cease
to be dependent on external companies to do certain jobs, such as the management of TAS,
and centralize processes in the same space, allowing to reduce costs and be more efficient.
In 2017 the centralization was total, and even with a high initial investment, it was perceived
that it was possible to reduce several cost items and to increase the income heading22.
5.3 Types of Returns
Currently, the reverse logistics of Jerónimo Martins considers two main reverse flows,
which sub understand other flows, managed separately even though in the same space
(RLW): 1) The reverse flow of non-perishable goods and recyclable materials (in the Area of
Returns) and 2) the reverse flow of TAS (in the Area of TAS). It then describes in detail how
the management of each flow is performed, and for each, a map of operations created with
the objective of describing what happens graphically.
22 See Subchapter 5.5 to know more about this Costs Reduction.

37
5.3.1 Area of Returns (AR)
a) Reverse Flow of Non-Perishable Goods
It includes the non-perishable articles that for several reasons could not go to store or
had to be returned by them, and will now have to return to their primary suppliers or be
properly treated with the objective of recovering some kind of value. The main reasons for
devolution have to do with damage to the articles during the supply process, seasonality and
demand uncertainty, the volume of acquired goods, quality issues and the existence of return
contracts. The reverse flow of goods is distinguished in four categories according to the type
of merchandise, location and reason of collection, and its value recovery plan. In this way,
the returned goods will be treated through this work, in the same way they are treated in
warehouse. The following categories are considered in this flow: recovered products, recall,
planned returns and seasonal returns 23 and regrouping.
The process of returning a product starts in different ways and for different reasons for
each category. Most of this flow has a physical origin in stores, but the process always starts
with a decision made centrally on which products and quantities will be returned and on what
specific dates. Subsequently, the stores prepare the indicated merchandise, which is then
collected by the same fleet of trucks responsible for supplying the stores, making use of their
return routes to the ALC. The transport area is responsible for the management of the fleet
for the collection of these goods. In the returns area the following process is similar for all
merchandise categories:
• Reception: The reception itself, relates only to the unloading of the goods from the
trucks to the Area of Returns, and confirmation that each pallet has the Return Guide24.
• Waiting before Counting and Inspection: For reasons of unavailability of time, space
or labor, the merchandise on the pallets may have to wait until the following phases are
fulfilled. This phase is common at the end of seasonal campaigns or larger promotional
campaigns, and can generate months of waiting.
23 In portuguese: “Artigos Recuperados, Produtos Recall, Devoluções Planeadas e Devoluções Sazonais”. 24 In portuguese: “Guia de Devolução”.

38
• Counting: Happens with the validation of the return guide that accompanies each pallet.
For this process, the WPMS25 computer system is used, where the operator, with the
help of a PDA26, reads the barcode that accompanies the store’s return guide and
confirms whether the articles indicated therein confer with what physically arrived at the
warehouse. In case the physical quantities are equal to those indicated on the PDA the
operator confirms the end of the process, passing all the articles to the inspection phase.
In case there are differences, the counting made by the warehouse prevails, and the store
responsible is credited with the break. Any returned item, is brought in reusable paper
boxes (e.g. boxes of vegetables and bananas is the most common case), transported on
pallets, and each must not have products of more than one supplier, and for each, a
return guide.
• Inspection: The verification and inspection of the merchandise happens after counting,
being, however, practically simultaneously. This process is done manually, taking into
account the physical and functional state of the article and the existence of the barcode.
During this conference is placed in each box, only a reference, which can be common to
several stores. Rigorous inspection is essential throughout this process for several
reasons:
⋅ Losses in quantity and damaged material are attributed to the store responsible for
the return, and this value is incorporated in the item Losses;
⋅ About damaged goods, the supplier may decide not to accept the merchandise,
especially if this is explicit in the contract, which will result in losses to the company
and to the responsible stores;
⋅ The decision between destruction or donation is also dependent on this inspection,
as it is necessary to ensure that donated items are in perfect condition for
consumption, or that it is not destroying articles in full state of use.
• Storage: Its duration is variable, not only depending on the category in which the
merchandise is included, but also by the type of supplier and the associated contract. The
storage space is organized by damaged products, products for donations, products for
25 WPMS (Workflow Process Management System) is a specialized warehouse management system for medium-sized warehouses. 26 PDA (Personal Digital Assistant) - small computers, with a large computing capacity, working together with the warehouse management system.

39
return to suppliers and products of the season. The merchandise is arranged on pallets
organized by each of these areas and by supplier. The storage time of the articles may
vary from days to months, which reinforce the importance of the existence of a physical
space for the treatment of these flows.
• Dispatch: The recovery plan for each returned article is also variable depending on the
category type. Whether the recovery plan is the return to the supplier, the recycling, the
reinsertion in the direct supply chain or the donation, the centralized collection facilitates
these processes, in the sense that the merchandise can be collected to and from one single
location. Still, the period of time from the reception stage to the pickup is variable, mainly
due to the waiting period before counting and inspection, which obliges suppliers in
particular, to wait until all phases are completed. After the RL area indicates that all
previous processes have been completed, the commercial department makes contact
with the supplier and schedules a collection date of their articles in the warehouse. Even
when collecting, the supplier can check his articles quantity and state in the presence of
a collaborator of the warehouse and a physical space is also made available, otherwise
only the collection is made. In the event of loss or damage identified only at the time of
this conference, which have not been assigned to the stores previously, they will now fall
on the warehouse itself.
Recovered Products (See Annex 4)
These goods come from the ALC’s stock and JIT warehouses. In these warehouses, a
previous analysis of all articles received from suppliers is made. When a product or packaging
is damaged, it can no longer go to the store, being taken to AR. Note that it is not only the
damaged product that is returned, because if the damage of a product damage, even if
minimally another product, also this is returned. Take as example a box containing a certain
amount of soda bottles (or bottles of wine, olive oil, sauces, etc.), if a bottle explodes,
damaging the label or packaging of the remaining bottles, even if they are minimal damage,
the whole box is considered damaged and will no longer follow the store. The delivery of
these products in AR is made whenever a damage is identified, not requiring a collection
order or having specific days for that return. In the source warehouse is given its breakdown,
and the merchandise is prepared for return which is often a fast process given the proximity
of the warehouses, being transported from truck to the other warehouse. Per day, AR
receives between one to two27 pallets with damaged items, and no separation by supplier.

40
The products are received, being the target of a second verification, first simple which
includes the counting by comparison with the guide accompanying the goods, and
subsequently undergo thorough inspection, to ascertain the status of these articles, and to
determine the recovery plan. If these, although unsuitable for sale, are suitable for
consumption, will be donated to partner institutions of the group, and if they are completely
damaged, it is up to the AR to proceed with its destruction, whenever possible recycling,
which may result monetary counterpart for the company.
Recall Products (See Annex 5)
These relate to the repealed products. They are goods from stores, whose return comes
from customer complaints, detection of some kind of error by the internal employees of
stores and warehouses, and can also derive from the supplier itself that for some reason,
during its analyses detected a problem with the product. Complaints are due to the existence
of non-conformities, manufacturing or packaging, such as an error on the instruction label,
barcode, logo, quality control failure, etc. Each complaint is processed by the quality control
of the JM in conjunction with the supplier, in order to perceive whether there is indeed a
problem, and if so, which products and batches should be withdrawn from sale. This decision
process can take between days and weeks27, and with this investigation it is also intended to
ascertain the responsibility of the incident. The return to the supplier is dependent on the
content of the complaint, and the agreement between the two parties and so, the articles can
be taken to the AR, or can be destroyed at stores. If the final decision is about return to the
suppliers, commercial department issue a return order for affected stores to prepare the
merchandise, that should be collected in an average time of 48 hours27. The merchandise is
received and is subject to a simple counting, by comparison with the described in the return
guide, and verification of each article. After verification, the merchandise is stored while
waiting for pickup by the supplier. During the year 2018, there were 61 requests for recall,
which were returned to 43 suppliers.
Planned Returns (See Annex 6)
Returned goods classified as planned are sourced from stores and are always intended to
return to external suppliers. These are articles, which because they have previously defined
agreements, have a kind of validity within the store, being withdrawn due to the end of a
27 Information sustained by employees based on their work experience.

41
specific campaign and/or beginning of another, because the sales did not reach the expected
expectations, or by excess of stock, that restricts the available space for other items. It
includes almost all kinds of non-perishable products marketed, such as soft bazars, books,
chocolates and articles from the recurring wine and sausage fairs. This flow of articles is
largely the result of the company’s commercial strategy, constant promotional campaigns,
which makes this type of merchandise the largest volume of returns. Every week there are
campaigns, consequently, every Monday the commercial department sends return proposals
via email, to the stores and to the AR, with indication of the articles that must be returned
and received, respectively, along the week. After the collection in store and the reception and
counting in the AR, the process proceeds with greater or lesser speed, with the verification
of each article, for subsequent storage, and dispatch to the supplier.
Seasonal Returns and Regrouping (See Annex 7)
In the case of seasonal goods, they come from the stores, and are characterized by a
seasonal demand, such as heating and/or cooling equipment, summer items, Christmas or
“return to school”. Being from external suppliers exists for the most part arrangements for
subsequent collection if the products are not sold. In the specific case of their own brand
heating/cooling articles, these are returned by the stores at the end of their campaign and are
Figure 11 - Map of Operations of the Reverse Flow of Seasonal Returns and Regrouping

42
stored in the RL warehouse until the following year. Regrouping goods constitute those that
return and are stored for a period, but aimed to redistribution through the direct supply chain
at the next station. In the past, these goods represented a larger volume, with several products
and not only seasonal. Currently, regrouping activities are more punctual. The process of
returning these articles is similar to that of the planned returns, starting in the commercial
department, with the issuance of return proposals (on Mondays) to the stores and to the AR.
The stores have the remainder of the week to prepare and send articles, through a centralized
collection. The process continues in the AR, with the reception and counting of the returned
merchandise, followed by its verification and storage on pallets and boxes, where they await
the collection by the external supplier, if applicable. For these goods, the warehouse assumes
the function of complementing’ warehouse to the partner stores. Thus, in the following
season, the commercial department determines a store allocation for these articles, and AR
reintegrates them into the direct supply chain.
b) Flow of Recyclable Waste
It is also for AR that return the recyclable materials collected by the ecopoints available
in Pingo Doce stores to be properly treated. The management of the reverse flow of
recyclable materials is much simpler when compared to the first. All the procedures for its
return are already fully defined, from the return dates to the final destination of all materials.
Contrary to previous returns, which came from stores and warehouses, without most
times even reaching the customer, the flow of recyclable materials comes directly from the
final consumer and can or cannot have been purchased in the group stores. Also can be
prevenient from employees of stores and warehouses and are also the result of the
distribution operations of JM, which produces high volumes of waste. This JM decision to
have collection points for end-of-life goods and miscellaneous waste is part of the company’s
mission to be every day and increasingly, a healthy company, with concerns, both
environmental and with the involved areas where it operates. The recyclable materials that
are part of this flow include: paper/paperboard, glass and plastic; batteries; used food oils;
coffee capsules; caps and stoppers; WEEE28. The latter include batteries, bulbs and damaged
appliances and are end-of-life items and/or no warranty in force.
28 WEEE - Waste Electrical and Electronic Equipment. In portuguese: “REEES – Resíduos de Equipamentos Elétricos e Eletrónicos”.

43
The return process is similar for all of these residues (see Figure 12), and starts in the
stores holding these ecopoints, and the return guides are made manually by the stores.
Throughout each month, consumers can deposit their waste, which is collected on the last
Wednesday of each month by the distribution trucks. The waste is transported to the AR,
where the validation of the return guide and separation by type of residue is carried out, and
together with the residues collected in the ALC, are stored for approximately one day until
the collection by the company responsible29. Given the volume of waste, and also given the
fact that a centralized collection has been made, the JM receives a monetary counterpart
which at this time ends up equalizing the amount it also pays for the rental of collection
deposits in stores and warehouses. Until the existence of this warehouse, this balance was in
fact negative (loss) because it was necessary to pay for the rental of the existing collection
deposits, whose monetary counterpart of the waste did not cover, due mainly to the absence
of a centralized collection.
Figure 13 shows the number of ecopoints managed by Pingo Doce stores in the country
in 2018. The RLW is responsible for the management of 720 ecopoints distributed by 155
stores, about 42% of the national ecopoints
29 “Transucatas - Soluções Ambientais S.A (Maia)” – Company responsible for waste treatment.
Figure 12 - Map of Operations of the Reverse Flow of Recyclable Waste

44
Table 4 shows the quantities of residues managed in the years 2017 and 2018. The
quantities collected are relatively constant throughout the year, except in festive times or in
the incentive campaigns for recycling practices, which can trigger the volumes collected. In
this last year, this warehouse has managed about 54% of the national volumes.
5.3.2 Area of Transportation Assets (ATAS)
The management of the reverse flow of transportation assets is the oldest of the flows.
Initially, the management of this was the responsibility of the respective team of each
warehouse or department, and since the creation of the reverse logistics department, in 2012,
it has been its responsibility. Since the construction of the ALC, it is in the RLW, more
specifically in the area of TAS that all action happens. In this flow we include a wide variety
Waste (in tonnes)
Total 2018
ALC - 2018
% in ALC
WEEES (including Fluorecent Lamps) 97,93 48,15 49%
Batteries 13,79 4,38 32%
Used Food Oils 96,14 42,09 44%
Ink Cartridges 1,81 1,67 92%
Coffe Capsules 118,32 76,67 65%
Caps and Stoppers 15,77 13,00 82%
Total de Resíduos 343,76 185,960 54%
Table 4 – Volumes of Waste Collected - Country and Alfena Logistics Center - 2018
350
360
345
46
45
284
273
144
154
139
23
22
138
100
0 50 100 150 200 250 300 350 400
WEEES
Batteries
Oleons
Fluorecent Lamps
Ink Cartridges
Coffee Capsules
Caps and Stoppers
ALC - 2018 Total 2018
Figure 13 – Number of Ecopoints in the country and associated with the Alfena Logistics Center

45
of pallets, plastic boxes, a total of 24 types30 (See Annex 10). The TAS come mostly from
suppliers of goods, who may or may not want to return them. In the first case, it is up to the
RL team to proceed with their return, in the second case, the TAS can become JM’ property,
which can either reintegrate them into the direct flow or sell the damaged ones31. There are
also three companies working effectively in this warehouse, which in exchange for the space
provided by JM, allow the use of transportation assets for the daily operations of the group,
and organize and certify the quality of the assets they supply.
Similar to the reverse flow of merchandise, this flow can also start in other warehouses
in the logistics center, or in stores. The stores gather the TAS to be returned, organize and
account for each type and deliver them to the means of transport that supply the stores, as
was the case in the previous flow. In the remaining warehouses of the ALC, the goods of
each supplier are received in pallets and/or boxes, and not always all of them are necessary
to make the transport to the stores, so they are taken to the area of transportation assets.
30 All the assets listed in Annex 7, with the exception of three, the skateboarding of frozen foods (in portuguese: “skate dos congelados”) and the fresh pasta TAS (in portuguese: “ativos de transporte de massa fresca), which do not exist in the flow of the Alfena Logistics Centre. 31 Includes only White Pallets (identified in Annex 7 as “Paletes Brancas”), those which are considered damaged, not being in the appropriate state for use by the company.
Figure 14 - Map of Operations of the Reverse Flow of Transportation Assets

46
The process continues and the assets are received and counted, based on the return guide
that accompanies each type of asset returned. The physical state of each pallet or box is also
checked and then stored in the warehouse by type or immediately can take different
destinations. In the case of TAS belonging to the supplier based there, it is up to the latter
to control, in quantity and quality, its transportation assets. Those coming from other
suppliers or owned by JM are the responsibility of RLW employees. These assets, according
to their need and owner, can have several destinations. Some of them are sent to the other
warehouses within the logistics center, reintroducing themselves into the direct flow. The
boxes and pallets dedicated to the transport of fish are sent to the washing and disinfection
area, an activity carried out by RLW operators. Another part is collected by its primary
suppliers. If extremely damaged, some assets can be destroyed. Finally, another significant
part of a specific transportation asset, the white pallets is sold. JM has found that there is a
market for damaged white pallets, and items that are not of use to the company, are for other
companies that pay reasonable amounts for their purchase.
5.3.2.1 Sale of Damaged Transportation Assets
The sale of damaged pallets (See Annex 11) represents the only activity with direct profits
for the RL warehouse. It comprises only the white pallets that do not belong to any of the
companies working there (See Annex 7), and are sold at values between € 0,15 and € 5. In
2018, a total gain of € 379.953,55 (on average € 31.632,80 per month) was achieved, with
around 156.199 pallets sold (on average € 13.017 per month). The sale of the most expensive
pallet, Europalete which costs 5 € per unit, generated a gain of € 188.760,00, representing
about 50% of total earnings. Figure 15 shows the distribution of assets sold, according to the
gain obtained from each type, with an indication of the unit price of each asset.
49,7%
25,7%
11,5%
5,3%
2,4%2,0% 0,8% 1,8% 0,2%
0,7%5,00 € > Europaletes
3,00 € > Europaletes Broken
1,65 € > Typo Euro
0,60 € > Typo Euro Broken
1,65 € > 1200x1000
0,60 € > 1200x1000 Broken
Figure 15 – Distribution of Sales of Transportation Assets by Type

47
5.3.3 Other Reverse Flows Identified
In addition to the flows already mentioned, there are two other flows which need to be
addressed. The first is perishable goods. The ALC has warehouses for perishable goods, fruit
and vegetables and fresh fish. As a result of their unique characteristics, these goods are
treated differently when damaged in some way, and becoming unfit for sale to the public. If
they are still suitable for consumption they can be donated, or otherwise these goods are
refrigerated and stored in the warehouses where the damage was detected, while waiting for
collection by a recycling company.
Another identified flow is the continuous reuse of cardboard boxes, such as banana
boxes, as support for items returned in other flows. These cardboard boxes, in addition to
existing in great abundance in the supply chain, because a large number of products are
supplied in them, represent an excellent transport aid, being able to support a high weight
and being very versatile.
5.3.4 Summary of Types of Returns
For each of the identified flows, a map of operations of the main associated processes
was also carried out. With this mapping, the different origins and reasons for returning the
different products, materials and assets are highlighted. In terms of goods, the stores are the
main source and the end of promotional campaigns (planned) and seasonal the main reasons
and with the largest volumes originated. For transportation assets, the main origin is also the
stores, and the reason is always the end of use. In addition, the maps clearly identify the
various stakeholders, internal and external to the organization, in this RL process.
Planned and seasonal returns and regrouping are treated together, so it is not possible to
highlight the individual volumes of each of these types of goods. This distinction is made
because the reason for return is different as well as the recovery plans. During 2018, 611
planned and seasonal returns proposals32 were made (on average 12 per week) with items
returned to around 160 suppliers. The analysis of the maps and the description made, allows
to highlight two main phases in all the flows of goods:
32 Each proposal includes only one product type and one supplier.

48
• The phase of entrance of goods in RLW, with the reception, counting and verification
of all articles. These ate time-consuming processes, mainly due to the non-compliance
with delivery procedures by the stores and overload of work on some days of the week.
This is the phase that requires the most human resources, time and space.
• The exit phase of goods from the RLW, with various recovery plans taking place. The
return to the primary supplier is the destination of most of the returned goods. For
contractual reasons, delay in the conference or the supplier’s own delay, this pick-up may
take longer, increasing the time spent in the warehouse. Even the moment of collection
from the supplier is a time-consuming activity, due to the need to check the returns.
Table 5 shows the evolution of volumes managed by the reverse logistics area from 2014
to 2018, based on KPIs33 prepared annually. From 2014 to 2018, total volumes grew by 73%,
from 23.474.546 to 40.529.580 units, with the volume of TAS managed showing the highest
volumes managed and with the highest growth.
* Includes Planned and Seasonal Returns
The year 2018 was the first full year of operation of RLW, and the data obtained already
prove the size and need of this area. Table 6 shows the quantities of articles that circulated
through this warehouse throughout 2018. The main entrance and exit processes for both
goods and transport assets are highlighted. A total of 1.525.290 units of goods were received
and 1.308.355 dispatched, this difference being due to the fact that the goods returned from
the stores were received, but the collection by the supplier did not take place during 2018,
33 KPIs – Key Performance Indicators. The elaborated KPIs do not take into account all the volumes managed, however, they already reproduce an idea of the size of the largest volumes worked.
Types of Volumes
2014
2015
2016
2017
2018 Re-distribution Stocks / Regrouping 322.447 17.651 22.492 20.042 23.146 Entrance - Returns from Stores* 968.514 1.339.468 1.422.165 1.782.218 1.451.919 Exit - Returns to Suppliers 1.105.754 1.708.477 1.418.563 1.685.244 1.234.984 Total Volume Merchandise 2.396.715 3.065.596 2.863.220 3.487.504 2.710.049
Reception - Returns from TAS 10.795.589 11.589.552 13.892.113 18.949.306 23.043.412 Exit - Washing TAS 394.095 497.730 432.695 584.283 578.417 Exit - Returns TAS Suppliers 9.888.147 10.886.349 12.636.196 12.501.330 14.197.702 Total Volumes TAS 21.077.831 22.973.631 26.961.004 32.034.919 37.819.531
Total Volumes Worked 23.474.546 26.039.227 29.824.224 35.522.423 40.529.580
Table 5 - Volumes managed according to KPIs from 2014 to 2018 (values in units of product)

49
but in the following year. In terms of transportation assets, there were 23.043.412 units
received and dispatched for different purposes, sale (156.199 - 0.7%), primary suppliers
(8.111.094 - 35.2%), washing (578.417 - 2.5%) and head office suppliers (14.197.702 - 61.6%).
An average of 390 pallets are shipped daily to the remaining warehouses, being in continuous
rotation.
*The displayed volume means the entrance of 23.146/50.000/225 units and exit of the same units for redistribution, donation or recycling and return to the supplier, respectively.
Table 6 - Volumes of Managed Merchandise – 2018 (values in units of product)
5.4 Difficulties Identified
The more efficient all the work is done here, the more and better the results, both
monetary and non-monetary, will be. The main difficulties experienced on a daily basis in
the warehouse are related to the physical space of the warehouse, the workforce and the
required materials/equipment, the fulfilment of the delivery and reception procedures and
the mentalities, as described below:
• Physical Space of the Warehouse
One of the main difficulties has to do with the physical space. Given the growing size of
the group, the 2017 workload is not the 2018 workload, and physical needs increase day by
day. When constructing the space, account was taken of the workloads existing at the time,
but perhaps it was not taken into account, that new flows would arise and that new storage
and support work to other areas would appear. Therefore, the greatest difficulty occurs on
Types of Volumes
Total 2018
Entrance and Exit – Redistribution Stocks / Regrouping* 46.292
Entrance and Exit – Recovered from Storage* 100.000
Entrance – Stores Returns (Seasonals and Planneds) 1.451.919
Entrance and Exit – Recall* 450
Exit - Returns to Suppliers (Seasonals and Planneds) 1.234.984
Total Volume of Volumes Managed 2.833.645
Entrance – Returns of Transportation Assets 23.043.412
Exit - Sale of Damaged Transportation Assets 156.199
Exit – Suppliers of Primary Goods 8.111.094
Exit - Washing TAS 578.417
Exit – TAS Returns to Suppliers (CHEP,IFCO,LPR) 14.197.702
Total Volumes of Transport Assets Managed 46.086.824
Total Volumes Managed 48.847.098

50
the most crowded days, in this case, Tuesdays are complicated days in terms of time and
space management, just as in weeks of the end of larger campaigns or the end of festive and
seasonal seasons.
On the other hand, the warehouse is also not close or connected with the other
warehouses in the center, which makes it very difficult to communicate with the other
warehouses, from the transport of recovered products to the transport of pallets and boxes,
as these require a means of transport that are not always available. Initially, a truck would
have been allocated to this task, but it is regularly used for other tasks.
• Procedures and Returns Treatment
There is a lack of compliance with delivery procedures, both for TAS and goods.
Transportation assets do not always come organized by supplier or by type, and they happen
to come with returns guides all together or mixed or with no guides at all. These situations
hinder and delay the processes of reception, counting and inspection, and in crowded days,
human resources become scarce for the work that needs to be done. Sometimes, the lack of
manpower to make the conference, and the lack of physical space and time, causes the goods
to be stored for weeks or months, until the conditions to continue the work are provided.
Returned products are strictly controlled, not only at the counting level, but especially at
the inspection level. Each product and asset is analysed in detail, which depending on its size,
can take from seconds to a few minutes. It is estimated that for at least half of the employees
in this warehouse, their job is to “check the work of the stores” 34. This happens because in
addition to the need to check the physical condition of each unit to determine its destination,
this process is also necessary so that the store from which the item/asset comes can be
responsible for the damages and losses identified. The volume TAS’ losses tends to be too
high, between 400 and 500 units per month. The main reasons for these occurrences are the
carelessness of those who handle and control the assets and its high value in the secondary
market, since each pallet or box can be worth between 0.15 € to 5 €.
On the other hand, when failures are detected in the delivery processes to the RLW, the
stores are approached by the RL team, with the aim of identifying what is going wrong and
how it can be improved. However, these approaches are not always best seen by the stores.
34 Transcribed expression from one of the interviews and information confirmed on the basis of the opinions expressed by employees.

51
• Labour and Equipment
Most of the tasks are performed manually, from counting products and pallets/boxes, to
separating and inspecting them, which implies a great expense of human resources, time and
space. If, on the one hand, these expenses could be minimized with the existence of more
trust between stores and the warehouse (previous point), on the other hand, all the work
done in the RLW is still very manual and very dependent on human resources that have
proven to be increasingly scarce. There is a need to modernize processes.
• Information Flow
The reverse logistics warehouse has little access to information on returns themselves and
on relationships with suppliers, namely on which and when goods will be returned, which
suppliers are associated, and whether they are associated, and when returns to them will
occur, if will in fact35.
On the other hand, the employees of the stores and warehouses also have little knowledge
of the meaning of reverse logistics, of the inherent practices, of the complete return process
associated with any goods or transportation asset, and of the importance of each phase of
this process, for its success and efficiency. In warehouses, this perception is greater than in
stores, the concept is known even though it is not used day by day, and there is an awareness
of the contribution of that warehouse to the overall activity of the company.
• Agreements with Suppliers
There are goods pending of delivery to suppliers, due to lack of understanding about the
destination of these articles. Not always the contracts established with suppliers are clear
enough, and takes into account all the possible situations in which goods can return.
• Institutional Partners
There are products for weekly donations, and there are institutional partners, who do not
always have the capacity to make the collections at the time that would be ideal for JM.
35 Contracts with vendors are dynamic, group partners today may not be tomorrow, and planned returns may no longer occur. This information does not always reach the RL team, causing some “confusion” in the management of these flows.

52
5.4.1 Difficulties at Stores’ level
For store employees, the lack of knowledge of the concept of reverse logistics was
evident, and the idea that “returns are a job that has to be done, but that takes work, takes time, we try
to dispatch things as quickly as possible, we try to be careful, but we can’t always check everything we send.
We lack people, we lack time, we lack space. The shops are not prepared with space beyond the sales space,
so we can carefully prepare what is to be returned, separating pallets by supplier, or pallets and boxes for each
type is very difficult because we don’t have the resources” 36. On the other hand, the fact that in several
stores, the space for receiving, storing and shipping items is too exposed37 and increases the
exposure to robbery and consequently losses.
5.5 Monetary Costs and Gains
Like any logistics department, doing reverse logistics also entails costs. But unlike other
warehouses, a RL warehouse represents the only area of logistics that can have direct
monetary gains, transversal to the specific business of the company. It should be noted that
the RLW has several associated costs, ranging from the cost of its construction (initial
investment), to its maintenance costs and other costs and benefits to the employees that are
supported by the company’s main structure. Table 7 summarises the main total expenses
directly associated with the reverse logistics area, as well as the gains generated during 2013
and 2018. The weight of each one in the annual total cost, its monthly average and the
variation of each item from 2013 to 2018 are also presented.
In 2018, the first full year of the RLW in operation, the total expenses were € 1.215.145,
with an average of € 101.262 per month. The main expenses include Personnel Costs of €
580.247, which totalled 47,8% of total annual costs, Rents and Rentals of € 188.695,32, around
15,53% and General Expenses of € 182.042, around 15,0%. The cost described as Rents and
Rentals relates to the rental of the warehouse in Vila do Conde and the rent of the service
machines in the warehouses. As seen before, the fact that the goods and TAS are transported
by the same means of transport that carry out the distribution, makes the costs with Transports
to be zero. All these costs are abated by the monetary gains associated with the sale of
damaged assets, which amounted to € 379.593 in 2018, an average of € 31.921 monthly. This
36 Transcribed expression from one of the store’ interviews. 37 Space with cover, but “open” on the sides (with bars).

53
gain covered warehouse costs by around 31.5%. With the costs remaining at € 832.098. It
should be noted that, although the RLW is responsible for the reception and dispatch of
waste from 155 stores, the associated monetary returns are not accounted for there38.
* Water, Electricity, Fuel and Communications.
Table 7 - Costs and Gains associated with the Reverse Logistics Warehouse 2013 and 2018
In turn, the oldest data on costs and gains of the RL area that could be accessed date
back to 2013, when this area was still managed in three spaces. The analysis of the table
allows some significant conclusions:
• Total Costs for 2013 were € 1.982.813, about 58% higher than in 2018.
• Personnel Costs remained relatively similar, as the move to Alfena only led to the
reintegration of existing human resources.
• The Transport Costs of 611.391 € have disappeared completely;
• Several cost items decreased, such as Cleaning and Security and Rents and Rentals, by -79%
and -40% respectively, while others increased, such as General Expenses from € 27.516 to
38 We can confirm that there is a monetary counterpart for JM associated with the recycling of waste, but it was not possible to access the amounts.
2013
2018 Δ 13/18
EUR Weight Month EUR Weight Month TOTAL PERSONNEL COSTS 573.847 € 28,2% 47.821 € 580.247 € 47,8% 48.354 € 1%
Transports 611.391 € 30,0% 50.949 € - € 0,0% - € -100%
Packaging and Labels 49.996 € 2,5% 4.166 € 4.852 € 0,4% 404 € -90%
General Expenses* 27.516 € 1,4% 2.293 € 182.042 € 15,0% 15.170 € 562%
Cleaning and Safety 354.768 € 17,4% 29.564 € 74.901 € 6,2% 6.242 € -79%
Office Supplies - Othes 9.524 € 0,5% 794 € 223 € 0,0% 19 € -98%
Insurance / Fees / Contributions 2.527 € 0,1% 211 € 3.845 € 0,3% 320 € 52%
Conservation and Repair 29.005 € 1,4% 2.417 € 13.986 € 1,2% 1.165 € -52%
Other Suppliers Service 15.702 € 0,8% 1.308 € 89.966 € 7,4% 7.497 € 473%
TOTAL OPERATING COSTS 1.100.428 € 54,0% 91.702 € 369.814 € 30,4% 30.818 € -66%
Computer Support 25.297 € 1,2% 2.108 € 45.363 € 3,7% 3.780 € 79%
Rents and Rentals 314.635 € 15,4% 26.220 € 188.695 € 15,5% 15.725 € -40%
Equipment Depreciation 23.491 € 1,2% 1.958 € 31.026 € 2,6% 2.585 € 32%
TOTAL OTHER COSTS 363.423 € 17,8% 30.285 € 265.084 € 21,8% 22.090 € -27%
Total RL Warehouse Costs 2.037.698 € 100,0% 169.808 € 1.215.145 € 100,0% 101.262 € -40%
Incomes 54.885 € 2,7% 4.574 € 383.047 € 31,5% 31.921 € 598%
Total Gains 54.885 € 2,7% 4.574 € 383.047 € 31,5% 31.921 € 598%
Total Final Costs of the RLW 1.982.813 € 2,7% 165.234 € 832.098 € 68,5% 69.342 € -58%

54
€ 182.042, and Computer Support, which increased by 79%, which makes sense given the
move to a single larger space, with better conditions and higher technological needs.
• The greatest variation was in the Income from the sale of damaged transportation assets,
from € 54.885 in 2013 to € 383.047 in 2018, an increase of almost 600%.
The overall reduction in costs is visible as well as the increase in income, that are only
possible in this conditions. The costs of this warehouse also represent 2,1% of the total costs
of the Alfena Logistics Center.
5.6 Improvement Guidelines
In this last part of the work, concrete improvements will be presented that can be
implemented in the company in order to improve the efficiency of the reverse logistics
operations identified. At a stage when processes are already defined, such as trained teams
and defined work functions, it is first necessary to meet the difficulties identified by those
involved in these processes, in what are the real barriers to a more efficient daily work. In
general, we can identify several improvements, which depend on at least one of three
conditions, the need for monetary investment, the need for implementation time and the
need for a superior decision. In this part, I will organize possible improvements in accordance
with these restrictions and also their feasibility of implementation, since some improvements
were considered, but after analysis they proved to be unfeasible.
5.6.1 Improvements that require Investment and a Superior Decision:
• Warehouse Automation with possible Acquisition of Equipment for counting and
verification of goods and/or TAS
This reverse logistics warehouse has a relatively recent and updated computer warehouse
management system, and makes use of some equipment such as barcode readers that
automatically receive the goods in the system, and transport vehicles that assist in various
tasks in everyday life. However, the tasks of reception, counting, separation and verification
are entirely manual and dependent on labour and physical space to work. Analysing this
whole process, the question that arises is: “whether it is possible to modernize and/or automate this
warehouse and in what way?”.

55
In order to investigate the possibility of modernising this warehouse, a company
specialised in warehouses and their equipment was contacted. Some informal meetings were
held, where the warehouse and its operations were first presented, then the problem itself
and finally, possible solutions and their viability were discussed. Although there is a great
variety of equipment and ways of automating different types of warehouses, there is still
nothing concrete for managing reverse flows in the retail context. The management of goods
and TAS presented, presents unique challenges, namely:
• The diversity of goods and their uncertainty about the quantities and types of goods that
will be received. The arbitrary need for article-by-article verification, whatever the
recovery plan of the article;
• The diversity of TAS worked, because although there are types of assets with higher
volumes, there are 21 types of pallets and boxes received and shipped daily, with crucial
need for verification of physical condition;
For the management of goods, automatize this flow would not be feasible due to this
diversity, uncertainty and need for verification of each article, which can only be performed
manually. Automation of TAS management would also not be an easy task, although
relatively more feasible than the previous one. At the moment, existing equipment is defined
for a reduced number of pallets and boxes, and even here the equipment is not prepared to
make an accurate reading of the physical status of these assets, allowing only the reading of
the type of article, based on their weight, measurements and format and counting. In turn,
separation, storage and dispatch are operations that already exist, but always for a small,
limited and predefined number type of assets. In order to automate this area, a whole new
system for managing this flow would have to be designed from scratch, requiring an area of
implementation greater than the existing one and costs that could easily exceed one million
euros. The opinion of the salesperson who followed the case is that, for the time being, the
development of automation in the reverse logistics area is still practically nil, and that, based
on the volumes worked, it is still not justified.
We concluded that, at least for now, equipment does not represent a viable solution for
improving the efficiency of this warehouse. In the future, with the greater increase in
returned volumes, and a greater awareness of the need and benefits of this area properly
developed in a company, it will be possible to create more efficient automated solutions.

56
• Associate a Vehicle of Transport only for the operations of the RLW
Although this has been previously defined, there is no compliance and the allocated
vehicle is regularly used in other tasks, effectively ending up being removed from the
warehouse guard. This decision to remove the truck from the exclusive use of the RLW, was
made with the perception that the work, even if regular and sometimes excessive, still did
not justify the allocation of a particular mean of transport.
5.6.2 Improvements that require Investment, a Superior Decision and Time
• More Operators and Qualified ones in Warehouse and Stores
The need for human resources, and above all, dedicated and committed human resources
in the work they do has been proven. Thus, it is up to the company to make new hires, which
given the current difficulties will only be possible with fairer and more attractive work
proposals. Currently, the working conditions, and in particular the salaries offered to store
and warehouse operators, are not perceived as such, so they should be reviewed in order to
attract and above all to support the workforce in the long term. Even if higher qualifications
are not required for this kind of work, conditions should be offered that encourage good
work. Managers should also supervise the needs of stores and warehouses more closely.
• Training and Awareness of Store and Warehouse’ Employees
The company is responsible for training and raising the awareness of its employees from
stores and warehouses about the concept of reverse logistics, about the entire associated
return process, and the need for these operations to be as efficient as possible, and the
difficulties that regularly arise. Sessions in this sense should be defined in the calendar of
activities of the group, because one to two sessions annually, exposing the mentioned, could
result in changes in the behaviour of employees.
• Take into account the Need of more Stores’ Space to prepare the Goods and Assets
to be Returned
It was evident the lack of physical space in the store to deal with the normal stock of the
store, and with the preparation of articles for return. In the future, it will be necessary to take
into consideration when opening new stores, that there is a need for warehouse space in
them. A properly closed space that allows the reception, preparation and expedition of goods

57
and TAS with care. This will allow faster and more efficient processes, and less losses, if this
space is less exposed to robbery.
5.6.3 Improvements that do not require Investment, but Time and a Superior
Decision
• Create a Function on Store for Monitoring the Return of Products and TAS
This measure aims to ensure that all working instructions are complied with, from the
organization of goods by supplier, and pallets and boxes by type, and the guarantee that the
return guides are correct and properly distributed among the items. On the other hand, this
closer monitoring allows for greater control of transportation assets. In this way, the work
that follows in the warehouse can be faster and more efficient, and the volume of losses
reduced. With all stages of the return process being more organised and efficient, the whole
company will benefit. To take a concrete example: if the pallets come from the store properly
separated, there is no need for more people just separating pallets/boxes and items, which
would make the entire return process faster. If goods and assets are properly organised from
stores, it is estimated that at least two people could be saved daily in each of the areas of
managing products and assets39.
• Distribution of the Losses Equally among the Stores
One solution that would help save time and resources used to control goods and TAS
would be to have less control and more confidence in the work of the stores, and the losses
distributed equally across the stores, as both stores and employees from the warehouse
belong to the same group and all work towards the same goals. The disadvantage of this
measure is that the stores can reduce their concern in preparing the items for return, as they
know that the losses will not be directly attributed to them. On the other hand, the items
that are returned to the supplier have to be counted and checked in any case. We conclude
that this measure is not as viable as one might initially think.
• More Concrete Information about the RL Practices and Results of the Group
The work carried out by the company at the level of reverse logistics does not have the
exposure it could. Its practices and results are not yet included in any of its public reports,
39 Information sustained by employees based on their work experience.

58
and perhaps because of this, the growth in this area is lower than in others. As this is a
relatively recent area, more measures of analysis and especially of evaluation of this area
should be created and even disclosed in the group’s reports. Measures such as, for example:
⋅ Quantities of goods returned by type (half-yearly or quarterly) and their monetary value;
⋅ Return cost of each article (general or per article group) and storage cost of each article
⋅ Cost of TAS’ losses;
⋅ Information such as the main existing reverse flows, their volumes and monetary values
could be presented in public. First, in order to make this area known to consumers and
institutional partners. And second, since JM is a group with an image of a sustainable
company and a reference in retail, it could make use of its position to be an example and
incentive for other companies to acquire these practices.
• Greater Control over Transportation Assets all the way through the chain
The teams responsible in the warehouses and stores should be constantly aware of the
inventory moved and inventory stopped in order to reduce losses (around 500 assets per
month). With this greater control, the areas where losses were detected should be held
responsible, in order to encourage control and care in their management.
• Continue to ensure, and clearly, that all Goods Purchased have Return Policy
Contracts with the Suppliers
For an efficient reverse logistics, this is an essential point. Without return agreements
with suppliers, the company is restricted in the volumes and respective prices at which it
purchases the items. Is subject to losses if it is not able to despatch the entire stock for sale,
which also results in an increased need for storage space in the RLW for stock in excess.
These agreements/contracts should also include clear procedures/criteria for accepting or
rejecting goods, for any non-conformities that arise, or other situations involving the return
of goods. This improvement guideline aims to make returns to suppliers quicker and more
efficient, and to reduce the length of time items remain in the warehouse. There are specific
contracts (D. Simchi-Levi, Kaminsky, & Simchi-Levi, 2008), which among other benefits
stimulate the development of RL, such as the Buy-Back Contract or the Quantity-Flexibility
Contract. The fact that it was not possible to access the existing contracts between JM and the
suppliers, does not allow knowing if these contracts may already be used by the group, and

59
if not, only the comparison between both, the existing and the suggested ones, could allow
more precise conclusions in this sense.
• Better Flows Management
One of the great difficulties in the management of TAS and goods is related to work
peaks, namely on Tuesdays. An analysis could be carried out of which stores have more
storage capacity, in order to try to dilute the return of these by the other days of the week,
making the flows more uniform throughout the week and easier to manage.
On the other hand, the RL team should have right from the reception, concrete
information on the destination of each article received, and for those who should return to
suppliers, strict dates should be set for the collection. In this way, it would be possible to
better manage these flows, allocating and preparing the goods accordingly, and freeing up
space for other tasks and storage of other items more quickly.

60
6 Conclusion
In this sixth and final chapter, the main conclusions resulting from the work developed
for the company and the academic field will be presented, as well as the limitations of the
research and suggestions for future.
6.1 Main Contributions
This project arises primarily from a need of the Jerónimo Martins Group to know and
analyse the processes and operations in one of its most recent areas, Reverse Logistics.
However, it was the group’s openness to the academic field that enabled the development of
this study, with the creation of a partnership between the student and the group, with the
aim of working towards this need. The objectives identified at the beginning of this work
were adhered to throughout chapters four and five, and supported by real information
obtained through access to the company’s work area.
The present report began with a review of the relevant literature to the topic, with the
aim of understanding the fundamental dimensions to be explored around the
implementation of the reverse logistics area in an organisation. The literature concludes that
the concept, although increasingly recurrent, still has a low level of real integration in
organisations. It was found that the study of the implementation of reverse logistics, although
increasing in recent decades, is still limited, and focuses too much on the drivers and
associated barriers, and fails to explore in practical terms how the implementation should be
done, and how the flows of returns should be managed in a real company. One of the
objectives of the work is to meet this gap, describing in detail how reverse logistics happens
in a real company, contributing with data that will be both useful for the academic
environment and for the industry itself.
The development of the project allowed us to conclude that what happened at Jerónimo
Martins is globally in line with what is mentioned in the literature, from the motivations of
the company, the real reasons for the return of goods and assets, to the main types of product
and key processes for their treatment and recovery. In addition, the growing importance of
the topic within academia is accompanied by the growing importance attributed by the group
to this logistics area, which is proven by the changes made over the last few years in the
management of returns, in 2012 and more recently in 2017. These dates represented decisive

61
milestones in the history of Reverse Logistics within the group. The key points of the group’s
reverse logistics chain are presented based on the five dimensions of the framework
presented by Brito and Dekker (2003).
Despite the fact that there have always been returns to manage, only recently Jerónimo
Martins has opted to start carrying out most of the processes and operations associated with
it internally, and with the appropriate conditions. In turn, a single space for this area in the
Alfena Logistics Center, allowed more centralization and proved to be crucial for the proper
functioning of the group’s entire logistics chain. Firstly, the fact that the RL warehouse is in
the same space as the other warehouses, allowing greater proximity with the direct supply
chain and aid to other areas, and allowing the direct flow transportation network to be used
to collect goods and assets from stores. In addition, allowed suppliers to take advantage of
their goods delivery circuit in other warehouses to collect their returned goods. The
development of this space was also translated in a drastic cost reduction of around 60%, and
Dimensions
Jerónimo Martins
Why to
Receive?
Subchapter 5.2 - The main motivations of the company are the need to be more efficient (reduce losses and provide more support to other areas of the company), reduce costs (the comparison of costs in 2013 and 2018 shows), improve relationships with suppliers and strengthen a responsible company image.
Why to
Return?
Subchapter 5.3 - The main reasons for returns include damage, seasonality and uncertainty of demand, volume of goods purchased, quality issues, existence of supplier return contracts, end of life of the articles.
What? Subchapter 5.3 - Identify the flows of non-perishable goods (recovered products, recalls, seasonal and planned and regrouping), the flow of recyclable materials and the flow of TAS, as well as their relevant characteristics.
How?
Subchapter 5.1 and 5.3 - The space where the main processes take place is presented, as well as the necessary resources. The management of each flow is described and mapped in detail (Reception, Counting, Verification, Storage and Dispatch phases), and the main existing recovery plans include recycling, return to supplier, donation or reintegration into the direct supply chain.
Who?
Subchapter 5.1 - Those involved in this area are presented, internal to the company: including the warehouse itself and its employees who carry out most of the processes, as well as the other warehouses and stores and employees who return the goods and assets; and external to the company: the customers of Pingo Doce stores, the several suppliers who collect what is assigned them, the recycling companies and the buyers of damaged assets that represent end customers of some of the flows.
Table 8 – Application of the Five Dimensions of Brito and Dekker (2003) to the Jerónimo Martins case

62
other indirect benefits, which are not all possible to quantify, are visible and perceived by
those involved.
With the study, it was verified that the main barrier to the development of RL in this
company in recent decades and now even, is not the absence of resources or
knowledge/know-how, but the existence of a reactive attitude of employees and managers
in doing what is necessary only when it is necessary, and not bet on a more proactive
development, and learning from the difficulties and errors present and past. The mentality
of those involved, the way in which RL is still seen by those involved as “one more job”40 and
“something that if it is done badly, there is no problem”40 is also a major barrier to the increase of the
efficiency of this area. There is a need for greater compliance with the stipulated procedures,
and for awareness of the importance of this area and the whole process associated with it. In
addition to the above, it should be noted that the improvement of reverse logistics operations
particularly involves internal changes, which, although requiring more time and a superior
decision, require little or no investment.
With the development of this project, Jerónimo Martins has now, a detailed mapping of
all the processes and practices associated with reverse logistics. The main flaws/difficulties
experienced in daily operations were also identified. These two elements are fundamental
inputs for outlining improvement solutions, which are presented at the end of the project.
The improvements presented are real and possible to put into practice, although for this
purpose, it is necessary to go deeper into them, in order to determine the cost and return
ratio, as well as their feasibility.
The fact that the sample is composed of only one company, and with a very specific
reality in a very specific sector, does not allow the generalization of its results. A reverse
logistic chain must always be implemented based on the characteristics of the organization
of the environment where it operates. However, the results of this project provide other
companies with information on what is currently being done in the area and how it is being
done. Since Jerónimo Martins is a renowned company, this work is also an incentive and a
starting point for organisations that are considering implementing these practices.
40 Transcribed expressions from the stores’ interviews.

63
6.2 Limitations and Future Work
Although the proposed objectives were achieved, some difficulties arose during the
development of this project. We highlight the relatively short time spent in the company,
given that the student reconciled the development of the dissertation with a full-time job in
another company. With more time spent in the company it would have been possible a more
quantitative mapping of all reverse logistics processes, obtaining times of operations,
volumes of flows (daily or weekly) of entrance and exit, among others. A more quantitative
approach about reverse logistics in a company of this size, is the kind of work necessary on
both academic and business fields. Even at the internal level of the company, only more
recently, from 2013, began to exist precise indicators that allow to evaluate the growth of
this area, which was a limitation in the development of this study. In addition, another major
limitation was the quantity, lack of quality and dispersion of information, sometimes
outdated or incomplete. In this sense, the creation of more and best well defined
performance indicators for RL activities would be fundamental in Jerónimo Martins to begin
to exist a basis for comparison and evolution over time, and after the implementation of the
improvement proposals.
As relations with suppliers are a fundamental part of the reverse logistics process, access
to contractual information associated with returns could have been relevant in the
development of the study, in order to address possible ambiguous information regarding
returns, and suggest ways of improvement. A detailed analysis of real contracts established
between retailers and suppliers with regard to return agreements is a key topic for which
there is a lack of academic support, and should therefore be further developed when
developing such dissertations.

64
7 References
A. Taylor, T. (2002). Supply Chain Coordination Under Channel Rebates with Sales Effort Effects (Vol. 48).
Agrawal, S., Singh, R. K., & Murtaza, Q. (2015). Review: A literature review and perspectives in reverse logistics. Resources, Conservation & Recycling, 97, 76-76-92. doi:10.1016/j.resconrec.2015.02.009
Ait-Kadi, D., Chouinard, M., Marcotte, S., & Riopel, D. (2012). Sustainable reverse logistics network. Engineer.
APED. Associação Portuguesa de Empresas de Distribuição. from Lisboa - Available on Internet: <URL: http://aped.pt/pt>
Atasu, A., Toktay, B., & Van Wassenhove, L. (2013). How Collection Cost Structure Drives a Manufacturer's Reverse Channel Choice (Vol. 22).
Barbosa-Povoa, A. (2009). Sustainable Supply Chains: Key Challenges (Vol. 27).
Beckley, D. K., & Logan, W. B. (1948). The retail salesperson at work: McGraw-Hill.
Berrone, P., Álvarez Gil, M., Husillos, J., & Lado, N. (2007). Reverse logistics, stakeholders' influence, organizational slack, and managers' posture (Vol. 60).
Bonev, M. (2012). Managing reverse logistics using system dynamics: A generic end-to-end approach: Diplomica Verlag.
Bouzon, M., Spricigo, R., Rodriguez, C. M. T., Queiroz, A. A. d., & Cauchick Miguel, P. A. (2015). Reverse logistics drivers: empirical evidence from a case study in an emerging economy. Production Planning & Control, 26(16), 1368-1385. doi:10.1080/09537287.2015.1049239
Brito, M. d., & Dekker, R. (2003). A Framework for Reverse Logistics.
Cardoso, S. R., Barbosa-Póvoa, A. P. F. D., & Relvas, S. (2013). Design and planning of supply chains with integration of reverse logistics activities under demand uncertainty. European journal of operational research, 226(3), 436-451. doi:https://doi.org/10.1016/j.ejor.2012.11.035
Carter, C. R., & Ellram, L. M. (1998). Reverse logistics: a review of the literature and framework for future investigation. Journal of Business Logistics, 19(1), 85.
Chen, H., Daugherty, P. J., & Landry, T. D. (2009). SUPPLY CHAIN PROCESS INTEGRATION: A THEORETICAL FRAMEWORK. Journal of Business Logistics, 30(2), 27-27-47.
Creswell, J. W., & Poth, C. N. (2017). Qualitative Inquiry and Research Design: Choosing Among Five Approaches: SAGE Publications.
CSCMP. (2013). Supply Chain Management Definitions and Glossary.
de Brito, M., Dekker, R., & Flapper, S. (2003). Reverse Logistics - a Review of Case Studies.
Deloitte. (2014). The hidden value in Reverse Logistics, Deloitte Consulting. Retrieved from
Deloitte. (2019). Global Powers of Retailling 2019. Retrieved from
Deloitte, C. (2014). Moving forward in reverse, Deloitte. Retrieved from
Du, F., & Evans, G. (2008). A bi-objective reverse logistics network analysis for post-sale service (Vol. 35).
Eisenhardt, K. M. (1989). Building Theories from Case Study Research. The Academy of Management Review, 14(4), 532-550. doi:10.2307/258557
Fernie, J., & Sparks, L. (2004). Logistics and Retail Management: Insights Into Current Practice and Trends from Leading Experts. Kogan Page Publishers.

65
Fleischmann, M., Bloemhof-Ruwaard, J. M., Dekker, R., Van der Laan, E., Van Nunen, J. A., & Van Wassenhove, L. N. (1997). Quantitative models for reverse logistics: A review. European journal of operational research, 103(1), 1-17.
Fleischmann, M., van Nunen, J. A. E. E., Graeve, B., & Gapp, R. (2004). Reverse Logistics – Capturing Value in the Extended Supply Chain.
Frazelle, E. (2002). Supply chain strategy: the logistics of supply chain management: McGrraw Hill.
Fuller, D. A., Allen, J., Polonsky, J., & Mintu-Winsatt, A. (1995). A typology of reverse channel systems for post-consumer recyclables. Environmental Marketing: Strategies, Practice, Theory, and Research, 241-266.
Ganeshan, R., & Harrison, T. (1995). An introduction to supply chain management (Vol. 303).
Ginter, P. M., & Starling, J. M. (1978). Reverse Distribution Channels for Recycling. California Management Review, 20(3), 72-82. doi:10.2307/41165284
Govindan, K., & Bouzon, M. (2018). From a literature review to a multi-perspective framework for reverse logistics barriers and drivers. Journal of Cleaner Production, 187, 318-337. doi:https://doi.org/10.1016/j.jclepro.2018.03.040
Grant, D. B., Trautrims, A., & Wong, C. Y. (2015). Sustainable Logistics and Supply Chain Management: Kogan Page.
Guiltinan, J., & Nwokoye, N. (1974). Reverse channels for recycling: an analysis for alternatives and public policy implications. Paper presented at the American Marketing Association Proceedings.
Gungor, A., & Gupta, S. M. (1999). Issues in environmentally conscious manufacturing and product recovery: a survey. Computers & Industrial Engineering, 36(4), 811-853.
Hazen, B. T., Hall, D. J., & Hanna, J. B. (2012). Reverse logistics disposition decision-making: developing a decision framework via content analysis. International Journal of Physical Distribution & Logistics Management, 42(3), 244-274.
Jack, E., L. Powers, T., & Beitelspacher, L. (2010). Reverse Logistics Capabilities: Antecedents and Cost Savings (Vol. 40).
Kopicki, R. (1993). Reuse and recycling: reverse logistics opportunities: Council of Logistics Management.
Kumar, S., & Putnam, V. (2008). Cradle to cradle: Reverse logistics strategies and opportunities across three industry sectors. International Journal of Production Economics, 115(2), 305-315. doi:https://doi.org/10.1016/j.ijpe.2007.11.015
Lambert, D., Cooper, M., & D. Pagh, J. (1998). Supply Chain Management: Implementation Issues and Research Opportunities (Vol. 9).
Malhotra, N. K. (2010). Marketing research: An applied orientation (Vol. 834). In: New Jersey: Pearson Education.
Mendes, A. B. (2005). Modelação de vendas de novas superfícies comerciais. (Tese de Doutoramento), Lisboa, UTL – Instituto Superior Técnico, Retrieved from http://hdl.handle.net/10400.3/122
Morrell, A. L. (2001). The forgotten child of the supply chain (Vol. 56).
Murphy, P., & Poist, R. (1988). Management of Logistical Retromovements: An Empirical Analysis of Literature Suggestions (Vol. 29).
Optoro. (2018). State of Retail Returns 2018: Insights of the Returns Industry Retrieved from
Panigrahi, S. K., Kar, F. W., Fen, T. A., Hoe, L. K., & Wong, M. (2018). A Strategic Initiative for Successful Reverse Logistics Management in Retail Industry. Global Business Review, 19(3_suppl), S151-S151 - S175. doi:10.1177/0972150918758096
66
Papargyropoulou, E., Lozano, R., K. Steinberger, J., Wright, N., & Ujang, Z. b. (2014). The food waste hierarchy as a framework for the management of food surplus and food waste. Journal of Cleaner Production, 76, 106-115. doi:https://doi.org/10.1016/j.jclepro.2014.04.020
Pohlen, L. T., & Farris, M. T. (1992). Reverse Logistics in Plastics Recycling. International Journal of Physical Distribution & Logistics Management, 22(7), 35-47. doi:10.1108/09600039210022051
Pokharel, S., & Mutha, A. (2009). Perspectives in reverse logistics: A review. Resources, Conservation and Recycling, 53(4), 175-182. doi:https://doi.org/10.1016/j.resconrec.2008.11.006
Quesada, I. (2003). THE CONCEPT OF REVERSE LOGISTICS. A REVIEW OF LITERATURE.
Ravi, V., & Shankar, R. (2005). Analysis of interactions among the barriers of reverse logistics. Technological Forecasting & Social Change, 72(8), 1011-1011-1029. doi:10.1016/j.techfore.2004.07.002
Rogers, D. S., Lambert, D. M., Croxton, K. L., & García-Dastugue, S. J. (2002). The returns management process. The International Journal of Logistics Management, 13(2), 1-18.
Rubio, S., Chamorro, A., & Miranda, F. J. (2008). Characteristics of the research on reverse logistics (1995–2005). International Journal of Production Research, 46(4), 1099-1120.
Saldaña, J. (2011). Fundamentals of Qualitative Research.
Seuring, S., & Müller, M. (2008). From a Literature Review to a Conceptual Framework for Sustainable Supply Chain Management (Vol. 16).
Simchi-Levi, D., Kaminsky, P., & Simchi-Levi, E. (2003). Designing and managing the supply chain : concepts, strategies, and case studies (2nd ed. ed.): Boston (Mass.) : McGraw-Hill.
Simchi-Levi, D., Kaminsky, P., & Simchi-Levi, E. (2008). Designing and Managing the Supply Chain: Concepts, Strategies, and Case Studies: McGraw-Hill/Irwin.
Srivastava, S. K. (2006). Network design for reverse logistics. Omega, 36(4), 535-548. doi:https://doi.org/10.1016/j.omega.2006.11.012
Stock, J. R. (1992). Reverse Logistics: White Paper: Council of Logistics Management.
Stock, J. R. (1998). Development and Implementation of Reverse Logistics Programs: Council of Logistics Management.
Terry, S. H. (1869). The Retailer's Manual: Embodying the Conclusions of Thirty Years' Experience in Merchandizing: author.
Thierry, M., Salomon, M., Van Nunen, J., & Van Wassenhove, L. (1995). Strategic issues in product recovery management. California Management Review, 37(2), 114-136.
Tibben-Lembke, R., & Rogers, D. (1998). Going backwards: reverse logistics trends and practices. Reverse Logistics Executive Council.
Tibben-Lembke, R., & Rogers, D. (2002). Differences between Forward and Reverse Logistics in a retail environment (Vol. 7).
Vijayan, G., Kamarulzaman, N. H., Mohamed, Z. A., & Abdullah, A. (2014). Sustainability in food retail industry through reverse logistics. International Journal of Supply Chain Management, 3(2), 11-23.
WCED, S. W. S. (1987). World commission on environment and development. Our common future, 17, 1-91.

67
8 Annexes
Annex 1 – List of Reverse Logistic drivers, classification, and sources (Govindan & Bouzon, 2018)

68
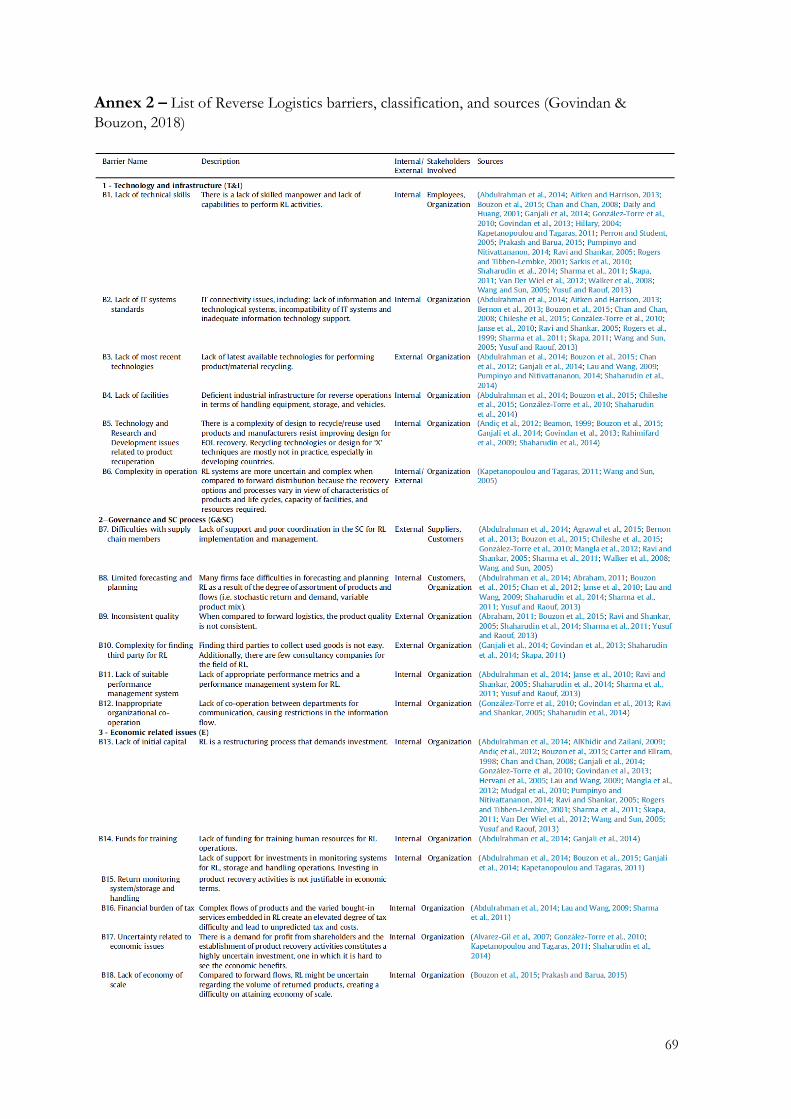
69
Annex 2 – List of Reverse Logistics barriers, classification, and sources (Govindan & Bouzon, 2018)

70

71
Annex 3 – Alfena Logistics Center Plant

72
Annex 4 – Map of Operations of the Reverse Flow of Recovered Products

73
Annex 5 – Map of Operations of the Reverse Flow of Recall Products
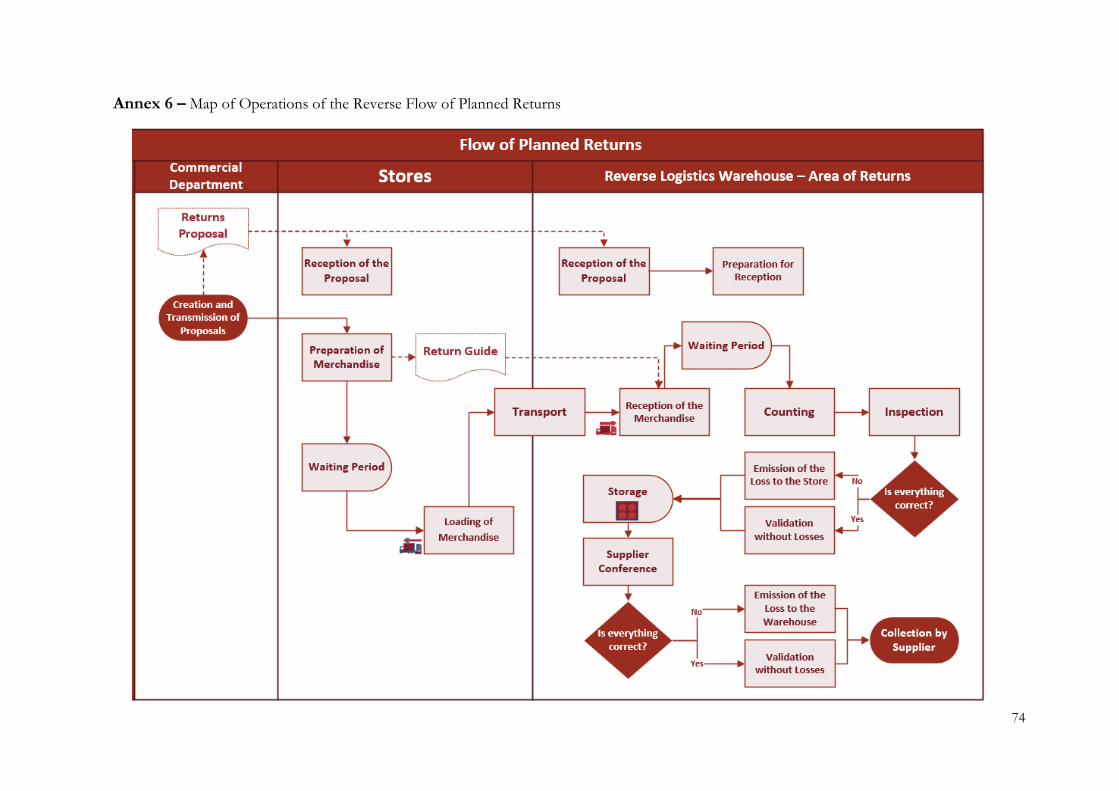
74
Annex 6 – Map of Operations of the Reverse Flow of Planned Returns

75
Annex 7 – Map of Operations of the Reverse Flow of Seasonal Returns and Regrouping

76
Annex 8 – Map of Operations of the Reverse Flow of Recyclable Waste

77
Annex 9 – Map of Operations of the Reverse Flow of Transportation Assets
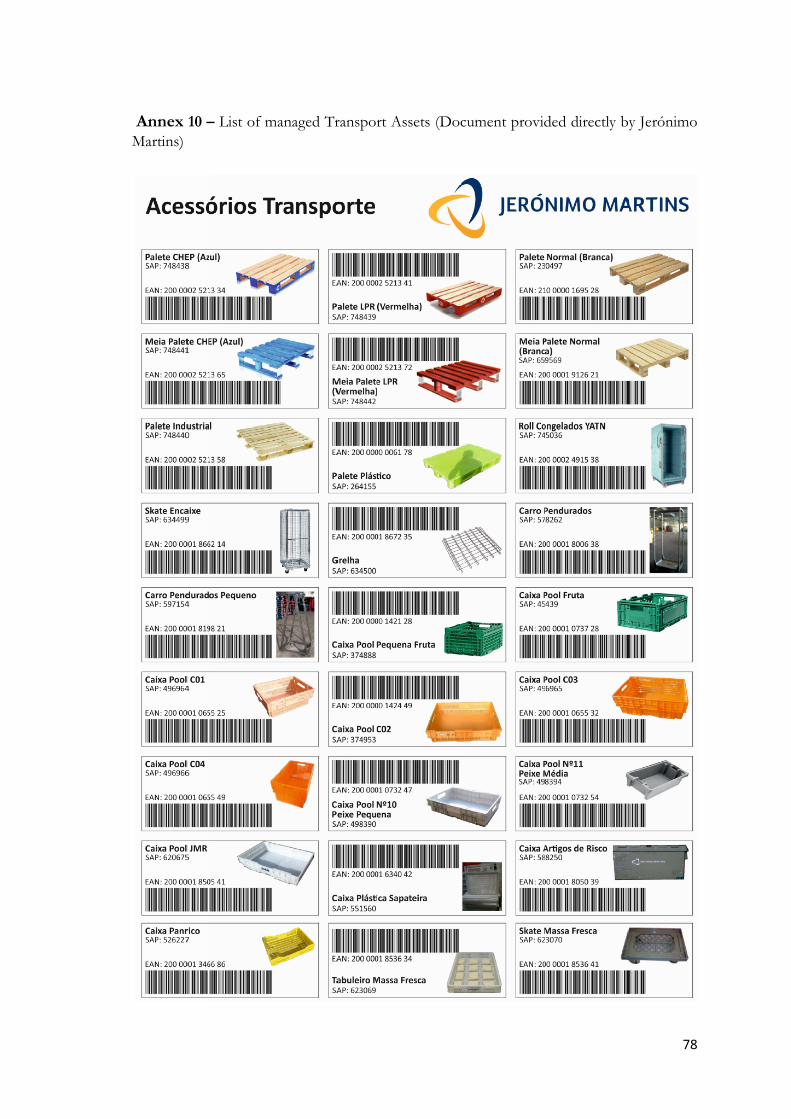
78
Annex 10 – List of managed Transport Assets (Document provided directly by Jerónimo Martins)
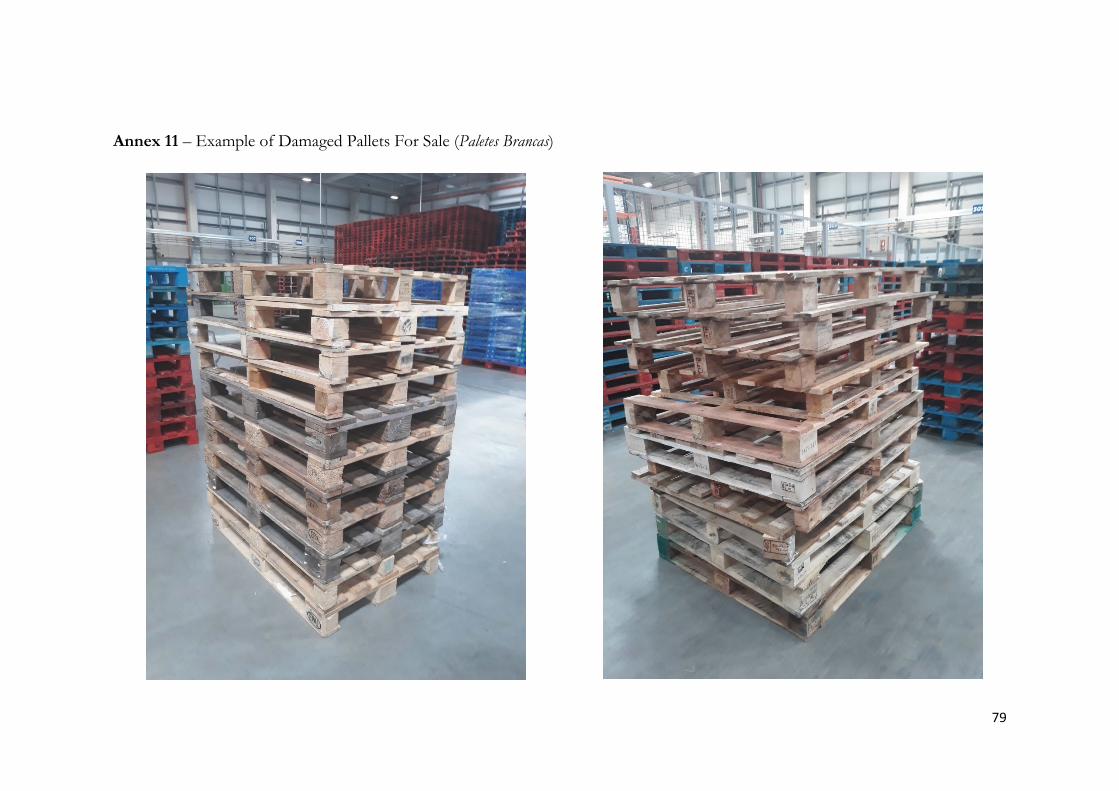
79
Annex 11 – Example of Damaged Pallets For Sale (Paletes Brancas)

80
Annex 12 – Interviews for collaborators at Warehouse and Stores
During the data collection period, interviews were conducted with warehouse employees,
including 8 operatives, 2 administrative and 1 operational manager. At store level, interviews
were conducted with 3 assistant store managers.
Questions for Warehouse’ collaborators:
• What do you think reverse logistics is, and does it include, what processes and types of
products?
• What are the difficulties you encounter when doing reverse logistics, in your day-to-day
life, but also in the way this area is still seen?
• Which do you consider that for the company were the main motivations to have this
reverse logistics’ structure?
• In what way and what are the main advantages associated with it, both monetary and
non-monetary? And in terms of disadvantages, do you think there are any?
• What do you think JM can still do to improve in this area? And in general, in other
companies?
• What are the next steps in your opinion?
• As a consumer, in your opinion, do you think the work that is done in this area is
important?
Questions for Stores’ collaborators:
• What do you think reverse logistics is, and does it include, what processes and types
of products?
• What do you think were the main motivations for the company to have this RL
structure? These processes, make all this investment, ...
• Regarding the returns operations, that have been created, how do you think they help
or contribute (advantages) to a better and more efficient management of the store and
its operations? Or do you think it is of no use to the efficiency of your store
operations?
• What costs do you associate with carrying out these reverse logistics operations here
in the store?

81
• What are the difficulties you encounter when making reverse logistics, in the
preparation of products for return to the warehouse, in the return rules, but also in
the way this area is still seen (by employees included)?
• Was it pointed out as one of the main problems of returns, the fact that the returned
products/materials are not delivered according to the recommended rules? Why does
this happen?
• Is there someone (employee) responsible for the return processes? Who handles these
processes?
• What do you think can be improved in return processes? Having someone in charge
of “watching over” these operations could help and make everything else better.