revamp of saturated gas concentration unit (sgcu) · example a technical report 4 of 33 1....
TRANSCRIPT

ADVANCINGCHEMICALENGINEERINGWORLDWIDE
Revamp of Saturated Gas Concentration Unit (SGCU)
ADVANCINGCHEMICALENGINEERINGWORLDWIDE
Example A Technical Report
2 of 33
Contents
1. Definitions .................................................................................................................................... 4
2. Introduction .................................................................................................................................. 5
3. Setup ............................................................................................................................................. 6
4. The process in SGCU ................................................................................................................... 7
5. The problem ................................................................................................................................. 9
6. My involvement ......................................................................................................................... 10
7. Analysis of the problem ............................................................................................................. 10 7.1. Operating Pressure........................................................................................................... 10
7.2. Equipment constraints in the low pressure operation mode ........................................ 11
8. Solution to the problem of low LPG recovery ........................................................................... 12 8.1. Operating Pressure........................................................................................................... 12
8.2. Column Performance ....................................................................................................... 14
8.3. Exchanger Performance .................................................................................................. 20
9. Conclusion .................................................................................................................................. 21 9.1. Equipment Performance .................................................................................................. 21
9.2. LPG Recovery ................................................................................................................... 21
9.3. Commissioning.................................................................................................................. 21
9.4. Economics .......................................................................................................................... 22
Example A Technical Report
3 of 33
Attachments:
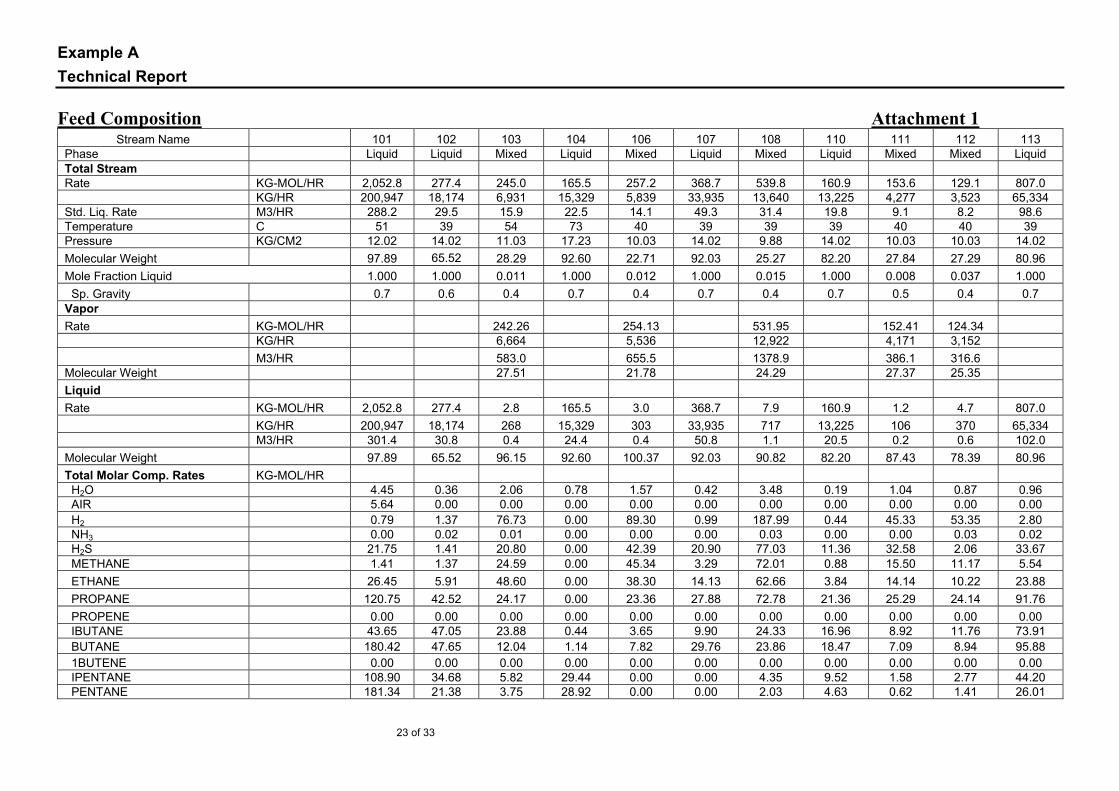
1. Feed composition to SGCU
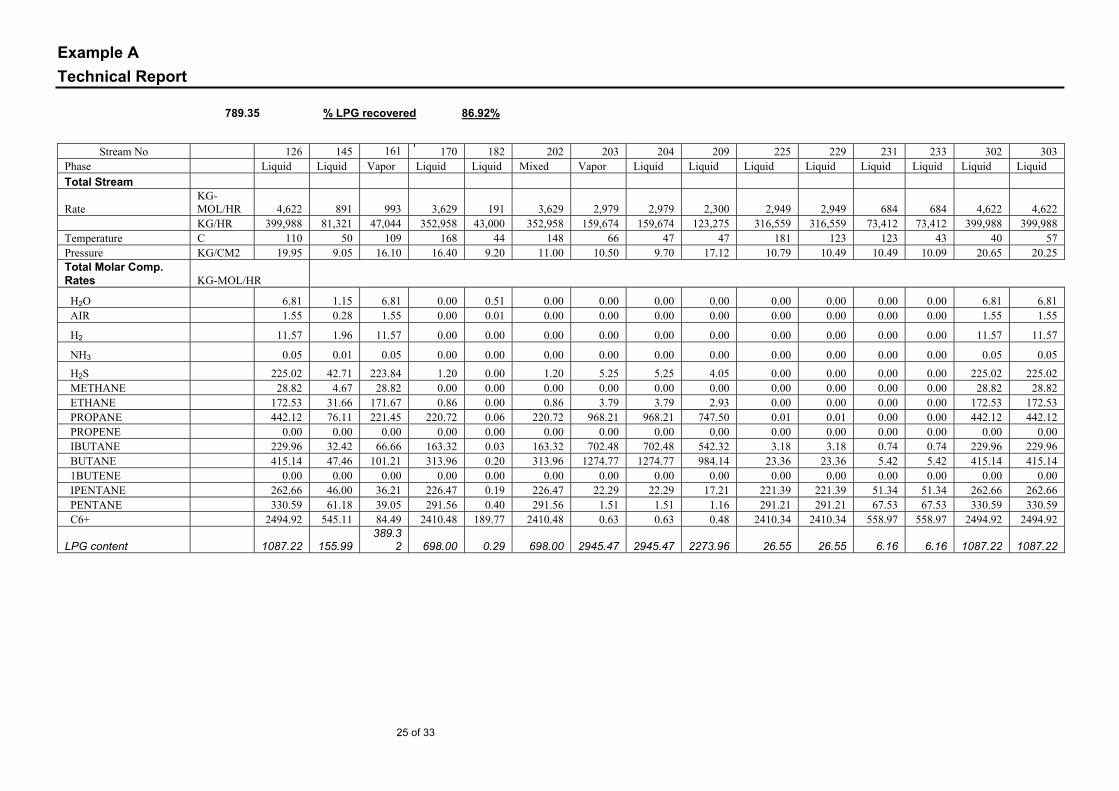
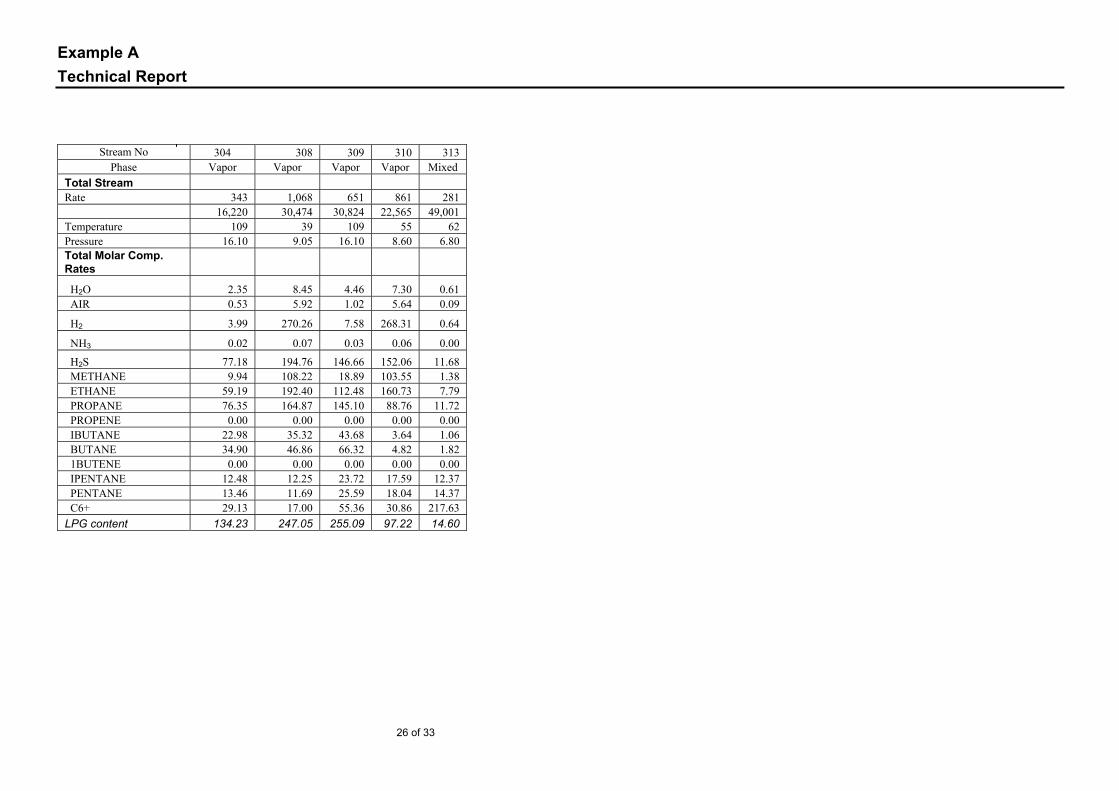
2. Summary of streams for LP operating case
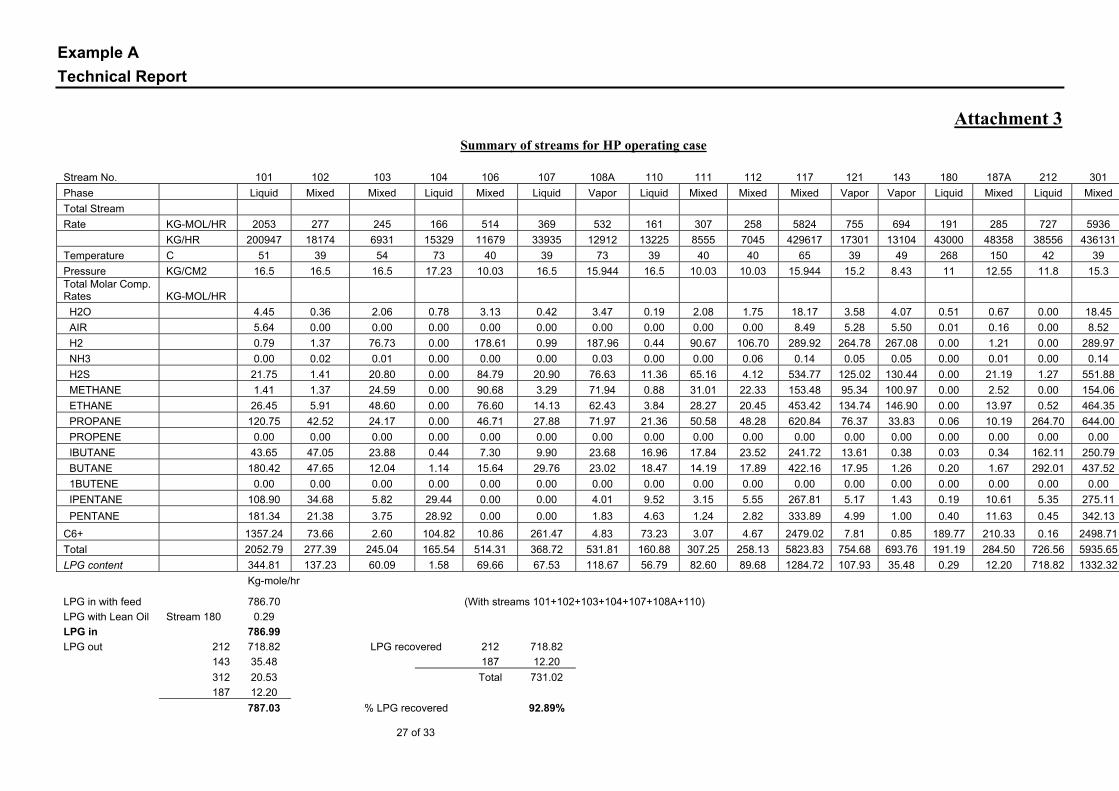
3. Summary of streams for HP operating case
4. Product Specifications
5. Economic Evaluation

Example A Technical Report
4 of 33
1. Definitions
ATU Amine Treating Unit
CDU Crude Distillation Unit – a part of the Crude and Vacuum Distillation Unit
CFC Clean Fuels Complex
DHDS Diesel Hydrodesulphurisation
FEED Front-End Engineering Design
HP High Pressure operation
HT Hydrotreater
H&MB Heat and Material Balance
ISBL Inside Battery Limit
KBPSD Kilo (Thousands of) Barrels Per Stream Day
LCO Light Cycle oil
LP Low Pressure operation
LPG Liquefied Petroleum Gas
MMTPA Mega (Millions of) Metric Tonnes Per Annum
P&ID Piping and Instrumentation Diagram
PFD Process Flow Diagram
SGCU Saturate Gas Concentration Unit
VDU Vacuum Distillation Unit – a part of the Crude and Vacuum Distillation Unit
VGO Vacuum Gas Oil
Example A Technical Report
5 of 33
2. Introduction
Over the last few years, the price of the crude oil has escalated manifolds. One of the main reasons for this price rise is the increased demand of distillates from the developing countries like China, India and Brazil, which is mainly spurned by the great strides made by these countries economically.
In order to meet this ever increasing demand of distillates in the world, a number of refineries are being built around the world. In one of these new refineries, there are two crude columns. The crude distillation units produce many distillate cuts, which are mainly blended into various products. The overhead from the atmospheric distillation column is condensed in a partial condenser. The uncondensed vapor is either routed to the fuel gas header or to the flare header. A part of this condensate is routed back to the crude column as reflux, while the rest of it is further processed in the Saturated Gas Concentration Unit (SGCU). This condensate is the unstabilised naphtha, which is containing dissolved LPG fraction. In the proposed refinery, there are two Saturate Gas Concentration Units, Unit 3 and 4 (SGCU 3 & 4), catering to the two crude columns.
One of the main requirements of the SGCU is to extract this valuable liquefied petroleum gas (LPG). The LPG has a very high commercial value in many countries. For example, in India, LPG is imported regularly to meet the domestic demand and any increased production of LPG is highly profitable. The LPG demand in India during the 2006-07 has been estimated at 10.57 million tons, whereas the indigenous availability during this period is 8.64 million tones. The shortfall of 1.93 million tones will have to be imported. It is also expected that the demand for LPG will increase by approximately 4.5% during the 2007-08 to 11.05 million tones. The cost of LPG in the international market is US$467 / ton. LPG is sold at a subsidized price to the domestic consumers in India. The LPG is sold to Indian consumers in a 14.5 kg cylinder. The cost of each cylinder is US$ 6.55 (US$ 452/ton) and this selling cost includes the processing and retail marketing costs also. It is estimated that Indian nationalized oil firms are loosing US$3.4 for the sale of each 14.5 kg cylinder, while the government is providing a subsidy of US$0.50 per cylinder. It can easily be seen from the above figures that if LPG is imported into India, the shortfall in price for the imported LPG would be much higher.
For the present design of the new refinery, the LPG yield from the SGCU 3 & 4 is as low as 86.95 mole %. In view of the great commercial advantage, the task was to improve this recovery to >90 mole%.
Example A Technical Report
6 of 33
3. Setup
The Saturated Gas Concentration Units 3 and 4 (SGCU 3 & 4), has been designed as a modified repeat design based on SGCU 1 & 2 of an existing refinery belonging to the same owners. The new SGCUs were envisaged to process about 10% higher throughput.
In the new refinery there is a Clean Fuels Complex (CFC) having diesel hydrodesulphurization units (DHDS 1 & 2) and a LCO hydrocracker. This complex produces low sulfur diesel and other distillates which are sold in the international market at a premium. The light ends from this complex are needed to be further processed in a Light Ends Recovery Unit (LERU). The modified repeat design of the SGCU 3 & 4 has been made to accommodate these additional loads from the CFC - wild naphtha from DHDS 1, 2 and LCO Hydrocraker. This inclusion has eliminated the need for a new Light Ends Recovery Unit (LERU).
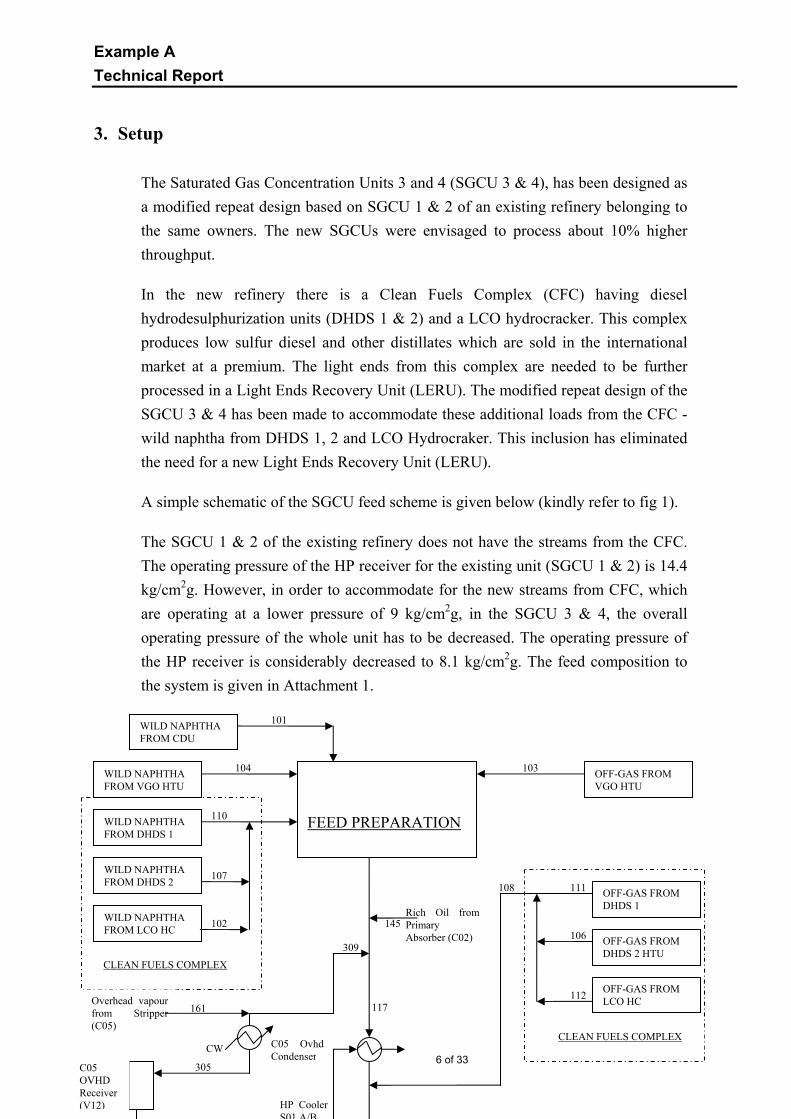
A simple schematic of the SGCU feed scheme is given below (kindly refer to fig 1).
The SGCU 1 & 2 of the existing refinery does not have the streams from the CFC. The operating pressure of the HP receiver for the existing unit (SGCU 1 & 2) is 14.4 kg/cm2g. However, in order to accommodate for the new streams from CFC, which are operating at a lower pressure of 9 kg/cm2g, in the SGCU 3 & 4, the overall operating pressure of the whole unit has to be decreased. The operating pressure of the HP receiver is considerably decreased to 8.1 kg/cm2g. The feed composition to the system is given in Attachment 1.
HP Cooler S01 A/B
C05 Ovhd Condenser
Rich Oil from Primary Absorber (C02)
145
161
CW
CLEAN FUELS COMPLEX
WILD NAPHTHA FROM CDU
WILD NAPHTHA FROM VGO HTU
WILD NAPHTHA FROM DHDS 1
WILD NAPHTHA FROM DHDS 2
WILD NAPHTHA FROM LCO HC
FEED PREPARATION
101
104
110
107
102
OFF-GAS FROM VGO HTU
103
111
106
112
108 OFF-GAS FROM DHDS 1
OFF-GAS FROM DHDS 2 HTU
OFF-GAS FROM LCO HC
CLEAN FUELS COMPLEX
Overhead vapour from Stripper (C05)
309
305 C05 OVHD Receiver (V12)
117
Example A Technical Report
7 of 33
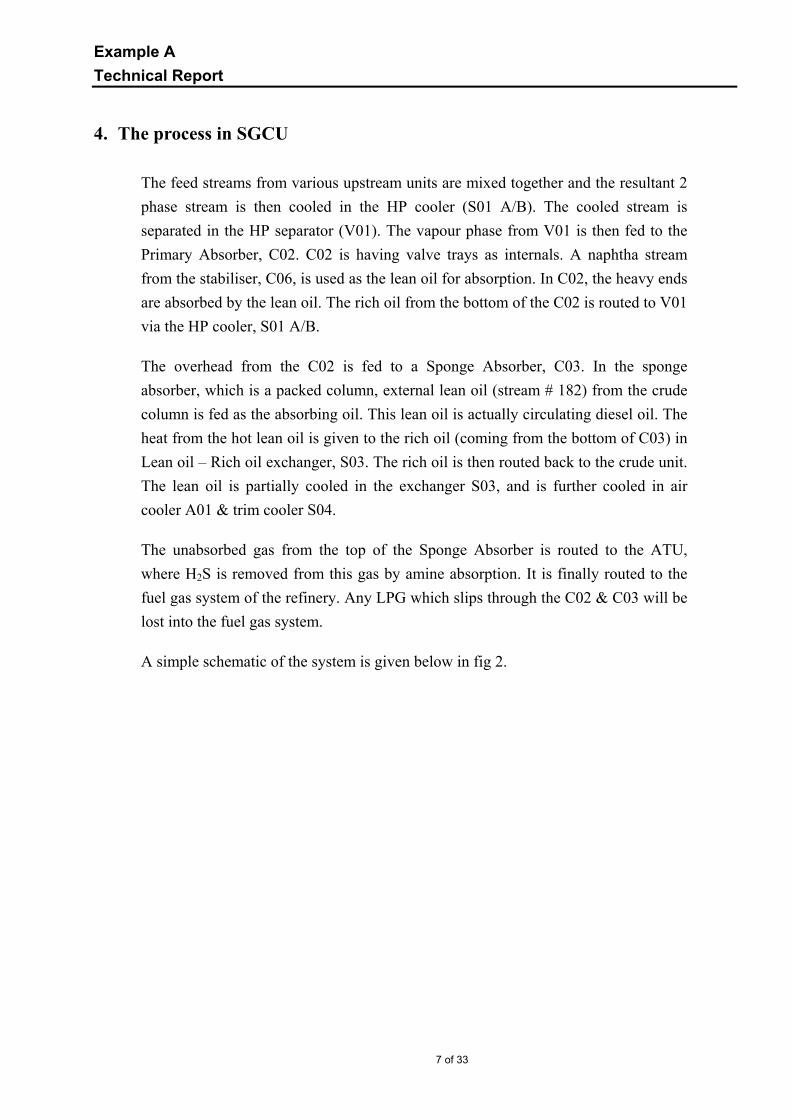
4. The process in SGCU
The feed streams from various upstream units are mixed together and the resultant 2 phase stream is then cooled in the HP cooler (S01 A/B). The cooled stream is separated in the HP separator (V01). The vapour phase from V01 is then fed to the Primary Absorber, C02. C02 is having valve trays as internals. A naphtha stream from the stabiliser, C06, is used as the lean oil for absorption. In C02, the heavy ends are absorbed by the lean oil. The rich oil from the bottom of the C02 is routed to V01 via the HP cooler, S01 A/B.
The overhead from the C02 is fed to a Sponge Absorber, C03. In the sponge absorber, which is a packed column, external lean oil (stream # 182) from the crude column is fed as the absorbing oil. This lean oil is actually circulating diesel oil. The heat from the hot lean oil is given to the rich oil (coming from the bottom of C03) in Lean oil – Rich oil exchanger, S03. The rich oil is then routed back to the crude unit. The lean oil is partially cooled in the exchanger S03, and is further cooled in air cooler A01 & trim cooler S04.
The unabsorbed gas from the top of the Sponge Absorber is routed to the ATU, where H2S is removed from this gas by amine absorption. It is finally routed to the fuel gas system of the refinery. Any LPG which slips through the C02 & C03 will be lost into the fuel gas system.
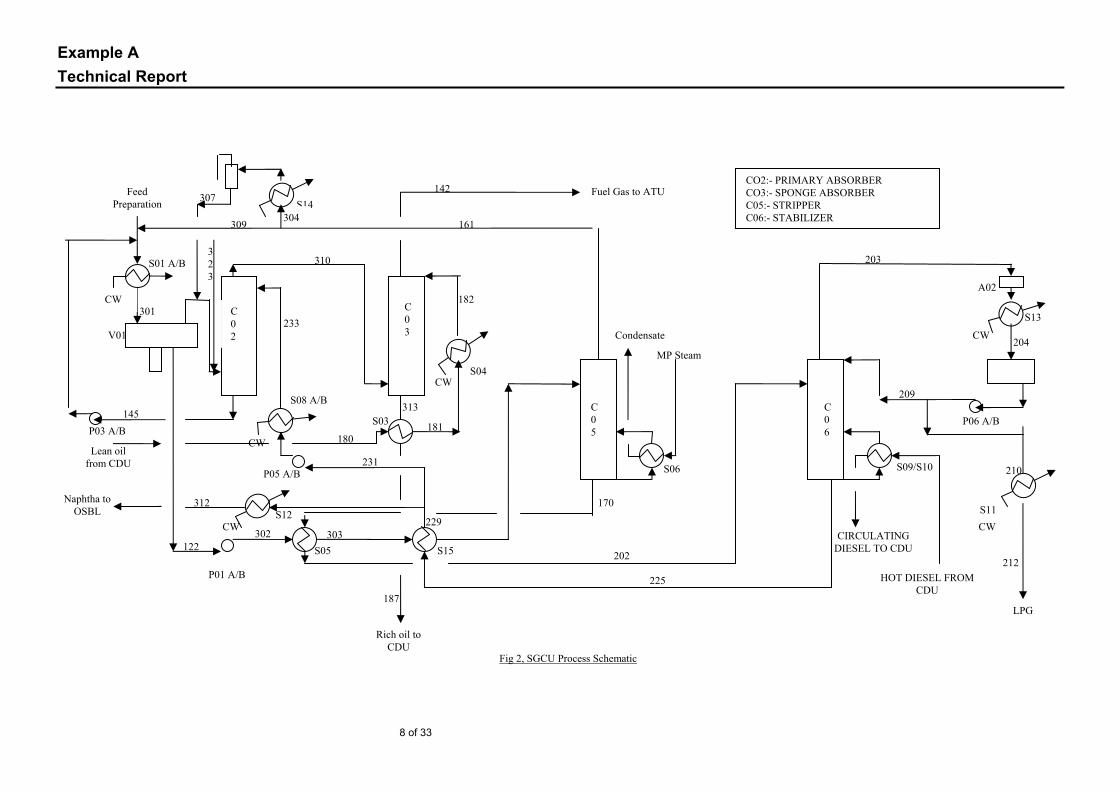
A simple schematic of the system is given below in fig 2.
Example A Technical Report
8 of 33
HOT DIESEL FROM CDU
CIRCULATING DIESEL TO CDU
S14 304
307
323
S04 CW
181 180
229
225
145 P03 A/B
312
CW S12
187
313
Naphtha to OSBL
212
233
310
209
S09/S10
P06 A/B
MP Steam
Rich oil to CDU
182
142
P05 A/B
S03
309
210
S13
204
203
202
170
301
161
303 S05 S15
231
302 122
S08 A/B
V01
S11
A02
S06
CW
S01 A/B
C05
Feed Preparation
Condensate
C02
C03
P01 A/B
CW
CW
Fuel Gas to ATU
Lean oil from CDU
CW
LPG
C06
Fig 2, SGCU Process Schematic
CO2:- PRIMARY ABSORBER CO3:- SPONGE ABSORBER C05:- STRIPPER C06:- STABILIZER

Example A Technical Report
9 of 33
The liquid stream (unstabilised naphtha) from the bottom of V01 (stream 122) is pumped to a Stripper (C05). This stream is heated against the hot outlet stream in Stripper Feed/Bottoms Exchanger, S05 and further against the stabiliser bottom stream in S15.
The purpose of the stripper (C05) is to strip off the absorbed light vapours in stream 122. The heat requirement for this column is provided by a steam heated reboiler, S06. The vapour is routed back to the feed preparation section and passing through the HP cooler is routed to the V01 (kindly refer to fig 1).
The naphtha from the bottom of the Stripper (C05) is then passed through Stripper Feed/Bottoms Exchanger, S05 (where it provides heat to the inlet stream to C05) and routed to a Stabilizer, C06. The C06 is a distillation column where LPG faction is separated from the stabilised naphtha faction. The overhead from this column is passed through a total condenser. A part of this condensate is fed to the column as reflux while the other part is taken out as a LPG product.
The detailed stream summary of this section is given in Attachment 1. The process schematic is shown in fig 2.
The product properties are listed in Attachment 4.
5. The problem
The C3 & C4 brought in with the feed streams to SGCU are either routed to the LPG faction (stream 212), or to naphtha from C06 bottom (stream 312), or with the rich oil going to the crude column (stream 187) or with the fuel gas going to the ATU (stream 142).
The desired routing of the C3 & C4 content is to LPG faction (stream 212). However, if it is routed with the rich oil (stream 187) and sent back to the crude column, then also it is recoverable from the crude unit.
However, when the C3 & C4 content is routed to the ATU then it is lost to the fuel gas system. Also, when it is routed with the naphtha then also it is lost to the naphtha stream.
The C3 & C4 content of the various feed streams (including that carried in with the lean oil) is 789.35 kg-moles/hr. The C3 & C4 which is recovered from this content (with streams 187, 212, 316) is 686.05 kg-moles. Hence, the recovery is only 86.92 mole%. Due to introduction of the CFC vapour streams at a lower operating
Example A Technical Report
10 of 33
pressure, and resultant lower operating pressure in the overall unit, the LPG recovery is way below the desired recovery of 90 vol.%. Hence, the refinery will be loosing a substantial amount of money in a costly product.
6. My involvement
I was involved in the process of accommodating the new CFC loads within the existing framework. I was given the additional task to evaluate the system and make a study to provide a solution to improve the LPG yield from the system. While doing the study, I have extensively used the process simulator ProII™ to evaluate the process conditions and feasibility of making changes. I have also used the programmes HTRI Xchanger Suite™, and KG towers to evaluate the exchanger performances as well as the column performances in the changed operating conditions.
7. Analysis of the problem
7.1. Operating Pressure
In the existing refinery, the recovery is above 90 vol. %. An obvious difference between the existing refinery and the new refinery was the addition of the liquid wild naphtha streams (stream nos. 102,107,110) and the vapour streams (stream nos. 106,111,112) from the CFC. This has resulted in a lower operating pressure of the feed section V01 and hence C02 & C03. In the existing refinery, the operating pressure of the V01 is 14.4 kg/cm2g while that in the new refinery it is only 8.1 kg/cm2g.
Obviously, V01 is one of the critical sections of the whole recovery process because higher the operating pressure of V01, more the LPG faction will dissolve in the liquid phase and more will be routed to C05 & C06. In the existing refinery the mole% of LPG carried away with the vapour phase (stream 121) is 11.3 mole%. However, in the new design this loading is 20.8 mole%. When this relatively excess amount of LPG goes into the vapour phase, the extraction possibility of this faction in the absorbers decreases appreciably.
I started my analysis from this point. I could easily see that the best solution for this problem is to increase the operating pressure of the system. Since, most of the procured equipment for the new refinery has been copied from the existing refinery (to save fabrication time) the design pressures of these equipment are quite high. Hence, my first task was to arrive at new operating pressures within the framework of the existing design pressures.
Example A Technical Report
11 of 33
7.2. Equipment constraints in the low pressure operation mode
In addition to the design pressures, another crucial area for this revamp study was the available heat transfer area of the exchangers. During the design of the low pressure operation, it was seen that the heat transfer area for the S01 A/B was limited. This again was because the S01 A/B was a repeat design from the existing refinery. The overall process flow through S01 A/B in the existing refinery is 303,100 kg/hr. This has now increased to 400,686 kg/hr (stream 117), which is a net 32% increased flow by weight. Now, in addition to this increase, the new streams from the CFC were also to be accommodated. It was seen that if this stream is added to stream 117, then due to the high vapour flow the overall heat transfer coefficient was low and vibration problems were expected in the S01A. Hence, the stream was added to a cooler stream after S01A (before S01B) (kindly refer to fig1).
The vapour load from V01 was very high. In the existing refinery, the flow is 8,746 kg/hr while that in the new design is 23,188 kg/hr. This 2.65 times increase in the vapour load in C02 & C03 was checked against the old columns. The new valve trays in C02 were designed to handle the new increased loads. C03 is a packed tower and with increasing vapour load the performance of the tower was acceptable.
The liquid stream from the V01 in the old design was 294,200 kg/hr. In the new design, this flow is 399,988 kg/hr. This increased load obviously affected the tray design of the C05 & C06. For C05, the tray vendor proposed a new type of valve trays which would be able to handle the increased liquid load within the existing diameter of the tower.
However, for the C06, the trays were found to be limited in the capacity. It was decided that high capacity Superfrac™ trays from Koch Glitz would be used, instead of conventional valve trays to handle increased loads.
The pumps were checked against the existing refinery. It was found that new pumps will be required for P01 A/B, P03A/B and P05 A/B. Only P02 A/B may be repeated from the existing design. The pumps P02 A/B, P04 A/B will require new impellers in the existing casing. (Kindly refer to fig 2 for details.)
Example A Technical Report
12 of 33
8. Solution to the problem of low LPG recovery
8.1. Operating Pressure
The LPG recovery of appx. 87mole % is not acceptable to the client. However, the plant can be started up with the design scenario (in low pressure operation mode) but recovery is to be increased for continuous operation.
As I found out through a number of simulations, the basic tool to improve the LPG recovery was in increasing the operating pressure of the whole system. As the unit was designed as per the design pressures of the existing refinery, there was limited scope to increase the operating pressure if other constraints were tackled well.
Now, the most optimum operating pressure would be governed by V01 pressure. The design pressure of V01 is 16.5 kg/cm2g. As per ASME Section VIII, Div 1 and API 520 requirement, the highest operating pressure for V01 can be 14.85 kg/cm2g. This is assuming a 10% margin between operating and design pressure.
Hence, in order to achieve this higher operating pressure, the first part of the problem was to bring in the feedstocks at higher pressures. The liquid streams may easily be provided at a higher pressure if the pumps were suitably rated. I have checked that a couple of the procured pumps may be limiting in providing the higher discharge pressure. But, this can easily be achieved by changing the impellers of the pumps within the existing casing. Also, I found out that a booster pump would be required for the CFC liquid streams.
The off-gas from the VGO hydrotreater can be provided at a higher pressure as the high pressure separator inside VGO hydrotreater unit (from where this off-gas is routed) is operating at a pressure of 18.6 kg/cm2a.
The only problem is to bring in the CFC gases at higher pressure. I proposed that a compressor need to be procured and provided ISBL the SGCU. It would be a common compressor for both the SGCU (SGCU 3 & 4).
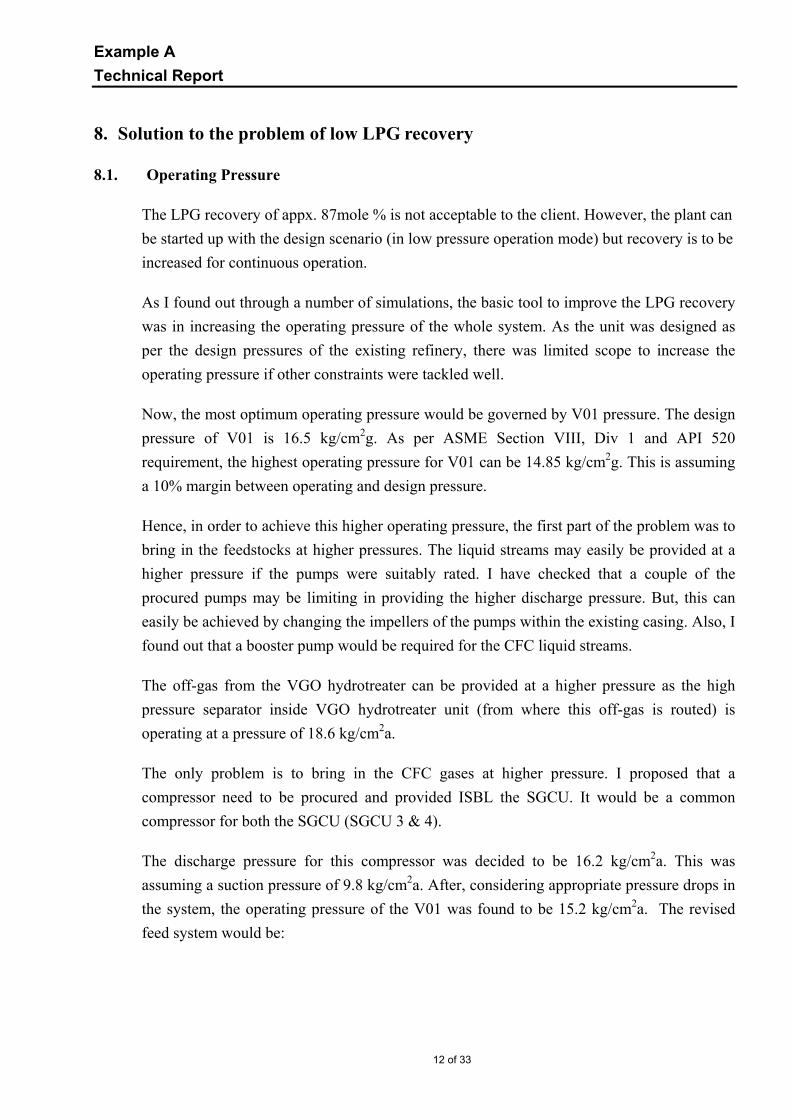
The discharge pressure for this compressor was decided to be 16.2 kg/cm2a. This was assuming a suction pressure of 9.8 kg/cm2a. After, considering appropriate pressure drops in the system, the operating pressure of the V01 was found to be 15.2 kg/cm2a. The revised feed system would be:
Example A Technical Report
13 of 33
I estimated using ProII simulation that due to higher operating pressure of the V01, the vapour load decreased from 23,188 kg/hr to 17,300 kg/hr. Most importantly, the LPG content of the V01 vapour was 181.9 kg-mole/hr, which decreased to 107.9 kg-mole/hr in the high pressure operation mode.
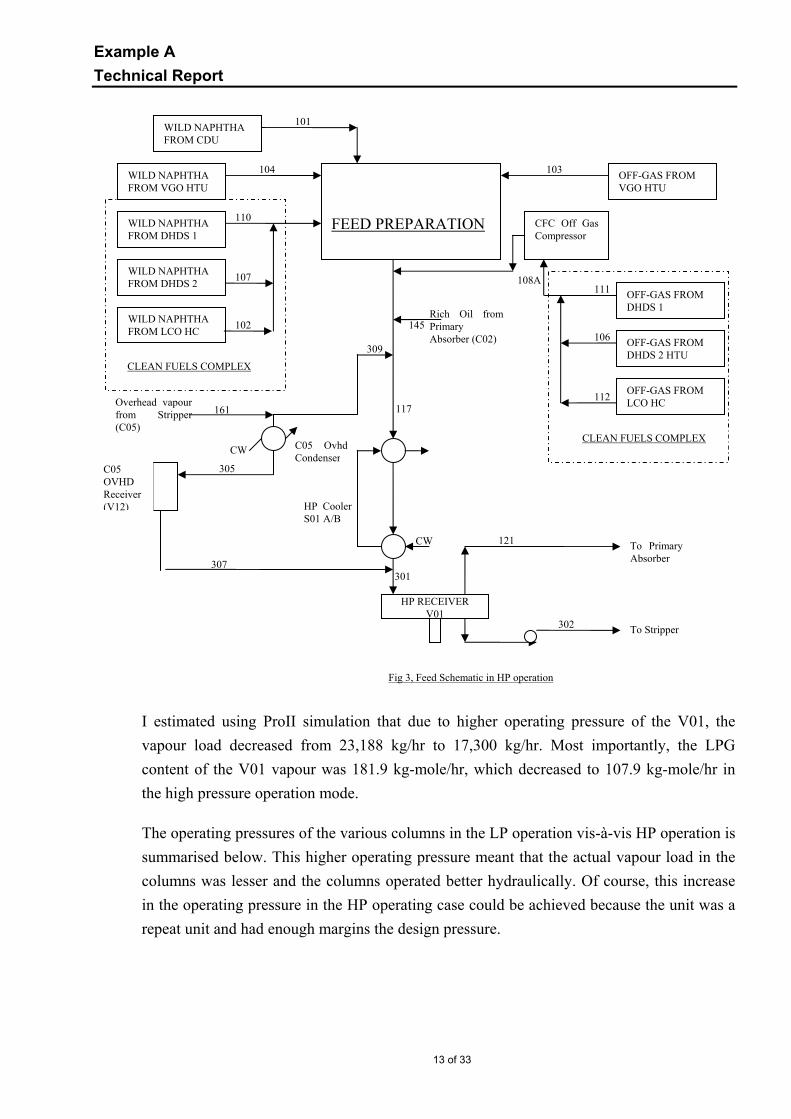
The operating pressures of the various columns in the LP operation vis-à-vis HP operation is summarised below. This higher operating pressure meant that the actual vapour load in the columns was lesser and the columns operated better hydraulically. Of course, this increase in the operating pressure in the HP operating case could be achieved because the unit was a repeat unit and had enough margins the design pressure.
HP Cooler S01 A/B
C05 Ovhd Condenser
Rich Oil from Primary Absorber (C02)
145
161
CW
CLEAN FUELS COMPLEX
WILD NAPHTHA FROM CDU
WILD NAPHTHA FROM VGO HTU
WILD NAPHTHA FROM DHDS 1
WILD NAPHTHA FROM DHDS 2
WILD NAPHTHA FROM LCO HC
FEED PREPARATION
101
104
110
107
102
OFF-GAS FROM VGO HTU
103
111
106
112
108A OFF-GAS FROM DHDS 1
OFF-GAS FROM DHDS 2 HTU
OFF-GAS FROM LCO HC
CLEAN FUELS COMPLEX
HP RECEIVER V01
121
302 To Stripper
To Primary Absorber
CW
Overhead vapour from Stripper (C05)
309
305 C05 OVHD Receiver (V12)
307 301
117
CFC Off Gas Compressor
Fig 3, Feed Schematic in HP operation
Example A Technical Report
14 of 33
Columns Design Pressure Operating Pressure
(LP operation)
Operating Pressure
(HP operation)
Kg/cm2g Kg/cm2a Kg/cm2a
C02 16.5 8.75/9.05 14.8/15.1
C03 16.3 8.5/8.6 14.6/14.7
C05 17.7 16.1/16.4 16.5/16.8
C06 15.0 10.5/10.8 13.0/13.3
8.2. Column Performance
8.2.1. Primary Absorber (C02)
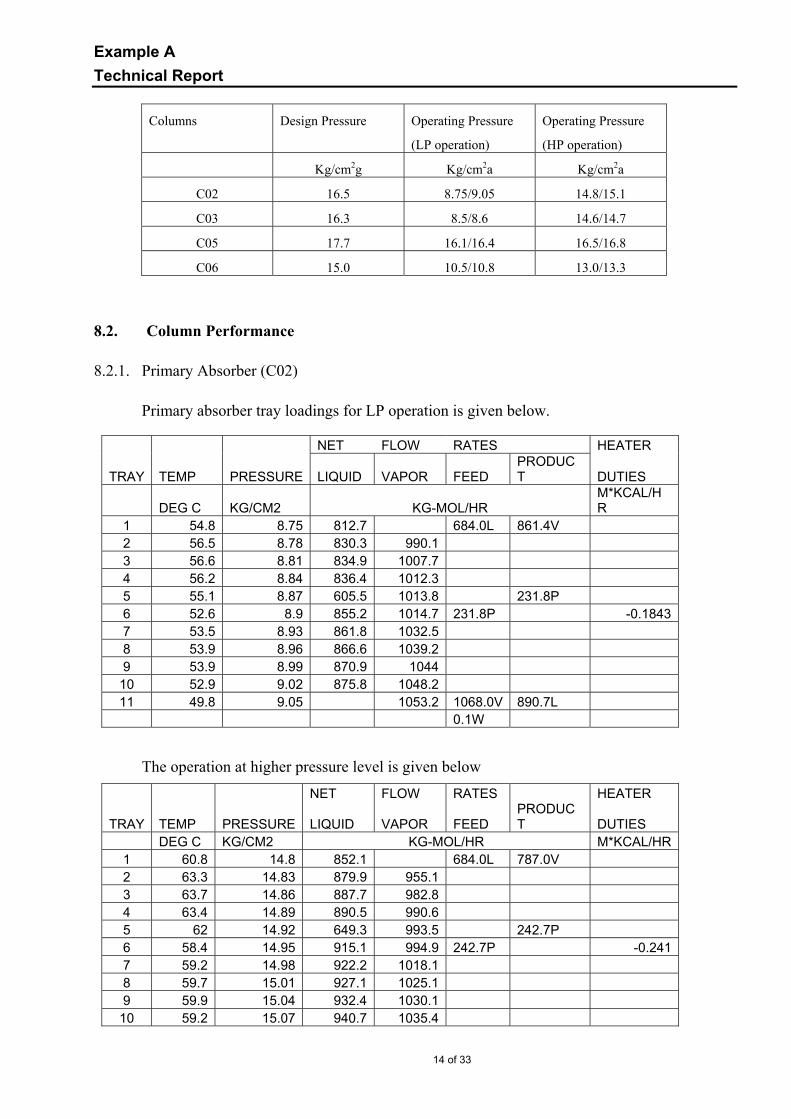
Primary absorber tray loadings for LP operation is given below.
NET FLOW RATES HEATER
TRAY TEMP PRESSURE LIQUID VAPOR FEED PRODUCT DUTIES
DEG C KG/CM2 KG-MOL/HR M*KCAL/HR
1 54.8 8.75 812.7 684.0L 861.4V 2 56.5 8.78 830.3 990.1 3 56.6 8.81 834.9 1007.7 4 56.2 8.84 836.4 1012.3 5 55.1 8.87 605.5 1013.8 231.8P 6 52.6 8.9 855.2 1014.7 231.8P -0.18437 53.5 8.93 861.8 1032.5 8 53.9 8.96 866.6 1039.2 9 53.9 8.99 870.9 1044
10 52.9 9.02 875.8 1048.2 11 49.8 9.05 1053.2 1068.0V 890.7L
0.1W
The operation at higher pressure level is given below
NET FLOW RATES HEATER
TRAY TEMP PRESSURE LIQUID VAPOR FEED PRODUCT DUTIES
DEG C KG/CM2 KG-MOL/HR M*KCAL/HR1 60.8 14.8 852.1 684.0L 787.0V 2 63.3 14.83 879.9 955.1 3 63.7 14.86 887.7 982.8 4 63.4 14.89 890.5 990.6 5 62 14.92 649.3 993.5 242.7P 6 58.4 14.95 915.1 994.9 242.7P -0.2417 59.2 14.98 922.2 1018.1 8 59.7 15.01 927.1 1025.1 9 59.9 15.04 932.4 1030.1
10 59.2 15.07 940.7 1035.4

Example A Technical Report
15 of 33
11 55.6 15.1 1043.6 1073.5V 971.4L 0.4L 0.5W
As can be expected the pumparound cooling duty for C02 has increased for the HP case 9as compared to the LP operating case. The net vapour product from C02 has come down (stream 141), which would in turn decrease the load in C03.
8.2.2. Sponge Absorber (C03)
The sponge absorber is a packed column. It has been formulated in the calculation as a 3 tray column. The summary of loads for low pressure operation is as follows:
NET FLOW RATES HEATER
TRAY TEMP PRESSURE LIQUID VAPOR FEED PRODUCT DUTIES
DEG C KG/CM2 KG-MOL/HR M*KCAL/HR
1 52.4 8.5 238.1 191.2L 771.4V 2 58 8.55 253.7 818.3 3 61.8 8.6 833.9 861.4V 281.2L
The summary of loads for high pressure operation is as follows:
---------- NET FLOW RATES HEATER
TRAY TEMP PRESSURE LIQUID VAPOR FEED PRODUCT DUTIES
DEG C KG/CM2 KG-MOL/HR
M*KCAL/HR
1 50.9 14.6 244 191.2L 693.7V 2 56.3 14.65 257.4 746.5 3 62.5 14.7 759.9 787.0V 284.5L
The summary of the column flows for the LP operation is given below FEED AND PRODUCT STREAMS LP Operation
TYPE STREAM PHASE FROM TO LIQUID FLOW RATES
HEAT RATES
TRAY TRAY FRAC KG-MOL/HR M*KCAL/HR FEED 182 LIQUID 1 1 191.19 0.7346FEED 310 VAPOR 3 0 861.38 2.7552PROD 143 VAPOR 1 771.41 2.1055PROD 313 LIQUID 3 281.15 1.3842
The summary of the column flows for the HP operation is given below
TYPE STREAM PHASE FROM TO LIQUID FLOW RATES
HEAT RATES
TRAY TRAY FRAC KG-MOL/HR M*KCAL/HRFEED 182 LIQUID 1 1 191.19 0.744FEED 310 VAPOR 3 0 786.96 2.317PROD 143 VAPOR 1 693.66 1.665PROD 313 LIQUID 3 284.49 1.396
Example A Technical Report
16 of 33
8.2.3. Stripper (C05)
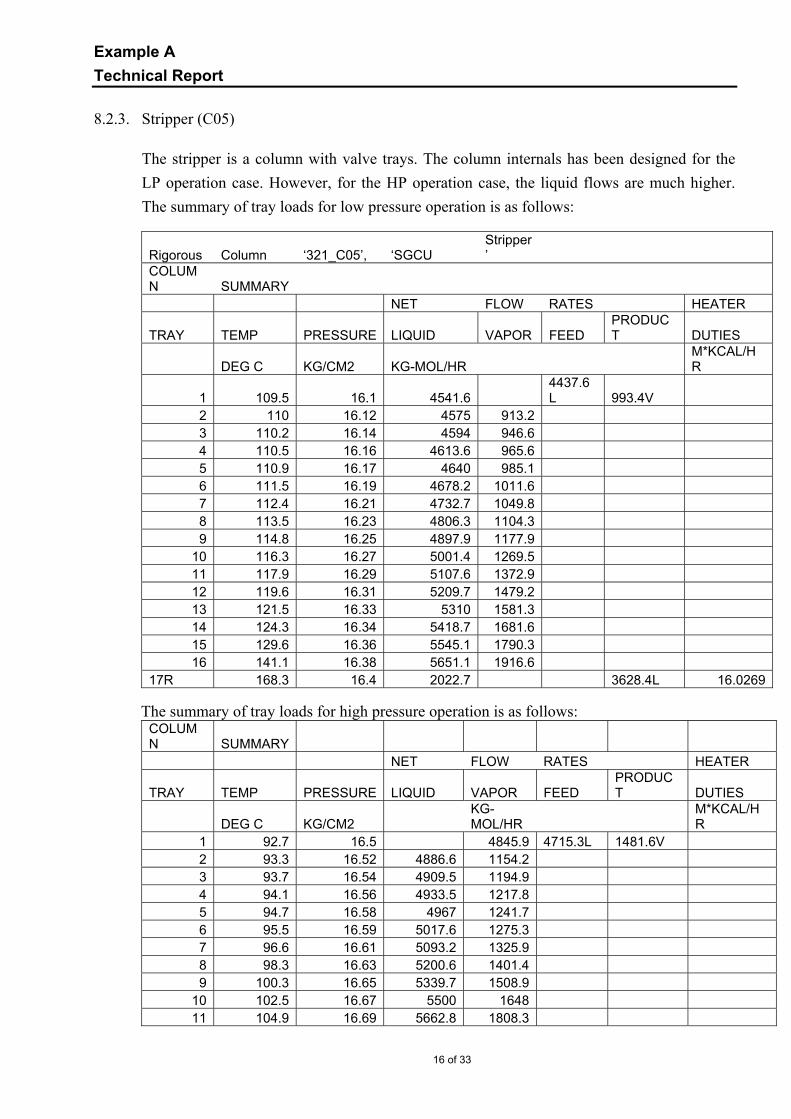
The stripper is a column with valve trays. The column internals has been designed for the LP operation case. However, for the HP operation case, the liquid flows are much higher. The summary of tray loads for low pressure operation is as follows:
Rigorous Column ‘321_C05’, ‘SGCU Stripper’
COLUMN SUMMARY NET FLOW RATES HEATER
TRAY TEMP PRESSURE LIQUID VAPOR FEED PRODUCT DUTIES
DEG C KG/CM2 KG-MOL/HR M*KCAL/HR
1 109.5 16.1 4541.6 4437.6L 993.4V
2 110 16.12 4575 913.2 3 110.2 16.14 4594 946.6 4 110.5 16.16 4613.6 965.6 5 110.9 16.17 4640 985.1 6 111.5 16.19 4678.2 1011.6 7 112.4 16.21 4732.7 1049.8 8 113.5 16.23 4806.3 1104.3 9 114.8 16.25 4897.9 1177.9
10 116.3 16.27 5001.4 1269.5 11 117.9 16.29 5107.6 1372.9 12 119.6 16.31 5209.7 1479.2 13 121.5 16.33 5310 1581.3 14 124.3 16.34 5418.7 1681.6 15 129.6 16.36 5545.1 1790.3 16 141.1 16.38 5651.1 1916.6
17R 168.3 16.4 2022.7 3628.4L 16.0269
The summary of tray loads for high pressure operation is as follows: COLUMN SUMMARY NET FLOW RATES HEATER
TRAY TEMP PRESSURE LIQUID VAPOR FEED PRODUCT DUTIES
DEG C KG/CM2 KG-MOL/HR
M*KCAL/HR
1 92.7 16.5 4845.9 4715.3L 1481.6V 2 93.3 16.52 4886.6 1154.2 3 93.7 16.54 4909.5 1194.9 4 94.1 16.56 4933.5 1217.8 5 94.7 16.58 4967 1241.7 6 95.5 16.59 5017.6 1275.3 7 96.6 16.61 5093.2 1325.9 8 98.3 16.63 5200.6 1401.4 9 100.3 16.65 5339.7 1508.9
10 102.5 16.67 5500 1648 11 104.9 16.69 5662.8 1808.3

Example A Technical Report
17 of 33
12 107.2 16.71 5813.8 1971.1 13 109.9 16.73 5951.6 2122.1 14 113.9 16.74 6086.8 2259.8 15 121 16.76 6222.6 2395 16 135.4 16.78 6289.3 2530.9
17R 166.8 16.8 2597.5 3691.7L 20.0952
Although the pressure level of the HP operation for the Stripper is not much higher than the LP operation case, but the higher pressure in V01 has resulted in higher liquid loads in this column.
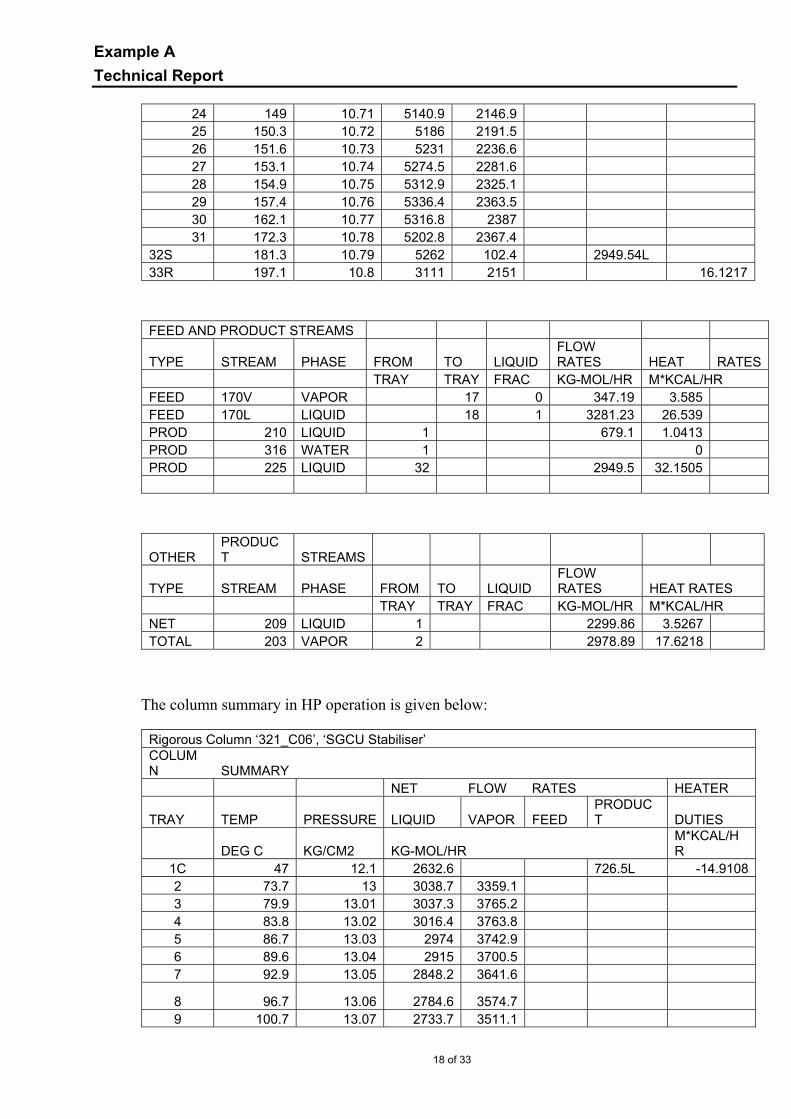
8.2.4. Stabilizer (C06)
The stabilizer is a column with valve trays. However, in view of the heavy loads, the internal trays have been changed to proprietary trays from Koch Glitsch called the Superfrac trays. These trays are used where the vapour and the liquid loads are appreciably high.
The column summary in LP operation is given below:
Rigorous Column ‘321_C06’, ‘SGCU Stabiliser’
COLUMN SUMMARY NET FLOW RATES HEATER
TRAY TEMP PRESSURE LIQUID VAPOR FEED PRODUCT DUTIES
DEG C KG/CM2 KG-MOL/HR M*KCAL/HR
1C 47 9.6 2299.8 679.1L -13.05392 66.2 10.5 2488 2978.8 3 71.9 10.51 2487 3167 4 75.3 10.52 2467.4 3166 5 77.9 10.53 2430.5 3146.5 6 80.6 10.54 2380.9 3109.5 7 83.8 10.55 2325.8 3059.9 8 87.5 10.56 2274.6 3004.8 9 91.4 10.57 2234.3 2953.7
10 95 10.58 2206.1 2913.4 11 98.2 10.59 2186.7 2885.2 12 100.8 10.6 2170.7 2865.7 13 102.9 10.61 2152.2 2849.7 14 104.9 10.62 2122.5 2831.2 15 107.2 10.63 2059.7 2801.6 16 110.9 10.64 1897.4 2738.7 17 119.5 10.65 1527.5 2576.4 347.2V
18 140.4 10.65 4808 1859.33281.2L
19 142.3 10.66 4889.1 1858.6 20 143.8 10.67 4952.5 1939.8 21 145.2 10.68 5004.8 2003.1 22 146.5 10.69 5051.5 2055.4 23 147.7 10.7 5096.3 2102.2
Example A Technical Report
18 of 33
24 149 10.71 5140.9 2146.9 25 150.3 10.72 5186 2191.5 26 151.6 10.73 5231 2236.6 27 153.1 10.74 5274.5 2281.6 28 154.9 10.75 5312.9 2325.1 29 157.4 10.76 5336.4 2363.5 30 162.1 10.77 5316.8 2387 31 172.3 10.78 5202.8 2367.4
32S 181.3 10.79 5262 102.4 2949.54L 33R 197.1 10.8 3111 2151 16.1217
FEED AND PRODUCT STREAMS
TYPE STREAM PHASE FROM TO LIQUID FLOW RATES HEAT RATES
TRAY TRAY FRAC KG-MOL/HR M*KCAL/HR FEED 170V VAPOR 17 0 347.19 3.585 FEED 170L LIQUID 18 1 3281.23 26.539 PROD 210 LIQUID 1 679.1 1.0413 PROD 316 WATER 1 0 PROD 225 LIQUID 32 2949.5 32.1505
OTHER PRODUCT STREAMS
TYPE STREAM PHASE FROM TO LIQUID FLOW RATES HEAT RATES
TRAY TRAY FRAC KG-MOL/HR M*KCAL/HR NET 209 LIQUID 1 2299.86 3.5267 TOTAL 203 VAPOR 2 2978.89 17.6218
The column summary in HP operation is given below:
Rigorous Column ‘321_C06’, ‘SGCU Stabiliser’ COLUMN SUMMARY NET FLOW RATES HEATER
TRAY TEMP PRESSURE LIQUID VAPOR FEED PRODUCT DUTIES
DEG C KG/CM2 KG-MOL/HR M*KCAL/HR
1C 47 12.1 2632.6 726.5L -14.91082 73.7 13 3038.7 3359.1 3 79.9 13.01 3037.3 3765.2 4 83.8 13.02 3016.4 3763.8 5 86.7 13.03 2974 3742.9 6 89.6 13.04 2915 3700.5 7 92.9 13.05 2848.2 3641.6
8 96.7 13.06 2784.6 3574.7 9 100.7 13.07 2733.7 3511.1

Example A Technical Report
19 of 33
10 104.6 13.08 2697.6 3460.2 11 108 13.09 2672.6 3424.1 12 110.9 13.1 2652.1 3399.1 13 113.4 13.11 2628.1 3378.6 14 115.6 13.12 2588.5 3354.7 15 118.2 13.13 2503.5 3315 16 122.3 13.14 2292.2 3230 17 131.4 13.15 1850.4 3018.7 435.4V
18 151.7 13.15 5105.3 2141.53256.3L
19 153.9 13.16 5202.4 2140.1 20 155.6 13.17 5279.6 2237.1 21 157.1 13.18 5342.9 2314.4 22 158.5 13.19 5397.5 2377.7 23 159.8 13.2 5447.2 2432.3 24 161 13.21 5494.2 2482 25 162.2 13.22 5539.4 2529 26 163.5 13.23 5582.6 2574.2 27 164.9 13.24 5622.7 2617.4 28 166.7 13.25 5655.7 2657.4 29 169.4 13.26 5670.8 2690.5 30 174.3 13.27 5638.7 2705.6 31 184.9 13.28 5515.8 2673.4
32S 194.1 13.29 6029.6 100.5 2965.2L 33R 208.7 13.3 3579.5 2450.1 17.311
FEED AND PRODUCT STREAMS
TYPE STREAM PHASE FROM TO LIQUID FLOW RATES
HEAT RATES
TRAY TRAY FRAC KG-MOL/HR M*KCAL/HR FEED 170V VAPOR 17 0 435.44 4.7184 FEED 170L LIQUID 18 1 3256.29 28.9406 PROD 210 LIQUID 1 726.51 1.1042 PROD 316 WATER 1 0
PROD 225 LIQUID 322965.2
2 34.9549
OTHER PRODUCT STREAMS
TYPE STREAM PHASE FROM TO LIQUID
FLOW RATES
HEAT RATES
TRAY TRAY FRAC KG-MOL/HR M*KCAL/HR
NET 209 LIQUID 1 2632.7 4.0013TOTAL 203 VAPOR 2 3359.3 20.0164
The reboiler duty in the HP case is higher as expected. The reboiler has been checked and is found to be adequate for the higher load. The vapour load in the rectifying section is also higher. The liquid load is higher in the overall column. The tray supplier was contacted and they have confirmed that the Superfrac® trays can accommodate such
Example A Technical Report
20 of 33
changes in the loads.
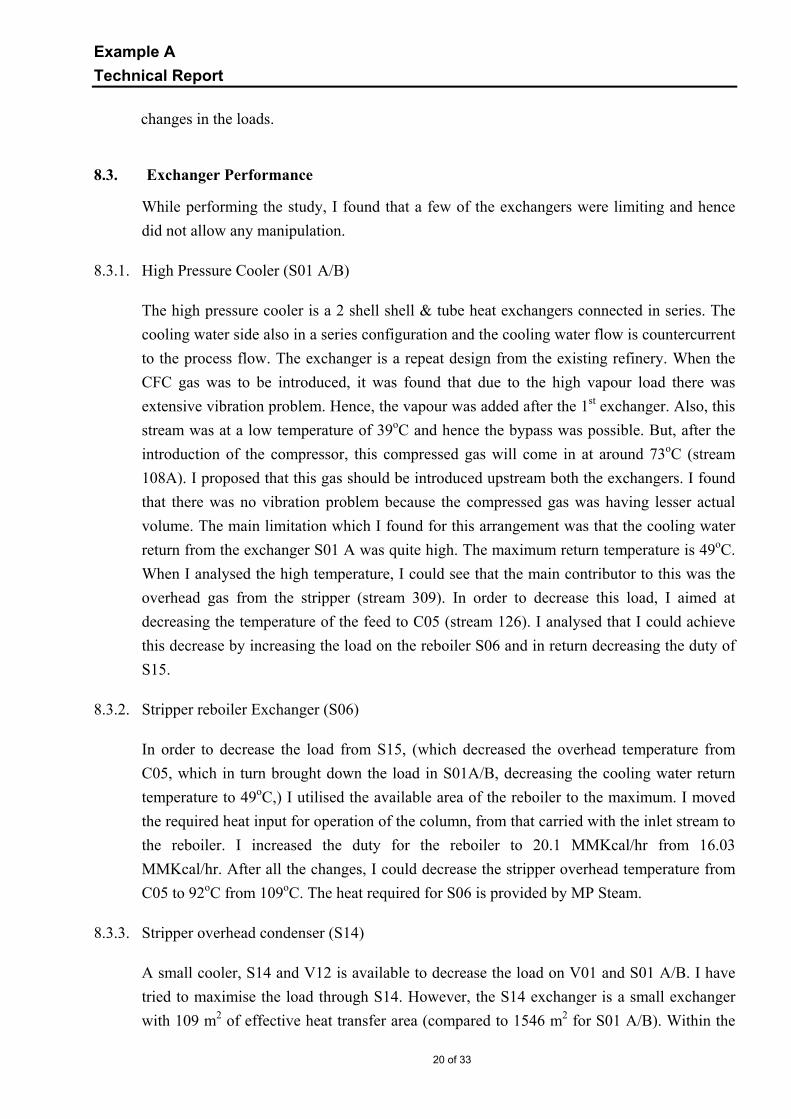
8.3. Exchanger Performance
While performing the study, I found that a few of the exchangers were limiting and hence did not allow any manipulation.
8.3.1. High Pressure Cooler (S01 A/B)
The high pressure cooler is a 2 shell shell & tube heat exchangers connected in series. The cooling water side also in a series configuration and the cooling water flow is countercurrent to the process flow. The exchanger is a repeat design from the existing refinery. When the CFC gas was to be introduced, it was found that due to the high vapour load there was extensive vibration problem. Hence, the vapour was added after the 1st exchanger. Also, this stream was at a low temperature of 39oC and hence the bypass was possible. But, after the introduction of the compressor, this compressed gas will come in at around 73oC (stream 108A). I proposed that this gas should be introduced upstream both the exchangers. I found that there was no vibration problem because the compressed gas was having lesser actual volume. The main limitation which I found for this arrangement was that the cooling water return from the exchanger S01 A was quite high. The maximum return temperature is 49oC. When I analysed the high temperature, I could see that the main contributor to this was the overhead gas from the stripper (stream 309). In order to decrease this load, I aimed at decreasing the temperature of the feed to C05 (stream 126). I analysed that I could achieve this decrease by increasing the load on the reboiler S06 and in return decreasing the duty of S15.
8.3.2. Stripper reboiler Exchanger (S06)
In order to decrease the load from S15, (which decreased the overhead temperature from C05, which in turn brought down the load in S01A/B, decreasing the cooling water return temperature to 49oC,) I utilised the available area of the reboiler to the maximum. I moved the required heat input for operation of the column, from that carried with the inlet stream to the reboiler. I increased the duty for the reboiler to 20.1 MMKcal/hr from 16.03 MMKcal/hr. After all the changes, I could decrease the stripper overhead temperature from C05 to 92oC from 109oC. The heat required for S06 is provided by MP Steam.
8.3.3. Stripper overhead condenser (S14)
A small cooler, S14 and V12 is available to decrease the load on V01 and S01 A/B. I have tried to maximise the load through S14. However, the S14 exchanger is a small exchanger with 109 m2 of effective heat transfer area (compared to 1546 m2 for S01 A/B). Within the
Example A Technical Report
21 of 33
limits of the exchanger, I have maximised the process flow through the exchanger to 18220 kg/hr from 16220 kg/hr. With increasing the flow further, I found that there were vibration problems in the shell side (process side).
8.3.4. Stabilizer reboilers (S09/S10)
The heat required for S09/S10 is provided by hot diesel stream from the crude unit. The S09/S10 heat transfer area was another limiting factor. I used HTRI calculation to get the maximum possible duty from these reboilers. The S09 / S10 are parallel heat exchangers. The duty required by the column C06 was to be provided by either S09/S10 or had to be carried along with the feed, which was preheated by S05. I distributed the heat between S05 and S09/S10 after finding the limiting duty for S09/S10.
It was a challenging job to distribute the overall heat load in the system so that I could utilise the maximum available area of the various exchangers and perform the desired function.
9. Conclusion
9.1. Equipment Performance
I could successfully ‘rerate’ the unit for the higher operating pressure. All the exchangers were checked for predicted performance (using HTRI program) and they were found to be adequate for the HP operation. The separators were also checked. Since, the operating pressures were higher; the separator diameters did not cause concern, as expected. The alarm set points of the liquid levels in the separators were re-checked and some of them were changed.
After checking the predicted column performance, I could confirm that the HP operation would work within the purchased equipment.
9.2. LPG Recovery
After the re-rating of the unit, the LPG recovery improved to 92.9 mole%, which was higher than the desired recovery. The brief stream summaries of the feeds and the product are given in Attachment 2 for the LP operating case & Attachment 3 for the HP operating case.
9.3. Commissioning
The plant will be commissioned in the LP operating case. However, the plant shall be designed in a fashion that the operation will be switched over to the HP operating case
Example A Technical Report
22 of 33
without any lengthy downtime.
9.4. Economics
For the high pressure operation case, 38550.8 kg/hr of LPG is recovered as against 36536.7 kg/hr for the LP operating case. This means that by increasing the operating pressure, there was an increased recovery of 2014.1 kg/hr (kindly refer to Attachment 6 for details).
Now, LPG is priced at US$ 467/ton in the international market. The compressor is expected to be a small compressor with 750 kWh motor. The electricity cost is expected to be US$ 58 per hour (at an estimated cost of Rs.3.5 / kWh of electricity consumed). Hence, there is an increased recovery of US$ 890.59 / hour.
It is considered that there will be 8000 operating hours per year (a service factor of 91%). Hence, the excess money made due to the higher operating case would amount to US$ 7.06 million per year.
Now, it is estimated that the installation of the compressor would cost US$ 4 million. I have assumed that the associated additional equipment would cost another US$ 750,000. An additional US$ 250,000 may be assumed for the engineering and piping. Hence, I could show that after the re-rating of the unit for higher operating case, the payback is expected to be less than 1 year.
Example A Technical Report
23 of 33
Feed Composition Attachment 1 Stream Name 101 102 103 104 106 107 108 110 111 112 113
Phase Liquid Liquid Mixed Liquid Mixed Liquid Mixed Liquid Mixed Mixed Liquid Total Stream Rate KG-MOL/HR 2,052.8 277.4 245.0 165.5 257.2 368.7 539.8 160.9 153.6 129.1 807.0 KG/HR 200,947 18,174 6,931 15,329 5,839 33,935 13,640 13,225 4,277 3,523 65,334 Std. Liq. Rate M3/HR 288.2 29.5 15.9 22.5 14.1 49.3 31.4 19.8 9.1 8.2 98.6 Temperature C 51 39 54 73 40 39 39 39 40 40 39 Pressure KG/CM2 12.02 14.02 11.03 17.23 10.03 14.02 9.88 14.02 10.03 10.03 14.02 Molecular Weight 97.89 65.52 28.29 92.60 22.71 92.03 25.27 82.20 27.84 27.29 80.96 Mole Fraction Liquid 1.000 1.000 0.011 1.000 0.012 1.000 0.015 1.000 0.008 0.037 1.000 Sp. Gravity 0.7 0.6 0.4 0.7 0.4 0.7 0.4 0.7 0.5 0.4 0.7 Vapor Rate KG-MOL/HR 242.26 254.13 531.95 152.41 124.34 KG/HR 6,664 5,536 12,922 4,171 3,152 M3/HR 583.0 655.5 1378.9 386.1 316.6 Molecular Weight 27.51 21.78 24.29 27.37 25.35 Liquid Rate KG-MOL/HR 2,052.8 277.4 2.8 165.5 3.0 368.7 7.9 160.9 1.2 4.7 807.0 KG/HR 200,947 18,174 268 15,329 303 33,935 717 13,225 106 370 65,334 M3/HR 301.4 30.8 0.4 24.4 0.4 50.8 1.1 20.5 0.2 0.6 102.0 Molecular Weight 97.89 65.52 96.15 92.60 100.37 92.03 90.82 82.20 87.43 78.39 80.96 Total Molar Comp. Rates KG-MOL/HR H2O 4.45 0.36 2.06 0.78 1.57 0.42 3.48 0.19 1.04 0.87 0.96 AIR 5.64 0.00 0.00 0.00 0.00 0.00 0.00 0.00 0.00 0.00 0.00 H2 0.79 1.37 76.73 0.00 89.30 0.99 187.99 0.44 45.33 53.35 2.80 NH3 0.00 0.02 0.01 0.00 0.00 0.00 0.03 0.00 0.00 0.03 0.02 H2S 21.75 1.41 20.80 0.00 42.39 20.90 77.03 11.36 32.58 2.06 33.67 METHANE 1.41 1.37 24.59 0.00 45.34 3.29 72.01 0.88 15.50 11.17 5.54 ETHANE 26.45 5.91 48.60 0.00 38.30 14.13 62.66 3.84 14.14 10.22 23.88 PROPANE 120.75 42.52 24.17 0.00 23.36 27.88 72.78 21.36 25.29 24.14 91.76 PROPENE 0.00 0.00 0.00 0.00 0.00 0.00 0.00 0.00 0.00 0.00 0.00 IBUTANE 43.65 47.05 23.88 0.44 3.65 9.90 24.33 16.96 8.92 11.76 73.91 BUTANE 180.42 47.65 12.04 1.14 7.82 29.76 23.86 18.47 7.09 8.94 95.88 1BUTENE 0.00 0.00 0.00 0.00 0.00 0.00 0.00 0.00 0.00 0.00 0.00 IPENTANE 108.90 34.68 5.82 29.44 0.00 0.00 4.35 9.52 1.58 2.77 44.20 PENTANE 181.34 21.38 3.75 28.92 0.00 0.00 2.03 4.63 0.62 1.41 26.01

Example A Technical Report
24 of 33
C6+ 1357.24 73.66 2.60 104.82 5.43 261.47 9.30 73.23 1.54 2.34 408.37
Summary of streams for LP operating case Attachment 2
Stream No. 101 102 103 104 106 107 108 110 111 112 117 121 143 180 187 212 301 312
Phase Liquid Liquid Mixed Liquid Mixed Liquid Mixed Liquid Mixed Mixed Mixed Vapor Vapor Liquid Mixed Liquid Mixed Liquid Total Stream Rate KG-MOL/HR 2,053 277 245 166 257 369 540 161 154 129 4,812 876 771 191 281 679 5,502 2,265
KG/HR 200,947 18,174 6,931 15,329 5,839 33,935 13,640 13,225 4,277 3,523 400,686 23,188 16,563 43,000 49,001 36,399 423,255 243,14
7 Temperature C 51 39 54 73 40 39 39 39 40 40 62 39 52 268 148 42 39 41 Pressure KG/CM2 12.02 14.02 11.03 17.23 10.03 14.02 9.88 14.02 10.03 10.03 10.21 9.10 7.73 11.00 6.45 16.82 9.10 10.24 Total Molar Comp. Rates KG-MOL/HR
H2O 4.45 0.36 2.06 0.78 1.57 0.42 3.48 0.19 1.04 0.87 13.86 6.97 7.21 0.51 0.61 0.00 18.21 0.00 AIR 5.64 0.00 0.00 0.00 0.00 0.00 0.00 0.00 0.00 0.00 6.94 5.43 5.57 0.01 0.09 0.00 6.98 0.00
H2 0.79 1.37 76.73 0.00 89.30 0.99 187.99 0.44 45.33 53.35 89.86 266.33 267.67 0.00 0.64 0.00 277.90 0.00
NH3 0.00 0.02 0.01 0.00 0.00 0.00 0.03 0.00 0.00 0.03 0.07 0.05 0.05 0.00 0.00 0.00 0.10 0.00
H2S 21.75 1.41 20.80 0.00 42.39 20.90 77.03 11.36 32.58 2.06 265.59 136.38 140.38 0.00 11.68 1.20 361.40 0.00 METHANE 1.41 1.37 24.59 0.00 45.34 3.29 72.01 0.88 15.50 11.17 55.10 98.98 102.17 0.00 1.38 0.00 127.80 0.00 ETHANE 26.45 5.91 48.60 0.00 38.30 14.13 62.66 3.84 14.14 10.22 243.08 145.71 152.94 0.00 7.79 0.86 318.24 0.00 PROPANE 120.75 42.52 24.17 0.00 23.36 27.88 72.78 21.36 25.29 24.14 457.88 120.42 77.11 0.06 11.72 220.71 562.54 0.00 PROPENE 0.00 0.00 0.00 0.00 0.00 0.00 0.00 0.00 0.00 0.00 0.00 0.00 0.00 0.00 0.00 0.00 0.00 0.00 IBUTANE 43.65 47.05 23.88 0.44 3.65 9.90 24.33 16.96 8.92 11.76 217.97 26.24 2.60 0.03 1.06 160.14 256.20 2.44 BUTANE 180.42 47.65 12.04 1.14 7.82 29.76 23.86 18.47 7.09 8.94 403.25 35.25 3.20 0.20 1.82 290.60 450.39 17.94 1BUTENE 0.00 0.00 0.00 0.00 0.00 0.00 0.00 0.00 0.00 0.00 0.00 0.00 0.00 0.00 0.00 0.00 0.00 0.00 IPENTANE 108.90 34.68 5.82 29.44 0.00 0.00 4.35 9.52 1.58 2.77 258.08 9.81 5.41 0.19 12.37 5.08 272.47 170.05 PENTANE 181.34 21.38 3.75 28.92 0.00 0.00 2.03 4.63 0.62 1.41 326.78 9.51 4.07 0.40 14.37 0.34 340.10 223.68 C6+ 1357.24 73.66 2.60 104.82 5.43 261.47 9.30 73.23 1.54 2.34 2473.49 14.88 3.00 189.77 217.63 0.14 2509.79 1851.4
LPG content 344.81 137.2
3 60.09 1.58 34.83 67.53 120.9
7 56.79 41.30 44.84 1079.10 181.9
1 82.91 0.29 14.60 671.4
5 1269.13 20.39 kg-mole/hr LPG in with feed 789.00 (With streams 101+102+103+104+107+108+110) LPG with Lean oil Stream 180 0.29 Total LPG in 789.29
LPG out 212 671.45 LPG recoveredout 212 671.45 kg-mole/hr
143 82.91 187 14.60 kg-mole/hr 312 20.39 686.05 kg-mole/hr 187 14.60
Example A Technical Report
25 of 33
789.35 % LPG recovered 86.92%
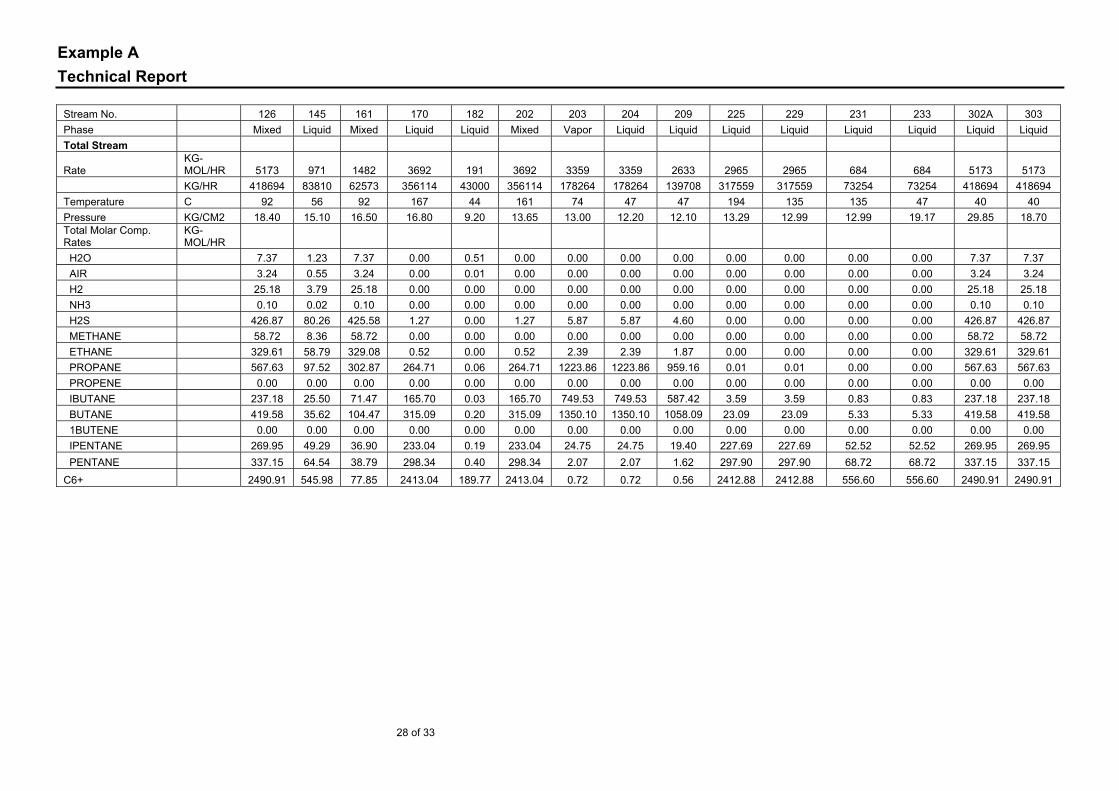
Stream No 126 145 161 170 182 202 203 204 209 225 229 231 233 302 303
Phase Liquid Liquid Vapor Liquid Liquid Mixed Vapor Liquid Liquid Liquid Liquid Liquid Liquid Liquid Liquid Total Stream
Rate KG-MOL/HR 4,622 891 993 3,629 191 3,629 2,979 2,979 2,300 2,949 2,949 684 684 4,622 4,622
KG/HR 399,988 81,321 47,044 352,958 43,000 352,958 159,674 159,674 123,275 316,559 316,559 73,412 73,412 399,988 399,988 Temperature C 110 50 109 168 44 148 66 47 47 181 123 123 43 40 57 Pressure KG/CM2 19.95 9.05 16.10 16.40 9.20 11.00 10.50 9.70 17.12 10.79 10.49 10.49 10.09 20.65 20.25 Total Molar Comp. Rates KG-MOL/HR
H2O 6.81 1.15 6.81 0.00 0.51 0.00 0.00 0.00 0.00 0.00 0.00 0.00 0.00 6.81 6.81 AIR 1.55 0.28 1.55 0.00 0.01 0.00 0.00 0.00 0.00 0.00 0.00 0.00 0.00 1.55 1.55
H2 11.57 1.96 11.57 0.00 0.00 0.00 0.00 0.00 0.00 0.00 0.00 0.00 0.00 11.57 11.57
NH3 0.05 0.01 0.05 0.00 0.00 0.00 0.00 0.00 0.00 0.00 0.00 0.00 0.00 0.05 0.05
H2S 225.02 42.71 223.84 1.20 0.00 1.20 5.25 5.25 4.05 0.00 0.00 0.00 0.00 225.02 225.02 METHANE 28.82 4.67 28.82 0.00 0.00 0.00 0.00 0.00 0.00 0.00 0.00 0.00 0.00 28.82 28.82 ETHANE 172.53 31.66 171.67 0.86 0.00 0.86 3.79 3.79 2.93 0.00 0.00 0.00 0.00 172.53 172.53 PROPANE 442.12 76.11 221.45 220.72 0.06 220.72 968.21 968.21 747.50 0.01 0.01 0.00 0.00 442.12 442.12 PROPENE 0.00 0.00 0.00 0.00 0.00 0.00 0.00 0.00 0.00 0.00 0.00 0.00 0.00 0.00 0.00 IBUTANE 229.96 32.42 66.66 163.32 0.03 163.32 702.48 702.48 542.32 3.18 3.18 0.74 0.74 229.96 229.96 BUTANE 415.14 47.46 101.21 313.96 0.20 313.96 1274.77 1274.77 984.14 23.36 23.36 5.42 5.42 415.14 415.14 1BUTENE 0.00 0.00 0.00 0.00 0.00 0.00 0.00 0.00 0.00 0.00 0.00 0.00 0.00 0.00 0.00 IPENTANE 262.66 46.00 36.21 226.47 0.19 226.47 22.29 22.29 17.21 221.39 221.39 51.34 51.34 262.66 262.66 PENTANE 330.59 61.18 39.05 291.56 0.40 291.56 1.51 1.51 1.16 291.21 291.21 67.53 67.53 330.59 330.59 C6+ 2494.92 545.11 84.49 2410.48 189.77 2410.48 0.63 0.63 0.48 2410.34 2410.34 558.97 558.97 2494.92 2494.92
LPG content 1087.22 155.99 389.3
2 698.00 0.29 698.00 2945.47 2945.47 2273.96 26.55 26.55 6.16 6.16 1087.22 1087.22
Example A Technical Report
26 of 33
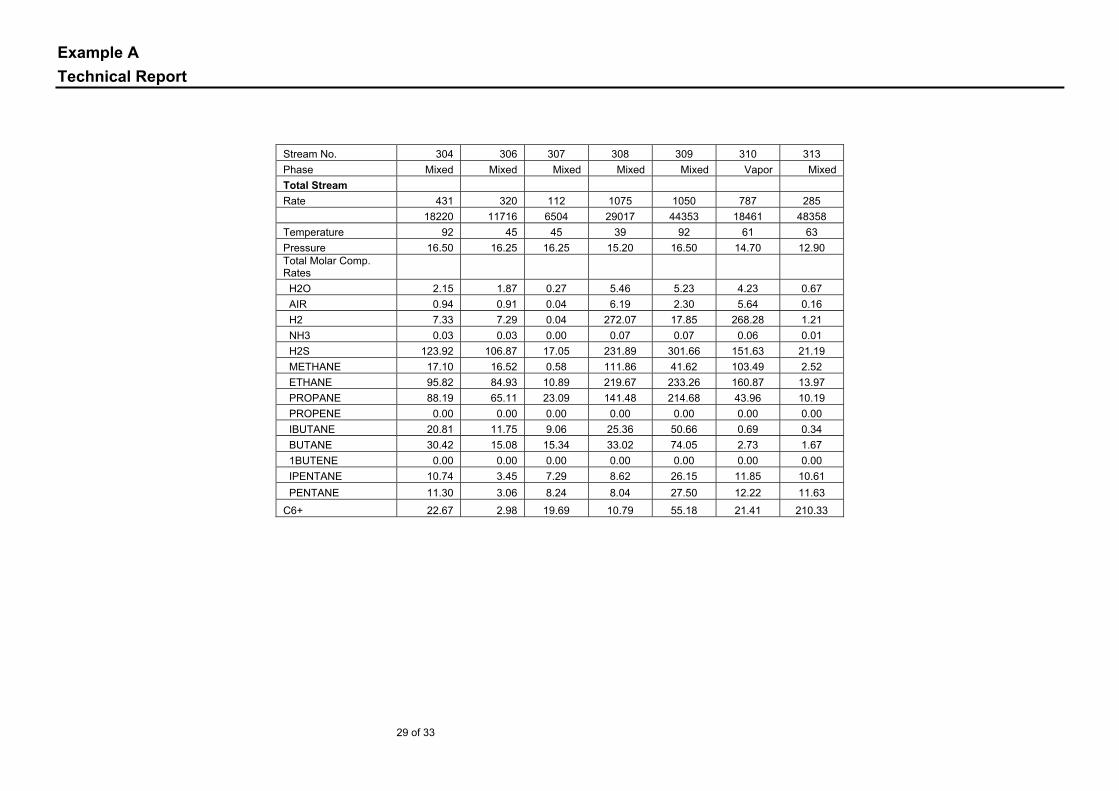
Stream No 304 308 309 310 313 Phase Vapor Vapor Vapor Vapor Mixed
Total Stream Rate 343 1,068 651 861 281 16,220 30,474 30,824 22,565 49,001 Temperature 109 39 109 55 62 Pressure 16.10 9.05 16.10 8.60 6.80 Total Molar Comp. Rates
H2O 2.35 8.45 4.46 7.30 0.61 AIR 0.53 5.92 1.02 5.64 0.09
H2 3.99 270.26 7.58 268.31 0.64
NH3 0.02 0.07 0.03 0.06 0.00
H2S 77.18 194.76 146.66 152.06 11.68 METHANE 9.94 108.22 18.89 103.55 1.38 ETHANE 59.19 192.40 112.48 160.73 7.79 PROPANE 76.35 164.87 145.10 88.76 11.72 PROPENE 0.00 0.00 0.00 0.00 0.00 IBUTANE 22.98 35.32 43.68 3.64 1.06 BUTANE 34.90 46.86 66.32 4.82 1.82 1BUTENE 0.00 0.00 0.00 0.00 0.00 IPENTANE 12.48 12.25 23.72 17.59 12.37 PENTANE 13.46 11.69 25.59 18.04 14.37 C6+ 29.13 17.00 55.36 30.86 217.63 LPG content 134.23 247.05 255.09 97.22 14.60
Example A Technical Report
27 of 33
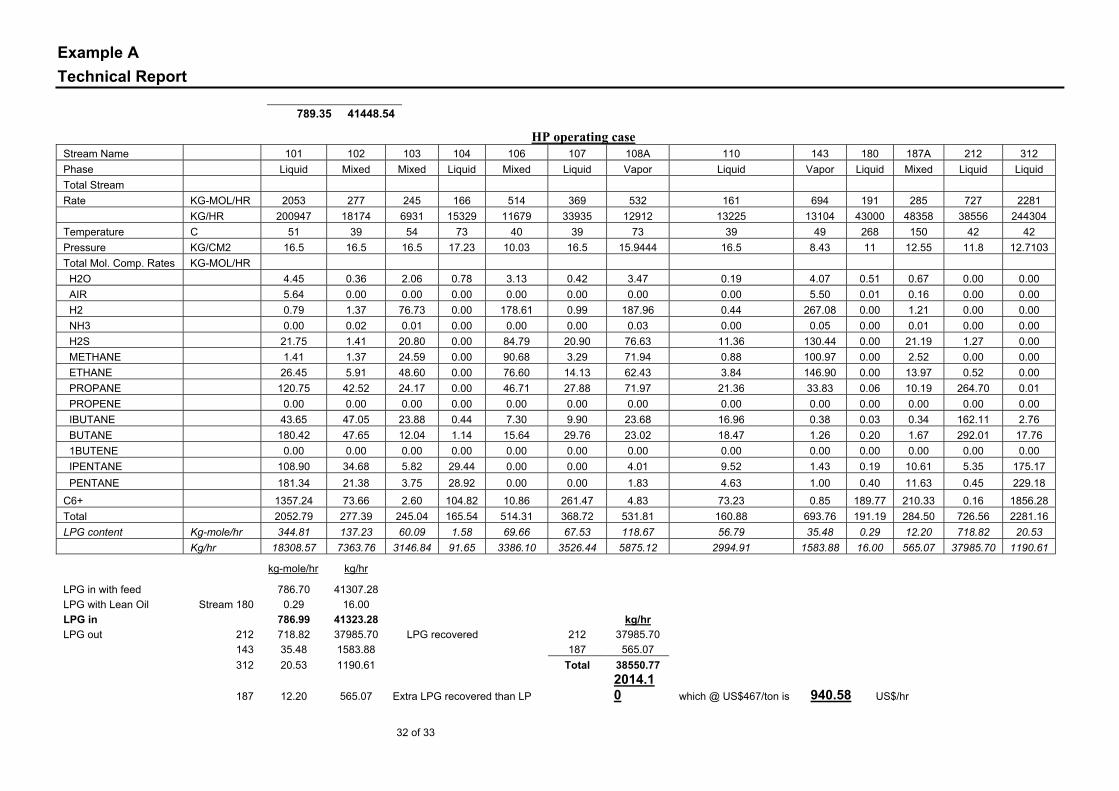
Attachment 3 Summary of streams for HP operating case
Stream No. 101 102 103 104 106 107 108A 110 111 112 117 121 143 180 187A 212 301 Phase Liquid Mixed Mixed Liquid Mixed Liquid Vapor Liquid Mixed Mixed Mixed Vapor Vapor Liquid Mixed Liquid Mixed Total Stream Rate KG-MOL/HR 2053 277 245 166 514 369 532 161 307 258 5824 755 694 191 285 727 5936 KG/HR 200947 18174 6931 15329 11679 33935 12912 13225 8555 7045 429617 17301 13104 43000 48358 38556 436131 Temperature C 51 39 54 73 40 39 73 39 40 40 65 39 49 268 150 42 39 Pressure KG/CM2 16.5 16.5 16.5 17.23 10.03 16.5 15.944 16.5 10.03 10.03 15.944 15.2 8.43 11 12.55 11.8 15.3 Total Molar Comp. Rates KG-MOL/HR H2O 4.45 0.36 2.06 0.78 3.13 0.42 3.47 0.19 2.08 1.75 18.17 3.58 4.07 0.51 0.67 0.00 18.45 AIR 5.64 0.00 0.00 0.00 0.00 0.00 0.00 0.00 0.00 0.00 8.49 5.28 5.50 0.01 0.16 0.00 8.52 H2 0.79 1.37 76.73 0.00 178.61 0.99 187.96 0.44 90.67 106.70 289.92 264.78 267.08 0.00 1.21 0.00 289.97 NH3 0.00 0.02 0.01 0.00 0.00 0.00 0.03 0.00 0.00 0.06 0.14 0.05 0.05 0.00 0.01 0.00 0.14 H2S 21.75 1.41 20.80 0.00 84.79 20.90 76.63 11.36 65.16 4.12 534.77 125.02 130.44 0.00 21.19 1.27 551.88 METHANE 1.41 1.37 24.59 0.00 90.68 3.29 71.94 0.88 31.01 22.33 153.48 95.34 100.97 0.00 2.52 0.00 154.06 ETHANE 26.45 5.91 48.60 0.00 76.60 14.13 62.43 3.84 28.27 20.45 453.42 134.74 146.90 0.00 13.97 0.52 464.35 PROPANE 120.75 42.52 24.17 0.00 46.71 27.88 71.97 21.36 50.58 48.28 620.84 76.37 33.83 0.06 10.19 264.70 644.00 PROPENE 0.00 0.00 0.00 0.00 0.00 0.00 0.00 0.00 0.00 0.00 0.00 0.00 0.00 0.00 0.00 0.00 0.00 IBUTANE 43.65 47.05 23.88 0.44 7.30 9.90 23.68 16.96 17.84 23.52 241.72 13.61 0.38 0.03 0.34 162.11 250.79 BUTANE 180.42 47.65 12.04 1.14 15.64 29.76 23.02 18.47 14.19 17.89 422.16 17.95 1.26 0.20 1.67 292.01 437.52 1BUTENE 0.00 0.00 0.00 0.00 0.00 0.00 0.00 0.00 0.00 0.00 0.00 0.00 0.00 0.00 0.00 0.00 0.00 IPENTANE 108.90 34.68 5.82 29.44 0.00 0.00 4.01 9.52 3.15 5.55 267.81 5.17 1.43 0.19 10.61 5.35 275.11 PENTANE 181.34 21.38 3.75 28.92 0.00 0.00 1.83 4.63 1.24 2.82 333.89 4.99 1.00 0.40 11.63 0.45 342.13 C6+ 1357.24 73.66 2.60 104.82 10.86 261.47 4.83 73.23 3.07 4.67 2479.02 7.81 0.85 189.77 210.33 0.16 2498.71 Total 2052.79 277.39 245.04 165.54 514.31 368.72 531.81 160.88 307.25 258.13 5823.83 754.68 693.76 191.19 284.50 726.56 5935.65 LPG content 344.81 137.23 60.09 1.58 69.66 67.53 118.67 56.79 82.60 89.68 1284.72 107.93 35.48 0.29 12.20 718.82 1332.32 Kg-mole/hr
LPG in with feed 786.70 (With streams 101+102+103+104+107+108A+110) LPG with Lean Oil Stream 180 0.29 LPG in 786.99 LPG out 212 718.82 LPG recovered 212 718.82 143 35.48 187 12.20 312 20.53 Total 731.02 187 12.20 787.03 % LPG recovered 92.89%
Example A Technical Report
28 of 33
Stream No. 126 145 161 170 182 202 203 204 209 225 229 231 233 302A 303 Phase Mixed Liquid Mixed Liquid Liquid Mixed Vapor Liquid Liquid Liquid Liquid Liquid Liquid Liquid Liquid Total Stream
Rate KG-MOL/HR 5173 971 1482 3692 191 3692 3359 3359 2633 2965 2965 684 684 5173 5173
KG/HR 418694 83810 62573 356114 43000 356114 178264 178264 139708 317559 317559 73254 73254 418694 418694 Temperature C 92 56 92 167 44 161 74 47 47 194 135 135 47 40 40 Pressure KG/CM2 18.40 15.10 16.50 16.80 9.20 13.65 13.00 12.20 12.10 13.29 12.99 12.99 19.17 29.85 18.70 Total Molar Comp. Rates
KG-MOL/HR
H2O 7.37 1.23 7.37 0.00 0.51 0.00 0.00 0.00 0.00 0.00 0.00 0.00 0.00 7.37 7.37 AIR 3.24 0.55 3.24 0.00 0.01 0.00 0.00 0.00 0.00 0.00 0.00 0.00 0.00 3.24 3.24 H2 25.18 3.79 25.18 0.00 0.00 0.00 0.00 0.00 0.00 0.00 0.00 0.00 0.00 25.18 25.18 NH3 0.10 0.02 0.10 0.00 0.00 0.00 0.00 0.00 0.00 0.00 0.00 0.00 0.00 0.10 0.10 H2S 426.87 80.26 425.58 1.27 0.00 1.27 5.87 5.87 4.60 0.00 0.00 0.00 0.00 426.87 426.87 METHANE 58.72 8.36 58.72 0.00 0.00 0.00 0.00 0.00 0.00 0.00 0.00 0.00 0.00 58.72 58.72 ETHANE 329.61 58.79 329.08 0.52 0.00 0.52 2.39 2.39 1.87 0.00 0.00 0.00 0.00 329.61 329.61 PROPANE 567.63 97.52 302.87 264.71 0.06 264.71 1223.86 1223.86 959.16 0.01 0.01 0.00 0.00 567.63 567.63 PROPENE 0.00 0.00 0.00 0.00 0.00 0.00 0.00 0.00 0.00 0.00 0.00 0.00 0.00 0.00 0.00 IBUTANE 237.18 25.50 71.47 165.70 0.03 165.70 749.53 749.53 587.42 3.59 3.59 0.83 0.83 237.18 237.18 BUTANE 419.58 35.62 104.47 315.09 0.20 315.09 1350.10 1350.10 1058.09 23.09 23.09 5.33 5.33 419.58 419.58 1BUTENE 0.00 0.00 0.00 0.00 0.00 0.00 0.00 0.00 0.00 0.00 0.00 0.00 0.00 0.00 0.00 IPENTANE 269.95 49.29 36.90 233.04 0.19 233.04 24.75 24.75 19.40 227.69 227.69 52.52 52.52 269.95 269.95 PENTANE 337.15 64.54 38.79 298.34 0.40 298.34 2.07 2.07 1.62 297.90 297.90 68.72 68.72 337.15 337.15 C6+ 2490.91 545.98 77.85 2413.04 189.77 2413.04 0.72 0.72 0.56 2412.88 2412.88 556.60 556.60 2490.91 2490.91
Example A Technical Report
29 of 33
Stream No. 304 306 307 308 309 310 313 Phase Mixed Mixed Mixed Mixed Mixed Vapor Mixed Total Stream Rate 431 320 112 1075 1050 787 285 18220 11716 6504 29017 44353 18461 48358 Temperature 92 45 45 39 92 61 63 Pressure 16.50 16.25 16.25 15.20 16.50 14.70 12.90 Total Molar Comp. Rates H2O 2.15 1.87 0.27 5.46 5.23 4.23 0.67 AIR 0.94 0.91 0.04 6.19 2.30 5.64 0.16 H2 7.33 7.29 0.04 272.07 17.85 268.28 1.21 NH3 0.03 0.03 0.00 0.07 0.07 0.06 0.01 H2S 123.92 106.87 17.05 231.89 301.66 151.63 21.19 METHANE 17.10 16.52 0.58 111.86 41.62 103.49 2.52 ETHANE 95.82 84.93 10.89 219.67 233.26 160.87 13.97 PROPANE 88.19 65.11 23.09 141.48 214.68 43.96 10.19 PROPENE 0.00 0.00 0.00 0.00 0.00 0.00 0.00 IBUTANE 20.81 11.75 9.06 25.36 50.66 0.69 0.34 BUTANE 30.42 15.08 15.34 33.02 74.05 2.73 1.67 1BUTENE 0.00 0.00 0.00 0.00 0.00 0.00 0.00 IPENTANE 10.74 3.45 7.29 8.62 26.15 11.85 10.61 PENTANE 11.30 3.06 8.24 8.04 27.50 12.22 11.63 C6+ 22.67 2.98 19.69 10.79 55.18 21.41 210.33
Example A Technical Report
30 of 33
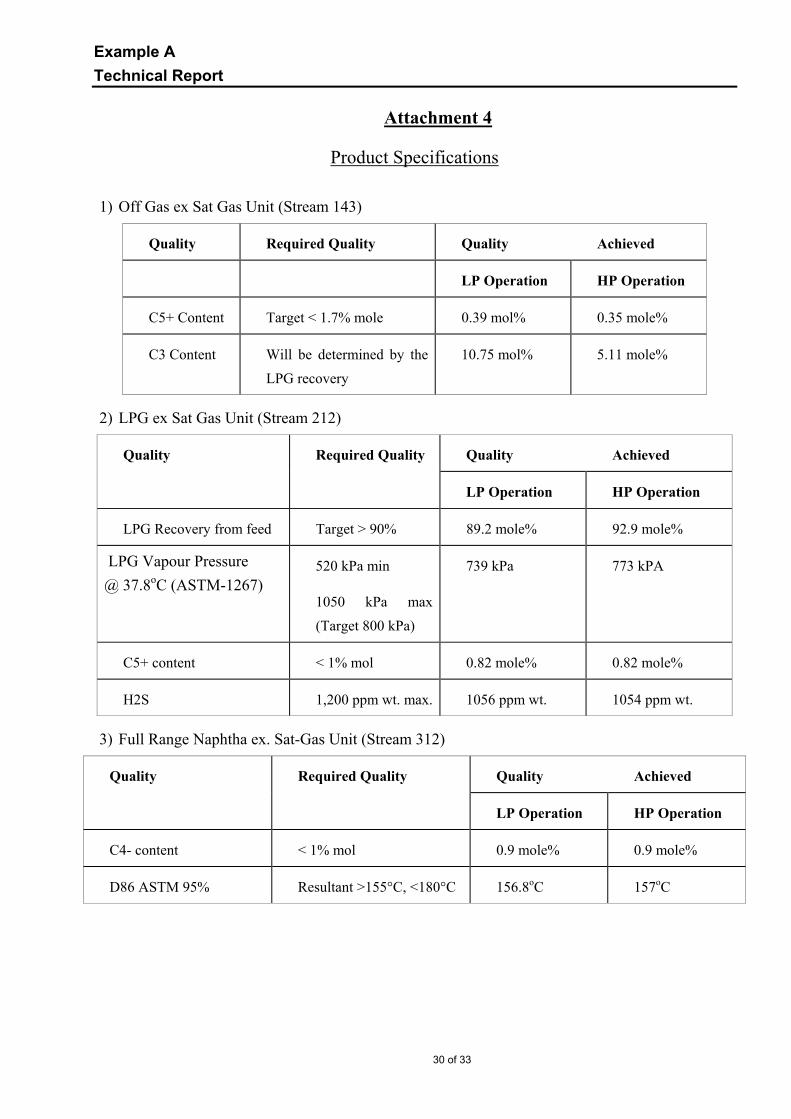
Attachment 4
Product Specifications
1) Off Gas ex Sat Gas Unit (Stream 143)
Quality Required Quality Quality Achieved
LP Operation HP Operation
C5+ Content Target < 1.7% mole 0.39 mol% 0.35 mole%
C3 Content Will be determined by the LPG recovery
10.75 mol% 5.11 mole%
2) LPG ex Sat Gas Unit (Stream 212)
Quality Required Quality Quality Achieved
LP Operation HP Operation
LPG Recovery from feed Target > 90% 89.2 mole% 92.9 mole%
LPG Vapour Pressure @ 37.8oC (ASTM-1267)
520 kPa min
1050 kPa max (Target 800 kPa)
739 kPa 773 kPA
C5+ content < 1% mol 0.82 mole% 0.82 mole%
H2S 1,200 ppm wt. max. 1056 ppm wt. 1054 ppm wt.
3) Full Range Naphtha ex. Sat-Gas Unit (Stream 312)
Quality Required Quality Quality Achieved
LP Operation HP Operation
C4- content < 1% mol 0.9 mole% 0.9 mole%
D86 ASTM 95% Resultant >155°C, <180°C 156.8oC 157oC
Example A Technical Report
31 of 33
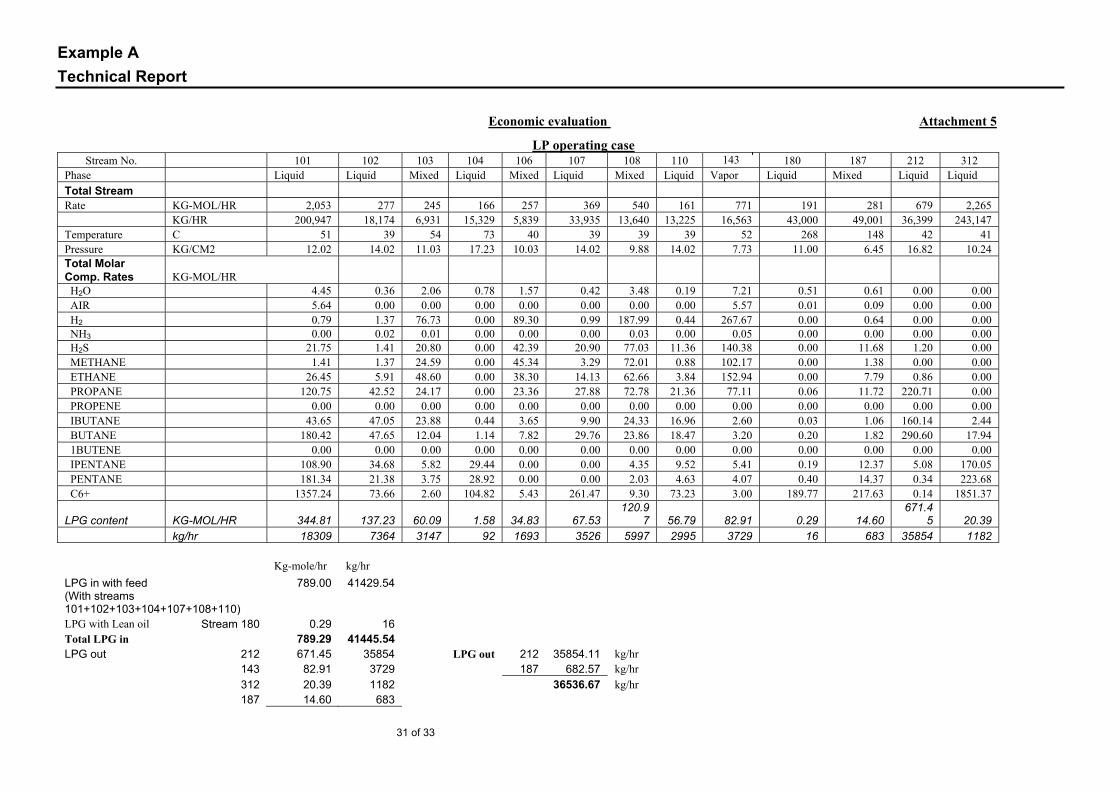
Economic evaluation Attachment 5
LP operating case Stream No. 101 102 103 104 106 107 108 110 143 180 187 212 312
Phase Liquid Liquid Mixed Liquid Mixed Liquid Mixed Liquid Vapor Liquid Mixed Liquid Liquid Total Stream Rate KG-MOL/HR 2,053 277 245 166 257 369 540 161 771 191 281 679 2,265 KG/HR 200,947 18,174 6,931 15,329 5,839 33,935 13,640 13,225 16,563 43,000 49,001 36,399 243,147 Temperature C 51 39 54 73 40 39 39 39 52 268 148 42 41 Pressure KG/CM2 12.02 14.02 11.03 17.23 10.03 14.02 9.88 14.02 7.73 11.00 6.45 16.82 10.24 Total Molar Comp. Rates KG-MOL/HR H2O 4.45 0.36 2.06 0.78 1.57 0.42 3.48 0.19 7.21 0.51 0.61 0.00 0.00 AIR 5.64 0.00 0.00 0.00 0.00 0.00 0.00 0.00 5.57 0.01 0.09 0.00 0.00 H2 0.79 1.37 76.73 0.00 89.30 0.99 187.99 0.44 267.67 0.00 0.64 0.00 0.00 NH3 0.00 0.02 0.01 0.00 0.00 0.00 0.03 0.00 0.05 0.00 0.00 0.00 0.00 H2S 21.75 1.41 20.80 0.00 42.39 20.90 77.03 11.36 140.38 0.00 11.68 1.20 0.00 METHANE 1.41 1.37 24.59 0.00 45.34 3.29 72.01 0.88 102.17 0.00 1.38 0.00 0.00 ETHANE 26.45 5.91 48.60 0.00 38.30 14.13 62.66 3.84 152.94 0.00 7.79 0.86 0.00 PROPANE 120.75 42.52 24.17 0.00 23.36 27.88 72.78 21.36 77.11 0.06 11.72 220.71 0.00 PROPENE 0.00 0.00 0.00 0.00 0.00 0.00 0.00 0.00 0.00 0.00 0.00 0.00 0.00 IBUTANE 43.65 47.05 23.88 0.44 3.65 9.90 24.33 16.96 2.60 0.03 1.06 160.14 2.44 BUTANE 180.42 47.65 12.04 1.14 7.82 29.76 23.86 18.47 3.20 0.20 1.82 290.60 17.94 1BUTENE 0.00 0.00 0.00 0.00 0.00 0.00 0.00 0.00 0.00 0.00 0.00 0.00 0.00 IPENTANE 108.90 34.68 5.82 29.44 0.00 0.00 4.35 9.52 5.41 0.19 12.37 5.08 170.05 PENTANE 181.34 21.38 3.75 28.92 0.00 0.00 2.03 4.63 4.07 0.40 14.37 0.34 223.68 C6+ 1357.24 73.66 2.60 104.82 5.43 261.47 9.30 73.23 3.00 189.77 217.63 0.14 1851.37
LPG content KG-MOL/HR 344.81 137.23 60.09 1.58 34.83 67.53 120.9
7 56.79 82.91 0.29 14.60 671.4
5 20.39 kg/hr 18309 7364 3147 92 1693 3526 5997 2995 3729 16 683 35854 1182
Kg-mole/hr kg/hr LPG in with feed 789.00 41429.54 (With streams 101+102+103+104+107+108+110) LPG with Lean oil Stream 180 0.29 16 Total LPG in 789.29 41445.54 LPG out 212 671.45 35854 LPG out 212 35854.11 kg/hr 143 82.91 3729 187 682.57 kg/hr 312 20.39 1182 36536.67 kg/hr 187 14.60 683
Example A Technical Report
32 of 33
789.35 41448.54
HP operating case Stream Name 101 102 103 104 106 107 108A 110 143 180 187A 212 312 Phase Liquid Mixed Mixed Liquid Mixed Liquid Vapor Liquid Vapor Liquid Mixed Liquid Liquid Total Stream Rate KG-MOL/HR 2053 277 245 166 514 369 532 161 694 191 285 727 2281 KG/HR 200947 18174 6931 15329 11679 33935 12912 13225 13104 43000 48358 38556 244304 Temperature C 51 39 54 73 40 39 73 39 49 268 150 42 42 Pressure KG/CM2 16.5 16.5 16.5 17.23 10.03 16.5 15.9444 16.5 8.43 11 12.55 11.8 12.7103 Total Mol. Comp. Rates KG-MOL/HR H2O 4.45 0.36 2.06 0.78 3.13 0.42 3.47 0.19 4.07 0.51 0.67 0.00 0.00 AIR 5.64 0.00 0.00 0.00 0.00 0.00 0.00 0.00 5.50 0.01 0.16 0.00 0.00 H2 0.79 1.37 76.73 0.00 178.61 0.99 187.96 0.44 267.08 0.00 1.21 0.00 0.00 NH3 0.00 0.02 0.01 0.00 0.00 0.00 0.03 0.00 0.05 0.00 0.01 0.00 0.00 H2S 21.75 1.41 20.80 0.00 84.79 20.90 76.63 11.36 130.44 0.00 21.19 1.27 0.00 METHANE 1.41 1.37 24.59 0.00 90.68 3.29 71.94 0.88 100.97 0.00 2.52 0.00 0.00 ETHANE 26.45 5.91 48.60 0.00 76.60 14.13 62.43 3.84 146.90 0.00 13.97 0.52 0.00 PROPANE 120.75 42.52 24.17 0.00 46.71 27.88 71.97 21.36 33.83 0.06 10.19 264.70 0.01 PROPENE 0.00 0.00 0.00 0.00 0.00 0.00 0.00 0.00 0.00 0.00 0.00 0.00 0.00 IBUTANE 43.65 47.05 23.88 0.44 7.30 9.90 23.68 16.96 0.38 0.03 0.34 162.11 2.76 BUTANE 180.42 47.65 12.04 1.14 15.64 29.76 23.02 18.47 1.26 0.20 1.67 292.01 17.76 1BUTENE 0.00 0.00 0.00 0.00 0.00 0.00 0.00 0.00 0.00 0.00 0.00 0.00 0.00 IPENTANE 108.90 34.68 5.82 29.44 0.00 0.00 4.01 9.52 1.43 0.19 10.61 5.35 175.17 PENTANE 181.34 21.38 3.75 28.92 0.00 0.00 1.83 4.63 1.00 0.40 11.63 0.45 229.18 C6+ 1357.24 73.66 2.60 104.82 10.86 261.47 4.83 73.23 0.85 189.77 210.33 0.16 1856.28 Total 2052.79 277.39 245.04 165.54 514.31 368.72 531.81 160.88 693.76 191.19 284.50 726.56 2281.16 LPG content Kg-mole/hr 344.81 137.23 60.09 1.58 69.66 67.53 118.67 56.79 35.48 0.29 12.20 718.82 20.53 Kg/hr 18308.57 7363.76 3146.84 91.65 3386.10 3526.44 5875.12 2994.91 1583.88 16.00 565.07 37985.70 1190.61
kg-mole/hr kg/hr
LPG in with feed 786.70 41307.28 LPG with Lean Oil Stream 180 0.29 16.00 LPG in 786.99 41323.28 kg/hr LPG out 212 718.82 37985.70 LPG recovered 212 37985.70 143 35.48 1583.88 187 565.07 312 20.53 1190.61 Total 38550.77
187 12.20 565.07 Extra LPG recovered than LP 2014.10 which @ US$467/ton is 940.58 US$/hr
Example A Technical Report
33 of 33
787.03 41325.26 Cost