discover how to manage chloride in the refinery … how to manage chloride in the refinery crude ......
TRANSCRIPT

© XOS (2014)
better analysis counts
Discover How to Manage Chloride in the Refinery Crude Unit
© XOS (2014)
better analysis counts
Crude Oil Contaminants: Chlorine and the Desalting Process Crude oil contains many contaminants which present challenges to refiners. Some contaminants occur naturally in the crude oil and others are accumulated in the upstream process. The primary means to remove these contaminants is the desalting process. In the desalting process, water is mixed with the crude, passing through a mix valve prior to entering the Desalter. The mix valve creates vigorous contact between the water and crude resulting in an environment for contaminants to enter the water phase. Once in the Desalter, a current is applied to help accelerate the separation of the oil and water phase. An emulsion breaker may be used to aid in separation. The water with any solids that might have been in the crude is sent to the wastewater treatment plant for treatment. Whatever contaminants are not removed by the Desalter must be treated chemically. Of particular importance is chlorine that remains in the desalted crude. Chlorine can exist as either Inorganic Chlorine (Calcium Chloride, Sodium Chloride, and Magnesium Chloride) or Organic Chlorine. Typically the Inorganic Chlorine will be removed in the desalter, but Organic Chlorine will stay with the crude oil. Chlorine can cause corrosion in the Crude Unit by forming hydrochloric acid. Chlorine can react with amine-based treatments to form ammonium chloride, which can deposit in overhead systems. Heat transfer can be impacted and under-deposit corrosion can result. Treating chlorine in crude units is a balancing act. Too much chemical will increase fouling potential and put downstream equipment at risk. Too little chemical presents a risk of corrosion and fouling in the crude unit. Accurate measurement of Chlorine is vital in protecting your assets. The XOS Clora On-line analyzer accurately measures total Chlorine in raw crude oil, desalted crude, or both. Real time results give the feedback that is critical in keeping systems running properly. Desalter performance can be monitored to make sure it is working optimally. A proper performing desalter will keep the Crude Unit and downstream units operating well and protect the waste water treatment plant from overload. Desalter upsets can easily be detected and impacts of crude slate changes can be identified. The XOS Clora On-line analyzer can also measure total Chlorine in water streams giving flexibility based on your needs. Measuring Chlorine in the overhead waters or desalter wash waters can be easily completed, even if they are sour. These measurements can be used to automate chemical feed, protecting systems around the clock. The desalting process is critical to the refinery. The XOS Clora On-Line analyzer helps ensure quality and avoid issues through the highly accurate measurement of Chlorine in raw crude oil.

© XOS (2014)
better analysis
counts
ACCU-FLOW Technology Delivers Efficient, Accurate Liquid Sample Measurement
XOS, a long-time provider of breakthrough elemental analysis solutions for the petroleum industry is proud to introduce readers to ACCU-FLOW technology. Combined with X-Ray Fluorescence (XRF), ACCU-FLOW technology allows for the measurement of continuously flowing samples—a true innovation in benchtop analysis. ACCU-FLOW technology delivers the direct measurement of liquid samples as they exist in the process as opposed to a static measurement. In a static measurement particulates may settle over time leading to results that reflect inaccurate concentration levels. Significant potential settling effects can occur in just a five to ten minute time span during the static measurement. By applying ACCU-FLOW technology to an XOS benchtop, we can eliminate the settling of particulates in the sample, resulting in an increased level of accuracy, surpassing traditional benchtop analysis. ACCU-FLOW technology eliminates particulate settling, providing a truly accurate measurement of element concentrations and giving you direct measurement of crude streams as they exist in the refinery. ACCU-FLOW technology provides unprecedented precision and levels of detection. Beyond precision, XOS analyzers with ACCU-FLOW can operate in tough environments from mobile vans to refinery plants and pipeline terminals. ACCU-FLOW technology eliminates particulate settling effects with a simple design, optimized for everyday use. It is available on the following XOS analyzers: • Chlorine benchtop: Clora • Phosphorus benchtop: Phoebe • Multi-Element benchtop: Maxine

© XOS (2014)
better analysis counts
Measurement of Aqueous Samples on a Clora Hydrocarbon Calibration Curve
Matrix effects, or differences between the elemental composition of test samples and the calibration standards, can often result in biased chlorine measurements. These effects can be compensated for with the utilization of one of two methods. First, the selection of calibrants that match—as closely as possible—the test sample matrix. This is especially true for materials containing oxygen, for instance E85 (85% ethanol in gasoline). The closer the calibration matrix reflects the actual test samplers, the better the results will be. Secondly, one can employ the use of a matrix correction factor. Commonly used in the refining industry, users will typically apply a matrix correction factor for measurement of aqueous samples on a hydrocarbon based calibration curve. In this procedure, the analyst will pipette 5-8 ml of sample into a sample cup and test in the XOS Clora using Etnom XRF film. The standard analysis time for samples containing >1 ppm chlorine is 300 seconds. If the sample contains <1 ppm chlorine, a 600 sec measurement time is suggested for optimal results. In addition, if the sample contains >1 wt% sulfur, use of a sulfur correction table is recommended help improve results. If a water-based calibration curve is used when measuring aqueous samples, a matrix correction factor is not needed. When the aqueous sample is measured on a hydrocarbon curve, high oxygen content, when not accounted for, will result in reduced counts and a falsely low chlorine value. If a dedicated water curve has not been developed, multiply the results obtained using a hydrocarbon calibration curve by 250% (or 2.50). In Summary: Total chlorine of aqueous samples measured on water based calibration curve: Total chlorine (ppm) = measured chlorine Total chlorine of aqueous samples measured on hydrocarbon based curve: Total chlorine (ppm) = 2.5 * measured chlorine

On-line Chlorine Analyzer for Crude Oil and Petroleum
Process Streams
Zewu Chen and Stu Shakshober XOS
Outline • Background • Method
– Monochromatic Wavelength-dispersive XRF – Dynamical window module
• Testing Data and field installation • Conclusion

Opportunity Crude (OC) • High margin for refinery • More and more OC is used in refinery • Downside for OC refining
– Unknown impurities – Potential fouling and corrosion effects – More on-line process control

Causes of corrosion : • Inorganic chlorides • Organic chlorides • Sulfur compounds • Organic acids
$1.3 billion dollars lost a year.
Corrosion

Corrosion Control

Chlorides and Corrosion • Chlorides in process stream form HCl • HCl attacks overhead in distillation tower • Organic chlorides or non-extractable chlorides
are the most problematic • Chlorine level in process streams < 1ppm
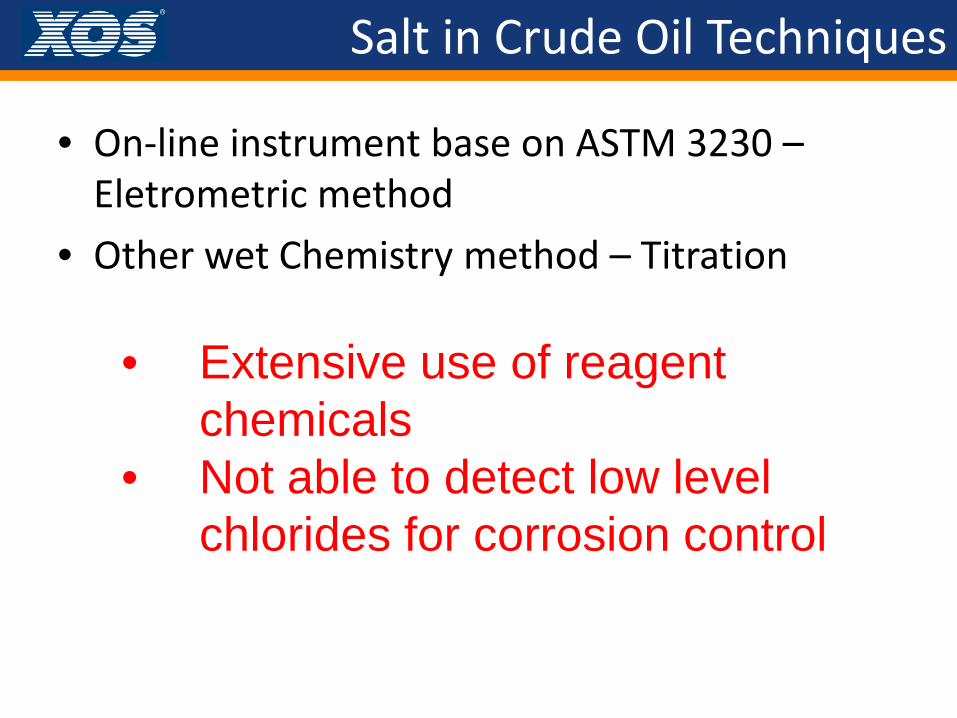
• On-line instrument base on ASTM 3230 – Eletrometric method
• Other wet Chemistry method – Titration
• Extensive use of reagent chemicals
• Not able to detect low level chlorides for corrosion control
Salt in Crude Oil Techniques
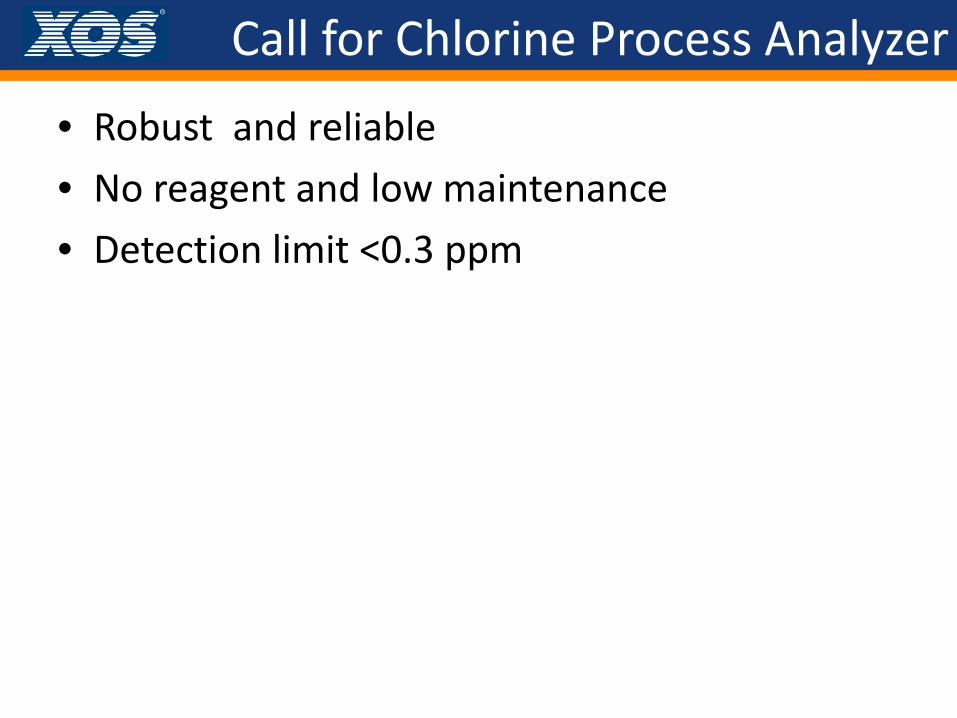
Call for Chlorine Process Analyzer
• Robust and reliable • No reagent and low maintenance • Detection limit <0.3 ppm
E C
ount
s
E
Cou
nts
E
Cou
nts
E
Cou
nts
S S
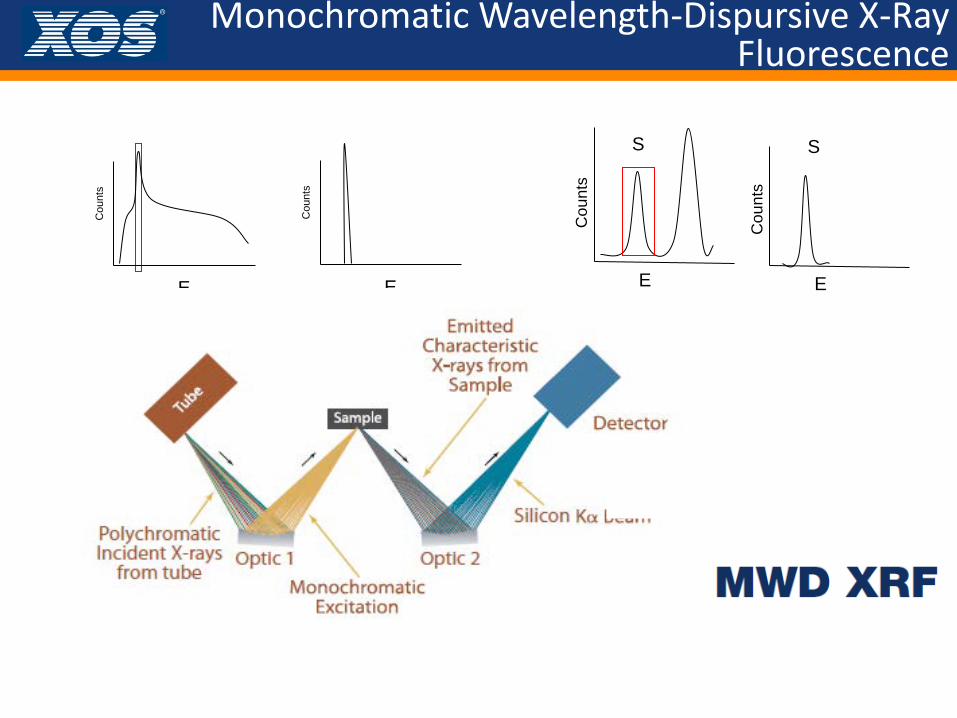
Monochromatic Wavelength-Dispursive X-Ray Fluorescence

Dynamic Window Module to Maintain Constant Background

MWDXRF vs. WDXRF
• Monochromatic excitation • High S/N ratio, >10X better • Low power, 20-40 x reduction • Optical efficiency, >10 x • Limit of detection, 2 x better
MWDXRF vs. Eletrometic and Titration Methods
• No reagent • Low maintenance • Lower LOD for corrosion control

On-line Chlorine MWDXRF Analyzer Crude and Water
• Total Chlorine – LOD: 0.2 ppm @ 600s – hydrocarbon matrix – LOD: 0.4 ppm @ 600s – aqueous matrix
• Analysis Time: 10 - 900s – user adjustable • Range: 0.2 ppm/wt – 3,000 ppm/wt • Continuous Measurement

Flow Diagram

Desalter

Analyzer Set-Up
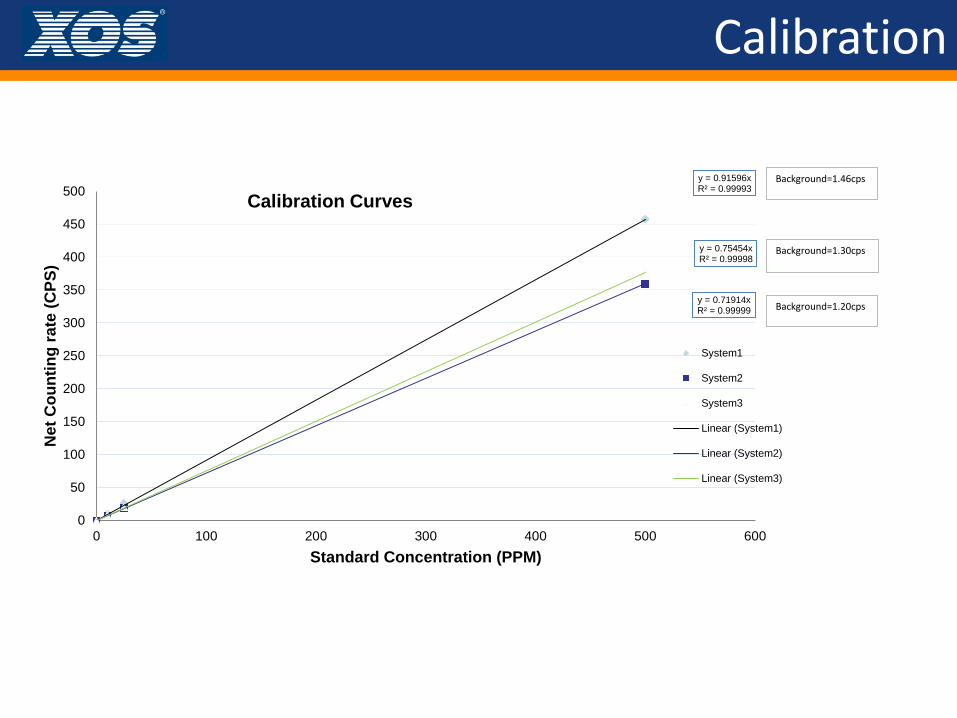
Calibration
y = 0.91596x R² = 0.99993
y = 0.71914x R² = 0.99999
y = 0.75454x R² = 0.99998
0
50
100
150
200
250
300
350
400
450
500
0 100 200 300 400 500 600
Net
Cou
ntin
g ra
te (C
PS)
Standard Concentration (PPM)
Calibration Curves
System1
System2
System3
Linear (System1)
Linear (System2)
Linear (System3)
Background=1.46cps
Background=1.30cps
Background=1.20cps

Desalted Crude -- Stability Testing
0.00
0.40
0.80
1.20
1.60
2.00
2.40
2.80
Tota
l Chl
orin
e C
once
ntra
tion
(ppm
)
Date / Time
Crude Sample (De-salted) Stability over 84 hours
Avg = 1.59 ppm
PPM- 5 Minute Std Dev=0.11ppm
PPM-15 minute Std Dev=0.07ppm

Sample Cl Level Close to Detection Limit
0.00
0.40
0.80
1.20
1.60
Tota
l Chl
orin
e C
once
ntra
tion
(ppm
)
Date / Time
Contaminated Mineral Spirits Samples Avg = 0.74 ppm
PPM- 5 Minute, Std Dev=0.1ppm
PPM 15 Minute, Std Dev=0.06ppm

Base Line Recovery
0.00
10.00
20.00
30.00
40.00
50.00
9:00:00 9:30:00 10:00:00 10:30:00 11:00:00 11:30:00 12:00:00 12:30:00 13:00:00
Tota
l Chl
orin
e C
once
ntra
tion
(ppm
)
Date / Time
Analysis of total Cl during a transition from raw crude to de-salted crude (Western Canadian blend)
PPM- 5 min

Stability and Detection Limit
RAW CRUDE
DESALTED CRUDE
MINERAL SPIRITS
Integration time 5 min 5 min 15 min 5 min 15 min
Overall run time 82 hrs 84hrs 84 hrs 21 hrs 21 hrs
Average (ppm) 34.4 1.59 1.59 0.74 0.74
Standard Dev (ppm) 0.57 0.11 0.07 0.10 0.06
RSD (%) 1.7 6.9 4.4 13.5 8.1
LOD (ppm) NA NA NA 0.30 0.18
LOQ (ppm) NA NA NA 1.0 0.6

Compared to Lab Results
WESTERN CANADIAN RAW
CRUDE WESTERN CANADIAN
DESALTED CRUDE D3230 Salt content
(lb/1000bbl) 25 2.8 D3230 Converted to Cl
(ppm) 49 5.5 Clora Lab bench average (ppm)
44.5 (Avg of 43.5, 45.2, 44.8) 5.1 (Avg of 5.1,5.2,4.9)
Online average (ppm) 40.8 4.98
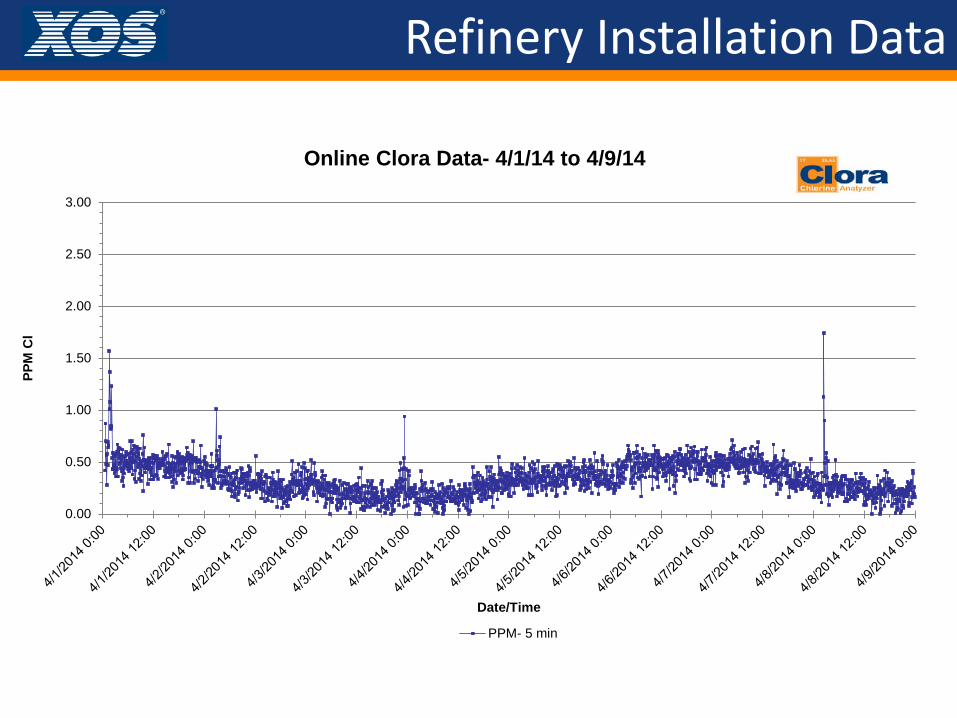
Refinery Installation Data
0.00
0.50
1.00
1.50
2.00
2.50
3.00
PPM
Cl
Date/Time
Online Clora Data- 4/1/14 to 4/9/14
PPM- 5 min
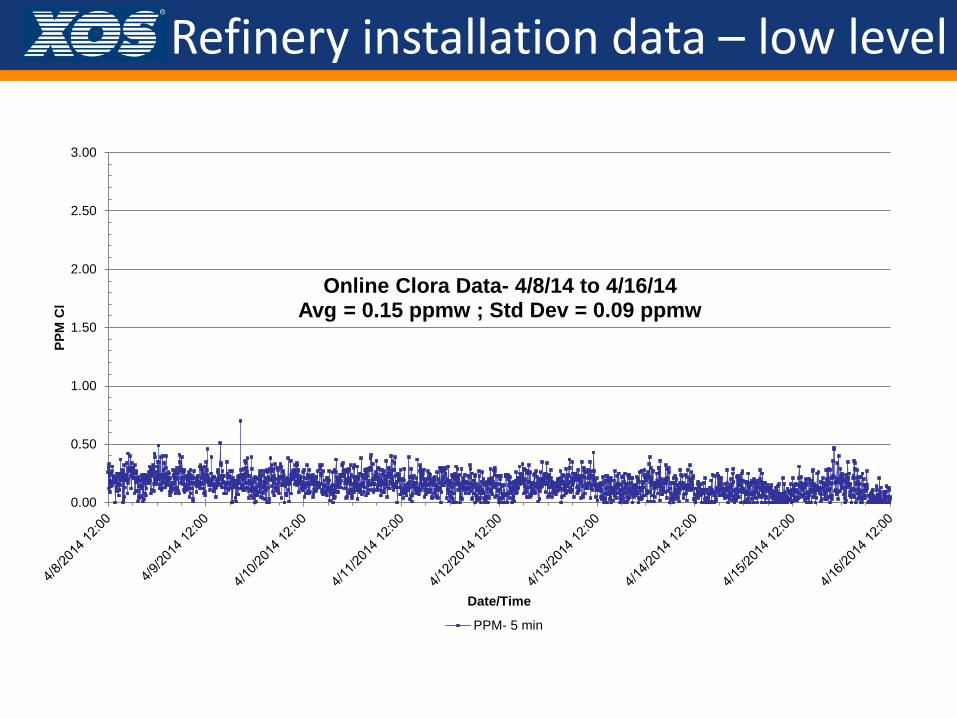
Refinery installation data – low level
0.00
0.50
1.00
1.50
2.00
2.50
3.00
PPM
Cl
Date/Time
Online Clora Data- 4/8/14 to 4/16/14 Avg = 0.15 ppmw ; Std Dev = 0.09 ppmw
PPM- 5 min
Conclusions • Corrosion is a major issue for refineries and
mitigation is critical • The XOS Clora OL allows for robust and
reliable chloride detection down to <0.3ppm with no reagents and low maintenance