louisiana crude oil refinery survey report crude oil refinery survey report twelfth edition...
TRANSCRIPT
LOUISIANA CRUDE OIL REFINERY SURVEY REPORT Twelfth Edition
Louisiana Fiscal Year 2001 Survey
By Renzo Spanhoff, P.E.
Refining, Alternative Energy & Power Systems Program
LOUISIANA DEPARTMENT OF NATURAL RESOURCES
Jack C. Caldwell
Secretary of Natural Resources
Technology Assessment Division
T. Michael French, P.E. Director
Baton Rouge, Louisiana
October 2002

This edition of Louisiana Crude Oil Refinery Survey Report is funded 100% ($xxxxx.xx) with Petroleum Violation Escrow funds as part of the State Energy Conservation Program as approved by the U.S. Department of Energy and Louisiana Department of Natural Resources.
-ii-
This public document was published at a total cost of $xxxxxx.xx 300 copies of this public document were published in this first printing at a total cost of $xxxxxx.xx. The total cost of all printings of this document, including reprints, is $xxxxxx.xx. This document was published by the Department of Natural Resources, 617 N. 3rd Street, Baton Rouge, LA, to promulgate the State Energy Conservation Plan developed under authority of P.L. 94-163. This material was printed in accordance with the standards for printing by State agencies established pursuant to R.S. 43:31. Printing of this material was purchased in accordance with the provisions of Title 43 of the Louisiana Revised Statutes.
TABLE OF CONTENTS PAGE FOREWORD .................................................................................................................... 1 DISCUSSION .................................................................................................................... 3 DEFINITIONS .....................................................................................................................14
FIGURES 1 Location Map of Louisiana Refineries ............................................................................... 2 2 Finished Motor Gas Production Rates of Louisiana, Texas Gulf Coast, East Coast, West Coast, and all U.S. Refineries 1989-2001 ................................................................... 7 3 CA and LA Total Motor Gas Sales ........................................................................................ 8 4 Operating Rates of Louisiana, Texas Gulf Coast, and all US Refineries............................. 25 5 Production of LA and US Refineries ................................................................................... 26 6 Louisiana Oil Production and Refinery Operable Capacity ................................................. 27 7 Crude Oil Sources for Louisiana Refineries..........................................................................28 8 FY 2001 Crude Oil Input % by Source and Refinery sorted by Source................................28 9 Gulf Coast Refinery Margins Regional Average Cash Operating Margin............................31
TABLES
OPERATING REFINERIES 1 Operating Refineries Changes in Capacity (BCD) ...............................................................11 2 Louisiana Operating Refineries Crude Capacity (BCD) and percent Product Slate December 2001 DNR Survey ............................................................................... ......…….16 3 U.S. Department of Energy Capacity of Operable Louisiana Refineries as of January 1, 2001......................................................................... 19 4 U.S. Department of Energy and La. Department of Natural Resources Production Capacity of Louisiana Operable Refineries as of January 1, 2001 ................... 21 5 Oil and Gas Journal 2001 Worldwide Refining Survey - La. Refineries ............................ 22
6 FY1999 Crude Oil Input Percentage by Source and Refinery ............................................. 29 7 Louisiana Operating Refineries Mailing Addresses and Contact List ................................. 32
8 Louisiana Operating Refinery Locations ............................................................................. 33 9 Operating Refineries Name History (1980-2001) ............................................................... 34
-iii-

NON-OPERATING REFINERIES 10 Louisiana Non-Operating Refineries Mailing Addresses and Contact List ....….….35 11 Physical Locations, Last Known Crude Capacity, Date Last Operated, Previous Name(s), and Present Status ……………………………………...……...36 12 Non-Operating Refineries Name History (1980-2001)………………..…………..37
-iv-
-v-

Foreword Since 1989 the Technology Assessment Division of the Louisiana Department of Natural Resources (DNR) has periodically conducted surveys of Louisiana crude oil refineries. The results of the survey are compiled into a report focusing on developments that have occurred since the previous survey. These include an overview of the general direction of the industry and updated information on the current status of refinery ownership, mailing addresses, operating status and key personnel. In the past, the report has focused on the source and processing of crude oil. This year, we have also taken a look at the market for the major product, gasoline. Tabulated statistical data, charts, and graphs relating to oil production, refinery crude oil sources, refinery margins, capacities, operating rates, and product slate are also presented. Information on both operating and non-operating refineries that are still intact is included. The previous survey was accomplished in September 1999 for the State’s fiscal year 1999 (FY99) and published November 15, 1999. The information contained in this annual report is designed to complement the information presented in the refinery section of the Department of Energy/Energy Information Administration (DOE/EIA) Petroleum Supply Annual, now published biennially for the previous two calendar years. Generally, the period covered by DNR is the twelve months ending June 30, so this report is ordinarily about six months out of cycle with DOE/EIA data. DNR gratefully acknowledges permission to use the latest Oil and Gas Journal Worldwide Refining Survey results for Louisiana refineries to provide another independent dataset for comparison, especially for those years when the DOE/EIA information is more than a year old. The operating refining capacities, operating rates, and product slate statistics presented in this report are prepared from data supplied by survey respondents. The information on the non-operating refineries is obtained from their owners, trustees, or management personnel and is current within a few weeks of publication. The data used to construct the charts and graphs on oil production, refinery margins, and crude oil sources is obtained from DNR’s database. The principal terms and phrases used in this report are the same as those used in DOE/EIA publications. The slight difference in meaning between operable and operating, when used to specify capacity or utilization rate, has caused some confusion. ‘Operable” refers to the maximum amount of crude oil that a refinery can process in its atmospheric stills; ‘operating’ stands for the amount of crude oil actually processed. In some cases the % of Total Product Slate in Table 1 did not add up to 100. We did not change any of the numbers reported, but normalized the figures to derive the weighted totals for each product. Definitions of principal terms are located in the last section of this report. The Department of Natural Resources uses the information in this report to enhance the economic development efforts of the State by • Developing information on State and Federal energy policies that affect the oil and gas
production and refining industries located in the State;
1

• Helping crude suppliers locate refining sources and refined petroleum product buyers
locate sources of supply;
• Assisting new industries desiring to site facilities near refineries; and, • Providing information to parties evaluating refineries for possible purchase.
Discussion Overview All refineries and refining companies are not created equal. There are small refineries and large ones. Some are quite complex, while others are relatively simple. A number are part of major, integrated oil companies, and some are independent.
Integrated oil companies are engaged in all aspects of the petroleum industry--exploring for and producing crude oil, as well as refining, transporting and marketing petroleum products.
An independent refiner, on the other hand, purchases most of its crude oil on the open market rather than producing it. Refiners such as Placid Refining Co., Calcasieu Refining, and Orion are examples of independent refiners.
Major oil companies dominate the refining industry. The top 10 U.S. refiners, all of them major, integrated oil companies, account for about 60 percent of the total domestic refinery operating capacity. Most of these have operations in Louisiana, either as wholly owned facilities such as the Baton Rouge ExxonMobil refinery or as part owners or joint ventures such as Motiva Refineries in Norco and Convent.
Many refineries are only fuels refineries, some are lube stock refineries, and others are petrochemical refineries. The Shell oil refinery in St. Rose is a good example of a petrochemical refinery. All of its products are raw feed for a chemical plant. Table 1 clearly shows the focus of the refiners in Louisiana.
Besides the level of vertical integration of a refiner and the product mix of a refinery, industry analysts also look at capacity and complexity.
A "complexity factor" is assigned to each process unit of a refinery based on its relative construction cost. The atmospheric crude distillation unit is assigned a value of one. For example, the cost of a fluidized catalytic cracker is six times greater than an atmospheric crude distillation unit of the same capacity, its unit complexity factor is six.
Greater complexity does not necessarily go hand in hand with larger capacity. Some of the smaller facilities in Louisiana are the most complex. For example, the Lube and Wax producing refineries of North Louisiana are very complex compared to the huge refinery in Baton Rouge.
3
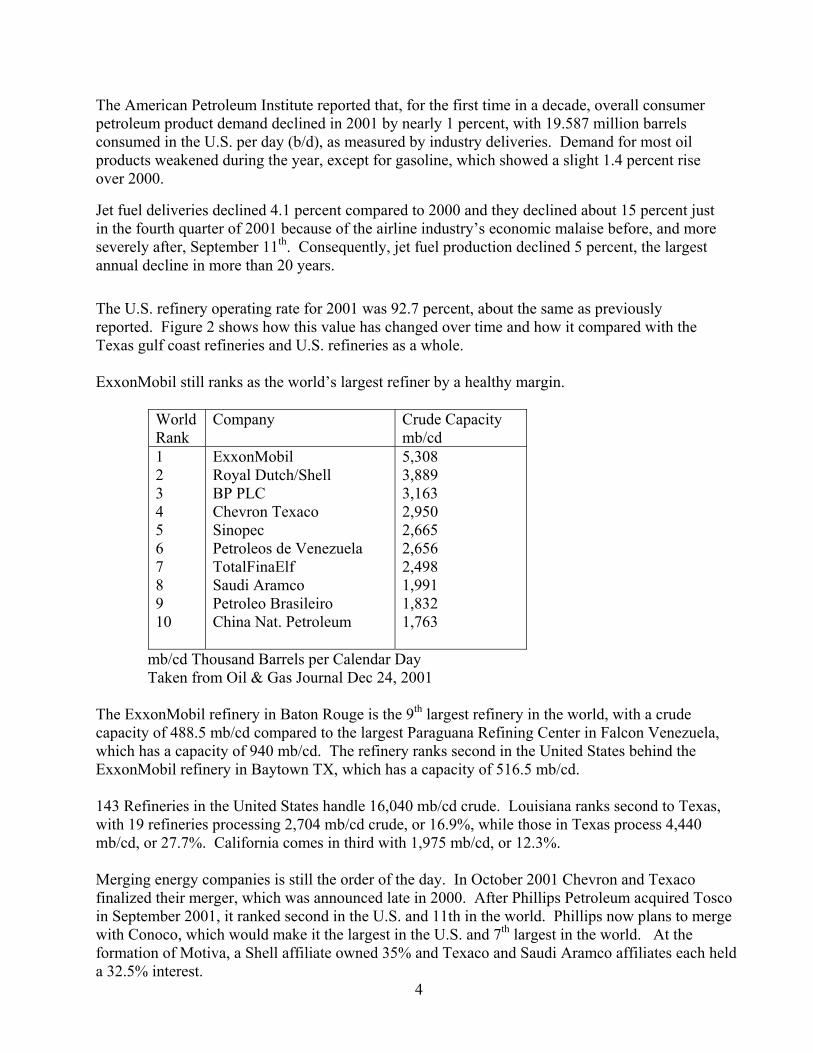
The American Petroleum Institute reported that, for the first time in a decade, overall consumer petroleum product demand declined in 2001 by nearly 1 percent, with 19.587 million barrels consumed in the U.S. per day (b/d), as measured by industry deliveries. Demand for most oil products weakened during the year, except for gasoline, which showed a slight 1.4 percent rise over 2000.
Jet fuel deliveries declined 4.1 percent compared to 2000 and they declined about 15 percent just in the fourth quarter of 2001 because of the airline industry’s economic malaise before, and more severely after, September 11th. Consequently, jet fuel production declined 5 percent, the largest annual decline in more than 20 years. The U.S. refinery operating rate for 2001 was 92.7 percent, about the same as previously reported. Figure 2 shows how this value has changed over time and how it compared with the Texas gulf coast refineries and U.S. refineries as a whole. ExxonMobil still ranks as the world’s largest refiner by a healthy margin.
WorldRank
Company
Crude Capacity mb/cd
1 2 3 4 5 6 7 8 9 10
ExxonMobil Royal Dutch/Shell BP PLC Chevron Texaco Sinopec Petroleos de Venezuela TotalFinaElf Saudi Aramco Petroleo Brasileiro China Nat. Petroleum
5,308 3,889 3,163 2,950 2,665 2,656 2,498 1,991 1,832 1,763
mb/cd Thousand Barrels per Calendar Day Taken from Oil & Gas Journal Dec 24, 2001 The ExxonMobil refinery in Baton Rouge is the 9th largest refinery in the world, with a crude capacity of 488.5 mb/cd compared to the largest Paraguana Refining Center in Falcon Venezuela, which has a capacity of 940 mb/cd. The refinery ranks second in the United States behind the ExxonMobil refinery in Baytown TX, which has a capacity of 516.5 mb/cd. 143 Refineries in the United States handle 16,040 mb/cd crude. Louisiana ranks second to Texas, with 19 refineries processing 2,704 mb/cd crude, or 16.9%, while those in Texas process 4,440 mb/cd, or 27.7%. California comes in third with 1,975 mb/cd, or 12.3%. Merging energy companies is still the order of the day. In October 2001 Chevron and Texaco finalized their merger, which was announced late in 2000. After Phillips Petroleum acquired Tosco in September 2001, it ranked second in the U.S. and 11th in the world. Phillips now plans to merge with Conoco, which would make it the largest in the U.S. and 7th largest in the world. At the formation of Motiva, a Shell affiliate owned 35% and Texaco and Saudi Aramco affiliates each held a 32.5% interest.
4

The current provisional ownership percentages (effective 1/1/01) are 30% for Shell's affiliate and 35% each for the Texaco and Saudi Aramco affiliates. It was announced in the November 19, 2001 issue of Oil and Gas Journal (O&GJ) that Shell has agreed to increase its share in Motiva to 50%. Motiva operates two refineries in Louisiana, one at Convent and one in Norco. Refinery Products As in the past, the focus of the refinery survey report is on crude processing capabilities. This time around, some attention will be given to the products of the refineries. About 38% of crude in Louisiana is converted into motor fuels. The table below shows the other major products, based on our survey.
Product Weighted % Reg. Gasoline 29.1 Mid. Gr. Gasoline 0.0 Prem. Gasoline 7.3 Reformed Gasoline 4.3 Diesel 16.6 Jet/Kerosene 11.2 Fuel Oil 4.9 LPG 2.7 Naphtha 1.9 Resid/Coke 6.1
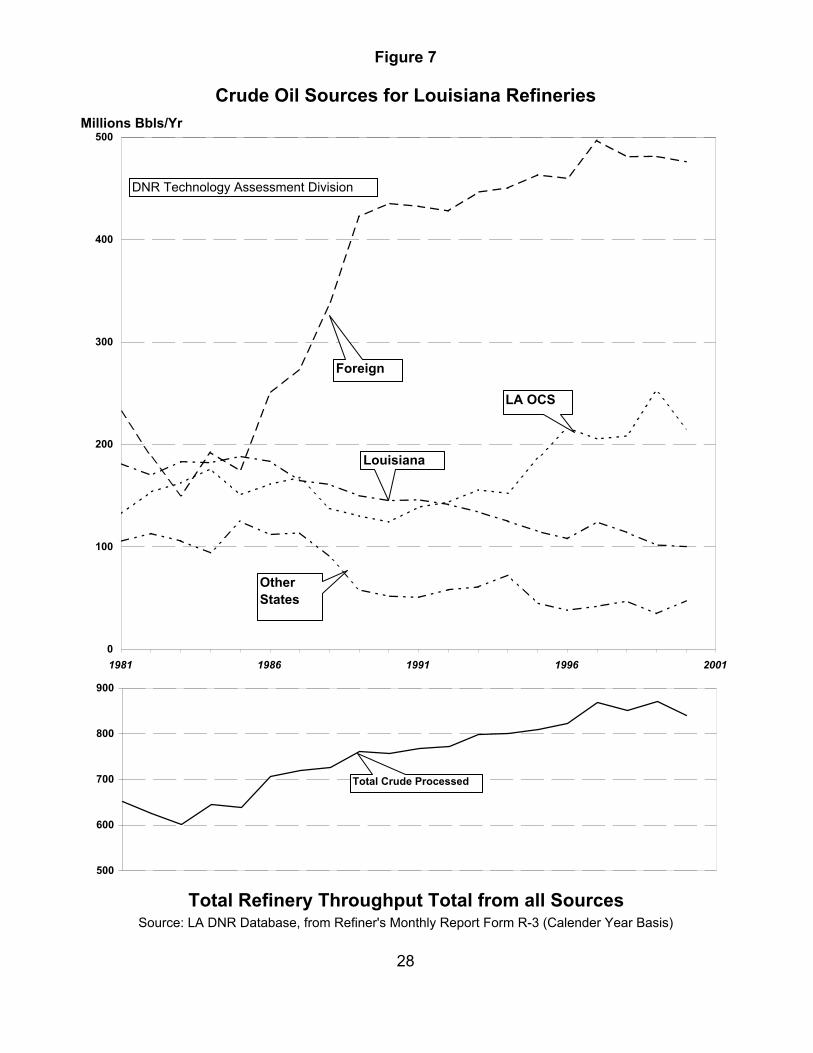
From DNR Survey Note that the percentage for all the gasoline grades do not add up to 38%, because the numbers given in the table are a percentage of total product, and not feed. The percentages are weighted by the refineries’ crude capacity, to reflect the contribution made by each refinery. Most of Louisiana’s refinery products are exported to other states. Louisiana itself consumes about 6 million gallons of gasoline per day (mmg/d). This represents only 12% of the 50 mmg/d it produces. The discovery of oil in Louisiana led to the development of Louisiana’s refining and petrochemical industry. Now most of the crude is imported, and Louisiana is relegated to being a processor for other states. See table 6 and figures 7 and 8. We have changed the format of figure 7 to show the contribution made by each of the components, instead of their cumulative effect, as was previously done. Figure 7 shows that only oil brought in from other states is up over the previous year. Louisiana is a primary energy producing state with 600 million barrels in crude reserves (1999), ranking 6th in reserves (4th including all Federal Offshore.). The state’s 28,000 wells, which produce 288,000 barrels of crude per day (2000), ranked 4th in production (1st including all Federal Offshore). Its 18 refineries process roughly 2.5 mmb/d of crude into refined products, most of it imported from out of state and abroad. Besides gasoline the refineries also produces many other products that feed the petrochemical plants lining the Mississippi River.
5
Gasoline Growth Rate in %/Yr Gasoline Sales
Consumption mmg/d Gasoline sales Population Gal/Day/Capita
U.S. 244 0.48 0.85 1.2 La. 6 -1.57 0.4 1.3 Ca. 40 0.83 1.26 1.19
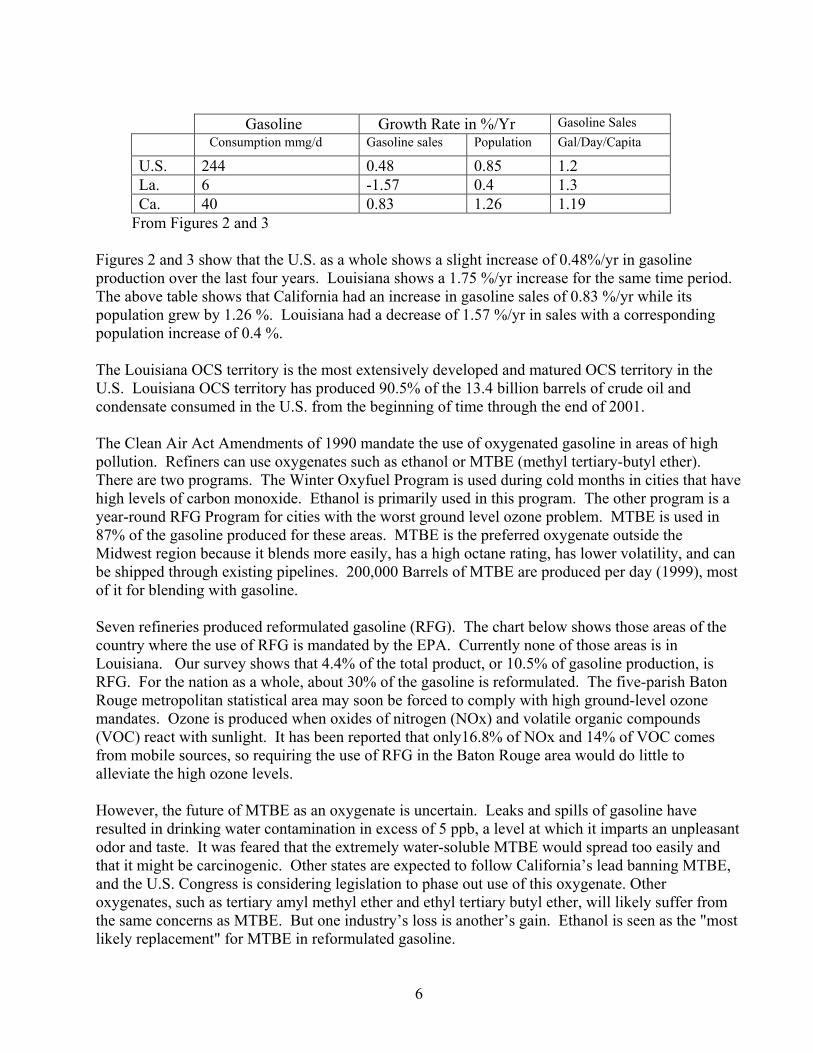
From Figures 2 and 3 Figures 2 and 3 show that the U.S. as a whole shows a slight increase of 0.48%/yr in gasoline production over the last four years. Louisiana shows a 1.75 %/yr increase for the same time period. The above table shows that California had an increase in gasoline sales of 0.83 %/yr while its population grew by 1.26 %. Louisiana had a decrease of 1.57 %/yr in sales with a corresponding population increase of 0.4 %. The Louisiana OCS territory is the most extensively developed and matured OCS territory in the U.S. Louisiana OCS territory has produced 90.5% of the 13.4 billion barrels of crude oil and condensate consumed in the U.S. from the beginning of time through the end of 2001. The Clean Air Act Amendments of 1990 mandate the use of oxygenated gasoline in areas of high pollution. Refiners can use oxygenates such as ethanol or MTBE (methyl tertiary-butyl ether). There are two programs. The Winter Oxyfuel Program is used during cold months in cities that have high levels of carbon monoxide. Ethanol is primarily used in this program. The other program is a year-round RFG Program for cities with the worst ground level ozone problem. MTBE is used in 87% of the gasoline produced for these areas. MTBE is the preferred oxygenate outside the Midwest region because it blends more easily, has a high octane rating, has lower volatility, and can be shipped through existing pipelines. 200,000 Barrels of MTBE are produced per day (1999), most of it for blending with gasoline. Seven refineries produced reformulated gasoline (RFG). The chart below shows those areas of the country where the use of RFG is mandated by the EPA. Currently none of those areas is in Louisiana. Our survey shows that 4.4% of the total product, or 10.5% of gasoline production, is RFG. For the nation as a whole, about 30% of the gasoline is reformulated. The five-parish Baton Rouge metropolitan statistical area may soon be forced to comply with high ground-level ozone mandates. Ozone is produced when oxides of nitrogen (NOx) and volatile organic compounds (VOC) react with sunlight. It has been reported that only16.8% of NOx and 14% of VOC comes from mobile sources, so requiring the use of RFG in the Baton Rouge area would do little to alleviate the high ozone levels. However, the future of MTBE as an oxygenate is uncertain. Leaks and spills of gasoline have resulted in drinking water contamination in excess of 5 ppb, a level at which it imparts an unpleasant odor and taste. It was feared that the extremely water-soluble MTBE would spread too easily and that it might be carcinogenic. Other states are expected to follow California’s lead banning MTBE, and the U.S. Congress is considering legislation to phase out use of this oxygenate. Other oxygenates, such as tertiary amyl methyl ether and ethyl tertiary butyl ether, will likely suffer from the same concerns as MTBE. But one industry’s loss is another’s gain. Ethanol is seen as the "most likely replacement" for MTBE in reformulated gasoline.
6

7
Figure 2
40.0
50.0
60.0
70.0
80.0
90.0
100.0
Jan-98 Jan-99 Jan-00 Jan-01 Jan-02
MM Gal/Day Finished Motor Gas Production
Louisiana
West Coast
TX Gulf
East Coast
0.84
-0.93
0.4
1.75
Percent change per year
280.0
320.0
360.0US Total
0.48

Figure 3
8
LA Total Motor Gas Sales
5.0
5.5
6.0
6.5
-1.57 %/Yr
CA Total Motor Gas Sales
34.0
36.0
38.0
40.0
42.0
44.0
Jan-98 Jul-98 Jan-99 Jul-99 Jan-00 Jul-00 Jan-01 Jul-01 Jan-02
MM Gal/Day
0.83 %/Yr
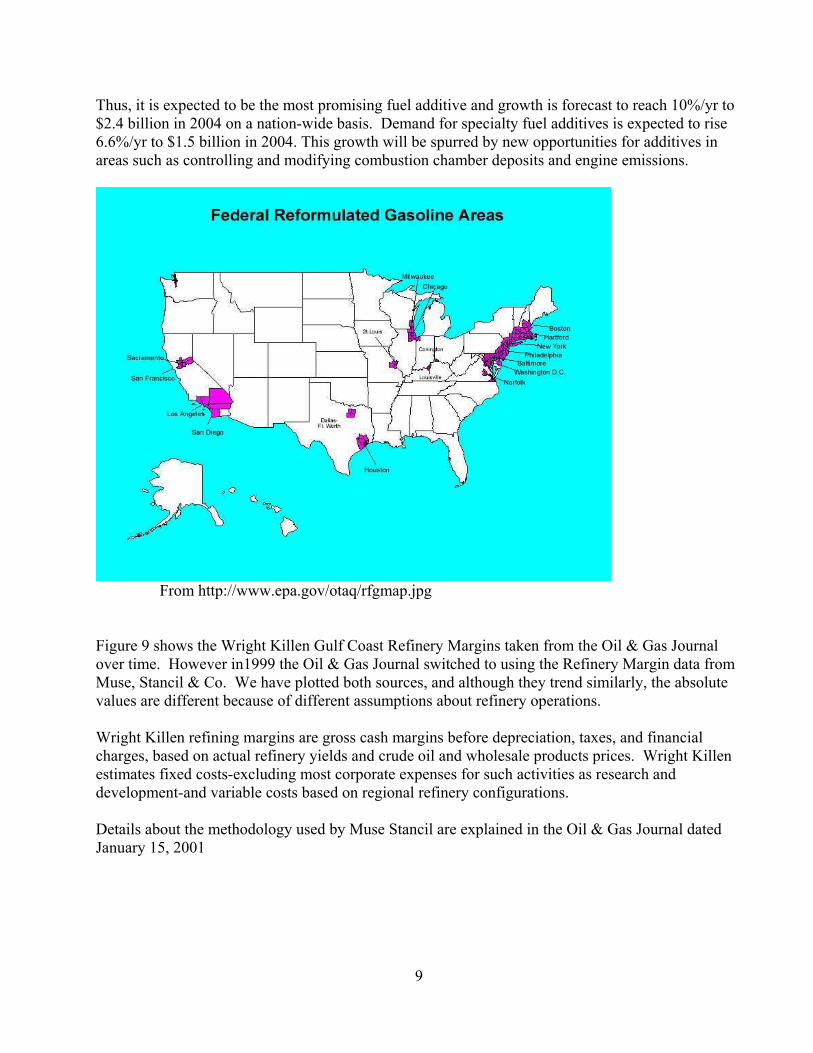
Thus, it is expected to be the most promising fuel additive and growth is forecast to reach 10%/yr to $2.4 billion in 2004 on a nation-wide basis. Demand for specialty fuel additives is expected to rise 6.6%/yr to $1.5 billion in 2004. This growth will be spurred by new opportunities for additives in areas such as controlling and modifying combustion chamber deposits and engine emissions.
From http://www.epa.gov/otaq/rfgmap.jpg Figure 9 shows the Wright Killen Gulf Coast Refinery Margins taken from the Oil & Gas Journal over time. However in1999 the Oil & Gas Journal switched to using the Refinery Margin data from Muse, Stancil & Co. We have plotted both sources, and although they trend similarly, the absolute values are different because of different assumptions about refinery operations. Wright Killen refining margins are gross cash margins before depreciation, taxes, and financial charges, based on actual refinery yields and crude oil and wholesale products prices. Wright Killen estimates fixed costs-excluding most corporate expenses for such activities as research and development-and variable costs based on regional refinery configurations. Details about the methodology used by Muse Stancil are explained in the Oil & Gas Journal dated January 15, 2001
9
Recent Changes Calumet Refining bought the Pennzoil-Quaker State facility in Shreveport. Because of the merger of Exxon and Mobil Oil, the refinery in Baton Rouge was renamed the ExxonMobil refinery. Phillips Petroleum bought the B.P. Amoco facility in Belle Chasse, which may soon be known as the ConocoPhillips refinery. Operating Refineries Operating capacity for Louisiana refineries has increased by 1.52% since our last survey. The biggest gainers where Orion, with 40.91% and Calcasieu refining, with 43.79%. Actual throughput also increased by almost 3% since our last survey. The biggest gainers here were Orion, with 71.2% and Calcasieu refining, with 32.3%. The biggest contributors to the overall state increase of 26.5 MM barrels in the 12-month refining throughput were Orion and ExxonMobil refining. Table 1 shows the details of operating capacity and 12 month throughput. Figure 3 shows the change in Louisiana operating capacity over the last 50 years as compared with the U.S. as a whole. Non Operating refineries There was no change to the El Paso Field Services facility at Dubach, which consists of a crude oil refinery and a gas liquids fractionating plant. The refinery remains shut down. The gas plant is operating, although the liquids fractionating unit was shut down in January 1998. The Canal Refining Co. facility at Church Point is still not operating for inclusion in this report. However, the refinery expects to restart in early 2002 after completing extensive maintenance and process projects that are expected to result in a capacity increase. The Jennings refinery that was last operated by Gold Line remains shut down since February 1998. The owner of this facility desires to sell or lease the facility. At Lisbon, the refinery remains shut down since July 1997 and is to be dismantled. It will never operate as a refinery again. Ergon St. James, LLC operates eight storage tanks with 350,000 barrels capacity, which it bought from La. Jet Corp. Docking facilities and pipeline access are controlled by Koch Petroleum Group, LP on adjacent property. The remains of a refinery still stand a few miles down the road. The Quantum Fuel and Refining Co. facility at Egan, formerly known as U.S. Refining Co., did not produce during this period. Plans are to start up early in 2002 to produce mostly Diesel fuel. Quantum Fuel & Refining in Garyville shut down the refinery part of its plant in 1987. Most of the equipment has been dismantled and the tank farm is now used for storing and blending of No. 6 fuel oil.
10

Previous Previous Contribution REFINERY NAME Operating 12-Month Refinery Refinery to State
Capacity Capacity Throughput Throughput Capacity Throughput Change in(BCD) Change (Barrels) Change Change Change Throughput
American International Refinery, Inc 35,000 0 352,357 797,299 0.00% 226.28% 3.00%Calcasieu Refining Co. 15,300 6,700 5,539,344 1,789,980 43.79% 32.31% 6.75%Calumet Lubricants - Cotton Valley 7,700 800 2,512,484 3,173 10.39% 0.13% 0.01%Calumet Lubricants - Princeton 7,638 -1,090 2,447,335 -255,218 -14.27% -10.43% -0.96%Calumet Lubricants - Shreveport 46,200 -38,200 15,613,605 -15,607,291 -82.68% -99.96% -58.81%Chalmette Refining, LLC 180,500 9,700 64,970,000 4,453,000 5.37% 6.85% 16.78%Citgo Petroleum Corp. 320,000 18,000 113,339,646 3,250,158 5.63% 2.87% 12.25%Conoco, Inc. - Lake Charles 250,000 -14,000 85,068,473 -9,912,826 -5.60% -11.65% -37.35%ExxonMobil Co. USA 470,000 15,000 158,300,500 16,492,400 3.19% 10.42% 62.15%Marathon Ashland Petroleum, LLC 255,000 0 82,682,649 5,681,026 0.00% 6.87% 21.41%Motiva Enterprises, LLC - Convent 225,000 0 84,548,300 -1,889,814 0.00% -2.24% -7.12%Motiva Enterprises, LLC - Norco 235,000 -5,000 82,728,171 194,594 -2.13% 0.24% 0.73%Murphy Oil USA, Inc. 101,000 9,000 33,172,463 5,006,537 8.91% 15.09% 18.87%Orion Refining Corp. 110,000 45,000 26,619,224 19,110,717 40.91% 71.79% 72.01%Phillips Petroleum Co. Belle Chasse 254,500 -4,500 83,840,553 -1,336,553 -1.77% -1.59% -5.04%Placid Refining Co. 49,000 500 17,682,810 296,509 1.02% 1.68% 1.12%Shell Chemical Co. - St. Rose 55,000 -1,000 16,000,000 1,373,002 -1.82% 8.58% 5.17%Valero Refining Co. - La. 78,000 0 23,556,040 -2,909,214 0.00% -12.35% -10.96%Totals 2,694,838 40,910 898,973,954 26,537,479 1.52% 2.95%
Previous Operating Capacity (BCD) and previous 12-month Throughput (Barrels) are from the last DNR refinery survey published November 15 1999. These numbers are compaired with the numbers in the current survey, to determine the change in capacity and Throughput since our last survey.We have also taken a look at the effect of the change in Throughput on the state as a whole.
Operating Refineries Changes in Capacity
Table 1
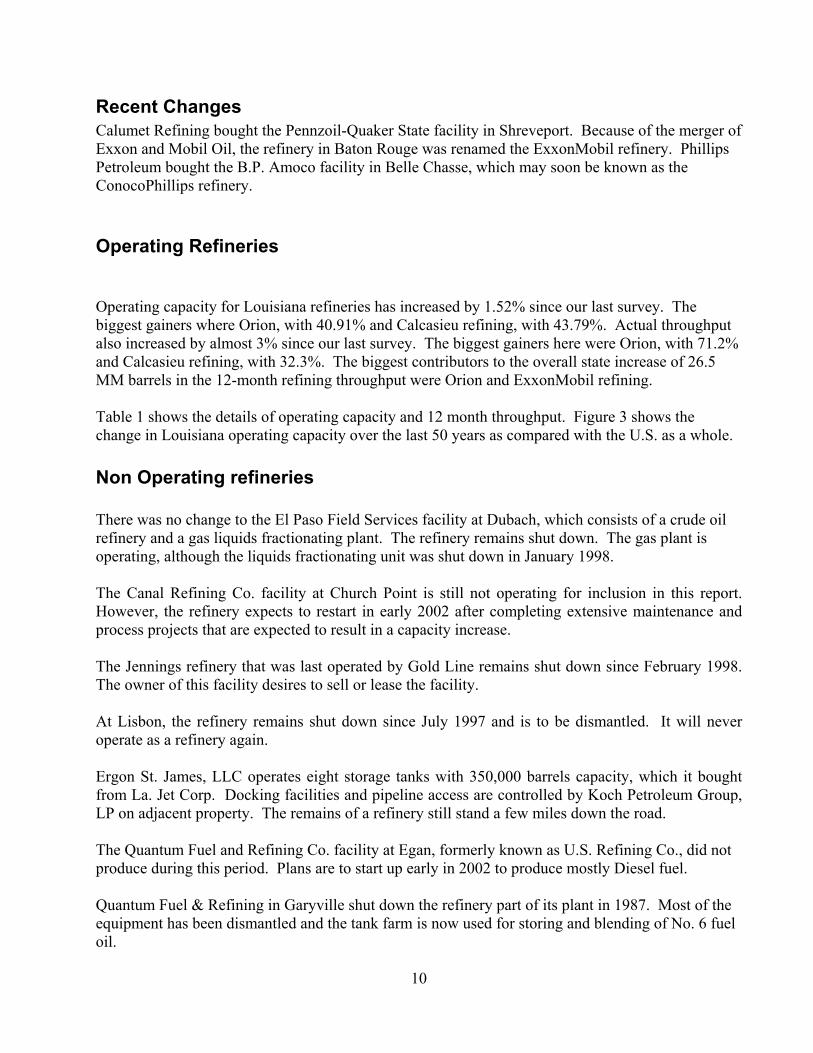
Shepherd Oil Ethanol plant distillation towers, taken in Feb 93
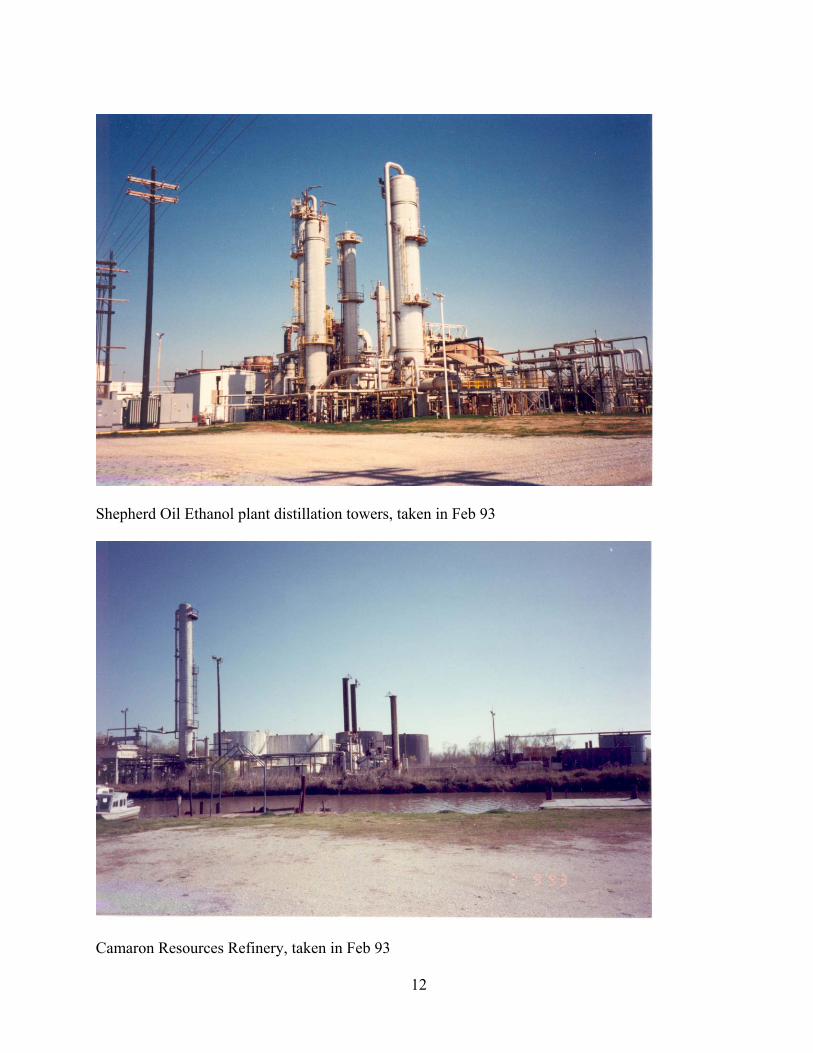
Camaron Resources Refinery, taken in Feb 93
12
Tina Resources, Inc. at Cameron did not respond to the current survey. According to the latest information, which was received over three years ago, the refinery is shut down and up for sale. The identity and location of each of the non-operating refineries is shown on the map of Figure 1. Mailing addresses and contacts are listed in Table 9. Physical locations, last known crude capacity, date last operated, and present status are described in Table 10.
13
Definitions
(For use with this La. Dept. of Natural Resources Refinery Survey) Mostly from: DOE/EIA—109(2001/10), Petroleum Supply Monthly, October 2001
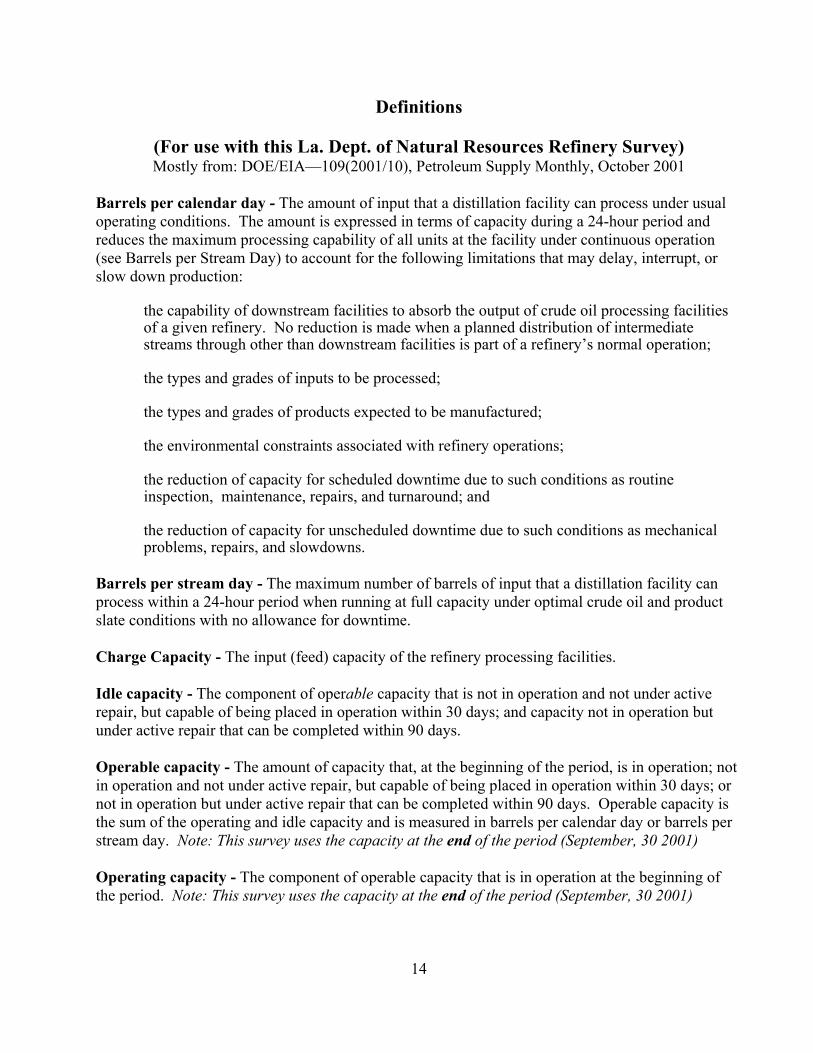
Barrels per calendar day - The amount of input that a distillation facility can process under usual operating conditions. The amount is expressed in terms of capacity during a 24-hour period and reduces the maximum processing capability of all units at the facility under continuous operation (see Barrels per Stream Day) to account for the following limitations that may delay, interrupt, or slow down production:
the capability of downstream facilities to absorb the output of crude oil processing facilities of a given refinery. No reduction is made when a planned distribution of intermediate streams through other than downstream facilities is part of a refinery’s normal operation;
the types and grades of inputs to be processed;
the types and grades of products expected to be manufactured;
the environmental constraints associated with refinery operations;
the reduction of capacity for scheduled downtime due to such conditions as routine inspection, maintenance, repairs, and turnaround; and
the reduction of capacity for unscheduled downtime due to such conditions as mechanical problems, repairs, and slowdowns.
Barrels per stream day - The maximum number of barrels of input that a distillation facility can process within a 24-hour period when running at full capacity under optimal crude oil and product slate conditions with no allowance for downtime. Charge Capacity - The input (feed) capacity of the refinery processing facilities. Idle capacity - The component of operable capacity that is not in operation and not under active repair, but capable of being placed in operation within 30 days; and capacity not in operation but under active repair that can be completed within 90 days. Operable capacity - The amount of capacity that, at the beginning of the period, is in operation; not in operation and not under active repair, but capable of being placed in operation within 30 days; or not in operation but under active repair that can be completed within 90 days. Operable capacity is the sum of the operating and idle capacity and is measured in barrels per calendar day or barrels per stream day. Note: This survey uses the capacity at the end of the period (September, 30 2001) Operating capacity - The component of operable capacity that is in operation at the beginning of the period. Note: This survey uses the capacity at the end of the period (September, 30 2001)
14
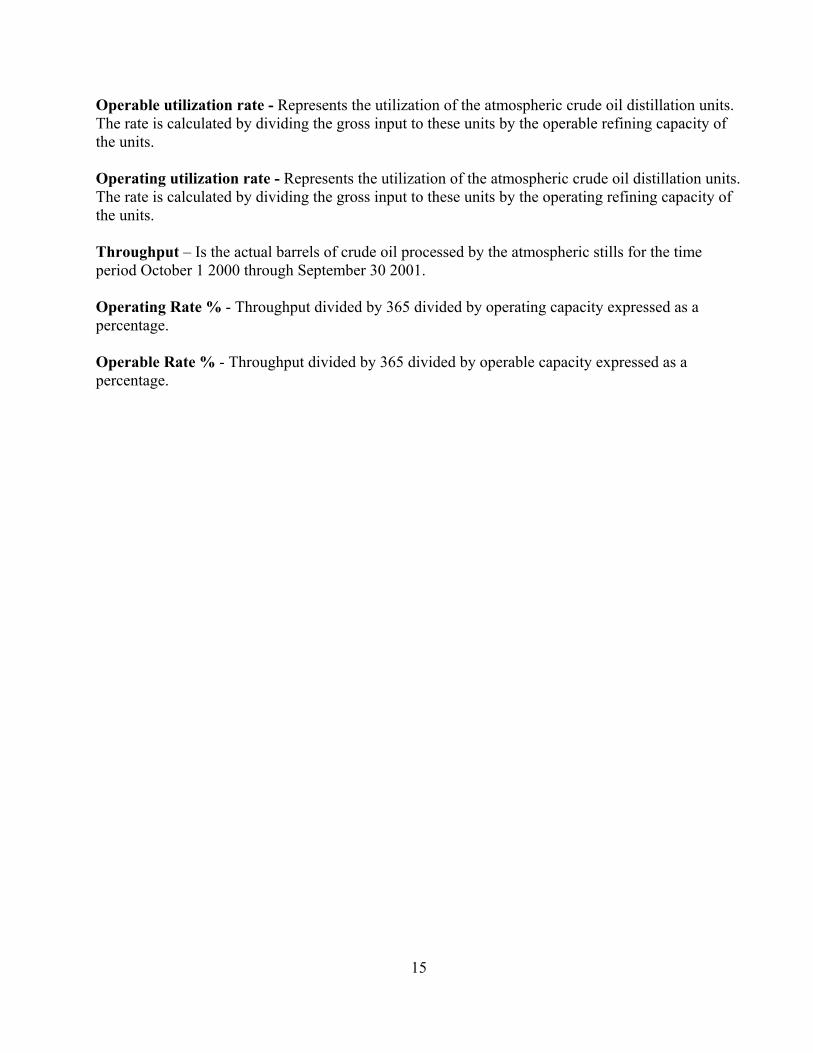
Operable utilization rate - Represents the utilization of the atmospheric crude oil distillation units. The rate is calculated by dividing the gross input to these units by the operable refining capacity of the units. Operating utilization rate - Represents the utilization of the atmospheric crude oil distillation units. The rate is calculated by dividing the gross input to these units by the operating refining capacity of the units. Throughput – Is the actual barrels of crude oil processed by the atmospheric stills for the time period October 1 2000 through September 30 2001. Operating Rate % - Throughput divided by 365 divided by operating capacity expressed as a percentage. Operable Rate % - Throughput divided by 365 divided by operable capacity expressed as a percentage.
15

OPERATING THROUGHPUTREFINERY NAME CAPACITY on October 1 2000
Sept. 30, 2001 - Sept. 30 2001(BCD) (Barrels)
LKC 35,000 9.0 9.0 1,149,656
CLC 22,000 91.3 91.3 7,329,324
CTT 8,500 81.1 2,500 62.7 2,515,657
CLM 6,548 91.7 1,752 72.4 2,192,117
ATL 8,000 0.2 0.2 6,314
TNN 190,200 100.0 100.0 69,423,000
CTS 338,000 94.5 94.5 116,589,804
CNB 236,000 87.2 87.2 75,155,647
EXX 485,000 98.7 98.7 174,792,900
MRT 255,000 94.9 94.9 88,363,675
TXC 225,000 100.6 100.6 82,658,486
SHL 230,000 98.8 98.8 82,922,765
MRP 110,000 95.1 95.1 38,179,000
GDH 155,000 80.8 29,712 67.8 45,729,941
STN 250,000 90.4 90.4 82,504,000
PLC 49,500 99.5 0 99.5 17,979,319
INT 54,000 88.1 88.1 17,373,002
HLL 78,000 72.5 72.5 20,646,826
92.7 91.4TOTAL LA. OPERATING CAPACITY 2,735,748 33,964 925,511,433Footnotes and Definitions are on page 14 and 15
WEIGHTED STATE AVERAGE (%)
Motiva Enterprises, LLC - Convent
Motiva Enterprises, LLC - Norco
Phillips Petroleum Co. - Belle Chasse
Valero Refining Co. - Krotz Spings
Orion Refining Corp. - Norco
Placid Refining Co. - Port Allen
Shell Chemical Co. - St. Rose
TABLE 2LOUISIANA OPERATING REFINERIES
Calumet Lubricants - Shreveport Note 1
Data in this table may differ from data reported elsewhere for a different time period.
Conoco, Inc. - West Lake
ExxonMobil Co. USA - Baton Rouge
Calumet Lubricants - Cotton Valley
Calumet Lubricants - Princeton
DNR FAC.
CODE
OPERATING RATE
%
IDLE CAP. (BCD)
OPERABLE RATE
%
CRUDE CAPACITY (BCD) AND PERCENT PRODUCT SLATEDecember 2001 DNR Survey
16
American International Refinery, Inc. - Lake Charles Note 1
Murphy Oil USA, Inc. - Meraux
Chalmette Refining, LLC - Chalmette
Calcasieu Refining Co. - Lake Charles
Marathon Ashland Petroleum, LLC -Garyville
Citgo Petroleum Corp. - Lake Charles

DNR % OF TOTAL PRODUCT SLATEFAC. GASOLINE OTHER FUELS MISCELLANEOUS OTHER PRODUCTS
CODE MID- ALL JET/ FUEL Residual/ PRODUCT PRODUCT PRODUCT ALL
REG GRADE PREM RFG DIESEL KERO OIL LPGs NAPTH COKE 1 2 3 OTHER
LKC 16.0 13.0 23.0 48.0Feedstock Feedstock HVGO Asphalt
CLC 29.33 15.64 23.86 6.6 23.94
CTT 0.4 58.0 24.6 16.2 0.8Gas Oil Lt. Str. Run Butane
Pentane
CLM 8 2 72.0 18.0Lube Oil Asphalt
ATL 3.1 4.1 42.7 4.7 17.4Lubes Waxes Intermediate
Dist
TNN 38.7 5.77 1 23.95 8.8 1.86 7.0 0.4 11 4.3 0.50Aromatics Sulfur
CTS 29.4 12 4.74 17.59 12 1.9 3.0 15.7 3.7Decant oil Propane/
Propylene LSD & HSD Other
CNB 28 5 1 27 15 2 1 8 11.0 2.0Gas oil Propane/
Propylene
EXX 19.6 5.9 12.6 16.5 10.9 2.7 2.1 1.0 4.1 17.9 2.6 4.1PetChem
Fdstk Gas Oil Lubes/ Waxes
Sulfur, etc. (Note B)
MRT 42.3 6.26 1.46 2.16 18.03 6.76 0.5 10.49 2.55 8.73 0.43 0.4Dry Gas Asphalt Sulfur Alkylate
TXC 35.0 3 5 25 11 13 2 4.0 2.0Fuel Gas Propylene
SHL 37.6 17.74 6.29 16.46 13.28 1.87 0.84 2.25 1.46 0.8 0.1 1.2MTBE Sulphur SRGO
MRP 32 11 29 8 13 2 4.0 1.0Butane Asphaltene
GDH 16 19.78 6.41 4.57 5.29 13.42 10.62 6.7 17.2LCO VGO
STN 26 9.2 28.0 12.5 0.5 4.6 1 3.7 1.7 5.2 3.6(JET) FCC Charge Normal
ButanePetro
chemicals
PLC 45.5 0 2 0 25.2 11.3 0.4 0.4 5.9 3.8 4.0 3.3Subgrade Gasoline
Propylene Ref. Grade Gas Oil Fuel Gas
INT 7.0 13.0 80.0Olefin Plant
Feed
HLL 30.5 1.5 13.3 16.5 0.8 12.1 25.0 0.4VBO Gas Oil
Wtd % 29.1 0.0 7.3 4.3 16.6 11.2 4.9 2.7 1.9 6.1Footnotes and Definitions are on page 14 and 15
LOUISIANA OPERATING REFINERIESCRUDE CAPACITY (BCD) AND PERCENT PRODUCT SLATE
December 2001 DNR SurveyData in this table may differ from data reported elsewhere for a different time period.
TABLE 2 (continued)
17

Product BBLs Produced % of TotalAsphalt 8,660,862 0.936Asphaltene 381,790 0.041HVGO 264,421 0.029Lubes, Waxes 6,125,636 0.662FCC Charge 1,402,568 0.152Intermediate Dist 1,099 0.000LSD & HSD 18,316,258 1.980MTBE 638,505 0.069Lt. Str. Run 407,536 0.044Gas Oil 8,968,560 0.969Decant oil 2,226,865 0.241Subgrade Gasoline 683,214 0.074SRGO 986,781 0.107Alkylate 326,946 0.035Aromatics 2,957,420 0.320Butane Pentane 20,125 0.002Propylene/Propane 7,349,832 0.794Normal Butane 1,527,160 0.165VBO 5,161,707 0.558LCO 3,054,760 0.330VGO 7,874,696 0.851Dry Gas 2,253,274 0.244Fuel Gas 3,899,657 0.421Olefin Plant Feed 13,898,402 1.502Sulfur 826,586 0.089Sulfur, etc. (Note B) 7,166,509 0.775Petrochemicals 4,290,208 0.464Petrochemical Feedstocks 31,287,929 3.381Other 7,307,285 0.790
Totals 148,266,589 16.0237
18
Details of Other Products from Table 2

REFINERY NAME
Operating Idle Operating Idle
LKC
CLC 21,400 0 22,000 0 0 0 0 0 0
CTT 7,800 0 8,500 0 0 0 0 0 0
CLM 8,300 0 8,655 0 7,000 0 0 0 0
ATL 46,200 0 50,000 0 24,300 0 0 0 0
TNN 182,500 0 190,200 0 106,000 0 0 0 0
CTS 316,000 0 333,000 0 84,000 0 0 0 0
CNB 245,000 0 255,000 0 202,000 0 0 0 12,000
EXX 485,000 0 505,000 0 229,500 0 0 0 0
MRT 232,000 0 249,000 0 125,000 0 0 0 0
TXC 225,000 0 235,000 0 119,400 0 0 13,000 0
SHL 228,000 0 240,000 0 80,000 0 0 0 0
MRP 95,000 0 110,000 0 50,000 0 0 0 0
GDH 148,500 0 155,000 0 105,000 0 0 0 0
STN 250,000 0 250,000 0 92,000 25,500 0 0 0
PLC 48,500 0 49,500 0 20,000 0 0 0 0
INT 55,000 0 56,000 0 28,000 0 0 0 0
HLL 78,000 0 80,000 0 31,800 0 0 0 0
2,672,200 0 2,796,855 0 1,304,000 25,500 0 13,000 12,000
Note 21 Not included in DOE source data Table 38Source: Energy Information Administration Petroleum Supply Annual 2000 Vol 1, Table 38 DOE/EIA-0340(2000)/1 June 2001
Placid Refining Co. - Port Allen
Murphy Oil USA, Inc. - Meraux
Orion Refining Corp. - Norco
Calumet Lubricants - Shreveport
Motiva Enterprises, LLC - Norco
DNR FAC.
CODEVacuum
Distillation
Calcasieu Refining Co. - Lake CharlesCalumet Lubricants - Cotton ValleyCalumet Lubricants Princeton
Chalmette Refining, LLC - ChalmetteCitgo Petroleum Corp. - Lake Charles
Vis- Breaking
Other/ Gas Oil
Thermal Cracking
Delayed Coking
Fluid Coking
Conoco, Inc. - West Lake
19
LOUISIANA TOTALS
Shell Chemical Co. - St. Rose
Valero Refining Co. - Krotz Springs
Marathon Ashland Petroleum, LLC - GaryvilleMotiva Enterprises, LLC - Convent
Phillips Petroleum Co. Belle Chasse
ExxonMobil Co. USA - Baton Rouge
Atmospheric Crude Oil Distillation Barrels per
Calender Day
American International Refinery, Inc. - Lake Charles Note 21
TABLE 3U.S. DEPARTMENT OF ENERGY
CAPACITY OF LOUISIANA OPERABLE PETROLEUM REFINERIES AS OF January, 1 2001(Barrels per Stream Day, Except Where Noted)
Downstream Charge CapacityBarrels per Stream Day

LKC
CLC 0 0 0 0 0 0 0 0 0 0
CTT 0 0 0 0 0 0 3,600 0 0 0
CLM 0 0 0 0 0 0 0 0 8,500 0
ATL 3,500 7,000 0 10,000 0 8,900 10,000 10,000 1,200 0
TNN 71,600 0 20,000 18,900 29,400 45,000 40,000 29,900 0 0
CTS 142,000 0 42,000 98,000 18,000 72,000 124,000 34,500 44,300 0
CNB 51,000 0 28,000 48,000 0 0 52,700 136,500 13,000 0
EXX 232,000 0 25,000 72,000 0 0 152,000 90,000 69,800 0
MRT 115,000 0 0 48,000 0 101,000 50,000 65,000 0 36,000
TXC 92,000 0 52,000 0 40,000 27,600 41,000 100,800 0 0
SHL 112,000 0 34,000 40,000 22,000 0 38,500 45,000 0 0
MRP 38,000 0 0 18,000 0 27,500 22,000 15,000 0 0
GDH 80,000 0 0 0 0 32,000 35,000 37,000 10,000 0
STN 100,000 2,000 0 0 44,600 0 48,000 71,000 0 0
PLC 19,000 2,000 0 10,000 0 0 12,000 0 0 5,000
INT 0 0 0 0 0 0 0 0 0 0
HLL 31,700 0 0 0 13,000 0 14,000 0 0 0
1,087,800 11,000 201,000 362,900 167,000 314,000 642,800 634,700 146,800 41,000
TABLE 3 (Continued)U.S. DEPARTMENT OF ENERGY
CAPACITY OF LOUISIANA OPERABLE PETROLEUM REFINERIES AS OF January 1, 2001(Barrels per Stream Day, Except Where Noted)
Fuel Solvents
DeaphaltingCatalytic
Hyrocracking
Downstream Charge Capacity (Continued)Catalytic Hydrotreating
Heavy Gas Oil
Naphtha Reformer Feed Distillate
Other Residual
Catalytic Reforming
Fresh
DNR FAC.
CODE Low Pressure
High Pressuer
Catalytic Cracking
Recycled
20

REFINERY NAME
LKC
CLC 0 0 0 1,200 0 0 0 0 0
CTT
CLM 0 0 2,000 0 0 7,000 0 5 3
ATL 4,500 0 600 4,200 0 9,100 0 6 33
TNN 13,100 10,200 0 10,000 10,000 0 11,000 0 505
CTS 22,000 4,000 0 0 28,000 9,600 24,000 0 640
CNB 8,000 0 0 0 0 1,800 18,250 0 810
EXX 35,900 0 0 0 0 16,000 27,042 24 744
MRT 31,000 0 42,000 23,000 20,000 0 0 0 526
TXC 16,500 0 0 0 12,500 0 0 63 728
SHL 164,000 0 0 0 0 0 1,000 60 165
MRP 8,500 0 18,000 0 0 0 0 0 70
GDH 12,800 0 0 0 0 0 21,000 0 410
STN 38,000 12,300 0 0 0 0 5,289 1 125
PLC 40,000 0 0 0 0 0 0 0 8
INT
HLL 0 0 0 2,700 800 0 0 0 10
394,300 26,500 62,600 41,100 71,300 43,500 107,581 159 4,777MMcfd = Million cubic feet per dayNote 31 Not included in DOE source data Table 39Source: Energy Information Administration Petroleum Supply Annual 2000 Vol 1, Table 39 DOE/EIA-0340(2000)/1 June 2001
TABLE 4
Sulfur (short tons per day)
U.S. DEPARTMENT OF ENERGYPRODUCTION CAPACITY OF LOUISIANA OPERABLE PETROLEUM REFINERIES AS OF January 1 2001
(Barrels per Stream Day)Production Capacity
Alkylates Aromaics
Asphalt and Road
Oil Isobutane
Shell Chemical Co. - St. Rose Note 31Valero Refining Co. - Krotz Springs
Conoco, Inc. - West Lake
ExxonMobil Co. USA - Baton RougeMarathon Ashland Petroleum, LLC - GaryvilleMotiva Enterprises, LLC - Convent
Orion Refining Corp. - Norco
Phillips Petroleum Co. Belle Chasse
Hydrogen (MMcfd)
Placid Refining Co. - Port Allen
Calumet Lubricants - PrincetonCalumet Lubricants - Shreveport
Isopentane and
Isohexane
Isomers
Lubricants
Marketable Petroleum
Cale
21
Chalmette Refining, LLC - ChalmetteCitgo Petroleum Corp. - Lake Charles
DNR FAC.
CODE
American International Refinery, Inc. - Lake Charles Note 31Calcasieu Refining Co. - Lake CharlesCalumet Lubricants - Cotton Valley Note 31
LOUISIANA TOTALS
Motiva Enterprises, LLC - NorcoMurphy Oil USA, Inc. - Meraux

LKC 30,000 15,000
Calcasieu Refining Co. - Lake Charles CLC 15,680
CTT 8,500 134,000
CLM 9,500 8,500 48,000
ATL 15,000 10,000 C47,200 131,100
Canal Refining Co. - Church Point CNL 30,000 6,000 16,000 16,000 16,000TNN 182,500 102,000 231,500 168,000 128,000 C118,500 139,500
318,000 29,00055,500
Cit-Con - Lake Charles 36,100CTS 321,100 79,800 288,200 1126,000 145,900 C134,200 1103,500
357,600 26,300422,950532,400864,800
CNB 245,000 163,000 265,000 111,300 148,000 345,200 C329,000 146,700211,20033,600
737,800848,500
EXX 488,500 220,500 2107,000 1221,500 272,000 C123,000 1103,000785,500
1122,5001248,5001344,000
MRT 232,000 118,800 1104,500 342,800 143,70049,400
888,400TXC 225,000 100,000 212,000 185,000 136,000 C245,000 140,000
425,000563,000834,000
SHL 220,000 78,000 221,300 1105,000 119,100 C131,500 138,000238,200 535,300
MRP 95,000 47,500 134,200 119,80013,500
1324,750GDH 155,000 124,000 275,000 185,000 112,000 130,000
730,00030,000
STN 250,000 92,000 225,200 1104,000 142,000 247,000430,000735,000
PLC 48,000 20,000 119,000 19,700 29,700712,000
Shell Chemical Co. - St. Rose INT 55,000 29,000HLL 78,000 29,500 131,000 113,000 114,000
23,2502,703,780 1,279,700 413,200 23,300 1,031,200 485,500 202,400 1,562,150
Legend to numbers in table are on page 24
Orion Refining Corp. - Norco
Catalytic Reforming
Cat Hydro-cracking
Calumet Lubricants - Princeton
Calumet Lubricants - Shreveport
Chalmette Refining, LLC - Chalmette
Citgo Petroleum Corp. - Lake Charles
Motiva Enterprises, LLC - Norco
Murphy Oil USA, Inc. - Meraux
Cat Hydro-treating
Charge Capacity, Barrels per Calendar DayREFINERY NAME
Table 5OIL AND GAS JOURNAL 2001 WORLDWIDE REFINERY SURVEY
Capacities of Louisiana refineries as of January 1, 2002Reprinted with permission. Oil and Gas Journal , Vol 99, No. 52, December 24, 2001: pp 117 118
Vacuum Distillation Coking
22
Thermal Operation
Conoco, Inc. - West Lake
Phillips Petroleum Co. Belle Chasse
Motiva Enterprises, LLC - Convent
Marathon Ashland Petroleum, LLC - Garyville
ExxonMobil Co. USA - Baton Rouge
DNR FAC.
CODEAmerican International Refinery, Inc. - Lake Charles
Calumet Lubricants - Cotton Valley
Catalytic Cracking
Placid Refining Co. - Port Allen
Valero Refining Co. - Krotz Springs
LOUISIANA TOTALS
Crude

Table 5 (Continued)OIL AND GAS JOURNAL 2001 WORLDWIDE REFINERY SURVEY
Capacities of Louisiana refineries as of January 1, 2002
Production Capacity, Barrels per Calendar Day
Aromatics Isomerization Lubes OxygenatesAlkylationHydrogen (MMcfd)Pol./Dim. Asphalt
DNR FAC. COD
Coke Sulfur
LKC 880
CLCCTT a12.5
42.5
CLM 7,000 a14.5 344.5
ATL 7,000 a16.1 1546.1
TNN 212,500 110,000 39,500 45.0 2,050 695
8,550CTS 120,700 16,480 328,800 13,150 a153.0 3,600 617
34,140 612.0
CNB 8,500 4110.0 3,800 363
EXX 135,000 19,000 16,000 17,000 412.0 5,000 675612.0
MRT 228,500 121,900 460 39,900317,100
TXC 113,050 23,600 311,250 12,250 a358.0 70032,500
SHL 114,800 17,500 149.4 900 140
MRP 27,650 120
GDH 4,110 290
STN 238,000 112,400 710.4 800 7025,400
PLC 23,800 28
INTHLL 12,100 33,000
Totals 174,000 14,700 34,280 91,550 47,050 26,540 348 20,260 4,176 40,780Legend to numbers in table are on page 24
(tonnes per day)Aromatics Isomerization Lubes OxygenatesAlkylationHydrogen (MMcfd)Pol./Dim. Asphalt
23
DNR FAC. COD

LEGEND - Numbers identify processes in table 5 Coking 1. Fluid coking 2. Delayed coking 3. Other Thermal Processes 1. Thermal cracking 2. Visbreaking Catalytic Cracking 1. Fluid 2. Other Catalytic Reforming 1. Semiregenerative 2. Cyclic 3. Continuous regen. 4. Other Catalytic Hydrocracking 1. Distillate upgrading 2. Residual upgrading 3. Lube oil manufacturing 4. Other c. Conventional (high-pressure) hydrocracking: (>100 barg or 1,450 psig) m. Mild to moderate hydrocracking: (<100 barg or 1,450 psig) Catalytic Hydrorefining 1. Residual desulfurization 2. Heavy gas oil desulfurization 3. Catalytic cracker and cycle stock treatment 4. Mid distillate 5. Other Catalytic Hydrotreating 1. Pretreating cat reformer feeds 2. Naptha desulfurizing 3. Naptha olefin or aromatics saturation 4. Straight-run distillate 5. Pretreating cat cracker feeds 6. Other distillates 7. Lube oil “polishing” 8. Other Alkylation 1. Sulfuric acid 2. Hydrofluoric acid Polymerization/Dimerization 1. Polymerization 2. Dimerization Aromatics 1. BTX 2. Hydrodealkylation 3. Cyclohexane 4. Cumene Isomerization 1. C4 feed 2. C5 feed 3. C5 and C6 feed Oxygenates 1. MTBE 2. ETBE 3. TAME 4. Other Hydrogen Production: 1. Steam methane reforming
2. Steam naptha reforming 3. Partial oxidation a. Third-party plant Recovery: 4. Pressure swing adsorption 5. Cryogenic 6. Membrane 7. Other FOOTNOTES Capacity expressed in barrels per calendar day (b/cd) is the maximum number of barrels of input that can be processed during a 24-hr period, after making allowances for the following: I. Types and grades of inputs to be processed. II. Types and grades of products to be manufactured. III. Environmental constraints associated with refinery
operations. IV. Scheduled downtime such as mechanical problems,
repairs, and slowdowns. Capacity expressed in barrels per stream day (b/sd) is the amount a unit can process when running at full capacity under optimal feedstock and product slate conditions. Most U.S. capacity figures have historically been reported in b/sd, but all capacities are reported in b/cd here, as they will be in following years. Totals When an asterisk (*) appears beside a refinery locaiton, this indicates that the figure has been converted from b/sd to b/cd by using the conversion factor 0.95 for crude oil and vacuum distillation units, and 0.90 for all downstream cracking and conversion units. Refining processes not covered are noted here. Process definitions V. Hydrocracking includes processes where 50% of the feed
or more is reduced in molecular size. VI. Hydrorefining includes processes where 10% of the feed
or less is reduced in molecular size. VII. Hydrotreating includes processes where essentially no
reduction in the molecular size of the feed occurs. VIII. Hydrogen volumes presented here represent either
generation or upgrading to 90+% purity. Catalytic reforming definitions IX. Semiregenerative reforming is characterized by shutdown
of the reforming unit at specified intervals, or at the operator’s convenience, for in situ catalyst regeneration.
X. Cyclic regeneration reforming is characterized by continuous or continual regeneration of catalyst in situ in any one of several reactors that can be isolated from and returned to the reforming operation. This is accomplished without changing feed rate or octane.
XI. Continuous regeneration reforming is characterized by the continuous regeneration of part of the catalyst in a special regenerator, followed by continuous addition of this regenerated catalyst to the reactor.
XII. Other includes nonregenerative reforming (catalyst is replaced by fresh catalyst) and moving-bed catalyst systems.
MMcfd - Million cubic feet per day mt/d - Metric tons per day
24

Figure 4Operating Rates (%)
of Louisiana, Taxas Gulf Coast, and all US Refineries
25
85
87
89
91
93
95
97
99
101
103
105
Sep-89
Sep-90
Sep-91
Sep-92
Sep-93
Sep-94
Sep-95
Sep-96
Sep-97
Sep-98
Sep-99
Sep-00
Sep-01
LouisianaAll U.S.TX Gulf Coast
DNR Technoplogy Assessment Division

Figure 5Production of LA and US Refineries
26
0
2
4
6
8
10
12
14
16
18
20
1947 1957 1967 1977 1987 19970
0.5
1
1.5
2
2.5
3
US TotalLouisiana
DNR Technology Assessment Division
US Refineries
LA Refineries
Million barrels per calender day

Figure 6
Louisiana Oil Production and Refinery Operable Capacity
27
0
200
400
600
800
1,000
1,200
1900 10 20 30 40 50 60 70 80 90 2000 10 20 30
Millions Bls/Yr
LA Refinery CapacityLA Crude Production
28
Total Refinery Throughput Total from all SourcesSource: LA DNR Database, from Refiner's Monthly Report Form R-3 (Calender Year Basis)
Figure 7
Crude Oil Sources for Louisiana Refineries
0
100
200
300
400
500
1981 1986 1991 1996 2001
Millions Bbls/Yr
Foreign
LA OCS
Louisiana
Other States
DNR Technology Assessment Division
500
600
700
800
900
Total Crude Processed

LOUISIANA FEDERAL OCS
OTHER STATES FOREIGN
American Intl.Calcasieu 100.0 0.0 0.0 0.0Calumet-Cotton Valley 93.3 0.0 5.7 1.0Calumet-Princeton 100.0 0.0 0.0 0.0Calumet-Shreveport 16.0 0.0 43.5 40.4Chalmette Refining LLC 2.2 45.0 0.0 52.8Citgo Petroleum 9.3 0.0 20.2 70.4Conoco 25.2 0.0 6.5 68.3ExxonMobil USA 0.0 46.2 3.2 50.6Marathon 0.0 28.8 0.0 71.2Motiva Convent 0.0 0.1 0.0 99.9Motiva Norco 60.3 0.0 0.0 39.7Murphy Oil 0.0 7.2 0.0 92.8Orion Refining Corp. 5.0 0.0 0.3 94.7Phillips Petroleum Co. 40.3 32.9 0.0 26.8Placid Refining Co. 76.9 23.1 0.0 0.0Shell Chemical 49.5 0.0 15.7 34.8Valero Ref. 97.4 0.0 2.6 0.0
FY01 Data calculated from DNR SONRIS/2000 R-3 reports (except American I
NOTE: American International DNR database has no data for that facility.
Table 6FY 2001 Crude Oil Input % by Source and Refinery
(Data for Fig 6)

FY 2001 Crude Oil Input % by Source and RefineryFigure 8
30
Sorted by Source
% From LOUISIANA
0.0 20.0 40.0 60.0 80.0 100.0
Calcasieu
Calumet-Princeton
Valero Ref.
Calumet-Cotton Valley
Placid Refining Co.
Motiva Norco
Shell Chemical
Phillips Petroleum Co.
Conoco
Calumet-Shreveport
Citgo Petroleum
Orion Refining Corp.
Chalmette Refining LLC
American Intl.
Murphy Oil
ExxonMobil USA
Marathon
Motiva Convent
% From FEDERAL OCS
0.0 20.0 40.0 60.0 80.0 100.0
ExxonMobil USA
Chalmette Refining LLC
Phillips Petroleum Co.
Marathon
Placid Refining Co.
Murphy Oil
Motiva Convent
Calcasieu
Valero Ref.
Calumet-Cotton Valley
Motiva Norco
Shell Chemical
Calumet-Princeton
Conoco
Citgo Petroleum
Calumet-Shreveport
American Intl.
Orion Refining Corp.
% From OTHER STATES
0.0 20.0 40.0 60.0 80.0 100.0
Calumet-Shreveport
Citgo Petroleum
Shell Chemical
Conoco
Calumet-Cotton Valley
ExxonMobil USA
Valero Ref.
Orion Refining Corp.
Calcasieu
Motiva Norco
Calumet-Princeton
Placid Refining Co.
Phillips Petroleum Co.
American Intl.
Chalmette Refining LLC
Murphy Oil
Marathon
Motiva Convent
% From FOREIGN
0.0 20.0 40.0 60.0 80.0 100.0
Motiva Convent
Orion Refining Corp.
Murphy Oil
Marathon
Citgo Petroleum
Conoco
Chalmette Refining LLC
ExxonMobil USA
Calumet-Shreveport
Motiva Norco
Shell Chemical
Phillips Petroleum Co.
Calumet-Cotton Valley
Calcasieu
Valero Ref.
Calumet-Princeton
Placid Refining Co.
American Intl.

From O&GJ Database report E78USGC@OGJ
Figure 9Gulf Coast Refinery Margins
Regional Average Cash Operating Margin
31
-2
-1
0
1
2
3
4
5
1978 1980 1982 1984 1986 1988 1990 1992 1994 1996 1998 2000
Dollars per Barrel
Wright KillenMuse, Stancil
2002

Company Name Mailing Address Contacts * TelephoneAmerican International Refinery, IncPO Drawer 16866 Mr. Allen Lyons (337) 439 4066
Lake Charles, LA 70616 Mr. Larry Nicholson
Calcasieu Refinery 4359 W. Tank Farm Rd. Mr. Dennis Lawson (337) 478 2130Lake Charles, LA 70605 Mr. Rod Nelson
Ms. Toni BennettCalumet Lubricants PO Box 97 Mr. Rodney Butts (318) 832 4236
Cotton Valley, LA 71018 Mr. Jeff LangMr. Rodney Butts
Calumet Lubricants 10234 La Hwy. 157 Mr. Jerry Arnold (318) 949 2421Princeton, LA 71067-9172
Calumet Lubricants PO Box 3099 Ms. Sharon Stine (318) 632 4198Shreveport, LA 71133 Mr. Kevin Farley
Mr. Dan McKibbenChalmette Refining, LLC PO Box 1007 Mr. Toby Coy (504) 281 1624
Chalmette, LA 70044
Citgo Petroleum Corp. PO Box 1562 Ms. Regina Jenkins (337) 708 8880Lake Charles, LA 70602 Mr. Al Prebula
Mr. Joel KiefferConoco PO Box 37 Mr. Gary Hunczak (337) 491 5822
Westlake, LA 70669 Mr. Fred StiersMr. Mark Noble
ExxonMobil Refining and Supply CoPO Box 551 Ms. Barbara Beckman (225) 977 8393Baton Rouge, LA 70821 Mr. Tom Moeller
Mr. Mark NorthcuttMarathon Ashland Petroleum LLC PO Box AC Mr. Junius McCants (985) 535 2241
Garyville, LA 70051-0842 Mr. Rich BedellMr. Bill Kepner
Motiva Enterprises LLC PO Box 37 Mr. Gary Miller (225) 562 7681Convent, LA 70723 Mr. Armand Abay
Mr. Kenneth McAuliffeMotiva Enterprises LLC PO Box 10 Mr. Gary Bono (985) 465 7476
Norco, LA 70079 Mr. Allen KirkleyMr. Jack Williams
Murphy Oil PO Box 100 Mr. Mike McKee (504) 278 5299Meraux, LA 70075-0100 Mr. Jim Kowitz
Mr. David MendrekOrion Refining Corp. PO Box 537 Ms. Michelle Smith (985) 764 8611
Norco, LA 70079 Mr. Eric BluthMr. Troy Champeaux
Philips Petroleum Co. PO Box 176 Mr. Ray Rigdon (504) 656 3249Bell Chasse, LA 70037-0176 Mr. John Ponticello
Placid Refining Co. 1940 La Hwy 1 NorthPort Allen, LA 70767 Mr. Gary Fuller (225) 346 7464
Shell Chemical Co. / St. Rose PO Box 10Norco, LA 70079 Mr. Dave Brignac
Mr. Tom Brumfield (504) 465 7125Valero Refining Co. - La. PO Box 453 Mr. Kevin Roy (318) 566 0114
Krotz Springs, LA 70750 0453Mr. Ralph YoungbloodMr. Gregg Byers
* Contacts are listed in order as: Contact person, Plant Manager, Plant Engineer
Louisiana Operating RefineriesTable 7
32

Company Name Physical LocationAmerican International Refinery, Inc. Lake Charles, I-10 exit 36,
north to La. 3059, left 3/4 mi.
Calcasieu Refinery Lake Charles, 3 mi. south at west endof Old Tank Farm Road on Ship Canal.
Calumet Lubricants Cotton Valley, east side ofLa. 7 South at city limits.
Calumet Lubricants Princeton, 5 mi. north of I-20on east side of La. 157.
Calumet Lubricants Shreveport, 3333 Midway Ave.,Across I-20 from State fairgrounds.
Chalmette Refining, LLC Chalmette500 W. St. Bernard Hwy.
Citgo Petroleum Corp. Lake Charles, I-10 exit 23,then 2 mi. south on La. 108.
Conoco Westlake, I-10 Sampson Rd. exit;north to Old Spanish Trail.
ExxonMobil Refining and Supply Co. Baton Rouge,4045 Scenic Hwy.
Marathon Ashland Petroleum LLC Garyville, 2 mi. toward Reserveoff of U.S. 61.
Motiva Enterprises LLC Convent, on La. 44 at east bankfoot of Sunshine bridge.
Motiva Enterprises LLC NorcoRiver Road in Norco.
Murphy Oil Meraux2500 St. Bernard Hwy.
Orion Refining Corp. Norco, 257 Prospect Ave.
Philips Petroleum Co. Belle Chasse, 12 mi. southon east side of La. 23.
Placid Refining Co. Port Allen1940 La. 1 North.
Shell Chemical Co. / St. Rose St. Rose11842 River Rd.
Valero Refining Co. - La. Krotz SpringsLa. 105 South in town.
Table 8Louisiana Operating Refinery Locations
33
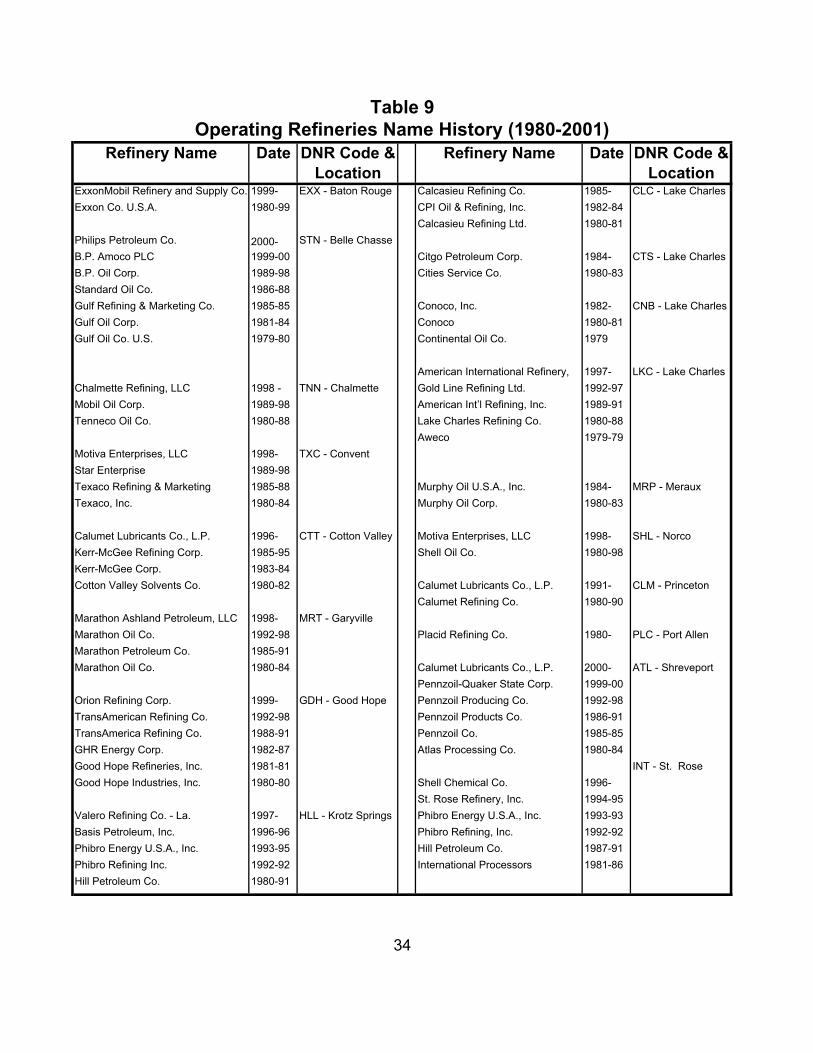
Refinery Name Date DNR Code & Location
Refinery Name Date DNR Code & Location
ExxonMobil Refinery and Supply Co. 1999- EXX - Baton Rouge Calcasieu Refining Co. 1985- CLC - Lake CharlesExxon Co. U.S.A. 1980-99 CPI Oil & Refining, Inc. 1982-84
Calcasieu Refining Ltd. 1980-81Philips Petroleum Co. 2000- STN - Belle ChasseB.P. Amoco PLC 1999-00 Citgo Petroleum Corp. 1984- CTS - Lake CharlesB.P. Oil Corp. 1989-98 Cities Service Co. 1980-83Standard Oil Co. 1986-88Gulf Refining & Marketing Co. 1985-85 Conoco, Inc. 1982- CNB - Lake CharlesGulf Oil Corp. 1981-84 Conoco 1980-81Gulf Oil Co. U.S. 1979-80 Continental Oil Co. 1979
American International Refinery, 1997- LKC - Lake CharlesChalmette Refining, LLC 1998 - TNN - Chalmette Gold Line Refining Ltd. 1992-97Mobil Oil Corp. 1989-98 American Int’l Refining, Inc. 1989-91Tenneco Oil Co. 1980-88 Lake Charles Refining Co. 1980-88
Aweco 1979-79Motiva Enterprises, LLC 1998- TXC - ConventStar Enterprise 1989-98Texaco Refining & Marketing 1985-88 Murphy Oil U.S.A., Inc. 1984- MRP - MerauxTexaco, Inc. 1980-84 Murphy Oil Corp. 1980-83
Calumet Lubricants Co., L.P. 1996- CTT - Cotton Valley Motiva Enterprises, LLC 1998- SHL - NorcoKerr-McGee Refining Corp. 1985-95 Shell Oil Co. 1980-98Kerr-McGee Corp. 1983-84Cotton Valley Solvents Co. 1980-82 Calumet Lubricants Co., L.P. 1991- CLM - Princeton
Calumet Refining Co. 1980-90Marathon Ashland Petroleum, LLC 1998- MRT - GaryvilleMarathon Oil Co. 1992-98 Placid Refining Co. 1980- PLC - Port AllenMarathon Petroleum Co. 1985-91Marathon Oil Co. 1980-84 Calumet Lubricants Co., L.P. 2000- ATL - Shreveport
Pennzoil-Quaker State Corp. 1999-00Orion Refining Corp. 1999- GDH - Good Hope Pennzoil Producing Co. 1992-98TransAmerican Refining Co. 1992-98 Pennzoil Products Co. 1986-91TransAmerica Refining Co. 1988-91 Pennzoil Co. 1985-85GHR Energy Corp. 1982-87 Atlas Processing Co. 1980-84Good Hope Refineries, Inc. 1981-81 INT - St. RoseGood Hope Industries, Inc. 1980-80 Shell Chemical Co. 1996-
St. Rose Refinery, Inc. 1994-95Valero Refining Co. - La. 1997- HLL - Krotz Springs Phibro Energy U.S.A., Inc. 1993-93Basis Petroleum, Inc. 1996-96 Phibro Refining, Inc. 1992-92Phibro Energy U.S.A., Inc. 1993-95 Hill Petroleum Co. 1987-91Phibro Refining Inc. 1992-92 International Processors 1981-86Hill Petroleum Co. 1980-91
Table 9Operating Refineries Name History (1980-2001)
34

Company Name Mailing Address Contacts TelephoneBayou State Oil Corp. Po Box 7886 Mr. Ellis E. Brown, Sr. (318) 222 0737
Shreveport, LA 71137
Canal Refining PO Box 8 Mr. Bob McKee (337) 824 2500Church Point, LA 70525
Ergon St. James Co. PO Box 318 Mr. Ronald Ardoine (225) 265 8020St. James, LA 70086
Gold Line Refining, Ltd. 11 Greenway Plaza Ste 2602 Mr. Earl Thomas (713) 271 3550Houston TX 77046
Quantum Fuel & Refining Po Box 136 Mr. James Hughes (409) 397 9093Newton, TX 75966
Tina Resources, Inc. 207 Firestone Dr. Mr. Leslie Vance (512) 463 2123Marble Falls, TX 78654
El Paso Field Services 400 Travis Street Ste 1100 Mr. Martin Anthony (318) 777 4000Shreveport, LA 71101
Lisbon Refinery J.V., LLC 8613 East Wilderness Way Mr. James Ballengee (318) 469 3084Shreveport, LA 71106
Petroleum Fuel and Terminal PO Box T Mr. Claude Phelps (985) 535 6256Garyville, LA 70051
Table 10Non Operating Refineries
35
Non Operable Refineries

Bayou State Oil Corp. Hosston, U.S. 71 North at junction with La. 2 West.
3,000 Feb-87 No plans to reopen. Some equipment sold, but process equipment remains operable.
Canal Refining Co. Church Point, 2 mi. north on left side of La. 178
7,500 May-97 Expecting to restart early 2002 with increased capacity, processing La. crude.
El Paso Field Services Dubach Location
Dubach, 1/4 mi. west of U.S. 167 at south city limits.
10,000 Jun-93 Facility consists of a crude oil refinery and gas liquids fractionating plant. El Paso continues to operate the gas plant but shut down the liquids fractionating unit in January 1998.
Gold Line Refining Co. Ltd. Jennings Refinery
3-1/2 mi. east of jct. U.S. 90E & La. 102 in Jennings. On Mermentau River 1 mile north of U.S. 90E at end of gravel road.
14,800 Feb-98 Owner is attempting to sell or lease the facility.
Lisbon Refinery J.V., LLC Lisbon, 3 mi. east on south side of La. 2.
12,500 Jan-96 150,000 barrels storage useable. Refinery to be dismanteled.
Petroleum Fuel & Terminal Co.
Mt. Airy, exit Gramercy on La.20 to La.44 (River Road) junction. Left 2 miles.
23,000 Dec-86 Terminal only in use. Actively pursuing the sale of all refinery process equipment so site can be used to expand terminal.
Ergon St. James Co., LLC St. James, 7-1/2 miles south of Sunshine Bridge on La.18.
20,000 Aug-83 Eight storage tanks in good shape, approximately 350,000 barrels capacity. Koch Petroleum Group controls docks & pipeline access on adjacent property.
Tina Resources, Inc. Cameron Parish. Talen's Landing on Intracoastal Waterway 9 miles south of jct. La. 14 & 26 in Lake Arthur via La. 14.
7,400 Feb-86 No response to last three surveys. Last status received was that the refinery was for sale.
Quantum Fuel & Refining Egan Refinery
Egan, 101 Old Ferry Road. Take I-10 exit 72; then 2 miles south on Old Ferry Rd.
10,000 Sep-87 Start up early 2002 12,000 bpd Diesel. Site includes 500,000 barrel storage capacity.
36
STATUS
Table 11Louisiana Non-Operating refineries
NAME PHYSICAL LOCATION
LAST KNOWN OPERATING CAPACITY
DATE LAST OPERATED
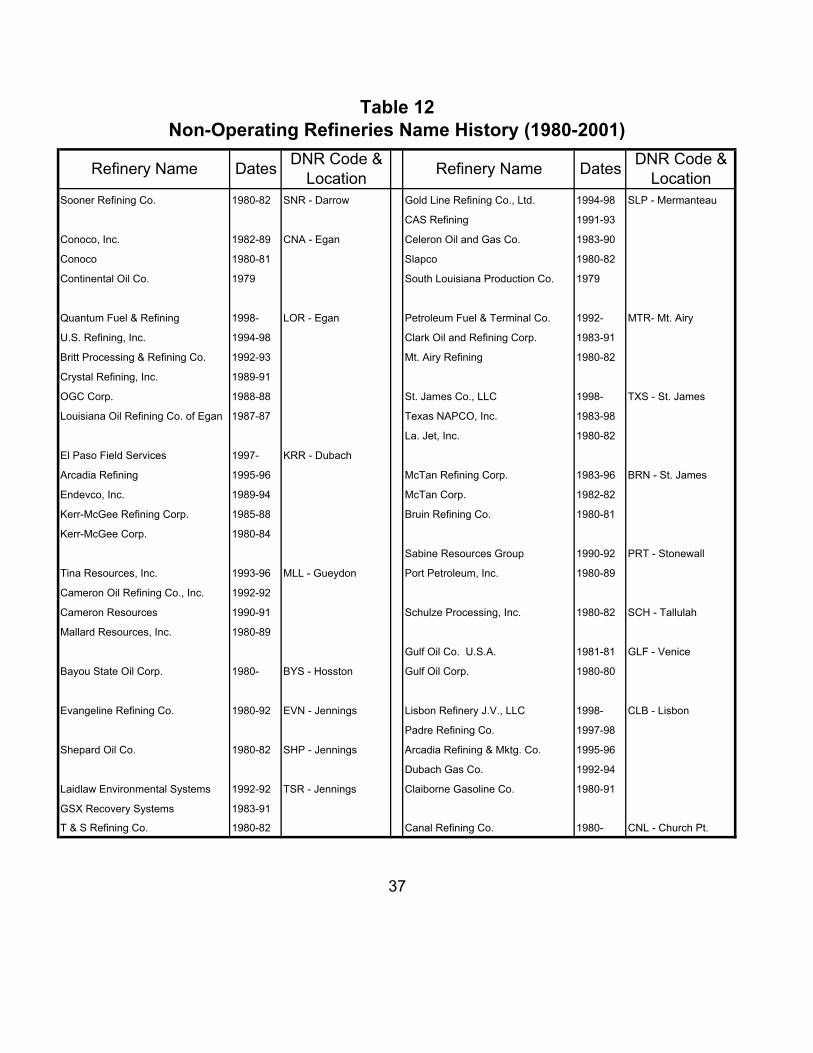
Sooner Refining Co. 1980-82 SNR - Darrow Gold Line Refining Co., Ltd. 1994-98 SLP - Mermanteau
CAS Refining 1991-93
Conoco, Inc. 1982-89 CNA - Egan Celeron Oil and Gas Co. 1983-90
Conoco 1980-81 Slapco 1980-82
Continental Oil Co. 1979 South Louisiana Production Co. 1979
Quantum Fuel & Refining 1998- LOR - Egan Petroleum Fuel & Terminal Co. 1992- MTR- Mt. Airy
U.S. Refining, Inc. 1994-98 Clark Oil and Refining Corp. 1983-91
Britt Processing & Refining Co. 1992-93 Mt. Airy Refining 1980-82
Crystal Refining, Inc. 1989-91
OGC Corp. 1988-88 St. James Co., LLC 1998- TXS - St. James
Louisiana Oil Refining Co. of Egan 1987-87 Texas NAPCO, Inc. 1983-98
La. Jet, Inc. 1980-82
El Paso Field Services 1997- KRR - Dubach
Arcadia Refining 1995-96 McTan Refining Corp. 1983-96 BRN - St. James
Endevco, Inc. 1989-94 McTan Corp. 1982-82
Kerr-McGee Refining Corp. 1985-88 Bruin Refining Co. 1980-81
Kerr-McGee Corp. 1980-84
Sabine Resources Group 1990-92 PRT - Stonewall
Tina Resources, Inc. 1993-96 MLL - Gueydon Port Petroleum, Inc. 1980-89
Cameron Oil Refining Co., Inc. 1992-92
Cameron Resources 1990-91 Schulze Processing, Inc. 1980-82 SCH - Tallulah
Mallard Resources, Inc. 1980-89
Gulf Oil Co. U.S.A. 1981-81 GLF - Venice
Bayou State Oil Corp. 1980- BYS - Hosston Gulf Oil Corp. 1980-80
Evangeline Refining Co. 1980-92 EVN - Jennings Lisbon Refinery J.V., LLC 1998- CLB - Lisbon
Padre Refining Co. 1997-98
Shepard Oil Co. 1980-82 SHP - Jennings Arcadia Refining & Mktg. Co. 1995-96
Dubach Gas Co. 1992-94
Laidlaw Environmental Systems 1992-92 TSR - Jennings Claiborne Gasoline Co. 1980-91
GSX Recovery Systems 1983-91
T & S Refining Co. 1980-82 Canal Refining Co. 1980- CNL - Church Pt.
37
Dates DNR Code & Location
Table 12Non-Operating Refineries Name History (1980-2001)
Refinery Name Dates DNR Code & Location Refinery Name