return on environment studies: methodology
TRANSCRIPT

1
RETURN ON ENVIRONMENT STUDIES:
METHODOLOGY How ROE values are calculated
The economic value of open space was estimated by measuring impact in five areas:
// Avoided costs associated with natural system services provided by open spaces
// Avoided costs associated with air pollution removal
// Value of open space related to outdoor recreation (e.g., sale of goods and services)
// Avoided healthcare costs associated with healthy lifestyles
// Impact of open space and water on property values (e.g., higher property values and earnings from
open-space-related activities)
Building on previous valuation studies, and using standard economic analysis techniques, ROE studies
estimate the financial value of open space by measuring the financial impacts of avoided costs from
natural system services and air pollution removal, outdoor recreation revenues, avoided healthcare
costs as a result of increased exercise, and increased property values due to proximity to open space.
Conservative approaches are used to estimate monetary values. For example, only major recreational
activities were included, and not all natural system services. Even with this conservative approach, the
analysis is subject to caveats common to any economic valuation or impact analysis. These caveats
include substitution effects, double counting, and value transfer (VT).
Substitution effects are important when considering the benefits that residents enjoy by recreating and
exercising in local public parks as opposed to a private facility. If all open space were developed, it is
unlikely that residents would discontinue the recreational activities they now enjoy, but would instead
go elsewhere. Because of this, estimates of recreational value in this study should be understood to
represent only the benefits that existing open space provides. Tourism is not a part of this estimate.
Double counting occurs when a value is overstated because it has been derived from two separate
analyses. While this study aimed to minimize any double counting, the complexity of natural systems
and their interconnections make it difficult to avoid some double counting.
Value transfer (VT) involves the adaptation of existing valuation or data from one location to a similar
location. It is used as an alternative strategy when primary research is not possible or justified because
of time or budget constraints. While VT is an alternative strategy, it is better than discounting natural
system services and implying that their value is zero.

2
VT is an important tool for policymakers, since it uses existing research to reliably estimate the
landscape’s natural system service value for considerably less time and expense than a new primary
study. VT information for this report was obtained from the 2011 satellite-derived land cover data from
the MRLC Consortium.1
FIGURE 1
VT MODEL FOR NATURAL SYSTEM SERVICES
NATURAL SYSTEM SERVICES
Natural system services represent the benefits that human populations derive, directly or indirectly, free
of charge from ecosystem functions. Because natural system services are not fully captured in
commercial markets or adequately quantified in terms comparable with economic services and
manufactured capital, they are often overlooked or undervalued in policy debates and investment
decisions.
This component of ROE studies estimate the avoided costs associated with 11 natural system services:
groundwater, stormwater and flood mitigation, carbon sequestration, air-pollution removal, wildlife
habitat, aquatic habitat, erosion prevention, habitat regeneration, pollination, biological control, and
nutrient uptake. These represent natural system services that, if lost, would require costly intervention
to replicate at taxpayers’ expense.
Land
Cover
Types
(Acres)
Estimated
Natural
System
Values by
Cover Type
Total
Natural
System
Services
Value/Year
by Service
Eco-price
Service
Values
3
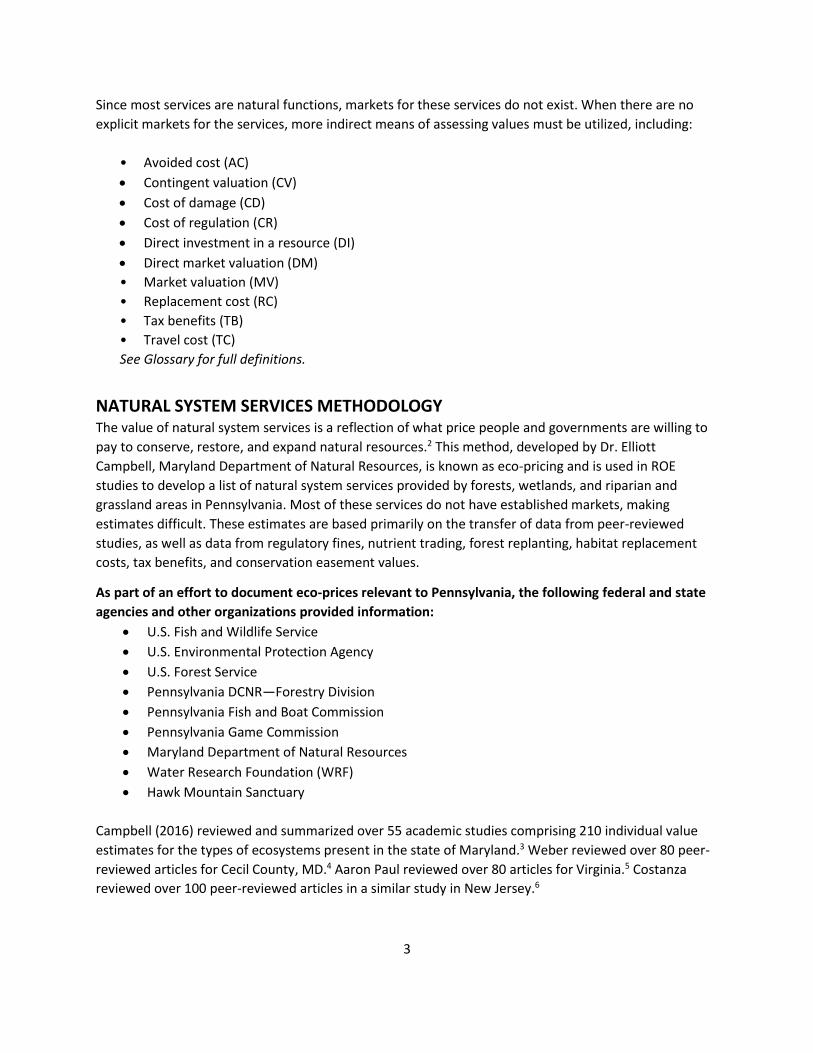
Since most services are natural functions, markets for these services do not exist. When there are no
explicit markets for the services, more indirect means of assessing values must be utilized, including:
• Avoided cost (AC)
Contingent valuation (CV)
Cost of damage (CD)
Cost of regulation (CR)
Direct investment in a resource (DI)
Direct market valuation (DM)
• Market valuation (MV)
• Replacement cost (RC)
• Tax benefits (TB)
• Travel cost (TC)
See Glossary for full definitions.
NATURAL SYSTEM SERVICES METHODOLOGY The value of natural system services is a reflection of what price people and governments are willing to
pay to conserve, restore, and expand natural resources.2 This method, developed by Dr. Elliott
Campbell, Maryland Department of Natural Resources, is known as eco-pricing and is used in ROE
studies to develop a list of natural system services provided by forests, wetlands, and riparian and
grassland areas in Pennsylvania. Most of these services do not have established markets, making
estimates difficult. These estimates are based primarily on the transfer of data from peer-reviewed
studies, as well as data from regulatory fines, nutrient trading, forest replanting, habitat replacement
costs, tax benefits, and conservation easement values.
As part of an effort to document eco-prices relevant to Pennsylvania, the following federal and state
agencies and other organizations provided information:
U.S. Fish and Wildlife Service
U.S. Environmental Protection Agency
U.S. Forest Service
Pennsylvania DCNR—Forestry Division
Pennsylvania Fish and Boat Commission
Pennsylvania Game Commission
Maryland Department of Natural Resources
Water Research Foundation (WRF)
Hawk Mountain Sanctuary
Campbell (2016) reviewed and summarized over 55 academic studies comprising 210 individual value
estimates for the types of ecosystems present in the state of Maryland.3 Weber reviewed over 80 peer-
reviewed articles for Cecil County, MD.4 Aaron Paul reviewed over 80 articles for Virginia.5 Costanza
reviewed over 100 peer-reviewed articles in a similar study in New Jersey.6

4
Due to the similarity of climate, land cover, and ecosystems in Maryland, New Jersey, and Virginia, this
data was relied upon as well. Data from Maryland and New Jersey were used when Pennsylvania data
was unavailable. Data from elsewhere in the United States was a third choice.
Figure 2 contains 80 exchanges of money for some form of ecological work, the replacement of
ecological work, or cost of damages to an ecosystem service (i.e. eco-prices). Eight economic
classifications (investment, replacement cost, avoidance cost, market price, cost of regulation, cost of
damages, taxes incurred, and tax benefit) were reviewed.
FIGURE 2
STUDIES REVIEWED BY CAMPBELL, ROGERS, AND COSTANZA
Natural System Service Number of Financial Exchanges Used in Developing Eco-prices
Groundwater 5
Nutrient uptake 17
Stormwater and flood mitigation 27
Aquatic resources 3
Habitat 19
Erosion prevention 4
Pollination 3
Biological control 2
In cases where there were a range of values for a given service, the most conservative number was
chosen. All dollar figures were transformed to 2017 equivalents, using an online inflation calculator
(http://www.westegg.com/inflation/) that employs the Consumer Price Index (CPI) from the annual
Statistical Abstract of the United States.
These numbers are estimates only and consider several issues, as the data are often not spatially
explicit. Some services, like pollination, depend on proximity to crops, yet not all forests are within
pollinator range of cropland. The value of flood protection, groundwater recharge, and other services
also depends on human demand relative to supply. This ratio tends to be higher in urban areas than
rural.
Similarly, not all forest and wetland types provide services equally. For example, many restoration
practices are focused on reducing the amount of nitrogen entering waterways. The cost of paying for
this can be expressed in terms of $/pound of nitrogen removed. Different natural systems, such as
wetlands, forests, and riparian covers, remove nitrogen at different rates on an annual basis.7
5
Other examples include soils and carbon sequestration. More productive soils facilitate faster plant
growth and faster uptake of carbon. Some tree species are better at carbon uptake than others.
Using eco-prices, an annual benefit can be calculated for each natural system.
Further, large, contiguous blocks of forest and wetland are more likely to contain fully functioning
ecosystems and provide corresponding benefits to humans. Smaller, fragmented ecosystems are more
likely to be impaired.8, 9, 10, 11 Retaining connectivity using configured corridors can help to offset some of
the functional losses caused by fragmentation.12, 13, 14, 15, 16, 17
Finally, using some services may impair other services. For example, constructing trails for recreation
can create more opportunities for invasive species. Proper management is therefore necessary to
prevent long-term ecological degradation.
The study group attempted to overcome these concerns in the following ways:
• Each cover type was distinguished by one or more eco-price.
• Eco-prices varied by cover types.
• Position in the landscape distinguished cover types (headwaters versus riparian forests).
• Locational differences were used as separate cover types (urban versus rural).
• Forest size was used to differentiate cover types (750 acres, 500–750 acres, 150–500 acres, and
less than 150 acres).
• Current uses or practices, like working forests and developed open space, were used to
differentiate cover types.
The total natural system service value of a given type of preserved or undeveloped open space was
determined by aggregating the individual natural system service eco-prices associated with each land
cover type.
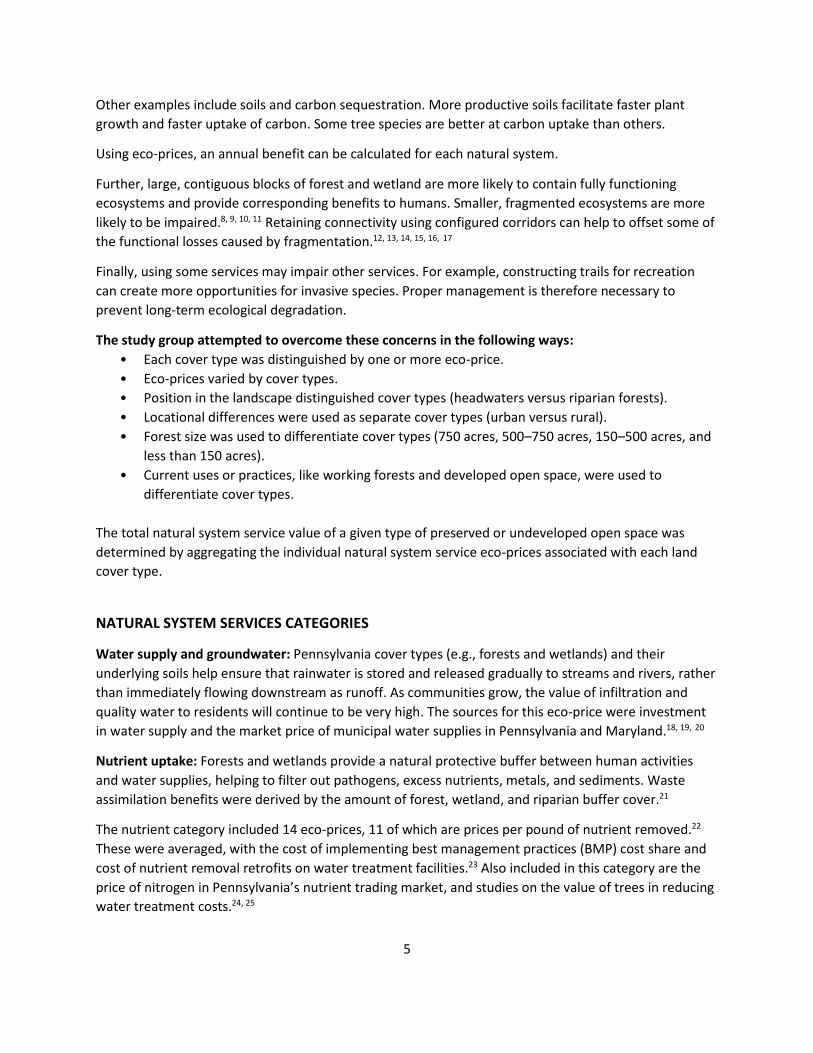
NATURAL SYSTEM SERVICES CATEGORIES
Water supply and groundwater: Pennsylvania cover types (e.g., forests and wetlands) and their
underlying soils help ensure that rainwater is stored and released gradually to streams and rivers, rather
than immediately flowing downstream as runoff. As communities grow, the value of infiltration and
quality water to residents will continue to be very high. The sources for this eco-price were investment
in water supply and the market price of municipal water supplies in Pennsylvania and Maryland.18, 19, 20
Nutrient uptake: Forests and wetlands provide a natural protective buffer between human activities
and water supplies, helping to filter out pathogens, excess nutrients, metals, and sediments. Waste
assimilation benefits were derived by the amount of forest, wetland, and riparian buffer cover.21
The nutrient category included 14 eco-prices, 11 of which are prices per pound of nutrient removed.22
These were averaged, with the cost of implementing best management practices (BMP) cost share and
cost of nutrient removal retrofits on water treatment facilities.23 Also included in this category are the
price of nitrogen in Pennsylvania’s nutrient trading market, and studies on the value of trees in reducing
water treatment costs.24, 25

6
Stormwater and flood mitigation: Many natural landscapes provide a buffering function that protects
humans from destructive activities. Forests, wetlands, riparian buffers, and floodplains mitigate the
effects of floods by slowing, trapping, and containing stormwater. The stormwater and flood mitigation
category comprises 27 eco-prices, 24 of which are stormwater best management practices that were
averaged together.26, 27
Biological control: Native birds and insects dynamically regulate and control invasive and unwanted
species, such as pests, weeds, and disease vectors (e.g., mosquitoes). This eco-price is based on a
valuation study.28
Wildlife habitat: Contiguous patches of land cover with sufficient area allow naturally functioning
ecosystems and support a diversity of sustainable plant and animal life. Intact forests and wetlands
function as critical population sources for plant and animal species that humans value for both aesthetic
and functional reasons. Native vegetation supports 29 times more biodiversity than non-native plants.29
The eco-price associated with biodiversity and wildlife habitat was assumed to be investments made to
preserve natural lands or habitats and the tax benefit gained by doing so. The habitat category includes
five instances of investments in wildlife habitat and the calculated average yearly tax benefit of donating
land for conservation. The yearly value per acre is estimated to be this tax benefit, plus the average
annualized value of the conserved land.30, 31, 32, 33, 34, 35, 36, 37, 38, 39, 40
Habitat regeneration: Natural habitats regenerate. Forests and wetland habitat regeneration is the act
of renewing habitat cover by naturally establishing young plants promptly after the previous habitat has
been altered. This eco-price is based on the cost to replace habitat using recent data from the U.S.
Forest Service and two related studies.41
Aquatic habitat: The Pennsylvania Fish and Boat Commission (PFBC) created a wild trout designation
and biomass classification system. PFBC also secures fines from activities that kill fish. Fines vary by
species and fish size. Based on the average size and fine for different stream classifications, an eco-price
was developed for each exceptional value and high-quality stream classification.42, 43, 44
Pollination: Pollination is essential for native vegetation, and many agricultural crops and substitutes for
local pollinators are increasingly expensive. Pennsylvania has been experiencing a severe bee colony
collapse. Forests and meadows provide pollination service benefits, which are a form of insurance for
farmers and nature in the event that bee colony collapse remains an issue. This eco-price is based on the
cost of replanting meadows, replacing bee hives, and managing pollination in forests.45 ,46,47
Soil retention: Soils provide many of the services mentioned above, including water storage/filtration,
waste assimilation, and a medium for plant growth. Natural systems create and enrich soil through
weathering and decomposition, and retain soil by preventing it from being washed away. Four eco-
prices are included in the soil category: two are costs of erosion and two are costs associated with
preventing erosion.48, 49, 50, 51

7
NATURAL SYSTEM LAND COVER TYPES
Forests over 750 acres are sustainable forests that support breeding populations of migrating birds and
larger mammals.52
Large regenerating forests are forests over 500 acres that support sustainable populations of songbirds
and wildlife.53, 54
Working regenerating forests are actively harvested forests that occur on state lands. They can be small
or large, with the average working forest being 200 acres. These forests generally regenerate, but have
less habitat quality than larger, undisturbed forests.55
Forests under 150 acres (small forests) allow light to penetrate from all sides, thus promoting invasive
species of plants. This retards natural regeneration. The services provided by these forests are useful
only as long as these forests exist.56
Riparian forests (100 feet on either side of a stream) help stabilize banks and, due to the presence of
water, attract wider biodiversity than upland forests. Some studies estimate the biodiversity to be
double.57, 58
Urban forests can be any size, except in rare instances where the urban forest is large and connected—
such as Fairmount Park in Philadelphia—where forests do not regenerate. The carbon and greenhouse
gas value of these forests is significantly greater than other forests. These forests help with stormwater
management, but they provide very little groundwater recharge.59
Floodplain forests are within the 100-year floodplain boundary.60
Headwater forests and wetlands (100 feet on either side of a stream), classified as first-order streams,
are designated as having exceptional value and high quality. Headwaters often make up 50–70 percent
of a watershed.61 These streams have some of the cleanest water in Pennsylvania. The water provides
an excellent habitat for native trout and other aquatic organisms.62
Forested wetlands have high biodiversity, as wildlife needs water for survival.63
Rural wetlands provide many biodiversity benefits. What distinguishes them is their location. While their benefits impact a smaller number of people, the downstream human population benefits from their existence.64 Urban wetlands impact urban populations. They have a limited role in groundwater recharge, as they
are usually located at the base of streams.65
Cultivated fields can change vegetation from year to year; however, they do serve a value for many
species of birds and other wildlife. They help to support pollinator species and biological control.66
Cultivated fields can also be a source of sediment, pesticides, and fertilizers that pollute water.
Pastures support pollinator species and biological control.67 Most state-endangered bird species are
associated with pastures and wetlands. However, pastures can be a source of pollution, because the
soils are compacted and provide only a small value in runoff control.68

8
Open water is great for recreation and provides groundwater recharge. Birds and other wildlife use
water as part of their regular and migration habitats.69
Developed open space includes parks and preserves with less than 30 percent impervious cover. Urban
open space and street trees provide many benefits, including air quality, energy conservation, cooling,
and pavement protection. They also can provide a habitat for many species, as long as a larger habitat is
within a half mile.70
Developed lands are urban areas with greater than 30 percent impervious cover. These areas often
create more problems than benefits for natural systems.71
AIR POLLUTION REMOVAL
The Clean Air Act (CAA) requires the Environmental Protection Agency (EPA) to set National Ambient Air
Quality Standards (NAAQS) for pollutants considered harmful to public health and the environment. A
nonattainment area is any area that does not meet primary or secondary NAAQS. Once a nonattainment
area meets the standards and additional re-designation requirements in the CAA [Section 107(d)(3)(E)],
the EPA will designate the area as a maintenance area.
Ozone is formed by chemical reactions occurring under specific atmospheric conditions. Precursor
pollutants that contribute to the formation of ozone include volatile organic compounds (VOCs) and
oxides of nitrogen (NOx), both of which are components of vehicle exhaust. VOCs may also be produced
through the evaporation of vehicle fuel, as well as by displacement of vapors in the gas tank during
refueling. By controlling VOC and NOx emissions, ozone formation can be mitigated. Both precursor
pollutants are analyzed in the transportation conformity process. Air pollution can also damage
buildings and plants, disrupt many natural system services, and cause reduced visibility.
Total pollutant removal values for each pollutant vary depending on the amount of tree-canopy cover.
Increased tree cover leads to greater pollutant removal values. As trees die and decay, they release
much of their stored carbon into the atmosphere. Carbon storage is an estimate of the total amount of
carbon that is currently stored in the above- and below-ground biomass of a forest.72
The i-Tree Landscape Model, developed by the U.S. Forest Service, was used to estimate the air pollution
removal and carbon sequestration and storage rates of tree cover. The model uses the National Land
Cover Database to estimate the amount of tree canopy, and then uses pollution-removal rates to
estimate the total amount of pollutant removal. The i-Tree Landscape analyzes tree canopy, land cover,
and basic demographic information by specific locations. With the information provided by the i-Tree
Landscape Model, levels and financial value are calculated.73

9
FIGURE 3
I-TREE LANDSCAPE MODEL PROCESS
OUTDOOR RECREATION
Outdoor recreation includes activities that can be performed in natural settings without causing harm to
nature. Resident levels of participation and direct annual spending are tracked across 13 recreational
activity categories. This list was compiled by reviewing the major activities in the DCNR 2014 Outdoor
Recreation Participation Survey, and by having discussions with steering committee members. Only
those activities with the highest participation rates are included. Some residents may enjoy horseback
riding, but the numbers are small relative to other activities. Further, motorized activities like
motorcycling, snowmobiling, and driving for pleasure are not included, as these are long-distance
activities associated with tourism. The major recreational activities are:
• Freshwater fishing
• Hunting (all types)
• Walking (on trails, in parks, and on streets)
• Running (on- and off-road)
• Bicycle-based recreation (on- or off-road)
• Camp-based recreation (in a tent)
• Water-based recreation (kayaking, rafting, and canoeing)
• Trail-based recreation (hiking on an unpaved trail, backpacking, and climbing natural rock)
• Wildlife viewing (wildlife watching and photography, except birds)
• Birding (both near and away from home), bird feeding, bird watching, and photography
• Outdoor education (nature study)
• Mountain biking
• Cross-country skiing
Land Cover
Total
Pollutant
Removal
Values by
Pollutant
Estimated
Value of
Pollutants
Removed

10
Economic Impact Analysis for Planning (IMPLAN) is an economic impact assessment software system
used to assess the change in overall economic activity as a result of change in one or several specific
economic activities. Economic activity can be either outside the region or reflected in transactions
among people and businesses. This form of economic activity is often referred to as economic
contributions.
Economic contributions are usually expressed as jobs, income, retail sales (expenditures), and tax
revenues. For the purpose of economic modeling, economic contributions and impacts can be divided
into three standard components: direct, indirect, and induced. Indirect and induced effects are the two
components of the multiplier or ripple effect. Each of these is considered when estimating the overall
economic effect of any activity.
Direct effects are initial purchases made by the consumer, and calculated by multiplying the number of
participants by their average annual spending for a particular activity. Participants are defined as those
who engage in a given activity at least once a year, and their recreational activity spending includes such
things as travel, clothing, equipment, and fees.
Indirect effects measure how sales in one industry affect the other industries that provide supplies and
support. For example, an angler buys fishing rods, hats, hip boots, gasoline, and food—which may be
produced in other parts of the state, country, or world.
Induced effects result from the wages and salaries paid by impacted industries to employees who then
spend their money. These expenditures are induced effects that create a continual cycle of indirect and
induced effects.
The sum of the direct, indirect, and induced effects is the total economic impact or contribution. The
IMPLAN economic model examines economic and demographic data. Indirect and induced economic
effects, along with employment and state and local taxes, are analyzed for the 13 previously identified
outdoor recreation activities.74
11
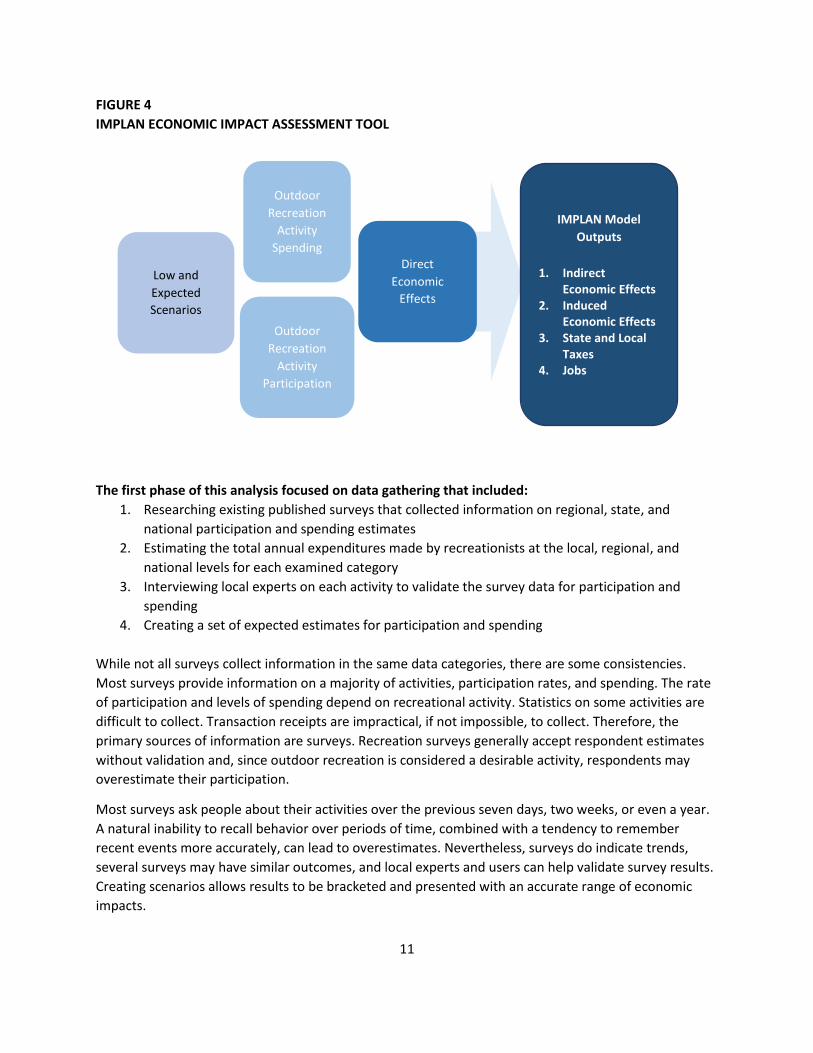
FIGURE 4
IMPLAN ECONOMIC IMPACT ASSESSMENT TOOL
The first phase of this analysis focused on data gathering that included: 1. Researching existing published surveys that collected information on regional, state, and
national participation and spending estimates
2. Estimating the total annual expenditures made by recreationists at the local, regional, and
national levels for each examined category
3. Interviewing local experts on each activity to validate the survey data for participation and
spending
4. Creating a set of expected estimates for participation and spending
While not all surveys collect information in the same data categories, there are some consistencies.
Most surveys provide information on a majority of activities, participation rates, and spending. The rate
of participation and levels of spending depend on recreational activity. Statistics on some activities are
difficult to collect. Transaction receipts are impractical, if not impossible, to collect. Therefore, the
primary sources of information are surveys. Recreation surveys generally accept respondent estimates
without validation and, since outdoor recreation is considered a desirable activity, respondents may
overestimate their participation.
Most surveys ask people about their activities over the previous seven days, two weeks, or even a year.
A natural inability to recall behavior over periods of time, combined with a tendency to remember
recent events more accurately, can lead to overestimates. Nevertheless, surveys do indicate trends,
several surveys may have similar outcomes, and local experts and users can help validate survey results.
Creating scenarios allows results to be bracketed and presented with an accurate range of economic
impacts.
Outdoor
Recreation
Activity
Participation
Direct
Economic
Effects
IMPLAN Model
Outputs
1. Indirect Economic Effects
2. Induced Economic Effects
3. State and Local Taxes
4. Jobs
Outdoor
Recreation
Activity
Spending
Low and
Expected
Scenarios

12
Financial data is less available than participation rates and usually derived from surveys and national
studies. For example, the U.S. Fish and Wildlife Service conducts a National Survey of Fishing, Hunting,
and Wildlife-Associated Recreation (FHWAR) every five years. This survey breaks down spending,
demographic, and participation information, and provides information on a state-by-state basis. This
survey is a well-established reference for fishing, hunting, and wildlife watching.75
FIGURE 5
COMPARISON OF NATIONAL, STATE, AND REGIONAL SURVEY PARTICIPATION RATES
0 0.1 0.2 0.3 0.4 0.5 0.6 0.7 0.8
Walking
Fishing
Hunting
Birding/Bird Watching
Wildlife Watching
Camping
Kayacking/Canoeing
Bicycling
Hiking/Backpacking
Running/Jogging
Nature Study
Dauphin County Expert Survey
Lehigh Valley Expert Survey 2014
PA DCNR South Central Region 2014 Survey
PA DCNR 2014 Survey
U.S. Fish and Wildlfie Service, 2011
Center for Disease Control and Prevention, 2012
Outdoor Recreation Foundation 2013 Participation Survey

13
REDUCED HEALTHCARE COSTS
Healthcare savings are derived by applying DCNR outdoor exercise participation rates to the conclusions
of four recent studies. Outdoor recreation activities include walking, hiking, jogging, running, bicycling,
camping, unstructured and playground play, paddle sports, bird and other animal watching, wildlife
photography, hunting and fishing, and nature study. These activities are provided by open space at little
or no direct cost to users. While paid fitness clubs and prescription exercise are valuable, individuals are
generally actively involved for only a short time—often just three to six months.76
KEY FINDINGS
1. A 2012 collaborative study of over 20,000 people between the University of Texas-Southwestern
Medical Center and the Cooper Institute found that average medical claims spent for middle-
aged, least-fit men were about 37 percent higher ($5,134) than the average spent per year for
most-fit men ($3,227). The most-fit males saved $1,907 in medical costs per year. The average
medical claims spent for least-fit women were 40 percent higher ($4,565) than the most-fit
($2,755). The most-fit females saved $1,810 in medical costs per year.77
2. A University of Michigan study looked at the impact of exercise on 4,345 employees in a
financial services company that started a workplace wellness program. Roughly 30 percent of
employees were high risk and suffering from metabolic syndrome, a dangerous cluster of risk
factors associated with diabetes and heart disease. Overall, about 34 percent of U.S. adults have
metabolic syndrome. The study found that when high-risk employees accumulated the
government-recommended 150 minutes of moderate-intensity exercise a week, their healthcare
costs and productivity equaled that of healthy employees who didn't exercise enough.
Employees with metabolic syndrome who exercised enough cost $2,770 in total healthcare
annually, compared to $3,855 for workers with metabolic syndrome who didn't exercise
enough. Pharmacy costs alone were twice as much. This represents a savings of $1,085 per
person per year.78
3. A 2015 study about “Inadequate Physical Activity and Health Care Expenditures in the United
States” included 51,165 adults over the age of 21, excluding women that were pregnant or
people who were unable to be physically active. The study found that the mean annual
expenditure difference per capita for inactive adults compared to active adults was $1,437, or a
difference of 29.9 percent. For people who exercised, but not enough to sufficiently reach
maximum benefit, the difference was $713 per year.79
4. In 2016, The Centers for Disease Control and Prevention (CDC) published a paper connecting
inadequate physical activity with healthcare costs. The CDC researchers merged data from the
National Health Interview Survey (2001-2010) and the Medical Expenditure Panel Survey. The
National Health Interview Survey used face-to-face interviews to gather health information from
individuals nationwide. The Medical Expenditure Panel Survey collected healthcare cost data
from both federal agencies and private insurance companies. When these two data sets were

14
merged, information was provided on over 58,000 individuals. The researchers evaluated the
difference in healthcare costs for individuals with various levels of physical activity. Individuals
who exercised more than 150 minutes per week spent about $4,500 per year on healthcare
costs. Those who did between zero and 150 minutes of exercise a week spent $5,076 per year,
and those who didn’t exercise at all spent $5,813 per year. Compared with those who are active,
sedentary adults spend $1,313 more on healthcare every year.80
The conclusions of these four studies are compiled to establish an average per-capita healthcare cost
reduction.
FIGURE 6
HEALTHCARE COST REDUCTION DUE TO EXERCISE AND OUTDOOR ACTIVITY
Source Annual per capita expense
1 Holohan, 2012 $1,907
2 Bailey, et al., 2014 $1,085
3 Carlson, et al., 2015 $1,437
4 CDC, 2016 $1,313
Average cost reduction $1,436
Insufficient exercise to reach maximum benefit
(Carlson, et al., 2015)
$713
PROPERTY VALUES
ROE analyses typically include a calculation of the residential real estate premium due to proximity to
open space. That is, how much more valuable is the housing stock because homes are next to or near
open space?
Existing open space adds to the overall value of its housing stock. This increased wealth is captured by
citizens through higher sale values of homes near open space, and increased government revenues via
larger property tax collections and transfer taxes at the time of sale. However, proximity to open space
may not have a significant impact on property values in more rural areas.
Being near surface water, on the other hand, can make a difference in the value of housing stock. For
example, existing research demonstrates that lakes can bring recreational and aesthetic value to
surrounding properties, which has economic and fiscal implications due to increased property and tax
assessment values.
15
Nationally, waterfront homes are worth more than double the value of homes overall.
According to 2014 median home value data provided by Zillow for 247 cities throughout the
U.S., the value of a single-family home was $282,577, while the average value of a waterfront
single-family home was $697,920—a difference of more than 235 percent.81
Lakes can influence the property values of surrounding homes, particularly for those closest to
the lake. A 2012 analysis of property values and tax revenues in Kosciusko County, IN, found that
properties within 500 feet of the county’s 41 largest lakes accounted for 37 percent of total
property tax revenues. A 1995 hedonic study conducted in Central Texas found several
statistically-significant recreational and aesthetic (RA) characteristics of housing, with proximity
to the lake being the most important. Specifically, the study found that waterfront properties
captured 75 percent of the RA value for all homes within 2,000 feet of a lake. Beyond the
waterfront, the marginal RA price falls rapidly with increasing distance.82
Based on other research in Pennsylvania, property values in rural counties were highest for
those homes within 500 feet of a lake. This waterfront premium represents an increase of 15 to
35 percent of average total assessed property values within each jurisdiction. Although this
analysis does not account for differences in home size, quality, and other characteristics, which
may partially explain value disparities between waterfront and non-waterfront homes, research
suggests that a significant portion of this waterfront premium is likely attributed to lake
proximity.
Conversely, property values and tax revenues are subject to change based on improved or degraded
water quality. A 2003 analysis conducted in Maine found that a one-meter decrease in water clarity
causes property values to decrease 3 to 9 percent. Similar effects were seen in New Hampshire and
Vermont, and there is indication that this effect holds true in Pennsylvania.83

16
Glossary
Air pollution
The release of harmful matter, particulates, and gases, such as sulfur dioxide, nitrogen oxides, carbon
monoxide, and volatile organic compounds, into the air.
Avoided cost (AC)
Dollars that do not need to be spent on the provision of environmental services, such as improving
water quality and removing air pollution.
Biological connectivity
The ability of individual plants and animals to move across complex landscapes, maintaining regional
populations in the short term and allowing species to shift their geographic range in response to habitat
needs and climate change.
Biological control
The dynamic regulation of species populations, including the control of invasive species and unwanted
species—such as pests, weeds, and disease vectors (e.g., mosquitoes)—by beneficial insects.
Carbon sequestration
The process of carbon capture and long-term storage of atmospheric CO2 through photosynthesis.
Carbon sequestration describes long-term storage of CO2 or other forms of carbon to either mitigate or
defer global warming and avoid dangerous climate change.
Carbon storage
The estimate of the total amount of carbon currently stored in a forest’s above- and below-ground
biomass.
Climate change
Changes in regional or local climate patterns, particularly a change apparent from the mid-20th century
onward, attributed largely to the increased levels of atmospheric CO2 produced by the use of fossil fuels.
Conservation design
A planning process that rearranges the development on each parcel as it is being planned so that half (or
more) of the buildable land is set aside for open space.
Contingent valuation (CV)
A survey-based economic technique for the valuation of non-market resources, such as environmental
preservation or the impact of contamination.
Cost of damage (CD)
An estimate of monetized damages associated with the release of carbon or other pollutants.
Cost of regulation (CR)
Fines and procedures.

17
Direct investment in a resource (DI)
Investment in water supply facilities or the protection of land.
Direct market valuation (DM)
Obtaining values for the provision of services.
Ecosystem function
The habitat, biological, or system properties or processes of ecosystems.
Flood mitigation
The management and control of floodwater movement, such as redirecting flood runoff through the use
of floodwalls and floodgates rather than trying to prevent floods altogether.
Groundwater
Water found underground in the cracks and spaces in soil, sand, and rock. It is stored in, and moves
slowly through, geologic formations of soil, sand, and rock called aquifers. Groundwater is the source of
water for streams and supplies water through wells.
Habitat
The area or environment where an organism or ecological community normally lives or occurs.
Habitat loss
Loss and degradation of the natural conditions that animals and plants need to survive.
Hedonic regression analysis
A model identifying price factors according to the premise that price is determined by both the internal
characteristics of the goods being sold and the external factors affecting it.
Market valuation (MV)
The amount of money paid to purchase credits in a trading market, for example, the price of a carbon
credit for air quality, the purchase of a nutrient credit for water quality, or the purchase of potable
water.
National Pollutant Discharge Elimination System (NPDES) permit
The NPDES permit program addresses water pollution by regulating point sources that discharge
pollutants to waters of the United States.
Natural capital
A portfolio of natural assets, such as geology, soil, air, water, and all living things.
Natural habitat regeneration
The process by which vegetation and habitat grow back without human intervention.
Natural system services
The flow of goods and services that benefit people, directly or indirectly, from ecosystem functions. Also
called ecosystem services.

18
Open space
Land that is valued for aesthetic beauty, recreation, natural process, agriculture, and other public
benefits.
Outdoor recreation
Activities that can be performed in natural settings without causing harm.
Pollination
The process by which pollen is transferred from the anther (male part) to the stigma (female part) of a
plant, thereby enabling fertilization and reproduction.
Replacement cost (RC)
Cost to replace services with man-made systems. For example, the waste assimilation service provided
by wetlands could be replaced with chemical or mechanical alternatives (such as wastewater treatment
plants). The replacement cost would be the estimated cost of replacing the natural waste assimilation
service with chemical or mechanical alternatives.
Riparian buffer
A vegetated area ("buffer strip") near a stream, 100 feet wide and usually forested, which helps shade
and partially protect a stream from the impact of adjacent land uses. It plays a key role in increasing
water quality in associated streams, rivers, and lakes, thus providing environmental benefits.
Soil retention
A system that creates and enriches soil through weathering and decomposition, preventing it from being
washed away.
Tax benefits (TB)
Adjustment benefiting a taxpayer’s tax liability.
Travel cost (TC)
Cost of travel and its reflection on the implied value of a service.
Water pollution
Sewage, fertilizers, pesticides, oil, silt, and other pollutants that are discharged, spilled, or washed into
water, including contaminants from air pollution that settle onto land and are washed into water bodies.
Water quality
A measure of the suitability of water for a particular use (e.g., drinking, fishing, or swimming), based on
selected physical, chemical, and biological characteristics.
Water supply
A source, means, or process of supplying water, including groundwater aquifers, reservoirs, streams,
rivers, and pipelines.
Waste assimilation
The method by which forests and wetlands provide a natural protective buffer between natural system
activities and water supplies.

19
References 1 Multi-Resolution Land Characteristic Consortium. 2011. 2 Campbell, E. 2016. Maryland Department of Natural Resources. 3 Ibid. 4 Weber, T. 2007. Ecosystem Services in Cecil County’s Green Infrastructure. Technical Report for Cecil County Green Infrastructure Plan. The Conservation Fund, Annapolis, Maryland. 5 Aaron, P. 2011. The Economic Benefits of Natural Goods and Services in Virginia. Berkley Scholars Conservation Program & Piedmont Environmental Council. Available from http://www.pecva.org/maps-and- resources/publications/conservation-and-rural-programs/598-the-economic-benefits-of-natural-goods-and- services. 6 Costanza, R., M. Wilson, A. Troy, A. Voinov, S. Liu, and J. D’Agostino. 2006. The Value of New Jersey’s Ecosystem Services and Natural Capital. A report by Gund Institute for Ecological Economics funded by New Jersey Department of Environmental Protection, Trenton, New Jersey. 7 Campbell, E. 2016. Maryland Department of Natural Resources. 8 Rosenberg, K.V., R.S. Hames, R.W. Rohrbaugh, Jr., S. Barker Swarthout, J.D. Lowe, and A.A. Dhondt. 2003. A land manager’s guide to improving habitat for forest thrushes. The Cornell Lab of Ornithology. 9 Rosenberg, K. V., R. W. Rohrbaugh, Jr., S. E. Baker, J.D. Lowe, R. S. Hames, and A. A. Dhondt. 1999. A land manager’s guide to improving habitat for scarlet tanagers and other forest-interior birds. Cornell Lab of Ornithology. 10 Dan Brauning. 2016. Pennsylvania Game Commission, Harrisburg, Pennsylvania. 11 Goodrich, L. 2016. Hawk Mountain Sanctuary, Kempton, Pennsylvania. 12 Jones, C., J. McCann, and S. McConville. 2000. A Guide to the Conservation of Forest Interior Dwelling Birds in the Chesapeake Bay Critical Area. Chesapeake Bay Critical Area Commission, Annapolis, Maryland. 13 USEPA (United States Environmental Protection Agency). 2012. The Economic Benefits of Protecting Healthy Watersheds EPA 841-N-12-004, 1. Available from https://www.epa.gov/sites/production/files/2015- 10/documents/economic_benefits_factsheet3.pdf. 14 Hallet., J. 2001. First genetic evidence that animals use corridors (adopted from Society for Conservation Biology). Available from https://www.sciencedaily.com/releases/2001/03/010322232957.htm. 15 Damschen, E., J. Orrock. 2008. How wildlife corridors work over time. National Academy of Science. 16 National Science Foundation. 2005. Landscape Corridors Provide for Seed Dispersal: Birds Help Habitats Maintain Diversity. Science Daily. Available from https://www.sciencedaily.com/releases/2005/07/050706001724.htm. 17 Sweeney, B., W. and J. D. Newbold. 2014. Streamside Forest Buffer Width Needed to Protect Stream Water Quality, Habitat, and Organisms: A Literature Review. Journal of the American Water Resources Association 50: 560-584. Available from http://nhanrs.org/Buffer/Sweeney2014.pdf. 18 Bay Restoration Fund Advisory Committee. 2015. Annual Status Report. Available from http://www.mde.state.md.us/programs/Water/BayRestorationFund/Documents/2015%20BRF%20Report% 20-%20Final.pdf. 19 NYSDEC (New York State Department of Environmental Conservation). 2015. New York City Water Supply. Available from http://www.dec.ny.gov/lands/25599.html. 20 Washington Suburban Sanitation Commission. 2014. Resolution No. 2014-2054. Available from https://www.wsscwater.com/files/live/sites/wssc/files/Resolutions/Resolution%202014- 2054%20Adopting%20the%20Washington%20Suburban%20Sanitary%20Commission's%20FY%202015%20O perating%20and%20Capital%20Budgets_1045151.pdf. 21 Talberth, J., M. Selman, S. Walker, E. Gray. 2015. Pay for Performance: Optimizing public investments in agricultural best management practices in the Chesapeake Bay Watershed. Ecological Economics 118: 252–261. Available from http://lakeeriehabsis.gis.utoledo.edu/wp-content/uploads/2018/06/1-s2.0- S0921800915003365-main.pdf.

20
22 Bay Restoration Fund Advisory Committee. 2015. Annual Status Report. Available from http://www.mde.state.md.us/programs/Water/BayRestorationFund/Documents/2015%20BRF%20Report% 20-%20Final.pdf. 23 Ibid. 24 PADEP (Pennsylvania Department of Environmental Protection). 2015. Nutrient Trading. http://www.dep.pa.gov/Business/Water/PointNonPointMgmt/NutrientTrading/Pages/default.aspx#.Vpau_ PkrIgs. 25 American Water Works Association. 2016. Forest cover and its effect on water treatment costs. AWWA Connections. Available from https://www.awwa.org/publications/connections/connections- story/articleid/4275/forest-cover-and-its-effect-on-water-treatment-costs.aspx. 26 King, D. and P. Hagan. 2012. Costs of Stormwater Management Practices in Maryland Counties. Ref. No. [UMCES] CBL 11‐043. Prepared for Maryland Department of the Environment Science Services Administration. Available from http://www.mde.state.md.us/programs/water/TMDL/TMDLImplementation/Documents/King_Hagan_Stor mwater%20Cost%20Report%20to%20MDE_Final%20Draft_12Oct2011.pdf. 27 PADEP (Pennsylvania Department of Environmental Protection). 2006. Stormwater Best Practices Manual. Available from http://www.depgreenport.state.pa.us/elibrary/GetFolder?FolderID=4673. 28 NJDEP (New Jersey Department of Environmental Protection). 2007. Valuing New Jersey’s Natural Capital: An Assessment of the Economic Value of the State’s Natural Resources. Available from https://www.nj.gov/dep/dsr/naturalcap/nat-cap-1.pdf. 29 Tallamy, D. 2007. Bringing Nature Home. Algonquin Books, Chapel Hill, North Carolina. 30 Conservation Fund. 2006. The State of Chesapeake Forests. Available from https://www.chesapeakebay.net/content/publications/cbp_19673.pdf. 31 Kauffman, G., A. Homsey, E. McVey, S. Mack, S. Chatterson. 2011. Socioeconomic Value of the Chesapeake Bay Watershed in Delaware. Prepared for Delaware Department of Natural Resources and Environmental Control, Watershed Assessment Section Division of Watershed Stewardship, Dover, Delaware. Available from https://www.researchgate.net/publication/268338870_Socioeconomic_Value_of_the_Chesapeake_Bay_W atershed_in_Delaware. 32 Ducks Unlimited. 2014. Annual Report Fiscal Year 2013. Available from http://www.ducks.org/resources/media/About%20DU/Annual%20Report/2013/2013AnnualReport_Full_FI NAL.pdf. 33 Pennsylvania Habitat Restoration. 2017. Partners of the Fish and Wildlife Program. US Fish and Wildlife Service. 34 Krieger, D. J., 2001. Economic Value of Forest Ecosystem Services: A Review. An analysis prepared for The Wilderness Society, Washington, D.C. Available from https://www.sierraforestlegacy.org/Resources/Conservation/FireForestEcology/ForestEconomics/Ecosyste mServices.pdf. 35 Brauning, D. 2016. Pennsylvania Game Commission, Harrisburg, Pennsylvania. 36 Ingraham, M. and S. G. Foster. 2008. The Value of Ecosystem Services. Provided by the U. S. National Wildlife Refuge System in the Contiguous US Ecological Economics. 67:608–18. 37 World Resources Institute. 2002. The Value of Conservation Easements. The Importance of Protecting Nature and Open Space. Available from http://www.landscope.org/rhythmyx/action/conserve/easements/item20493.pdf. 38 Brown, G. 1992. Replacement Costs for Birds and Mammals. University of Washington, Seattle, Washington. Available from http://citeseerx.ist.psu.edu/viewdoc/summary?doi=10.1.1.718.7595. 39 PADEP (Pennsylvania Department of Environmental Protection). Stream Releaf: A Plan for Restoring and Conserving Buffers Along Pennsylvania Streams. Available from http://www.dep.state.pa.us/dep/deputate/watermgt/wc/subjects/streamreleaf/forestbufftool/ReLeaf_Pla n.pdf. 40 PGC (Pennsylvania Game Commission). 2017. Species of Concern fines. U.S. Fish and Wildlife Service 2017. Habitat replacement costs.

21
41 Natural Resource Conservation Service Tree Planting Program. 42 PFBC (Pennsylvania Fish & Boat Commission). Fish kill fines. 43 Weber, B. and T. Green. 2016. Pennsylvania’s wild trout streams. Pennsylvania Angler and Boater: May/June. Available from https://www.fishandboat.com/Transact/AnglerBoater/AnglerBoater2016/MayJune/Documents/12wildstrea ms.pdf. 44 PAFBC (Pennsylvania Fish & Boat Commission). Cost Report. 45 Moore, Rebecca, T. Williams, E. Rodriguez, J. H. Cymmerthan. 2011. Quantifying the value of non-timber ecosystem services from Georgia’s private forests. Georgia Forestry Foundation, Forsyth, Georgia. Available from http://www.gfc.state.ga.us/utilization/ecosystem- services/Quantifying%20the%20Value%20of%20Non- Timber%20Ecosystem%20Services%20from%20Georgia's%20Private%20Forests.pdf. 46 Caron, D.M. 2008. Bee colony pollination rental prices, eastern US with comparison to west coast. Available from http://agdev.anr.udel.edu/maarec/wp-content/uploads/2011/02/Pollination-rentals-PNWEAST.pdf. 47 USDA NRCS (United States Department of Agriculture, Natural Resource Conservation Service). 2014. Regulatory Impact Analysis (RIA) for the Environmental Quality Incentives Program. (EQIP). http://www.nrcs.usda.gov/wps/portal/nrcs/detail/nc/home/?cid=stelprdb1242633 Archived. 48 USEPA (United States Environmental Protection Agency). 2015. Clean Power Plan Framework. https://www.epa.gov/cleanpowerplan/fact-sheet-clean-power-plan-framework 49 King, D. and P. Hagan. 2012. Costs of Stormwater Management Practices in Maryland Counties. Ref. No. [UMCES] CBL 11‐043. Prepared for Maryland Department of the Environment Science Services Administration. Available from http://www.mde.state.md.us/programs/water/TMDL/TMDLImplementation/Documents/King_Hagan_Stor mwater%20Cost%20Report%20to%20MDE_Final%20Draft_12Oct2011.pdf. 50 MDOE (Maryland Department of the Environment). 2015. Bay Restoration Fund Advisory Committee Annual Status Report. Available from http://www.mde.state.md.us/programs/Water/BayRestorationFund/Documents/2015%20BRF%20Report% 20-%20Final.pdf 51 PADEP (Pennsylvania Department of Environmental Protection). 2006. Stormwater Best Practices Manual. Available from http://www.depgreenport.state.pa.us/elibrary/GetFolder?FolderID=4673. 52 Goodrich, L. 2016. Hawk Mountain Sanctuary, Kempton, Pennsylvania. 53 Rosenberg, K.V., R.S. Hames, R.W. Rohrbaugh, Jr., S. Barker Swarthout, J.D. Lowe, and A.A. Dhondt. 2003. A land manager’s guide to improving habitat for forest thrushes. The Cornell Lab of Ornithology. 54 Jones, C., J. McCann, and S. McConville. 2000. A Guide to the Conservation of Forest Interior Dwelling Birds in the Chesapeake Bay Critical Area. Chesapeake Bay Critical Area Commission, Annapolis, Maryland. Available from https://www.co.cal.md.us/DocumentCenter/View/195 55 The Nature Conservancy Working Forest Program. Available from http://www.nature.org/ourinitiatives/regions/northamerica/unitedstates/ pennsylvania/workingwoodlands. 56 Jones, C., J. McCann, and S. McConville. 2000. A Guide to the Conservation of Forest Interior Dwelling Birds in the Chesapeake Bay Critical Area. Chesapeake Bay Critical Area Commission, Annapolis, Maryland. Available from https://www.co.cal.md.us/DocumentCenter/View/195. 57 Newbold, J. D., S. Herbert, B.W. Sweeney, P. Kiry, and S. Alberts. J. 2010. Water Quality Functions of a 15-Year- Old Riparian Forest Buffer System. Journal of the American Water Resources Association. 1-12. DOI: 10.1111 ⁄ j.1752-1688.2010.00421. 58 Sweeney, B. W. and J. D. Newbold. 2014. Streamside Forest Buffer Width Needed to Protect Stream Water Quality, Habitat, and Organisms: A Literature Review. Journal of the American Water Resources Association 50:560-584. 59 FEMA (Federal Emergency Management Association) Flood Map Service Center.

22
60 Fritz, K., B. Johnson, and D. Walters. 2008. Physical Indicators of Hydrologic Permanence in Forested Headwater Streams. Journal of the North American Benthological Society. 27. 690–704. Available from http://www.bioone.org/doi/abs/10.1899/07-117.1?journalCode=jnbs. 61 Gregory, S.V., F.J. Swanson, W.A. McKee, and K.W. Cummins. 1991. An Ecosystem Perspective of Riparian Zones. Bioscience 41:540-551. Available from https://www.jstor.org/stable/1311607?seq=1#page_scan_tab_contents. 62 Forest and Range. 2016. Wetlands management: economics and recreation. Available from http://forestandrange.org/new_wetlands/economics_and_recreation.htm. 63 USDA (United States Department of Agriculture). Forested wetlands. Functions, benefits and the use of best management practices. Available from http://docplayer.net/3998422-Forested-wetlands-functions- benefits-and-the-use-of-best-management-practices-united-states-department-of-agriculture.html. 64 Boyer, T. and S. Polasky. 2004. Valuing Urban Wetlands: A Review of Non-Market Valuation Studies. Wetlands 24:744–755. Available from https://link.springer.com/article/10.1672/0277- 5212(2004)024[0744:VUWARO]2.0.CO;2#citeas. 65 National Audubon Society. Working lands: Grassland birds. Available from http://www.audubon.org/conservation/project/grassland-birds. 66 Hampshire Biodiversity Partnership. Standing open water. Available from http://www.hampshirebiodiversity.org.uk/pdf/PublishedPlans/StandingOpenWater-final.pdf. 67 L. Goodrich.2016. Hawk Mountain Sanctuary, Kempton, Pennsylvania. 68 Ibid. 69NJDEP (New Jersey Department of Environmental Protection). 2007. Valuing New Jersey’s Natural Capital: An Assessment of the Economic Value of the State’s Natural Resources. Available from https://www.nj.gov/dep/dsr/naturalcap/nat-cap-1.pdf. 70 Jones, C., J. McCann, and S. McConville. 2000. A Guide to the Conservation of Forest Interior Dwelling Birds in the Chesapeake Bay Critical Area. Chesapeake Bay Critical Area Commission, Annapolis, Maryland. Available from https://www.co.cal.md.us/DocumentCenter/View/195. 71 USEPA (United States Environmental Protection Agency). 2012. The Economic Benefits of Protecting Healthy
Watersheds, EPA 841-N-12-004. Available from https://www.epa.gov/sites/production/files/2015-10/documents/economic_benefits_factsheet3.pdf.
72 Nowak, D. J., Crane, D.E., and Stevens, J. C. 2006. Air Pollution removal by urban trees and shrubs in the United States. Urban Forestry and Urban Greening 4:115-123. Available from https://www.fs.fed.us/ne/newtown_square/publications/other_publishers/OCR/ne_2006_nowak001.pdf. 73 Ibid. 74 IMPLAN.com. 75 USFWS (United States Fish and Wildlife Service). 2011. National Survey of Fishing, Hunting and Wildlife Watching. 76 Gies, E. 2009. Conservation: An Investment That Pays. Trust for Public Land, San Francisco, California. Available from http://cloud.tpl.org/pubs/benefits_econbenefits_rpt_7_2009.pdf. 77 Holohan, E. 2012. Fitness in middle age lowers medical costs later. HealthDay. Available from http://consumer.healthday.com/fitness-information-14/gum-health-news-253/fitness-in-middle-age lowers-medical-costs-later-study-664646. 78 Burton W.N., CY Chen, X. Li, A.B. Schultz, and H. Abrahamsson. 2014. The association of self-reported employee physical activity with metabolic syndrome, health care costs, absenteeism, and presenteeism. Journal of Occupational and Environmental Medicine 56:919-26. Available from https://www.ncbi.nlm.nih.gov/pubmed/25153302. 79 Carlson, S., J. Fulton, M. Pratt, Z. Yang and K. Adams. 2015. Inadequate physical activity and health care expenditures in the United States. Progress in Cardiovascular Diseases 57:315-323. Available from https://www.sciencedirect.com/science/article/pii/S0033062014001236?via%3Dihub. 80 USCDC (United States Center for Disease Control and Prevention). 2016. Inadequate Physical Activity and Health Care Expenditures in the United States. https://www.cdc.gov/nccdphp/dnpao/docs/carlson-physical- activity-and-healthcare-expenditures-final-508tagged.pdf.

23
81 Zillow. 2014. 82 Bosch, N., A. Burke, N. Verma, 2012. Lake impacts on property taxes and values in Kosciusko County, Kosciusko Lakes and Streams, Grace College. Winona Lake, Indiana. Available from https://www.in.gov/dnr/fishwild/files/fw- LARE_Lake_Impacts_Property_Taxes_Kosciusko_County_Indiana_Grace_College_Sep_25_2013.pdf. 83Boyle, K. and R. Bouchard, 2003. Water quality effects on property prices in northern New England. LakeLine 23:24-27.