environmental statement - environment agency - citizen space · l4.4 hazard identification 25 l5...
TRANSCRIPT

Cuadrilla Bowland Ltd
Temporary Shale Gas Exploration
Preston New Road, Lancashire
Environmental Statement
Appendix L –Induced Seismicity
PNR_ES_Vol2_Appndx L_ Induced Seismicity
May 2014


Cuadrilla Bowland Limited Temporary shale gas exploration at Preston New Road Environmental Statement
Draft 3 | 24 May 2014
C:\RICHARD\RICHARD - WORK\JOBS\CUADRILLA\ISSUED DOCUMENTS\PRESTON NEW ROAD\2015-05-29 ES & PL DOCS FINAL\ES VOL 2 FINAL
APPENDICIES\PNR_ES_VOL2_APPNDX L_INDUCED SEISMICITY.DOCX
Contents
L1 Introduction 2
L1.1 Site Location 2
L1.2 Context of the Project 4
L2 Relevant legislation, policy and guidance 6
L2.1 United States of America (USA) legislation and policy 6
L2.2 European legislation and policy 7
L2.3 UK national legislation, policy and guidance 7
L2.4 Regional legislation and policy 9
L2.5 Local legislation and policy 9
L2.6 Conclusions and recommendations 9
L3 Background 11
L3.1 Explanation of key terms 11
L3.2 Summary of natural seismicity in the UK 13
L3.3 Summary of induced seismicity 14
L3.4 Induced seismicity associated with shale gas exploitation 16
Typical event magnitudes 16 L3.4.1
Typical event durations 16 L3.4.2
Exceptional induced seismic events 16 L3.4.3
L3.5 Induced seismicity associated with flow testing 17
L3.6 Induced seismicity associated with drilling 18
L3.7 Differentiating induced from natural seismicity 18
L3.8 Fracture growth 18
L3.9 Potential well casing deformation and seismicity 19
L3.10 Hydraulic Fracturing in the UK 19
L4 Scoping and consultation 21
L4.1 Stakeholder engagement 21
L4.2 Scoping opinion 21
L4.3 Royal Society and Royal Academy of Engineering consultations 24
L4.4 Hazard identification 25
L5 Methodology 27
L5.1 Introduction 27
L5.2 Baseline methodology 27
L5.3 Assessment methodology for the effects from construction 28
L5.4 Assessment methodology for the effects from installation of surface and buried array 29
L5.5 Assessment methodology for operational effects 29
L5.6 Assessment methodology for decommissioning effects 30

Cuadrilla Bowland Limited Temporary shale gas exploration at Preston New Road Environmental Statement
Draft 3 | 24 May 2014
C:\RICHARD\RICHARD - WORK\JOBS\CUADRILLA\ISSUED DOCUMENTS\PRESTON NEW ROAD\2015-05-29 ES & PL DOCS FINAL\ES VOL 2 FINAL
APPENDICIES\PNR_ES_VOL2_APPNDX L_INDUCED SEISMICITY.DOCX
L5.7 Assumptions and limitations 30
L6 Baseline conditions 33
L6.1 The Site 33
L6.2 Regional geology 33
L6.3 Local geology 35
Structural geology 35 L6.3.1
Anticipated solid geology 37 L6.3.2
L6.4 Superficial geology 43
Glacial deposits (Devensian) 44 L6.4.1
Post-glacial (Flandrian) deposits 44 L6.4.2
Superficial deposits local to Preston New Road 44 L6.4.3
L6.5 Regional stress data 45
L6.6 Natural seismicity 51
L6.7 Background seismic monitoring 54
Background Seismicity 55 L6.7.1
Background siting and noise measurements for the Preston L6.7.2New Road surface array 56
L6.8 Maximum magnitude estimate 59
Maximum magnitude results 60 L6.8.1
Comparative induced seismicity 61 L6.8.2
L6.9 Independent review maximum magnitude 62
Review of maximum magnitude simulations by Q-con 62 L6.9.1
Additional comments on the estimation of potential maximum L6.9.2magnitude 62
Maximum magnitudes after mitigation measures 63 L6.9.3
L6.10 Seismic Receptors 63
Introduction 63 L6.10.1
Methodology 63 L6.10.2
Desk Based Review 66 L6.10.3
Site Walkover Observations 66 L6.10.4
L6.11 Preston New Road Future Baseline 70
L7 Review and selection of criteria for ground motion hazard 71
L7.1 Introduction 71
Amplitude descriptors 71 L7.1.1
L7.2 Considerations for ground motion assessment 72
Ground motion event duration 72 L7.2.1
Ground motion frequency 72 L7.2.2
L7.3 Ground motion criteria associated with earthquakes 73
European Macroseismic Scale (EMS) 73 L7.3.1
USGS Shake Map® 74 L7.3.2
Published correlations of intensity and ground motion L7.3.3parameters 74

Cuadrilla Bowland Limited Temporary shale gas exploration at Preston New Road Environmental Statement
Draft 3 | 24 May 2014
C:\RICHARD\RICHARD - WORK\JOBS\CUADRILLA\ISSUED DOCUMENTS\PRESTON NEW ROAD\2015-05-29 ES & PL DOCS FINAL\ES VOL 2 FINAL
APPENDICIES\PNR_ES_VOL2_APPNDX L_INDUCED SEISMICITY.DOCX
Conclusions 75 L7.3.4
L7.4 Ground borne vibration criteria associated with construction activities 77
L7.5 Conclusions and recommendations 80
L7.6 Future considerations 81
L8 Assessment of the potential hazard of induced Seismicity 82
L8.1 Introduction 82
L8.2 Deterministic seismic hazard assessment methodology 82
Seismic source parameters 83 L8.2.1
Seismic pathways 84 L8.2.2
L8.3 Deterministic seismic hazard assessment results 86
Ground motion prediction comparison 87 L8.3.1
Deterministic seismic hazard results – during exploration 90 L8.3.2
L9 Quantify the likely significant effects from induced seismic events 96
L9.1 Introduction 96
L9.2 Significance Criteria 96
L9.3 Seismic Receptors 99
Ground Motion Criteria 99 L9.3.1
Receptor Locations 100 L9.3.2
L9.4 Significance of Effects 100
Significance of Effects of the Ground Motion Hazard 100 L9.4.1
Maximum considered magnitude 3.1 ML earthquake scenario L9.4.2(without implementation of embedded mitigation measures)103
Effects of liquefaction 104 L9.4.3
Effects of slope instability 104 L9.4.4
Effects of settlement causing surface deflections from gas L9.4.5extraction 104
Effects of settlement from gas extraction causing earthquakes105 L9.4.6
Effects of fluid migration and changes in the stress regime in L9.4.7the Bowland Basin inducing seismicity in deep basement faults 105
Effects of ground motion hazard causing salt cavern L9.4.8instability at the nearby Preesall salt mine 106
Cumulative and interactive effects of the Preston New Road L9.5.1and Roseacre Wood works occurring together 107
Cumulative and interactive effects of hydraulic fracturing and L9.5.2initial flow testing occurring together on the same well pad 108
Cumulative and interactive effects of initial flow testing and L9.5.3drilling occurring together at the same well pad 108
Cumulative and interactive effect of Preston New Road L9.5.4occurring at the same time as other developments in the area108
L9.6 Assessment summary matrix 109

Cuadrilla Bowland Limited Temporary shale gas exploration at Preston New Road Environmental Statement
Draft 3 | 24 May 2014
C:\RICHARD\RICHARD - WORK\JOBS\CUADRILLA\ISSUED DOCUMENTS\PRESTON NEW ROAD\2015-05-29 ES & PL DOCS FINAL\ES VOL 2 FINAL
APPENDICIES\PNR_ES_VOL2_APPNDX L_INDUCED SEISMICITY.DOCX
L10 Induced seismicity mitigation measures 112
L10.1 Introduction 112
L10.2 Mitigation measures – site selection and site characterisation113
Review of desk based information 113 L10.2.1
3D geophysical (seismic) survey 113 L10.2.2
Faults and hydraulic fracturing 116 L10.2.3
Conclusion 117 L10.2.4
L10.3 Mitigation measures – risk based geomechanical assessment117
L10.4 Mitigation measures – baseline seismic monitoring 118
L10.5 Mitigation measures - fracture evolution and operational mitigation 119
Mitigation measures – mini-fracture 120 L10.5.1
Mitigation measures - reduced injection volumes per stage L10.5.2compared to Preese Hall 120
L10.6 Mitigation measures - microseismic monitoring of fracture growth 121
L10.7 Mitigation measures – Traffic Light System during hydraulic fracturing (pumping) 122
Green level: <0 ML 123 L10.7.1
Amber level: 0 ML to < 0.5 ML 123 L10.7.2
Red level: >0.5 ML 123 L10.7.3
Flowback 126 L10.7.4
L10.8 Instrumentation 126
Monitoring system – surface array 127 L10.8.1
L10.9 Summary of seismic monitoring system 130
L10.10 Alternatives to the Traffic Light System thresholds 130
L10.11 Summary of mitigation 131

Cuadrilla Bowland Limited Temporary shale gas exploration at Preston New Road Environmental Statement
Draft 3 | 24 May 2014 C:\Richard\Richard - Work\Jobs\Cuadrilla\Issued Documents\Preston New Road\2015-05-29 ES & PL Docs FINAL\ES Vol 2 Final Appendicies\PNR_ES_Vol2_Appndx L_Induced Seismicity.docx
Page L1
Terminology
1. Where ‘the Site’ is referred to in the text, this refers to the Preston New Road well site. Where ‘the Project’ is referred to in the text this refers to the activities at the site, including the construction of the well, the operational activities (i.e. hydraulic fracturing and flow testing) and the decommissioning activities. The Project description is discussed further in the Proposed Development chapter (Chapter 4).
2. It is noted that the terms ‘induced seismicity’ and ‘triggered’ seismicity are defined in the explanation of key terms in Section L3.1. The terms are used explicitly.

Cuadrilla Bowland Limited Temporary shale gas exploration at Preston New Road Environmental Statement
Draft 3 | 24 May 2014 C:\Richard\Richard - Work\Jobs\Cuadrilla\Issued Documents\Preston New Road\2015-05-29 ES & PL Docs FINAL\ES Vol 2 Final Appendicies\PNR_ES_Vol2_Appndx L_Induced Seismicity.docx
Page L2
L1 Introduction
3. Cuadrilla Bowland Ltd (Cuadrilla) propose to carry out exploration and testing activities for the extraction of shale gas at the Preston New Road well site, Lancashire. This Appendix of the Environmental Statement (ES) presents an assessment of the likely significant environmental effects of induced seismicity in relation to Cuadrilla’s proposed (construction, exploration and decommissioning) activities at the Site.
4. This Appendix of the ES describes the background to seismicity (natural and induced), the legislation and guidance in the context of induced seismicity related to shale gas and hydraulic fracturing, the baseline conditions at the Site (including, but not limited to, the geology, stress regime, background seismicity and the findings of a site walkover), the assessment of seismic hazards and assessment of the likely significant effects associated with the Project. On the basis of the results of the assessment a specification for seismic monitoring is proposed, along with other measures to be utilised for the mitigation of the risks associated with induced seismicity at the Site.
5. This Appendix on induced seismicity has been prepared by Arup in consultation with internationally recognised technical experts in the field of rock mechanics, hydraulic fracturing and engineering seismology. In addition to the UK based guidance on hydraulic fracturing from the Department of Energy and Climate Change (DECC)
1, relevant international guidance documents have been reviewed
along with reports on hydraulic fracturing for shale gas in the UK and worldwide. DECC have suggested the UKOOG onshore shale gas well guidelines
2 be the
basis for regulations and their recommendations be implemented. New controls were also been announced by the Secretary of State for Energy and Climate Change issued as a written statement to the UK Parliament on the 13th December 2012
3. These documents are the prevailing sources of recommendations for good
industry practice.
L1.1 Site Location
6. The Preston New Road Site is located within the vicinity of the village of Little Plumpton, Lancashire, approximately 7.5km south-east of the centre of Blackpool. The site location is described in more detail within Section L6.1 and a Red Line drawing of the site is presented within Figure 1. The Red Line indicates the proposed possible extent of underground engineering activities.
1 Department for Energy and Climate Change (DECC). (2014). Fracking UK shale: understanding
earthquake risk.
<URL:https://www.gov.uk/government/uploads/system/uploads/attachment_data/file/283837/Seis
mic_v3.pdf> [site accessed 22/05/2014] 2 UK Onshore Operators Group (UKOOG). UK onshore shale gas well guidelines – exploration
and appraisal phase. Issue 1. February 2013. 3 Department for Energy & Climate Change (2012). Written Ministerial statement by Edward
Davey: Exploration for shale gas. <URL: https://www.gov.uk/government/speeches/written-
ministerial-statement-by-edward-davey-exploration-for-shale-gas> [site accessed 28/04/2014].

Cuadrilla Bowland Limited Temporary shale gas exploration at Preston New Road Environmental Statement
Draft 3 | 24 May 2014
C:\RICHARD\RICHARD - WORK\JOBS\CUADRILLA\ISSUED DOCUMENTS\PRESTON NEW ROAD\2015-05-29 ES & PL DOCS FINAL\ES VOL 2 FINAL APPENDICIES\PNR_ES_VOL2_APPNDX L_INDUCED SEISMICITY.DOCX
Page L3
Figure 1: Red Line Drawing for the Preston New Road well site. The ‘Red Line’ defines the planning boundary.

Cuadrilla Bowland Limited Temporary shale gas exploration at Preston New Road Environmental Statement
Draft 3 | 24 May 2014
C:\RICHARD\RICHARD - WORK\JOBS\CUADRILLA\ISSUED DOCUMENTS\PRESTON NEW ROAD\2015-05-29 ES & PL DOCS FINAL\ES VOL 2 FINAL
APPENDICIES\PNR_ES_VOL2_APPNDX L_INDUCED SEISMICITY.DOCX
Page L4
L1.2 Context of the Project
7. Induced seismicity associated with the process of hydraulic fracturing for shale gas, whilst not common, is well documented internationally and recently within the UK
4 5. Most of the seismicity induced by human activities such as mining and
subsurface reservoir engineering cannot be felt by humans at the surface and can only be measured by very sensitive seismic instruments. In rare cases the induced seismicity may be felt and in very rare cases may cause damage to the built environment, although no damage has been demonstrated to be as a result of hydraulic fracturing for shale gas.
8. In the UK the common perception is that induced seismicity is closely linked with the exploration and extraction of shale gas by the action of hydraulic fracturing for the shale gas. However, induced seismicity has also been linked to other oil and gas extraction operations
6 and other activities that have been common practice in
the UK and overseas, such as reservoir impoundment7, quarrying, mining
8
(particularly coal mining in the UK), Enhanced Geothermal Systems (EGS)9 and
underground fluid extraction and disposal. A study carried out by the National Research Council in the US
10 of induced seismicity in energy technologies found
that of 35,000 shale gas wells drilled and hydraulically fractured prior to 2012 there was one case of a felt induced seismic event (where they have defined a felt event as greater than 2ML) with a maximum magnitude of 2.8ML.
9. Natural and induced seismicity are both caused by some form of shear slip on a discontinuity within a rock mass (typically a fault or fracture). Therefore it is often difficult to distinguish between naturally occurring events and anthropogenically induced events
11. The magnitude of the resultant seismic event
depends on the area of slip, amount of movement and the resistance of the rock mass to shear. Anthropogenic induced events are typically identified by their spatial and temporal relationship to the man-made activities to which they can be associated. In the context of hydraulic fracturing for shale gas, the (physical) mechanisms involved in the production of seismic events includes stress changes on a plane of weakness (e.g. fault) caused by 1) the growth of the engineered
4 De Pater, C.J., Baisch, S. (2011). Geomechanical study of Bowland Shale seismicity. Synthesis
Report. 5 Eisner, L., Styles, P., Clarke, H. (2013). Felt induced seismicity associated with shale gas
hydraulic stimulation in Lancashire, UK. 75th EAGE Conference and Exhibition incorporating
SPE EUROPEC 2013. 6 Eck, T.V., Goutbeek, F., Haak, H., Dost, B. (2006). Seismic hazard due to small-magnitude,
shallow-source, induced earthquakes in The Netherlands. Engineering Geology. Vol.87; pp.105-
121. 7 Choudhury, S., Gautam, P, K. (2013). Seismicity and reservoir induced crustal motion study
around the Tehri Dam, India. Acta Geophysica. Vol.61; pp.923-934. 8 Fritschen, R. (2010). Mining-induced seismicity in the Saarland, Germany. Pure Applied
Geophysics. Vol.167; pp.77-89. 9 Bommer, J.J., Oates, S., Cepeda, J, M., Lindholm, C., Bird, J., Torres, R., Marroquin, G., Rivas,
J. (2006). Control of hazard due to seismicity induced by a hot fractured rock geothermal project.
Engineering Geology. Vol.83; pp.287-306. 10
National Research Council of the National Academies (2013). Induced Seismicity Potential in
Energy Technologies, National Academy of Sciences, USA 11
Shale Gas Information Platform (SHIP). <URL: http://www.shale-gas-information-
platform.org/areas/basics-of-shale-gas/induced-seismicity.html>

Cuadrilla Bowland Limited Temporary shale gas exploration at Preston New Road Environmental Statement
Draft 3 | 24 May 2014
C:\RICHARD\RICHARD - WORK\JOBS\CUADRILLA\ISSUED DOCUMENTS\PRESTON NEW ROAD\2015-05-29 ES & PL DOCS FINAL\ES VOL 2 FINAL
APPENDICIES\PNR_ES_VOL2_APPNDX L_INDUCED SEISMICITY.DOCX
Page L5
fractures; and 2) the transmission of fluid pressure increase into a critically stressed fault
12
10. Further detail with regard to induced and natural seismicity is provided within Sections L3.2, L3.3 and L3.4 of this report.
12
Frohlich, C., Brunt., M. (2013). Two-year survey of earthquakes and injection/production wells
in the Eagle Ford Shale, Texas, prior to the MW 4.8 20 October 2011 earthquake. Earth and
Planetary Science Letters. Vol.379, pp. 56-63.

Cuadrilla Bowland Limited Temporary shale gas exploration at Preston New Road Environmental Statement
Draft 3 | 24 May 2014
C:\RICHARD\RICHARD - WORK\JOBS\CUADRILLA\ISSUED DOCUMENTS\PRESTON NEW ROAD\2015-05-29 ES & PL DOCS FINAL\ES VOL 2 FINAL
APPENDICIES\PNR_ES_VOL2_APPNDX L_INDUCED SEISMICITY.DOCX
Page L6
L2 Relevant legislation, policy and guidance
11. This section provides a discussion of relevant legislation, guidance and standards in the context of induced seismicity in the UK and seismic hazard assessment methodology.
12. Currently DECC are responsible for the mitigation of seismic risks associated with shale gas exploration in the UK. The planning and regulatory system for shale gas exploration has been discussed in detail in the Planning Statement accompanying this EIA. This section focuses specifically on induced seismicity.
13. The natural seismic hazard in the UK is considered relatively low in comparison to other more seismically active regions in the world. In addition, most legislation and guidance predominantly relates to natural occurring earthquakes. However, on December 13
th 2012, The Secretary of State for Energy and Climate Change
issued a written statement to the UK Parliament announcing new controls to mitigate the risks associated with hydraulic fracturing operations for shale gas
3.
These controls are outlined further in Table 1 below. This includes the implementation of a traffic light system with a remedial action level set at magnitude 0.5ML, for initial operations with the Bowland Basin. A discussion of current guidance is presented below.
14. US legislation has some good guidance for assessing and mitigating induced seismic hazard associated with enhanced geothermal systems (EGS), which has been discussed in Section L2.1 below.
15. There are several guidance notes published in the UK including:
Green, C.A., Styles, P., and Baptie, B.J. (2012). Preese Hall Shale Gas Fracturing Review and Recommendations for Induced Seismic Mitigation
13;
The Royal Society and The Royal Academy of Engineering. (2012). Shale gas extraction in the UK: a review of hydraulic fracturing (DES2597)
14;
The UK Onshore Operators Group (UKOOG). (2013). UK Onshore Shale Gas Well Guidelines
2; and
The Department for Energy and Climate Change (DECC). (2014)1
L2.1 United States of America (USA) legislation and policy
16. In the USA, induced seismicity associated with the EGS project at The Geysers, California caused public concern and prompted policy makers to commission the development of a protocol to deal with the risks and mitigation measures associated with EGS induced seismicity. The resulting protocol was published in January 2012:
US. Department of Energy. (2012). Protocol for addressing induced seismicity associated with Enhanced Geothermal Systems. January 2012. DOE/EE-0662
15.
13
Green, C.A., Styles, P., Babtie, B.J. (2012). Preese Hall shale gas fracturing: review and
recommendations for induced seismic mitigation. 14
The Royal Society and the Royal Academy of Engineering. (2012). Shale gas extraction in the
UK: a review of hydraulic fracturing.

Cuadrilla Bowland Limited Temporary shale gas exploration at Preston New Road Environmental Statement
Draft 3 | 24 May 2014
C:\RICHARD\RICHARD - WORK\JOBS\CUADRILLA\ISSUED DOCUMENTS\PRESTON NEW ROAD\2015-05-29 ES & PL DOCS FINAL\ES VOL 2 FINAL
APPENDICIES\PNR_ES_VOL2_APPNDX L_INDUCED SEISMICITY.DOCX
Page L7
17. This protocol is intended to provide developers, public officials and regulators a set of general guidelines for the assessment of the effects of induced seismicity relating to EGS projects. The framework comprises the following key aspects for addressing induced seismicity:
Perform a preliminary screening evaluation;
Implement an outreach and communication program;
Review and select criteria for ground vibration and noise;
Establish seismic monitoring;
Quantify the hazard from natural and induced seismic events;
Characterise the risk of induced seismic events; and
Develop a mitigation plan.
18. Although this protocol is targeted at EGS projects, the framework is considered transferable for addressing the risk of induced seismicity associated with onshore hydraulic fracturing. Indeed, DECC
1 have recommended this protocol be used in
the absence of any national policy.
L2.2 European legislation and policy
19. As a member state of the European Union (EU), UK legislation should reflect the policies of EU Directives. The Environmental Impact Assessment (EIA) Directive 2011/92/EU
16 requires and EIA screening for deep drilling projects and surface
installation for the extraction of oil and gas. An EIA will be expected to address all relevant environmental risks including seismic hazard.
L2.3 UK national legislation, policy and guidance
20. All petroleum resources in the UK are owned by the Crown and the right to exploit them is governed by DECC. DECC has adopted a Traffic Light System recommended by Green et al. (2012)
13 and outlined in Table 1 below.
The guidance documents on the regulation of shale gas extraction, and specifically in relation to induced seismicity, that have been published to date have been summarised within Table 1 below.
15
US. Department of Energy. (2012). Protocol for addressing induced seismicity associated with
Enhanced Geothermal Systems. January 2012. DOE/EE-0662. 16
Directive 2011/92/EU of the European Parliment and of the Council of 13 December 2011 on
the assessment of the effects of certain public and private projects on the environment. (2012).
<URL: http://eur-
lex.europa.eu/LexUriServ/LexUriServ.do?uri=OJ:L:2012:026:0001:0021:EN:PDF> [site accessed
28/04/2014].

Cuadrilla Bowland Limited Temporary shale gas exploration at Preston New Road Environmental Statement
Draft 3 | 24 May 2014
C:\RICHARD\RICHARD - WORK\JOBS\CUADRILLA\ISSUED DOCUMENTS\PRESTON NEW ROAD\2015-05-29 ES & PL DOCS FINAL\ES VOL 2 FINAL
APPENDICIES\PNR_ES_VOL2_APPNDX L_INDUCED SEISMICITY.DOCX
Page L8
Table 1: Summary of UK guidance relevant to the regulation of induced seismicity
associated with shale gas.
UK Legislation/guidance Comments in relation to induced seismicity
The Royal Society and The Royal Academy of Engineering report
14
DECC should consider how induced seismicity is to be regulated.
The protocols for addressing induced seismicity associated with Enhanced Geothermal Systems (EGS) in the U.S should be used, including the assessment methodology and mitigation measures.
Other recommendations include the following:
1) Operators should carry out site specific surveys to characterise and identify local stresses and faults;
2) Seismicity should be monitored before, during and after hydraulic fracturing.
3) The traffic light system should be implemented.
Green et al. (2012)13
DECC has adopted the following:
Seismic hazard should be assessed, including baseline seismic monitoring, geological characterisation (including faulting) and application of suitable ground motion prediction equations.
Traffic light system considered industry best practice as a mitigation strategy – reduced shutdown threshold of 1.7 ML
(originally proposed by de Pater and Baisch 20114) to 0.5 ML.
Traffic light system requires a “suitable number of seismometers” buried at the surface or in boreholes at greater depths – no specific details on recommended array design.
Recommend real time monitoring of seismometers to a minimum of magnitude -1 ML.
Consider reducing fluid injection volumes and implementing flowback after a 0.5ML event.
UKOOG – UK Onshore Shale Gas Well Guidelines
2
Recommends comprehensive desk based reviews and site specific surveys to develop the geological knowledge of the play area.
Traffic Light System should be used to mitigate induced seismicity. Need not be magnitude based and can be based on ground motions.
Hydraulic fracturing plan required.
An evolutionary approach to risk assessment and mitigation should be adopted by operators whereby more conservative assessments and controls are adopted at the exploration phase. As experience is gained within the area, and where induced seismic events have not occurred, operators may propose different monitoring and mitigation measures.
Written Ministerial Statement by the Secretary of State for Energy and Climate Change for the exploration for shale gas (2010)
11
Requires a review of existing information on faults in the area of the proposed well and monitoring of background seismicity before operations commence.
Real time seismic monitoring should also continue during operations, with these subject to a “traffic-light” regime, so that operations can be quickly paused and data reviewed if unusual levels of seismic activity is observed.
Requirement for operators to take a more cautious approach to the duration and volumes of fluid used in the hydraulic fracturing itself with a hydraulic fracturing plan to be submitted to department before consent is given for any hydraulic fracturing. The hydraulic fracturing plan should be progressive, starting with the injection of small volumes of fluid and analysing the resulting data carefully before the full stage. Each

Cuadrilla Bowland Limited Temporary shale gas exploration at Preston New Road Environmental Statement
Draft 3 | 24 May 2014
C:\RICHARD\RICHARD - WORK\JOBS\CUADRILLA\ISSUED DOCUMENTS\PRESTON NEW ROAD\2015-05-29 ES & PL DOCS FINAL\ES VOL 2 FINAL
APPENDICIES\PNR_ES_VOL2_APPNDX L_INDUCED SEISMICITY.DOCX
Page L9
UK Legislation/guidance Comments in relation to induced seismicity
stage of the frac will be carefully designed to use just enough fluid to create a fracture sufficient to enable gas to flow. A flowback period will be required immediately after each stage to re-balance the pressures. Real-time recording of earthquakes during and for 24 hours after each stage of the frac will be analysed to look for abnormal induced events amidst the normal background seismicity.
Operators will also be required to monitor the growth in height of the frac away from the borehole.
The remedial action level for the traffic light system (red light) will be set at magnitude 0.5ML.
L2.4 Regional legislation and policy
21. In West Lancashire, the Regional Spatial Strategy is the North West of England Plan
17. The North West of England Plan sets out the long-term spatial planning
framework for the region up to 2021. The Plan was adopted in September 2008 and there are no specific polices in this document relevant to induced seismicity.
L2.5 Local legislation and policy
22. The Joint Lancashire Minerals and Waste Development Framework Core Strategy Development Plan Document, 2009
18 provides no specific reference to seismicity.
However, Policy CS5 of the Development Plan Document18
refers to the economic well-being and safety of the population by the introduction of high operating standards, sensitive working practices and environmental management systems that minimise harm and nuisance to the environment and local communities throughout the life of the development.
23. The Lancashire Minerals and Waste Local Plan, 200619
, provide no specific reference to seismicity. However, Policy 2 – ‘Quality of Life’ discusses (in general terms) factors which lead to the loss of or damage to amenity.
24. The West Lancashire Replacement Local Plan 2001 – 201620
, provides no specific reference to seismicity.
25. The West Lancashire Local Plan 2012 – 202721
provides no specific reference to seismicity.
L2.6 Conclusions and recommendations
26. On the basis of the review of relevant legislation and policy the following conclusions and recommendations have been made with regard to the assessment
17
Government Office for the North West. (2008). The North West of England Plan Regional
Spatial Strategy to 2021. 18
The Joint Advisory Committee for Strategic Planning Lancashire County Council, Blackburn
with Darwen Borough Council, Blackpool Council. (2009). Joint Lancashire Minerals and Waste
Development Framework Core Strategy Development Plan Document. 19
The Joint Advisory Committee for Strategic Planning Lancashire County Council, Blackburn
with Darwen Borough Council, Blackpool Council. (2006). Lancashire Minerals and Waste Local
Plan. 20
West Lancashire District Council. (2006). West Lancashire Local Plan 2001 – 2016. 21
West Lancashire District Council. (2012). West Lancashire Local Plan 2012 - 2027

Cuadrilla Bowland Limited Temporary shale gas exploration at Preston New Road Environmental Statement
Draft 3 | 24 May 2014
C:\RICHARD\RICHARD - WORK\JOBS\CUADRILLA\ISSUED DOCUMENTS\PRESTON NEW ROAD\2015-05-29 ES & PL DOCS FINAL\ES VOL 2 FINAL
APPENDICIES\PNR_ES_VOL2_APPNDX L_INDUCED SEISMICITY.DOCX
Page L10
of the likely significant effects of induced seismicity associated the exploration and extraction of shale gas:
US DoE protocol15
for addressing induced seismicity associated with EGS to be adopted as a framework for assessing the likely significant effects of induced seismicity at the Site;
European Directives do not refer to induced seismicity, however the environmental impacts related to induced seismicity would be covered by the Environmental Impact Assessment Directive (2011/92/EU)
16;
Subsequently the policy in the context of EIA is contained within European Directives and equivalent UK national legislation;
Currently DECC are responsible for the mitigation of seismic risks associated with shale gas exploration in the UK, and DECC have adopted a traffic light system proposed by Green et al. (2012)
13.
27. UKOOG recommendations are:
“Operators should consider the risks of these induced seismic events as part of their general duty to assess the risks arising from well operations. Using the risk-based approach will enable operators to demonstrate that adequate controls are in place to eliminate the event or to minimise any potential impact”;
“An evolutionary approach to risk assessment and mitigation should be adopted by operators whereby more conservative assessments and controls are adopted at the exploration/appraisal phase of a development”;
“The risks of fault movement can be mitigated by the identification of stressed faults and where practicable, by the avoidance of fracturing fluids entering stressed faults”;
“Operators should carry out site-specific surveys prior to hydraulic fracturing to characterise local stresses and identify nearby faults. Site characterisations could include desk-based studies of existing geological maps, seismic reflection data, and background seismicity data from the BGS”;
“Once faults have been identified and geological stresses characterised, operators can assess the orientation and slip tendency of faults and bedding planes”;
“The fracture behaviour of a particular formation is commonly characterised using small pre-fracturing injection tests with microseismic monitoring. Subsequent operations can then be modified accordingly”; and
“Traffic light monitoring systems should be used”.
28. These mitigation measures are discussed in more detail within the mitigation measures section, Section L10.

Cuadrilla Bowland Limited Temporary shale gas exploration at Preston New Road Environmental Statement
Draft 3 | 24 May 2014
C:\RICHARD\RICHARD - WORK\JOBS\CUADRILLA\ISSUED DOCUMENTS\PRESTON NEW ROAD\2015-05-29 ES & PL DOCS FINAL\ES VOL 2 FINAL
APPENDICIES\PNR_ES_VOL2_APPNDX L_INDUCED SEISMICITY.DOCX
Page L11
L3 Background
L3.1 Explanation of key terms
29. This explanation of key terms provides definitions of key terms associated with Induced Seismicity defined for the purposes of this chapter. More detailed and comprehensive glossaries are found at the beginning of this ES.
Buried array – Cuadrilla will install a buried microseismic monitoring array (up to 100m below ground level) to confirm that hydraulic fracturing will not take place within or close to existing critically stressed faults. This array will comprise approximately 10 real time stations and approximately 70 store and harvest stations.
Felt seismicity – Seismic event that can be detected by humans. Typically an event with a magnitude between 1.0-2.0ML is not felt, except by a very few under especially favourable conditions
1.
Hydraulic fracturing – The process of injecting pressurised fluid into rock formations with the aim to form and or open fractures in the rock mass. Proppant is usually added to hold fractures open after fluid pressure is reduced.
Hydraulic Fracture Programme (HFP) – Before an operator can commence hydraulic fracture operations a HFP should be authorised by DECC. In accordance with DECC requirements on the HFP
22 (referred to as the ‘frac
plan’ by DECC), the HFP should contain the following information:
1) “Depth structure maps showing mapped faults near the well and along the well path, with a summary assessment of faulting and formation stresses in the area and the risk that the frac operations could reactivate existing faults.
2) Information on the local background seismicity (using BGS data or other data) and assessment of the risk of induced seismicity.
3) Summary of the planned fraccing ops, including perf stages, pumping pressures and volumes.
4) If in a field, a comparison of proposed activity to any previous frac operations and relationship to historical seismicity.
5) Proposed measures to mitigate the risk of inducing an earthquake and monitoring of local seismicity during the operations.
6) For shale gas fracs, a description of proposed real-time traffic light scheme for seismicity, and proposed method for fracture height monitoring.”
Induced seismic event – Defined as seismic activity induced by stress or strain perturbations resulting from anthropogenic sources. Events are only
22
Department for Energy and Climate Change (2014). <URL:
https://www.gov.uk/government/uploads/system/uploads/attachment_data/file/79173/Extended_w
ell_tests_and_Frac_Plan.docx>.

Cuadrilla Bowland Limited Temporary shale gas exploration at Preston New Road Environmental Statement
Draft 3 | 24 May 2014
C:\RICHARD\RICHARD - WORK\JOBS\CUADRILLA\ISSUED DOCUMENTS\PRESTON NEW ROAD\2015-05-29 ES & PL DOCS FINAL\ES VOL 2 FINAL
APPENDICIES\PNR_ES_VOL2_APPNDX L_INDUCED SEISMICITY.DOCX
Page L12
categorised as induced, when they release less energy than it takes to initiate them
23.
Magnitude – Magnitude is the value that characterises the relative size or energy released of an earthquake at the source. Magnitude is calculated on observations of the amplitude of the ground motions recorded by seismographs located locally and around the world
24. There are a number of
different magnitude scales, which can be converted by empirical relationships.
In this document seismic events are referred to in ‘local magnitude or ML’. The local magnitude scale is commonly used in the field of induced seismicity due the suitability of this scale to shallow, low magnitude and short distance seismic events.
Microseismicity – A small seismic event, usually with a magnitude less than 2.0
25.
Mini-fracture – Before undertaking the main hydraulic fracturing stage, a pilot hydraulic fracturing stage or “mini-fracture” may be performed. This involves pumping small volumes of fracturing fluid (without any proppant) into the well. The purpose of the mini-fracture is to evaluate the injection pressure required to generate fractures in the rock during the subsequent main hydraulic fracturing stage.
Regional fault – A regional fault is here defined as fault identified by the British Geological Survey and presented on their 1:50,000 scale mapping.
Surface array – Cuadrilla will install a surface seismic monitoring array, which will be used to collect seismic data before, during and after hydraulic fracturing. The seismic array will also be used for the purpose of implementing the TLS. This array will comprise 8 surface stations (buried in approximately 1m deep pits).
Traffic Light System – This is a monitoring and decision-making tool regarding the duration and intensity of fluid injection during hydraulic fracturing stages (as it has been used in the geothermal industry). The traffic light system is based on the observed effect of small magnitude seismicity as a precursor to larger magnitude events (i.e. the trailing effect – described below). DECC
1 have recommended that a 0.5 ML red light threshold be used
to limit induced seismicity to below the level that may be felt by humans (see Section L10.6 for further details).
Trailing effect (post-injection magnitude increase) – The unit increase in the magnitude of seismicity following the termination of injection. The driving force for this post-injection seismicity is temporary on-going pressure diffusion within the reservoir.
23
McGarr, A., Simpson, D., Seeber, L., (2002). Case histories of induced and triggered seismicity.
International Handbook of Earthquake and Engineering Seismology. Vol 81A. 24
Palacios, P., Molina, I., Segovia, M. (2006). The Gutenberg-Richter Law: Assumptions,
Limitations and Interpretations. Statistics in Volcanology. Special Publications of IAVCEI. Vol.1,
pp.115-127. 25
Bohnhoff, M., Dresen , G., Ellsworth, L., Ito, H. (2010). Passive seismic monitoring of natural
and induced earthquakes: Case studies, future directions and socio-economic relevance. In:
Cloetingh, S., Negendank, J. (eds.), New Frontiers in Integrated Solid Earth Sciences, International
Year of Planet Earth, DOI 10.1007/978-90-481-2737-5_7, Springer Science+Business B.V.

Cuadrilla Bowland Limited Temporary shale gas exploration at Preston New Road Environmental Statement
Draft 3 | 24 May 2014
C:\RICHARD\RICHARD - WORK\JOBS\CUADRILLA\ISSUED DOCUMENTS\PRESTON NEW ROAD\2015-05-29 ES & PL DOCS FINAL\ES VOL 2 FINAL
APPENDICIES\PNR_ES_VOL2_APPNDX L_INDUCED SEISMICITY.DOCX
Page L13
The observed trailing effect of the induced seismicity at the Preese Hall-1 well was a magnitude unit increase of 0.9
4. Observed trailing effects in other cases
of reservoir stimulation have led to a magnitude unit increase of 0.8 after shut-in (i.e. Deep- Heat-Mining Project, Basel
36). De Pater and Baisch (2011)
4
consider the post-injection magnitude increase of 0.9 magnitude units to represent a worst case scenario. For conservatism, this assessment considers a worst case post-injection magnitude increase of 1.0 magnitude units.
Triggered seismic event – Seismic event that is caused by only a small change in stress or by migration of fluids into a pre-stressed, pre-existing fault. Triggered events are sometimes referred to as fault reactivation. Triggered seismic events release more energy than is required to initiate them
23.
L3.2 Summary of natural seismicity in the UK
30. In the UK the level of natural seismicity is considered relatively low in comparison to the other parts of the world. Based on the historical frequency of earthquakes within the UK, a magnitude 5.6 ML earthquake is expected to occur once every 100 years, a magnitude 4.7 ML earthquake is expected to occur once every ten years, and a magnitude 3.7 ML earthquake is expected to occur once every 1 year
26. The largest possible earthquake in the UK is expected to be around
magnitude 6.5 ML and is estimated to occur approximately every 1,000 years. According to the British Geological Survey (BGS), the largest known British earthquake occurred approximately 60 miles offshore near the Dogger Bank in 1931 with a magnitude of 6.1ML
27.
31. The British Geological Survey (BGS) maintains the UK earthquake database, which is monitored on a network of over 100 stations
28. The completeness of the
UK earthquake database is discussed within Section L6.6.
32. The spatial distribution of British earthquakes is presented within Figure 2, which indicates recorded earthquakes to be most prevalent within western areas of England and Scotland and most areas of Wales. Earthquakes are largely absent from eastern Scotland and Ireland.
33. Most British earthquakes are low magnitude and typically cause no damage, although occasionally British earthquakes have caused some minor damage such as the Magnitude 5.2ML Market Rasen earthquake in 2008 that caused minor structural damage to some properties, the worst of which was a chimney collapse
29.
34. More specific details on the natural seismicity in the Fylde area are included within Section L6.6.
26
British Geological Survey. (2013). <URL:
http://www.earthquakes.bgs.ac.uk/monitoring/detection_stats.html> [site accessed 22/07/2013] 27
British Geological Survey (2014). <URL:
http://www.bgs.ac.uk/discoveringGeology/hazards/earthquakes/UK.html>[site accessed
11/03/2014] 28
British Geological Survey. <URL: http://www.earthquakes.bgs.ac.uk/monitoring/home.html>
(site accessed: 25/09/2013). 29
Musson, R.M.W. (2011). The macroseismic survey of the 27 February 2008 Market Rasen
earthquake. British Geological Survey Internal Report OR/08/029.

Cuadrilla Bowland Limited Temporary shale gas exploration at Preston New Road Environmental Statement
Draft 3 | 24 May 2014
C:\RICHARD\RICHARD - WORK\JOBS\CUADRILLA\ISSUED DOCUMENTS\PRESTON NEW ROAD\2015-05-29 ES & PL DOCS FINAL\ES VOL 2 FINAL
APPENDICIES\PNR_ES_VOL2_APPNDX L_INDUCED SEISMICITY.DOCX
Page L14
Figure 2: Spatial distribution of natural seismicity (red) and coal-mining induced seismicity (green) in the UK from 1382 to 2012
14.
L3.3 Summary of induced seismicity
35. Induced seismicity refers to seismic events that are induced by stress perturbations resulting from anthropogenic activity.
36. Induced seismicity has been widely studied for several decades in the UK in the context of a variety of below-ground activities that are summarised in Table 2.
Table 2: Summary of the potential magnitude ranges (from published information) for induced seismic events associated with various below ground activities.
Activity Published magnitude range
Damage comments UK example
Mining 1.6 to 5.639
(Max 5.6 M event - coal mining in Australia)
30
Damage typically limited to the mine. Some minor damage to surface structures has been recorded.
Many seismic events recorded in the UK with magnitudes up to 3.1 ML, but events up to 3.4 ML may be possible.
30
Bennett, T.J., Marshall, M.E., Mclaughlin, K.L., Barker, B.W., Murphy, J.R. (1996).
Seismic characteristics and mechanisms of rockbursts. In: Proceedings of the
18th
Annual Seismic Research Symposium on Monitoring a Comprehensive Test Ban Treaty
Phillips Laboratory. Vol. 153, pp. 901-907.

Cuadrilla Bowland Limited Temporary shale gas exploration at Preston New Road Environmental Statement
Draft 3 | 24 May 2014
C:\RICHARD\RICHARD - WORK\JOBS\CUADRILLA\ISSUED DOCUMENTS\PRESTON NEW ROAD\2015-05-29 ES & PL DOCS FINAL\ES VOL 2 FINAL
APPENDICIES\PNR_ES_VOL2_APPNDX L_INDUCED SEISMICITY.DOCX
Page L15
Activity Published magnitude range
Damage comments UK example
Tunnelling -1.0 to 2.4 (construction of the Gotthard Base tunnel)
31
Felt at the surface, however no damage. “Considerable” damage to the tunnel from rock bursts and floor uplift
31.
Conventional oil and gas extraction
Depletion: 1.0 to 7.339
(Max 7.3 Gazil, Uzbekistan
32; 3.6 MW
Groningen, Netherlands
33)
Injection: 1.9 to 5.139
Groningen, Netherlands – some structural damage but mainly non-structural damage.
Magnitude 4.4 event associated with conventional oil extraction at the Ekofisk field in the UK North Sea region
32.
Impoundment of dams/ reservoirs
2.0 to 6.339
(Max 6.3 Koyna, India)
34
Possible 7.9 MW event
Koyna earthquake killed over 200 people and injured over 1500 people
34.
Kielder Dam.
Waste disposal Fluid injection: 2.0 to 5.6 MW
35
The largest event (5.7MW) in central Oklahoma destroyed 14 homes and killed two people
35.
Waste disposal through fluid injection is banned in the UK.
Enhanced Geothermal Systems (EGS)
1.0 to 4.639
(Max 4.6 Geysers, California
36).
Basel magnitude 3.4 ML event caused small non-structural damage (hairline cracks to plaster or damage to paintwork) in hundreds of buildings
36,37.
Rosemanowes (HDR) study recorded events magnitude 2.0 ML
38.
Shale gas -3.0 to maximum of 3.8ML at Horn River, British Columbia
41.
No recorded damage. Magnitude 2.3 ML
recorded at Preese Hall.
31
Hussen, S., Kissling, E., Von Deschwanden, A. (2013). Induced seismicity during the
construction of the Gotthard Base Tunnel, Switzerland: hypocenter locations and source
dimensions. Journal of Seismology. Vol. 17, pp.63-81. 32
Mirzoev, K.M., Nikolaev, A.V., Lukk, A.A., Yunga, S.L. (2009). Induced seismicity and
the possibilities of controlled relaxation of tectonic stresses in the Earth’s crust.
Physics of the Solid Earth. Vol. 45, pp.885-904. 33
KNMI report. (2013) Report on the expected PGV and PGA values for induced earthquakes in
the Groningen area. Report for 34
Gupta, H.K. (1985). The present status of reservoir induced seismicity investigations
with special emphasis on Koyna earthquakes. Tectonophysics. Vol. 118, pp.257-279. 35
Ellsworth, W.L. (2013). Injection-induced earthquakes. Science. Vol.341. 36
Deichmann. N., Giardini, D. (2009). Earthquakes induced by the stimulation of an Enhanced
Geothermal System below Basel (Switzerland). Seismological Research Letters. Vol. 80, pp.784-
798. 37
Julian, B.R., Ross, A., Foulger, G.R., Evans, J.R. (1996). Three-dimensional seismic image of a
geothermal reservoir: The Geysers, California. Geophysical Research letters. 38
Richards, H.G. (1991). A review of geological investigations associated with the UK Hot Dry
Rock programme. Read at the Annual Conference of the Ussher Society, January 1990.

Cuadrilla Bowland Limited Temporary shale gas exploration at Preston New Road Environmental Statement
Draft 3 | 24 May 2014
C:\RICHARD\RICHARD - WORK\JOBS\CUADRILLA\ISSUED DOCUMENTS\PRESTON NEW ROAD\2015-05-29 ES & PL DOCS FINAL\ES VOL 2 FINAL
APPENDICIES\PNR_ES_VOL2_APPNDX L_INDUCED SEISMICITY.DOCX
Page L16
L3.4 Induced seismicity associated with shale gas exploitation
37. This section discusses the key issues relating to induced seismicity associated with hydraulic fracturing for shale gas. This section also discusses the potential for induced seismicity associated with flow testing and drilling.
Typical event magnitudes L3.4.1
38. A review of induced seismic data from various shale gas operations in the US, Canada and the UK (Preese Hall)
39, compare the magnitude of induced seismic
events associated with the millions of hydraulic fracturing stages that have occurred. This data indicates that the majority of seismic events do not exceed 1.0 ML, with three known exceptions. These exceptional seismic events are discussed further within Section L3.4.3. In the context of shale gas exploration and recovery, seismic events in the range of less than 0.0 ML are often attributed to the initiation and growth of hydraulic fractures
39. It is noted that the minimum magnitude detection threshold will be determined by the background noise, depth of instrumentation and the sensitivity of the seismic array at a particular well site or group of well sites. There will be seismic events occurring below the detection limit of the array, however these events are not relevant in the context of seismic hazard.
Typical event durations L3.4.2
40. It is noted that small seismic events typically produce vibrations at the Earth’s surface which have very short durations (a few seconds only). Indeed, reports of felt vibrations from the 2.3 ML seismic event at Preese Hall indicated that vibrations lasted for only a few seconds
40.
Exceptional induced seismic events L3.4.3
41. Recently three international cases of induced seismicity associated with hydraulic fracturing have been documented where seismic events were recorded with magnitudes of 2.0 ML. These include:
Horn River Basin, British Columbia, Canada41
; where a total of thirty eight seismic events were recorded within the Etsho and Tattoo areas of the Horn River Basin in north-east British Columbia with recorded magnitudes between 2.2 and 3.8 ML between April 2009 and July 2011. Only one of these events, the maximum event of magnitude 3.8 ML, was reported as felt at the surface.
39
Davies, R., Foulger, G., Bindley, A., Style, P. (2013). Induced seismicity and hydraulic
fracturing for the recovery of hydrocarbons. Marine and Petroleum Geology. Vol.45, pp.171-185. 40
Eisner, L., Janska, E., Oprsal, I., Matousek, P. (2011). Seismic analysis of the events in the
Preese Hall well. Seismik report for Cuadrilla. 41
BC Oil and Gas Commission. (2012). Investigation of observed seismicity in the Horn River
Basin. <URL: www.bcogc.ca/node/8046/
download?documentID=1270.>

Cuadrilla Bowland Limited Temporary shale gas exploration at Preston New Road Environmental Statement
Draft 3 | 24 May 2014
C:\RICHARD\RICHARD - WORK\JOBS\CUADRILLA\ISSUED DOCUMENTS\PRESTON NEW ROAD\2015-05-29 ES & PL DOCS FINAL\ES VOL 2 FINAL
APPENDICIES\PNR_ES_VOL2_APPNDX L_INDUCED SEISMICITY.DOCX
Page L17
Garvin County, Oklahoma, USA42
; where following the first hydraulic fracturing stage 166 seismic events were recorded, 16 of them with a recorded magnitude of ≥ 2.0 ML. The largest recorded seismic event had a magnitude of 2.9 ML. The Picket Unit B well is located within the Ardmore basin. The geology is affected by a series of west-northwest to east-southeast trending faults and the area is affected by considerable natural seismicity
42.
Preese Hall, Blackpool, UK4 where between 28th March and 28th May 2011,
during the hydraulic fracturing of Cuadrilla’s Preese Hall well, a total of 50 seismic events were recorded between magnitudes -2.0 and 2.3 ML. On 1
st
April and 27th May 2011, 2 exceptional seismic events were recorded with magnitudes 2.3 and 1.5 ML respectively. Due to the hypocentral location of these events and their coincidence with the location and timing of Cuadrilla’s hydraulic fracturing activities, it was suspected that these events were induced by hydraulic fracturing of the Preese Hall well.
42. To put this into context, of the 35,000 shale gas wells currently in operation in the US
43 and the estimated 2.5 million hydraulic fracturing stages that have been
carried out44
, these events in Horn River Basin, British Columbia, Canada (maximum magnitude of 3.8ML)
41, Garvin County, Oklahoma, USA (maximum
magnitude of 2.9ML)42
; and Preese Hall, Blackpool, UK (maximum magnitude of 2.3ML)
4 are the only shale gas projects that have recorded seismic events above
magnitude 2.0 ML.
43. Following the two seismic events in the Blackpool area attributed to hydraulic fracturing at Preese Hall, the government imposed a temporary moratorium on hydraulic fracturing. This was subsequently lifted after several independent reviews, which all suggested that hydraulic fracturing does not represent an unacceptable seismic hazard as long as certain mitigation measures are implemented, see Section L10 for more details.
L3.5 Induced seismicity associated with flow testing
44. Flow testing usually comprises flowback of natural gas, fracture fluid and hydrocarbons from the hydraulically fractured well. A period of initial flow testing may be carried out, usually over a period of 60 to 90 days. Extended flow testing may be carried out following initial flow testing if production rates (during initial flow testing) are considered to be sufficient.
45. Initial flow testing was carried out following the first three stages of hydraulic fracturing at the Preese Hall PH1 well for a period of approximately 6 weeks. During this period of flow testing three small seismic events were recorded, all of which were less than magnitude -0.5 ML
4. These events are presented within
Figure 3. De Pater and Baisch (2011)4 interpret these events to be either
aftershocks of the 2.3 ML seismic events, or induced by the drawdown during production.
42
Holland, A. (2012). Earthquakes possibly triggered by hydraulic fracturing in south-eastern
Oklahoma. Oklahoma Geological Society. <URL:
http://wichita.ogs.ou.edu/documents/Holland_SSA2012.pdf> 43
Murray Hitzman et al. (2012). Induced Seismicity Potential in Energy Technologies. 44
King, George (2012). Hydraulic Fracturing 101: What every Representative, Environmentalist,
Regulator, Reported, investor, University Researcher, Neighbor and Engineer Should Know About
Estimating Frac Risk and Improving Frac Performance in Unconventional Gas and Oil Wells.

Cuadrilla Bowland Limited Temporary shale gas exploration at Preston New Road Environmental Statement
Draft 3 | 24 May 2014
C:\RICHARD\RICHARD - WORK\JOBS\CUADRILLA\ISSUED DOCUMENTS\PRESTON NEW ROAD\2015-05-29 ES & PL DOCS FINAL\ES VOL 2 FINAL
APPENDICIES\PNR_ES_VOL2_APPNDX L_INDUCED SEISMICITY.DOCX
Page L18
46. There is no evidence to indicate that induced seismic events during initial or extended flow testing will be greater than those induced by hydraulic fracturing. Additionally, any increase in pressure experienced during hydraulic fracturing will dissipate during flow testing due to the flowback of gas and fracture fluid to the surface. On this basis it is considered that there will be no direct impacts or effects associated with induced seismicity during flow testing. Residual seismic events may be experienced as a consequence of hydraulic fracturing, however, these events are anticipated to be well below magnitude 0 ML.
Figure 3: Overview of injection volume and seismicity of all treatment stages in Preese Hall-1. The circled events are those of less than -1ML recorded during flowback. It is noted that these events were recorded due to an improved local monitoring array being present during May and June 2011 (from De Pater and Baisch 2011
4).
L3.6 Induced seismicity associated with drilling
47. UKOOG2, DECC
1 and a review of the mechanisms of induced seismicity by
Davies et al (2013)39
do not refer to drilling as a mechanisms for inducing seismicity. A literature search also uncovered no evidence for drilling through faults as a mechanism for induced seismicity.
L3.7 Differentiating induced from natural seismicity
A major difficulty in assessing the significant likely effects of induced seismicity is in determining whether observed seismic events are anthropogenically induced or the result of natural background seismicity. As previously stated, induced and natural seismicity are both associated with slippage on a discontinuity within a rock mass. Therefore, it is often difficult to distinguish between naturally occurring events and anthropogenic induced events
45.
L3.8 Fracture growth
48. During the process of hydraulic fracturing engineered fractures grow/propagate when fluid pressure exceeds the least principle stress and the tensile strength of
45
Shale Gas Information Platform (SHIP). <URL: http://www.shale-gas-information-
platform.org/areas/basics-of-shale-gas/induced-seismicity.html>

Cuadrilla Bowland Limited Temporary shale gas exploration at Preston New Road Environmental Statement
Draft 3 | 24 May 2014
C:\RICHARD\RICHARD - WORK\JOBS\CUADRILLA\ISSUED DOCUMENTS\PRESTON NEW ROAD\2015-05-29 ES & PL DOCS FINAL\ES VOL 2 FINAL
APPENDICIES\PNR_ES_VOL2_APPNDX L_INDUCED SEISMICITY.DOCX
Page L19
the host rock46
. It is well understood that hydraulic fracturing fluids also exploit the presence of natural discontinuities. In general, it is anticipated that this may enable fracture fluid to migrate greater distances, compared to that which occurs during the growth of engineered fractures. In the context of induced seismicity, it is important to understand the potential dimensions and extents of these fractures, so that injection fluid is not directly injected into regional faults (which is a mechanism involved in inducing seismic events associated with hydraulic fracturing - see Section L3.4).
49. The majority of the work on fracture growth is based on interpretation of operational data. Observational work carried out by Fisher and Warpinski (2011)
47, using data collected from the hydraulic fracturing in various shale
formations in the USA, indicate a maximum fracture propagation height (i.e. vertical fractures) of around 450m, with typical fractures heights of between <100m to 300m.
50. It is widely accepted that, in the context of hydraulic fracturing for shale gas, the growth of engineered fractures is controlled by four main factors, including: (i) the existing geological stress regime; (ii) well pressure; (iii) geological structure and (iv) fracture fluid composition. The largest fracture growth may arise when fractures intercept faults or existing fracture networks
47.
51. This discussion does not consider the growth of horizontal fractures.
52. There are currently preliminary models for predicting fracture growth with additional modelling work currently being undertaken by Cuadrilla. Some preliminary results have been reviewed and summarised here. The modelling results are based on the operational parameters of 5 hydraulic fracturing stages of the Preese Hall-1 well and the mechanical properties of the rock encountered. These preliminary results indicate that fracture growth (horizontal half lengths and vertical fracture height) of between 50m and 200m may be anticipated
52.
L3.9 Potential well casing deformation and seismicity
53. The potential for well deformation associated with seismicity is discussed in Section 11.7.7 of Chapter 11, Hydrogeology and Ground Gas.
L3.10 Hydraulic Fracturing in the UK
54. Operator records indicate that over the past 30 years, or so over 2,000 onshore conventional oil and gas wells have been drilled within the UK
14. It is understood
that around 10% of these wells have been hydraulically fractured to enhance recovery
14. These onshore conventional hydrocarbon wells have been regularly
and successfully hydraulically fractured, over the last few decades with no significant induced seismicity or damage associated with these events
14. It is noted
that hydraulic fracturing is a common practice for offshore conventional oil and gas wells and has been for much of the last half a century.
55. Operator records were not inspected as part of this work, therefore the location of these wells and the volumes of fracturing fluid are unknown. However, until
46
Davies, R.J., Mathias, S.A., Moss, J., Hustoft, S., Newport. L. (2012). Hydraulic fractures: how
far can they go? Marine and Petroleum Geology. Vol.37, pp.1-6. 47
Fisher, K., Warpinski, N. (2011). Hydraulic fracture-height growth: real data. SPE 145949.

Cuadrilla Bowland Limited Temporary shale gas exploration at Preston New Road Environmental Statement
Draft 3 | 24 May 2014
C:\RICHARD\RICHARD - WORK\JOBS\CUADRILLA\ISSUED DOCUMENTS\PRESTON NEW ROAD\2015-05-29 ES & PL DOCS FINAL\ES VOL 2 FINAL
APPENDICIES\PNR_ES_VOL2_APPNDX L_INDUCED SEISMICITY.DOCX
Page L20
recently hydraulic fracturing was regarded as a fairly routine operation for the recovery of oil and gas and the process was not subject to specific consent.
56. It should be noted that there are a number of differences between hydraulic stimulation of conventional hydrocarbon wells and hydraulic stimulation of shale gas wells, not least the quantities of water involved which are lower in conventional hydrocarbon hydraulic stimulations.
57. To date no hydraulic stimulation of shale gas reservoirs, other than at Preese Hall in 2011, has been carried out on or offshore in the United Kingdom. Cuadrilla are one of a number of operators that hold licences for the appraisal and exploration of hydrocarbons within particular licence areas. In order for the operators to start producing gas from these reservoirs, additional consents are required from DECC.

Cuadrilla Bowland Limited Temporary shale gas exploration at Preston New Road Environmental Statement
Draft 3 | 24 May 2014
C:\RICHARD\RICHARD - WORK\JOBS\CUADRILLA\ISSUED DOCUMENTS\PRESTON NEW ROAD\2015-05-29 ES & PL DOCS FINAL\ES VOL 2 FINAL
APPENDICIES\PNR_ES_VOL2_APPNDX L_INDUCED SEISMICITY.DOCX
Page L21
L4 Scoping and consultation
58. The scoping and consultation process that has been undertaken as part of this EIA for the Site has been discussed in detail within Chapter 2 of the ES.
L4.1 Stakeholder engagement
59. A number of risk workshops and consultation events have been carried out since the inception of the EIA process. These are described in detail in the Statement of Community Involvement which accompanies the Planning Application.
60. Risks that were identified during these events assisted in the identification of risks associated with induced seismicity. These are discussed further within the relevant sections of this report.
L4.2 Scoping opinion
61. As part of the planning process, a scoping report was submitted on 04/02/2013. This gave various consultees the opportunity to comment on the proposed content and methodology of the induced seismicity section of the final ES. The ‘scoping opinion’ and consultation comments received as part of the consultation process are summarised within Table 3 below. These submissions are available on the Lancashire County Council website
48.
62. The key stakeholder for consultation with regard to induced seismicity is considered to be DECC. Input from other groups has been taken into consideration, such as the Environment Agency, the British Geological Survey, Lancashire County Council; and community groups.
Table 3: Summary table of responses received as part of the scoping opinion in relation to induced seismicity.
Consultee Comments (in relation to induced seismicity) Response
Lancashire County Council (Summary and Recommendations)
Lancashire County Council comments in relation to induced seismicity are detailed below this table.
All of these items have been covered within the induced seismicity section of the ES (Chapter 12) and with this Appendix.
Lancashire County Council (Archaeology)
No reference to seismicity None
Lancashire County Council (Landscape)
No reference to seismicity None
Lancashire County Council (Highways)
No reference to seismicity None
Lancashire County Council (Ecology)
No reference to seismicity None
Fylde Borough Council
Include the potential impacts of subsidence Subsidence during the exploration phase
48
Lancashire County Council <URL:http://planningregister.lancashire.gov.uk/> [site accessed:
11/03/2014]

Cuadrilla Bowland Limited Temporary shale gas exploration at Preston New Road Environmental Statement
Draft 3 | 24 May 2014
C:\RICHARD\RICHARD - WORK\JOBS\CUADRILLA\ISSUED DOCUMENTS\PRESTON NEW ROAD\2015-05-29 ES & PL DOCS FINAL\ES VOL 2 FINAL
APPENDICIES\PNR_ES_VOL2_APPNDX L_INDUCED SEISMICITY.DOCX
Page L22
Consultee Comments (in relation to induced seismicity) Response
has been assessed and is discussed within Chapter 12 and this Appendix.
Department for Energy and Climate Change (DECC)
Comment that the hydraulic fracturing operation will be subject to the new controls to mitigate seismic risk announced on 13
th December
2012.While they do not disagree with the scoping report’s conclusion that shale gas is unlikely to result in subsidence, DECC suggest that this is an issue on which concerns have been expressed and that it would be beneficial to public understanding of the implications of the proposed operations if subsidence were scoped in to ensure the reasoning behind this issue would be more fully explored and publically accessible.
Subsidence has been assessed and is discussed within Chapter 12 and this Appendix.
Highways Agency Reference made to the exclusion of subsidence and settlement from the scope of the EIA and a suggestion that subsidence could develop from a reduction in volume of the reservoir rocks which could adversely affect the Highways Agency assets. Recommendation that should full scale production follow on it would potentially become more significant and should be explored in more detail.
Although the level of seismicity developed by the hydraulic fracturing process may be relatively small, it should be investigated and confirmed that there are no sensitive structures, e.g. bridges, etc. which would require mitigation measures. The Highways Agency would wish to see zero impact on their assets and as such the cost of any necessary mitigation would need to be covered by the instigator, should damage occur due to the project’s activities.
Subsidence during the exploration phase has been assessed and is discussed within Chapter and this Appendix.
HSE No reference to seismicity None
Natural England No reference to seismicity None
National Grid No reference to seismicity None
General Public 0002_No reference to seismicity but a comment that the authors had previously felt an earthquake caused by fracking in the Flyde area.
0006_Refers to the exclusion of subsidence from the list of topics to be impact assessed which suggests that there is to be no assessment made of the risks of seismic induced subsidence to property.
Historical events are discussed within Chapter 12 and this Appendix.
Subsidence has been assessed and is discussed within Chapter 12 and this Appendix.
CPRE Lancashire Request for further information on the buried array of seismometers.
Comment on the need for microseismic survey prior to HF operations
The significance of induced seismicity – comments refer to possible damage to well casing with reference to Preese Hall.
All of these items will be covered within Chapter 12 and this Appendix.

Cuadrilla Bowland Limited Temporary shale gas exploration at Preston New Road Environmental Statement
Draft 3 | 24 May 2014
C:\RICHARD\RICHARD - WORK\JOBS\CUADRILLA\ISSUED DOCUMENTS\PRESTON NEW ROAD\2015-05-29 ES & PL DOCS FINAL\ES VOL 2 FINAL
APPENDICIES\PNR_ES_VOL2_APPNDX L_INDUCED SEISMICITY.DOCX
Page L23
Consultee Comments (in relation to induced seismicity) Response
Environment Agency
At section 5.7.4.6, the report indicates that it will consider the effects of seismic events on the environment, built environment and human response. This assessment will also need to consider the impact that a seismic event will have upon the well integrity (including the integrity of any neighbouring wells) and the risks that these may pose to the groundwater environment.
All of these items will be covered within the Chapter 12 and this Appendix,
63. It is noted that the opinions of Lancashire County Council are key for this section of the ES. In response to the scoping report they made the following comments on the expected content of the ES:
“The ES should include sufficient local and regional geological information to enable the subsurface geology in the exploration area to be characterised. The ES should include the relevant information that was gathered from the 3D seismic survey previously undertaken for this area. This information should include details of geological structures including faulting which may have implications for the drilling operations. The information should seek to characterise the existing stresses of such faults and the risks that may result through the undertaking of hydraulic fracturing operations in proximity to such fault planes.
The ES should contain information on existing natural and induced seismicity in the area around the site having regard to historical information and monitoring carried out in the local area pre development.
The ES should include a description of the measures that will be employed to monitor seismic impacts during the fracturing operations and how such monitoring will be used to control fracturing operations in a manner to reduce seismic impacts to acceptable levels including the details of the software and methodology of monitoring. Details of how the proposed traffic light system would work should be provided including provision for amending the trigger levels of such a requirement is demonstrated through the data gathered by incremental and macroseismic means.
This section of the ES should include a discussion of the measurement parameters that should be used as a basis for the operation of the TLS. It is suggested that magnitude may not always be the most suitable measurement of impact and that surface ground motion (velocity and acceleration) may be a much better indicator of the impacts that might be observed or sensed by residents. The reason for this is that there are a number of variables that may affect how a given magnitude event would be experienced at the surface and that actual ground motion may be a better indicator or measurement of impact.
In relation to the seismic impacts, due to the high background vibration noise levels that may be present due to road traffic, it is recommended that daytime seismic noise tests are undertaken to establish the background levels against which any fracking generated movement will need to be determined. An assessment will need to be made so that the vibration from traffic can be distinguished from those attributable to fracturing so that the effectiveness of the surface array for traffic light monitoring purposes can be addressed.

Cuadrilla Bowland Limited Temporary shale gas exploration at Preston New Road Environmental Statement
Draft 3 | 24 May 2014
C:\RICHARD\RICHARD - WORK\JOBS\CUADRILLA\ISSUED DOCUMENTS\PRESTON NEW ROAD\2015-05-29 ES & PL DOCS FINAL\ES VOL 2 FINAL
APPENDICIES\PNR_ES_VOL2_APPNDX L_INDUCED SEISMICITY.DOCX
Page L24
The ES should set out how the near surface arrays would work including the number of sensors to be installed. It is considered that there should be at least 7 monitoring points to provide backup and avoid problems of downtime. The arrays also be capable of detecting 3 components of ground movement (vertical and horizontal). The ES should also set out the minimum time that the surface arrays will be operational in order to ensure the collection of sufficient background data before fracturing commences and a timescale for the monitoring system being retained post fracking.
It is also suggested that provisions should be made for conducting macroseismic surveys with members of the public who report seismic impacts in order to understand the perception of any seismicity and reassure complainants.
The ES should examine the risks to the integrity of the boreholes and associated casing/environmental protection methods from any seismicity that may be induced by hydraulic fracturing operations.
The ES should examine the likelihood of any existing structures or buildings being damaged by seismic events induced by hydraulic fracturing operations.
The ES should include information on how directional control of each borehole will be managed to ensure that there is no risk of sub-collision of boreholes. Similarly there should be an explanation of how any simultaneous drilling and fracking operations will be managed to ensure that there is no risk of fracturing operations having any impacts on drilling and casing operations in other boreholes on the same site that may prejudice the proper and safe construction of such boreholes including the management of risk of boreholes merging. In the event of merging details should be included in the ERA of the measures to be employed to prevent ground contamination and the subsequent abandonment of the borehole.
Although the risk of subsidence from fracking and gas extraction operations is considered low, it is considered that the ES should demonstrate how and why it is concluded that the risk is low.”
L4.3 Royal Society and Royal Academy of Engineering consultations
64. In addition to the scoping and consultation process undertaken by Arup for the EIA, it was considered important to discuss the recent consultations undertaken by the Royal Society and Royal Academy of Engineering for the recent report. Consultations were held with several experts and stakeholders, and submissions were received from individuals and learned societies. These submissions are available on the Royal Society website
49. Some comments from these
consultations are summarised within Table 4 below.
49
The Royal Society. <URL: http://royalsociety.org/policy/projects/shale-gas-extraction/report/>
[site accessed 16/10/2013].

Cuadrilla Bowland Limited Temporary shale gas exploration at Preston New Road Environmental Statement
Draft 3 | 24 May 2014
C:\RICHARD\RICHARD - WORK\JOBS\CUADRILLA\ISSUED DOCUMENTS\PRESTON NEW ROAD\2015-05-29 ES & PL DOCS FINAL\ES VOL 2 FINAL
APPENDICIES\PNR_ES_VOL2_APPNDX L_INDUCED SEISMICITY.DOCX
Page L25
Table 4: Summary table of responses received by the Royal Society and Royal Academy of Engineering consultations with regard to induced seismicity.
Summary of Comments (in relation to induced seismicity)
Faults to surface generated during Permo-Triassic extension may be responsible for fraccing (of the PH-1 borehole) generating micro earthquakes.
Induced microseismicity is commonly used to image fracture networks and stimulated volumes; mining-induced seismicity provides realistic upper limit for injection-induced events (~3ML), but events of this magnitude at expected depths of 2-3 km are unlikely to cause structural damage. Nonetheless, mining-induced seismicity of similar magnitudes has caused superficial damage and would be strongly felt by people within a few km from epicentre.
The possibility of other earthquakes during future treatments cannot be ruled out, and it is possible that critically stressed faults are present throughout the basin.
Microseismicity will result whenever large volumes of fluid are injected into rock. Any risk that fracturing might cause earthquakes capable of causing noticeable surface movement in the UK can be reduced to negligible levels by avoiding injection into or near to faulted zones, and by careful well planning to avoid such zones during any drilling operations.
Many other drilling operations also induce microseismicity. This is well known and understood in the hydrocarbons industry, and any associated risks are already effectively managed in existing E&P contexts. This is therefore not an unfamiliar risk to subsurface scientists and engineers.
To discriminate seismic events induced by human activity from natural ones, and to characterise them, it will be necessary to establish the background/baseline conditions prior to drilling, using the database of the British Geological Survey and other records. Microseismic monitoring networks could then be used to monitor the level of seismic activity during and after the hydraulic fracturing process. This would be a significant undertaking, and would incur cost and delays to any drilling operations. A benefit would be to help build public confidence as well as to mitigate operational and production risks.
Microseismicity is useful for monitoring stress state of the reservoir; induced seismicity requires monitoring and can be predicted using linked geomechanical and fluid-flow modelling. There is a need to establish a seismicity baseline, a good geomechanical model, knowledge of stress state, fault geometry and activity.
L4.4 Hazard identification
65. In combination with the scoping and consultation process described in preceding sections a hazard identification process has been carried out to determine the hazards associated with induced seismicity. The hazards that have been identified by Arup and through consultations include the following:
1) Induced seismic event resulting in a ground motion hazard that may cause damage to local critical infrastructure such as schools, hospitals, hazardous industries (e.g. COMAH sites) and other critical infrastructure.
2) Induced seismic event resulting in a ground motion hazard that may cause damage to local residential properties.
3) Induced seismic event resulting in a ground motion hazard that may cause damage to the well and loss of well integrity.
4) Ground subsidence occurring post exploration, resulting in potential damage to structures.
5) Ground shaking from induced seismic event causes liquefaction and significant settlement of the ground resulting in potential damage to properties.

Cuadrilla Bowland Limited Temporary shale gas exploration at Preston New Road Environmental Statement
Draft 3 | 24 May 2014
C:\RICHARD\RICHARD - WORK\JOBS\CUADRILLA\ISSUED DOCUMENTS\PRESTON NEW ROAD\2015-05-29 ES & PL DOCS FINAL\ES VOL 2 FINAL
APPENDICIES\PNR_ES_VOL2_APPNDX L_INDUCED SEISMICITY.DOCX
Page L26
6) Induced seismic event causes damage to local Halite salt mines, which may in future store hydrocarbon gas.

Cuadrilla Bowland Limited Temporary shale gas exploration at Preston New Road Environmental Statement
Draft 3 | 24 May 2014
C:\RICHARD\RICHARD - WORK\JOBS\CUADRILLA\ISSUED DOCUMENTS\PRESTON NEW ROAD\2015-05-29 ES & PL DOCS FINAL\ES VOL 2 FINAL
APPENDICIES\PNR_ES_VOL2_APPNDX L_INDUCED SEISMICITY.DOCX
Page L27
L5 Methodology
L5.1 Introduction
66. The methodologies for establishing the baseline for geological characteristics and for assessing the effects of construction, operation and decommissioning are described below. The assessment methodology is considered robust and appropriate and aligns with relevant legislation and policies (see Section L2).
L5.2 Baseline methodology
67. The methodologies for establishing the baseline conditions of the site area in the context of induced seismicity are discussed below.
68. The baseline conditions have been established through the review and interpretation of desk based information and a site walkover. The baseline conditions have been considered for the Site in particular, but also the wider local and regional area where relevant.
Geological information
69. In accordance with industry best practice, it is required to characterise the geology of the site and the surrounding area, including the superficial geology, solid geology, and structural geology; including faulting and structure of the solid geology. The baseline geological condition at the site and its environs have been interpreted through review of geological maps and memoirs for the area as well as 3D geophysical (seismic) data and end of well reports for the Grange Hill, Thistleton, Elswick and Preese Hall wells.
Stress data
70. The stress regime of the area has been interpreted through review of the following information:
De Pater and Baisch (2011)4 synthesis report on the seismicity associated with
the hydraulic fracturing of the Preese Hall well4;
Geosphere (2011)50
report on the mechanism of induced seismicity at the Preese Hall-1 well.
GMI (2011)51
report on the wellbore failure analysis and geomechanical modelling in the Bowland Shale, Blackpool.
StrataGen (2011)52
report of the geomechanical study of Bowland Shale seismicity.
The World Stress Map database53
;
The macroseismic survey of the 27 February 2008 Market Rasen earthquake. British Geological Survey Internal Report OR/08/029
29;
50
Geosphere Ltd. (2011). Well Preese Hall-1. The mechanism of induced seismicity. 51
GMI Geomechanics Services. (2011). Wellbore failure analysis and geomechanical modelling in
the Bowland Shales, Blackpool, UK. 52
StrataGen Delft BV. (2011). Geomechanical study of Bowland Shale seismicity – Fracture
geometry and injection mechanism. 53
Heidbach, O. (2008). The World Stress Map database release 2008, s.l.:
doi:10.1594/GFZ.WSM.Rel2008.

Cuadrilla Bowland Limited Temporary shale gas exploration at Preston New Road Environmental Statement
Draft 3 | 24 May 2014
C:\RICHARD\RICHARD - WORK\JOBS\CUADRILLA\ISSUED DOCUMENTS\PRESTON NEW ROAD\2015-05-29 ES & PL DOCS FINAL\ES VOL 2 FINAL
APPENDICIES\PNR_ES_VOL2_APPNDX L_INDUCED SEISMICITY.DOCX
Page L28
Tectonophysics journal article by Brian Baptie on seismogenesis and state of stress in the UK
70; and
Nirex report on the resolution of in-situ stress orientation and magnitude at Sellafield
71.
Background seismicity
71. The back ground seismicity of the region has been interpreted through review of the following information:
Data obtained from the BGS for a 50km radius from the site [requested on 14/08/13];
Seismik report on the seismicity associated with the hydraulic fracturing of the Preese Hall-1 well
40;
De Pater & Baisch (2011)synthesis report on the seismicity associated with the hydraulic fracturing of the Preese Hall well
4;
Q-con GmbH report on background seismic monitoring at the Becconsall well between May and October 2012
54,55,56,57,58;
Q-con GmbH report on siting and noise measurements for the Preston New Road Seismic Network
77;
QJEG ‘special edition’ The Geology and Hydrogeology of the Sellafield Area
59; and
Seismic receptors
72. The location and characteristics of seismic receptors were determined through desk based review and a site walkover. The size of the seismic study area was considered prior to the site walkover. The radius was determined on the basis of a preliminary assessment of predicted ground motions (PGV).
73. The aim of the site walkovers was to develop a general understanding of the seismic sensitive receptors within the vicinity of the Preston New Road well site. The Site walkover is discussed in detail in Section L6.10.
Predicted future baseline
74. The predicted future baseline has been defined by consideration of potential changes to the baseline that may occur in the absence of the proposed development.
L5.3 Assessment methodology for the effects from construction
75. The construction phase of the project comprises the construction of the wellpad, drilling cellars, access tracks and groundwater monitoring boreholes and there is
54
Rothert, E. & Baisch, S. (2012). Seismic Monitoring Report SMR-CUA-001_v2, s.l.: Q-con. 55
Rothert, E. & Baisch, S., 2012. Seismic Monitoring Report SMR-CUA-002, s.l.: Q-con. 56
Rothert, E., 2012. Seismic Monitoring Report SMR-CUA-003, s.l.: Q-con. 57
Rothert, E., 2012. Seismic Monitoring Report SMR-CUA-004, s.l.: Q-con. 58
Rothert, E. & Stang, H., 2012. Seismic Monitoring Report SMR-CUA-005, s.l.: Q-con. 59
Chaplow, R. (1996) The geology and hydrogeology of Sellafield an overview. Quarterly Journal
of Engineering Geology and Hydrogeology. 29 (Supplement 1), S1-S12.

Cuadrilla Bowland Limited Temporary shale gas exploration at Preston New Road Environmental Statement
Draft 3 | 24 May 2014
C:\RICHARD\RICHARD - WORK\JOBS\CUADRILLA\ISSUED DOCUMENTS\PRESTON NEW ROAD\2015-05-29 ES & PL DOCS FINAL\ES VOL 2 FINAL
APPENDICIES\PNR_ES_VOL2_APPNDX L_INDUCED SEISMICITY.DOCX
Page L29
no mechanism for induced seismicity. It is concluded that there will be no effects in the context of induced seismicity associated with the construction phase of the Project. As a consequence this has not been assessed further.
L5.4 Assessment methodology for the effects from installation of surface and buried array
76. The installation of the surface array will comprise surface construction activities at discrete locations within a few kilometres of the Site and there is no mechanism for induced seismicity.
77. The installation of the buried array will comprise the drilling of shallow boreholes to depths of up to 100m below ground level at discrete locations within a few kilometres of the Site. These will be constructed using conventional rotary drilling techniques within the superficial deposits and shallow bedrock and there is no mechanism for induced seismicity.
78. It is concluded that there will be no effects in the context of induced seismicity associated with the installation of the surface and buried seismic monitoring array. As a consequence this has not been assessed further.
L5.5 Assessment methodology for operational effects
79. The operational phase of the Project includes well drilling, hydraulic fracturing, flow testing and extended well testing.
80. The assessment methodology for operational effects will broadly follow the semi quantitative protocol that has recently been developed by the DoE in the US to deal with the likely significant effects of induced seismicity associated with EGS activities
15.
81. The assessment methodology comprises the following key aspects for addressing induced seismicity and is used to consider drilling, hydraulic fracturing, flow testing and extended well testing operational phases:
a) Review and select criteria for ground vibration;
b) Assessment of the potential hazard of induced seismic events during drilling, hydraulic fracturing, flow testing and extended well testing;
c) Quantify the effects from induced seismic events specific to the mechanisms associated with shale gas; and
d) Develop a risk-based mitigation plan.
82. This assessment methodology of the hazard of induced seismicity (Source-Pathway-Receptor) goes beyond the current DECC recommendations
14. This
reflects the view that the significance of the impact of a seismic event is dependent on the magnitude, mechanism and hypocentre of a seismic source relative to the location of a receptor and the nature of the material in between. This is consistent with the framework used within the Environmental Risk Assessment (ERA).
83. In the context of induced seismicity the source, pathway and receptor can be defined as follows:

Cuadrilla Bowland Limited Temporary shale gas exploration at Preston New Road Environmental Statement
Draft 3 | 24 May 2014
C:\RICHARD\RICHARD - WORK\JOBS\CUADRILLA\ISSUED DOCUMENTS\PRESTON NEW ROAD\2015-05-29 ES & PL DOCS FINAL\ES VOL 2 FINAL
APPENDICIES\PNR_ES_VOL2_APPNDX L_INDUCED SEISMICITY.DOCX
Page L30
Source: either an engineered fracture or the movement of an existing fault plane. The term ‘source’ refers to the location (depth and position), size (measured in terms of magnitude or seismic moment) and source mechanism;
Pathway: refers to the travel path of the seismic waves from the ‘source’ to the location of a ‘receptor’ that could potentially be damaged. The passage of seismic waves through ground is typically modelled using ‘ground motion prediction equations’ or GMPEs; and
Receptor: may be physical damage to housing, community buildings, infrastructure and other buildings and structures, but may also be the impact of the interference to human activities and subsequent socioeconomic impact.
L5.6 Assessment methodology for decommissioning effects
84. The methodology described above for operational effects is also appropriate for the assessment of decommissioning effects. However it is expected that there will be no effects in the context of induced seismicity associated with the decommission phase. As a consequence this is not assessed any further.
L5.7 Assumptions and limitations
85. This section details the assumptions and limitations associated with the assessment of induced seismicity as a result of the Project. This includes a discussion of any embedded mitigation, i.e. mitigation measures that are assumed to be in place as part of the assessment.
86. The key assumptions and limitation which form the basis of this assessment include the following:
The interpretation of the 3D geophysical (seismic) survey has been carried out by Cuadrilla and reviewed by Arup and DMT.
The interpretation of the 3D geophysical (seismic) survey, in the context of defining strata boundaries, has been made on the basis of a correlation between the results of the vertical seismic profile (VSP) and downhole geophysics. This data has come from other nearby wells including, Preese Hall, Grange Hill, Elswick and Thistleton. Therefore the interpretation of the ground conditions is based on geological information that does not specifically cover the Site. Nonetheless, interpretation of strata boundaries is consistent throughout all wells and it is unlikely that the ground conditions will vary to an extent that will affect the results of the assessment, particularly as information is available from the nearby Preese Hall well. The ground conditions are discussed in further detail in Section L6.3.
Regional faults, as defined above in Section L3.1, will be avoided during hydraulic fracturing operations, all other faults, described hereafter as small scale faults, may not be avoided during hydraulic fracturing operations, but will be mitigated against using the mitigation methods in this document.
For the purpose of this assessment it is assumed that all faults within the area are ‘critically stressed’. However in reality not all faults will be critically stressed.
Prior to the submission of the HFP work will be carried out to understand whether nearby faults are indeed critically stressed or not. The findings of this

Cuadrilla Bowland Limited Temporary shale gas exploration at Preston New Road Environmental Statement
Draft 3 | 24 May 2014
C:\RICHARD\RICHARD - WORK\JOBS\CUADRILLA\ISSUED DOCUMENTS\PRESTON NEW ROAD\2015-05-29 ES & PL DOCS FINAL\ES VOL 2 FINAL
APPENDICIES\PNR_ES_VOL2_APPNDX L_INDUCED SEISMICITY.DOCX
Page L31
study will be presented within the HFP that is required to be submitted and authorised by DECC before hydraulic fracturing can commence.
Work on ground motion prediction for shallow, low seismicity earthquakes is limited, in particular for induced earthquakes within the UK. Therefore the results of ground motion prediction are constrained by the inherent limitations of available prediction equations. Consideration of ground motion prediction equations is included in Section L7.
British guidance on ground motion criteria does not specifically cover ground motions for earthquakes, therefore criteria is based on those within guidance documents for other ground motion inducing activities, such as blasting. Where earthquake specific criteria are available (in international guidance) this has been compared to British criteria.
87. Notwithstanding the limitations and assumptions regarding the ground conditions listed above, it is considered that these do not significantly affect the robustness of the assessment, and they are the best and most appropriate methodologies available at the time of writing.
Embedded mitigation measures
88. Embedded mitigation measures include those that are assumed to be in place as part of the assessment. In the context of the induced seismicity assessment, embedded mitigation measures are considered to include those defined within the Project proposals (i.e. to be included within HFP). The embedded mitigation measures are discussed in the relevant parts of Section L10. It is considered that the embedded mitigation measures include the following:
Reviewing available information on geology, structure (including faults) and in situ stresses in the vicinity of the proposed Site to avoid hydraulically fracturing into, or close to, existing critically stressed faults;
Carry out risk based geomechanical assessments of proposed hydraulic fracturing with regard to known faults (including maximum magnitude estimates);
Monitoring background induced and natural seismicity before, during and after hydraulic fracturing;
Evolutionary approach to risk assessment and mitigation – Fracture evolution and operational mitigation including a mini-fracture stage prior to the initial main hydraulic fracturing stage and reduced per stage volumes of hydraulic fracturing fluids compared to those used at Preese Hall. This stepped progressive approach to hydraulic fracturing will consist of an initial mini-fracture stage and modest initial pumped volumes building up to a maximum pump volume of 765m
3 per stage (less than half of the average volumes
pumped per stage at Preese Hall). As this process continues, an understanding of the performance of the reservoir during hydraulic fracturing is developed;
Monitor the extent of fracture growth during hydraulic fracturing using a buried microseismic array;
Implementation of the Traffic Light System (via the surface seismic monitoring array); and

Cuadrilla Bowland Limited Temporary shale gas exploration at Preston New Road Environmental Statement
Draft 3 | 24 May 2014
C:\RICHARD\RICHARD - WORK\JOBS\CUADRILLA\ISSUED DOCUMENTS\PRESTON NEW ROAD\2015-05-29 ES & PL DOCS FINAL\ES VOL 2 FINAL
APPENDICIES\PNR_ES_VOL2_APPNDX L_INDUCED SEISMICITY.DOCX
Page L32
Flowback in the case of Amber (0.0 ML) or Red (0.5ML) seismic events between hydraulic fracturing stages in accordance with the Traffic Light System.
89. The Project proposals include hydraulic fracturing and extended well testing activities. Therefore, according to the DECC requirements
22, Cuadrilla are
required to submit a description of the controls described above to mitigate induced seismicity in the HFP. The HFP will be authorised by DECC prior to commencement of hydraulic fracturing activities.

Cuadrilla Bowland Limited Temporary shale gas exploration at Preston New Road Environmental Statement
Draft 3 | 24 May 2014
C:\RICHARD\RICHARD - WORK\JOBS\CUADRILLA\ISSUED DOCUMENTS\PRESTON NEW ROAD\2015-05-29 ES & PL DOCS FINAL\ES VOL 2 FINAL
APPENDICIES\PNR_ES_VOL2_APPNDX L_INDUCED SEISMICITY.DOCX
Page L33
L6 Baseline conditions
L6.1 The Site
90. The Preston New Road site is approximately 7.5km south-east from the centre of Blackpool and approximately 5.2km west of the village of Kirkham. The site is located on relatively high ground for the local area at a height of around 16m AOD at the site
60.
91. The site is located on a plateau of low relief terrain incised by a series of river valleys including the River Wyre located approximately 7km to the north and running east to west, and the River Ribble located approximately 6.5km to the south running east to west. The Irish Sea lies around 7.6km to the west of the site while the higher ground of the Bowland Fells lies approximately 22km to the north-east of site
60.
L6.2 Regional geology
92. The oldest and deepest known rocks in the area are likely to be preserved Ordovician and Silurian rocks (similar to those found in Cumbria to the north) and are assumed to be composed of sedimentary and volcanic deposits
60,61. These
Ordovician and Silurian deposits are likely to overlain by Devonian Old Red Sandstone and subsequently overlain by Carboniferous deposits
60. The target rock
for the shale gas wells is the Bowland Shale and Hodder Mudstone of the Carboniferous.
93. The dominant tectonic process during the early Carboniferous was crustal extension. Regional extension along the Craven Fault System and Pendle Lineament formed the Bowland Basin
62, see Figure 4 below. Initially shallow-
water limestones (Chatburn Limestone) and fine-grained terrigenous clastics were deposited as a carbonate ramp sequence. As the basin continued to deepen, early deeper-water shales were deposited along with debris flow / gravity slides composed of sandstone and limestone turbidites from the surrounding carbonate platforms
63.
94. During its formation, the Bowland Basin began to be broken up by a series of north-east, south-west trending faults. These faults were active during the formation and deepening of the basin, and controlled thickness variations and sedimentary facies variations. By the end of Brigantian times active rifting began to slow down and thermal subsidence became the dominant process. At this time the Pendleian Upper Bowland Shale transgressed across the basin margins associated with early Namurian Sea Level rise
63.
60
British Geological Survey. (1990). Geology of the country around Blackpool. London: HMSO 61
British Geological Survey (1948). Geology of Southport and Formby. London. HMSO 62
Andrews, I.J. (2013). The Carboniferous Bowland Shale gas study: geology and resource
estimation. British Geological Survey for Department of Energy and Climate Change, London,
UK. 63
Fraser, A. J. & Gawthorpe, R. L., (1990). Tectono-stratigraphic development and hydrocarbon
habitat of the Carboniferous in northern England. Geological Society, London, Special
Publications, Volume 55, pp. 49-86.

Cuadrilla Bowland Limited Temporary shale gas exploration at Preston New Road Environmental Statement
Draft 3 | 24 May 2014
C:\RICHARD\RICHARD - WORK\JOBS\CUADRILLA\ISSUED DOCUMENTS\PRESTON NEW ROAD\2015-05-29 ES & PL DOCS FINAL\ES VOL 2 FINAL
APPENDICIES\PNR_ES_VOL2_APPNDX L_INDUCED SEISMICITY.DOCX
Page L34
Figure 4: Regional Setting of the Bowland Basin showing the Craven fault system to the north east and the Pendle fault to the south (extract taken from Fraser & Gawthorpe (1990)
63).
95. During the Namurian the marine environment was gradually superseded by deltaic conditions as Millstone Grit deposits advanced from the north east. During this period a thick sequence of sandstones and shales were deposited and some of these, for example the Sabden Shale, are potential shale gas targets
63. At the end
of the Carboniferous the whole sequence was folded and uplifted during the Variscan Orogeny. Following the Variscan Orogeny a thick sequence of Permo-Triassic sediments were deposited. These include sandstones and thick mudstones and evaporites of the Manchester Marls Group which form a natural seal to the Bowland Shales
63. The Permo-Triassic succession was faulted during Mesozoic
extension and in PEDL165 the two main faults are the Woodsfold and Thistleton Faults.
Pendle Fault

Cuadrilla Bowland Limited Temporary shale gas exploration at Preston New Road Environmental Statement
Draft 3 | 24 May 2014
C:\RICHARD\RICHARD - WORK\JOBS\CUADRILLA\ISSUED DOCUMENTS\PRESTON NEW ROAD\2015-05-29 ES & PL DOCS FINAL\ES VOL 2 FINAL
APPENDICIES\PNR_ES_VOL2_APPNDX L_INDUCED SEISMICITY.DOCX
Page L35
L6.3 Local geology
Structural geology L6.3.1
96. The local geology of the area is controlled by the half-graben structure of the Bowland Basin which is bordered to the south-east by the Pendle Fault (downthrows to the north-west) and to the north-east by the Craven Fault System (downthrows to the south-west). To the north-east of the basin, there is an unnamed fault down throwing to the south. The western side of the basin opens out towards the Irish Sea Basin while the northern side of the basin slope upwards towards the higher ground of Cumbria
60,
97. Within the Bowland Basin itself are a series of smaller extensional faults running roughly north-south across the region, including, from west to east, the Thistleton and Larbreck Fault, the Mid-Elswick Graben Fault and the Woodsfold fault
64.
Figure 5: Extract from the BGS Geological Maps (EIA Report Figure 11: Solid Geology) showing the location of the site and proximity of local faults
64.
98. The Woodsfold fault extends from the Craven Fault System in the north-east on a “strike” of around 030° passing the Preston New Road site approximately 6km to the east. The fault downthrows towards the west/north-west and penetrates through the Permian, Triassic and at least the Early Carboniferous rocks at the base of the basin
62.
64
British Geological Survey. (2012). Preston. England and Wales Sheet 75. Bedrock and
Superficial Deposits. 1:50,000 map.

Cuadrilla Bowland Limited Temporary shale gas exploration at Preston New Road Environmental Statement
Draft 3 | 24 May 2014
C:\RICHARD\RICHARD - WORK\JOBS\CUADRILLA\ISSUED DOCUMENTS\PRESTON NEW ROAD\2015-05-29 ES & PL DOCS FINAL\ES VOL 2 FINAL
APPENDICIES\PNR_ES_VOL2_APPNDX L_INDUCED SEISMICITY.DOCX
Page L36
99. Parallel to the Woodsfold Fault are a series of smaller faults that form a series of half-grabens and a single full-graben on the west side of the Woodsfold Fault. The largest of these smaller faults comprise the Thistleton Fault which run roughly north to south, being mapped for 13km, on a strike of around 015°, down throwing to the east/south-east
60.
100. A number of other faults are present within the vicinity of the Site that also penetrate through the target reservoir (see Figure 1), including the Moor Hey Fault and the Haves Ho Fault. These faults are antithetic to the Woodsfold Fault and their locations relative to the Site at various stratigraphic levels are presented in Figure 7 to Figure 9. The Moor Hey and Haves Ho Faults are previously unmapped by the BGS, but have been interpreted by Cuadrilla on the basis of the 3D geophysical (seismic) survey. The Haves Ho Fault is interpreted to extend through the Craven Group and outcrop at the surface, whereas the Moor Hey Fault is interpreted to terminate at the top of the Carboniferous strata defined by the Variscan unconformity.
101. The Thistleton Fault has been interpreted to be approximately 1.8km and 1.9km south-east of the Site at the top of the Upper Bowland Shale and top of the Lower Bowland Shale respectively. The Moor Hey Fault has been interpreted to be approximately 0.5km and 0.8km south-east of the Site at the top of the Upper Bowland Shale and top of the Lower Bowland Shale respectively. The Haves Ho Fault has been interpreted to be approximately 3.3km and 3.1km north-west of the Site at the top of the Upper Bowland Shale and top of the Lower Bowland Shale respectively.
102. Two local faults (referred to as Fault-1 and Fault-2), that are constrained to the Lower Bowland Shale (and may extend into the underlying Hodder Mudstone), are present approximately 0.3km north-west and 1.2km north of the Site at the top of the Lower Bowland Shale. Fault-1 can be seen within the geological cross section presented within Figure 1. Fault-2 is situated outside of the Project Area (Red Line) and is presented within the depth structure map for the top of the Lower Bowland Shale (see Figure 9).
103. In the context this assessment of induced seismicity, it is assumed that all regional faults within the area of the well site are critically stressed. This is a worst case scenario and means that the mechanism of transmitting an increase in fluid pressure to a fault plane, and hence inducing seismicity, is considered to be feasible for all regional faults that are critically orientated. However in reality not all regional faults will be critically stressed, therefore prior to the commencement of hydraulic fracturing activities Cuadrilla will carry out a study to understand whether nearby regional faults are indeed critically stressed or not. The findings of this study will be presented within the HFP that is required to be submitted and authorised by DECC before hydraulic fracturing can commence.
104. Associated with the faulting in the region are a series of north north-west trending broad anticlines and synclines which are shown best in the outcropping Mercia Mudstones. The two main folds are the Preesall Syncline to the north and the Kirkham Syncline to the east. The Preesall Syncline forms part of the Preesall Graben and is bound to the east by the Preesall Fault. The Kirkham Syncline is the resultant fold from the graben formed between the Thistleton and Woodsfold Faults. Thickening of the Sherwood Sandstone Group forms the Elswick Dome in the centre of the fold. Between the Preesall and Kirkham Synclines is an anticline-syncline system comprised of two bordering anticlines and a central syncline. The

Cuadrilla Bowland Limited Temporary shale gas exploration at Preston New Road Environmental Statement
Draft 3 | 24 May 2014
C:\RICHARD\RICHARD - WORK\JOBS\CUADRILLA\ISSUED DOCUMENTS\PRESTON NEW ROAD\2015-05-29 ES & PL DOCS FINAL\ES VOL 2 FINAL
APPENDICIES\PNR_ES_VOL2_APPNDX L_INDUCED SEISMICITY.DOCX
Page L37
largest component of this system is the most south-eastern fold which is termed the Weeton Anticline and runs down the western side of the Larbreck Fault
60.
Figure 6: Geological model for the Preston New Road well site presenting a schematic representation of the solid geology and key structural features within the vicinity of the Site. This figure is based on a north-west to south-east section through the Site as presented on Figure 7 to Figure 9. The interpretation of the 3D geophysical (seismic) survey was made by Cuadrilla and reviewed by Arup and DMT.
Anticipated solid geology L6.3.2
105. The geological unit descriptions are (unless otherwise stated) taken from British Geological Survey Geology of Southport and Formby (1948)
61. The BGS memoir
of Geology of Southport and Formby (1948)61
indicates that the site is likely to be underlain by Permo-Triassic sandstones and mudstones.
Triassic Mercia Mudstone Group
106. BGS (1948)61
describe Mercia Mudstone Group strata (formerly Keuper Marl) as comprising numerous thin sandstones and have been proven at Marton 4.5km west of the Site.

Cuadrilla Bowland Limited Temporary shale gas exploration at Preston New Road Environmental Statement
Draft 3 | 24 May 2014
C:\RICHARD\RICHARD - WORK\JOBS\CUADRILLA\ISSUED DOCUMENTS\PRESTON NEW ROAD\2015-05-29 ES & PL DOCS FINAL\ES VOL 2 FINAL
APPENDICIES\PNR_ES_VOL2_APPNDX L_INDUCED SEISMICITY.DOCX
Page L38
107. It is an important stratigraphic unit that outcrops over much of the surrounding region. The Mercia Mudstone Group is up to 600m thick in the Formby area in the vicinity of the New Preston Road site
65. Mercia Mudstone is split into four
formations which outcrop in the area:
1. the Hambleton Mudstone at base (grey interlaminated mudstones and siltstones);
2. the overlying Singleton Mudstone (reddish brown and structureless);
3. overlain by the Kirkham Mudstones (banded reddish brown and greenish grey mudstones interlaminated with siltstones); and
4. the youngest of the Mercia Mudstone formations, the Breckells Mudstones (dominantly reddish brown and structureless)
60.
108. The BGS map61
shows the vicinity of the site to be underlain by Kirkham Mudstone.
109. Salt beds are present in the Singleton and Kirkham Mudstones, especially near Preesall, where the salt has been removed by groundwater solution for industrial purposes
60
Triassic Sherwood Sandstone Group
110. Sherwood Sandstone Group strata are described as red to red-brown and fine- to medium-grained sandstone with occasional subordinate coarser beds
60. Red silty
mudstone beds no thicker than 0.6m are present with flakes or sub-angular clasts of similar mudstone present rarely within the sand units. The Sherwood Sandstone is described as being of either water-laid or aeolian in origin. The Sherwood Sandstone is not reported by the BGS memoir (1948)
61. The Sherwood St. Bees
formation is a sub-group of the Sherwood Sandstone Group and described as red-brown, very fine- to medium grained, commonly micaceous sandstones, generally cross bedded with some parallel lamination, mudstone clasts and locally common, subordinate thin beds of greenish grey sandstone
66.
Permian Manchester Marls Formation
111. The Manchester Marls Formation is regionally around 200m thick60
. The Manchester Marls Formation is a Permo-Triassic, red or brown mudstone or siltstone with subordinate beds of red sandstone (slightly calcareous and very argillaceous).
112. There is currently no site specific borehole data for the Site. However, a depth structure map (see Figure 7) based on the interpretation of the 3D geophysical (seismic) survey presents the interpreted top of the Manchester Marls within the vicinity of the Site. The locations of interpreted faults are also presented in relation the surface representation of the Site location and Red Line.
65
BGS 2002, British Regional Geology: The Pennines and Adjacent Areas. Fourth Edition. 66
British Geological Survey (2014). <URL: http://www.bgs.ac.uk/lexicon/ accessed 11/03/2014]

Cuadrilla Bowland Limited Temporary shale gas exploration at Preston New Road Environmental Statement
Draft 3 | 24 May 2014
C:\RICHARD\RICHARD - WORK\JOBS\CUADRILLA\ISSUED DOCUMENTS\PRESTON NEW ROAD\2015-05-29 ES & PL DOCS FINAL\ES VOL 2 FINAL
APPENDICIES\PNR_ES_VOL2_APPNDX L_INDUCED SEISMICITY.DOCX
Page L39
Figure 7: Depth structure map illustrating the depth below ground level of the top of the Manchester Marls. The figure also presents the location of interpreted faults with a representation of the position of the site location and Red Line at the surface.
Permian Collyhurst Sandstone
113. The Collyhurst Sandstone comprises ‘medium to coarse grained grey-white and brown friable sandstone with aeolian origins’
61
114. The Collyhurst Sandstone is composed of fine to very coarse conglomerate with abundant shale clastics and red brown limestone (generally argillaceous and crystalline) within a sandstone matrix and interbedded with red brown fine to medium sandstone containing intraclasts of mudstone and other pebbles and thinner beds of mudstone and crystalline limestone. The thickness of the Collyhurst Sandstone varies considerably in the Fylde area.
Carboniferous Millstone Grit Group and Lower Coal Measures Group
115. The Millstone Grit Group was interpreted to be present at depths of between 1270m and 1750m (approximately 480m thickness). Regionally this part of the Carboniferous includes the following formations:
Rough Rock Group – Coarse grained feldspathic sandstone;
Middle Grit Group – Medium to coarse grained feldspathic sandstone with subordinate interbedded silty mudstone and siltstone; and

Cuadrilla Bowland Limited Temporary shale gas exploration at Preston New Road Environmental Statement
Draft 3 | 24 May 2014
C:\RICHARD\RICHARD - WORK\JOBS\CUADRILLA\ISSUED DOCUMENTS\PRESTON NEW ROAD\2015-05-29 ES & PL DOCS FINAL\ES VOL 2 FINAL
APPENDICIES\PNR_ES_VOL2_APPNDX L_INDUCED SEISMICITY.DOCX
Page L40
Upper Shale Group/Sabden Shale Group – Fine to coarse grained and pebbly feldspathic sandstone.
Wilpshire Grit Equivalent – Coarse grained sandstone with some pebbly beds separated by sequence of mainly thinly interbedded or interlaminated siltstone and sandstone.
116. A summary of the Carboniferous formations based on the Preston New Road-1 well prognosis is described in Table 5.
Table 5: Indicative depths, thicknesses and descriptions of formations of Carboniferous age. Ordered from youngest to oldest.
Age Group Sequence Depth Encountered
(m)
Thickness (m)
Description
Bashkirian Millstone Grit Group
Millstone Grit
1341m 189m Fine to very coarse grained feldspathic sandstones, interbedded with grey siltstones and mudstones.
Namurian Craven Group
Upper Bowland
1530m 390m Mainly thinly interbedded dark grey fissile mudstone and weakly calcareous or dolomitic blocky or platy, silty mudstone and siltstone.
Visean Lower Bowland
1920m 802m Mudstone, dark grey to black, blocky or shaly, calcareous pyritic, petroliferous, with subordinate interbedded limestones and sandstones. Limestones in the lower part especially include conglomerates and turbiditic debris beds.
Hodder Mudstone
2722m 783m+ Predominantly grey to dark grey mudstone, with subordinate and variable detrital limestone, siltstone and sandstone. Mudmound reef limestones, limestone boulder conglomerates and breccias locally, near the base. Soft sediment deformation, slumps, debris flows and gravity slides are widespread.
Carboniferous Craven Group
117. The Bowland Shale is interpreted to be at approximately 1530m below ground level; the full thickness of the Bowland Shale will be determined on completion of the vertical pilot hole. The Craven Group is composed of three units, the Upper Bowland Shale, the Lower Bowland Shale and the Hodder Mudstone.
118. The Upper Bowland Shale unit is described as:
“Lithologically, the greater part of the formation consists of thinly interbedded, dark, fissile mudstone and weakly calcareous and dolomitic, blocky or platy silty

Cuadrilla Bowland Limited Temporary shale gas exploration at Preston New Road Environmental Statement
Draft 3 | 24 May 2014
C:\RICHARD\RICHARD - WORK\JOBS\CUADRILLA\ISSUED DOCUMENTS\PRESTON NEW ROAD\2015-05-29 ES & PL DOCS FINAL\ES VOL 2 FINAL
APPENDICIES\PNR_ES_VOL2_APPNDX L_INDUCED SEISMICITY.DOCX
Page L41
mudstone and siltstone. In some parts of the sequence the carbonate content is higher, to the extent that locally mappable argillaceous limestones and dolomites occur… with individual beds up to 0.70m thick.”
67
119. There is currently no site specific borehole data for the Site. However, a depth structure map (see Figure 8) based on the interpretation of the 3D geophysical (seismic) survey presents the interpreted top of the Upper Bowland Shale within the vicinity of the Site. The locations of interpreted faults are also presented in relation the surface representation of the Site location and Red Line.
Figure 8: Depth structure map illustrating the depth below ground level of the top of the Upper Bowland Shale. The figure also presents the location of interpreted faults with a representation of the position of the site location and Red Line at the surface.
120. The Lower Bowland Shale unit is regionally between 55 and 400m thick67
and is composed of mudstone with variable amounts of sandstone and limestone. The BGS memoir for the country around Garstang
67 describes the shale as:
“Black, calcareous, foetid and petroliferous. Pyrite is common along joints and sometimes replaces bioclasts. Internal lamination is prevalent and the mudstones may be blocky or shaly. Fissile paper shales, which are so characteristic of the surrounding formation, are unusual. Interbedded limestones include argillaceous wackestones, packstones and breccias; sharp-based graded beds are common at some levels in the sequence. Nodular wackestones or “bullions”, which result
67
British Geological Survey. (1992). Geology of the country around Garstang. London: HMSO.

Cuadrilla Bowland Limited Temporary shale gas exploration at Preston New Road Environmental Statement
Draft 3 | 24 May 2014
C:\RICHARD\RICHARD - WORK\JOBS\CUADRILLA\ISSUED DOCUMENTS\PRESTON NEW ROAD\2015-05-29 ES & PL DOCS FINAL\ES VOL 2 FINAL
APPENDICIES\PNR_ES_VOL2_APPNDX L_INDUCED SEISMICITY.DOCX
Page L42
from localised early cementation of the mudstone, occur at discrete horizons. Fossils recovered from these nodules are undistorted by compaction and any fractures or cavities commonly bleed with mineral oil when freshly broken. The black mudstones at the base of the formation show a marked colour change from the pale and dark grey, locally olive and blue –grey colour of the Worston Shale Group, accompanied by a conspicuous reduction in bioturbation.”
67
121. There is also a major limestone unit, the Park Style Limestone Member (17m thick) within the lower part of Lower Bowland Shale unit
67 and is described as:
“These beds consist of medium- to coarse-grained packestone fining upwards into calcisiltite and eventually into argillaceous wackestone”
66.
122. There is currently no site specific borehole data for the Site. However, a depth structure map (see Figure 9) based on the interpretation of the 3D geophysical (seismic) survey presents the interpreted top of the Lower Bowland Shale within the vicinity of the Site. The locations of interpreted faults are also presented in relation the surface representation of the Site location and Red Line.
Figure 9: Depth structure map illustrating the depth below ground level of the top of the Lower Bowland Shale. The figure also presents the location of interpreted faults with a representation of the position of the site location and Red Line at the surface
123. The BGS Lexicon of Named Rock Units66
describes the Hodder Mudstone as follows:

Cuadrilla Bowland Limited Temporary shale gas exploration at Preston New Road Environmental Statement
Draft 3 | 24 May 2014
C:\RICHARD\RICHARD - WORK\JOBS\CUADRILLA\ISSUED DOCUMENTS\PRESTON NEW ROAD\2015-05-29 ES & PL DOCS FINAL\ES VOL 2 FINAL
APPENDICIES\PNR_ES_VOL2_APPNDX L_INDUCED SEISMICITY.DOCX
Page L43
“Predominantly grey to dark grey mudstone, with subordinate and variable detrital limestone, siltstone and sandstone. Mudmound reef (Waulsortian) limestones, limestone boulder conglomerates and breccias locally, near the base. Soft sediment deformation, slumps, debris flows and gravity slides are widespread.”
66
Ordovician, Silurian and Devonian
124. Ordovician and Silurian rocks (similar to those found in Cumbria to the north) are assumed to be composed of sedimentary and volcanic deposits
60. These
Ordovician and Silurian deposits are likely to overlain by Devonian Old Red Sandstone.
L6.4 Superficial geology
125. Quaternary superficial deposits overlie the Permo-Triassic bedrock in the Fylde area and are up to 50m thick (Allen et al. 1997)
68 and 30m thick in the
approximate vicinity of the Preston New Road well site. The superficial deposits comprise glacial, peri-glacial and post-glacial deposits. Contours of rockhead elevation (BGS, 1992) indicate that if the drift cover were absent, the majority of the Fylde peninsula would lie below sea level. Depth to rockhead is variable across the Fylde (with a range of -1 to -60 mAOD) as a result of a number of eroded buried channels into the top of the underlying bedrock, generally coincident with current major river channels, such as the River Wyre.
Figure 10: Generalised section of superficial deposits along Section 3 of Sheet 74 (from BGS (1989)
61).
126. The superficial geology of the region can be split into glacial and fluvio-glacial deposits of Devensian Age (120,000 to 10,000 years BP); and post glacial
68
Allen, D.J., Brewerton, L.J., Coleby, L.M., Gibbs, B.R., Lewis, M.A., MacDonald, A.M.,
Wagstaff, S.J., and Williams, A.T. (1997) The physical properties of major aquifers in England
and Wales. British Geological Survey Technical Report.WD/97/34.

Cuadrilla Bowland Limited Temporary shale gas exploration at Preston New Road Environmental Statement
Draft 3 | 24 May 2014
C:\RICHARD\RICHARD - WORK\JOBS\CUADRILLA\ISSUED DOCUMENTS\PRESTON NEW ROAD\2015-05-29 ES & PL DOCS FINAL\ES VOL 2 FINAL
APPENDICIES\PNR_ES_VOL2_APPNDX L_INDUCED SEISMICITY.DOCX
Page L44
deposits of Flandrian Age (10,000 years BP to present). These deposits are described in more detail in subsequent sections.
Glacial deposits (Devensian) L6.4.1
127. The regional Devensian glacial deposits can be subdivided into three main stratigraphic units
60; Lower Boulder Clay, Middle Sands and Upper Boulder Clay.
The Lower Boulder Clay, “a heavily compacted purple-grey till” which varies in thickness between 2.1m and 7.3m within the region. The Lower Boulder Clay is interpreted as being a ‘lodgement till’, which would have formed either by plastering of glacial debris from the sliding base of the moving ice sheet or by continual shearing of soft sediment moving en masse beneath the ice;
The Middle Sands, (also referred to ‘stratified sands’) lie between the Upper and Lower Boulder Clay units. The formation of the Middle Sands has been interpreted as washed in underneath the ice sheet which in its later stages is believed to have been floating on melt water; and
The Upper Boulder Clay is described as red-brown to blue-grey in colour and is noticeably sandier and less compact in texture than the Lower Boulder Clay. Throughout the region the till ranges from a thickness of 3 to 5m in western Flyde and up to 20 to 25m thick in eastern Flyde. Deposits are markedly thinner on higher ground formed by the Carboniferous outcrop
60. The Upper
Boulder Clay has been interpreted as ‘ablation till’, settled after the melt water at the base of the ice sheet drained away.
128. In addition to the three main glacial units described above, glacial lake (glaciolacustrine) and stream channel (glaciofluvial) deposits are locally mapped to the south of the River Wyre.
Post-glacial (Flandrian) deposits L6.4.2
129. Over much of the low ground in the north and south of the study area, the glacial deposits are overlain by a marine and estuarine sequence that covers a shelf rising inland to an old coastline lying at about 7m OD.
130. Within this sequence are layers of basal peat. Impersistent, thin peaty bands are also found throughout the Marine Alluvium. There are isolated areas of Head on sloping ground. These deposits are described as consisting of extensive sheets of weathered near-surface bedrock or drift deposits and are typically poorly consolidated sandy clay with ill-sorted angular sandstone fragments.
Superficial deposits local to Preston New Road L6.4.3
131. The BGS geological map indicates Glacial Till at the Preston New Road site and extending for over 1km radius from the site.
132. British Geological Survey borehole records have been reviewed however there is no existing ground investigation information for the Preston New Road site and the nearest available borehole records are approximately 1km northwest of the site. The nearest boreholes to the Preston New Road site are shallow boreholes to the north of Moss House Farm on the M55. They show slightly sandy, slightly gravelly Clay to 3mBGL; underlain by 4.1m of fine and medium Sand; below

Cuadrilla Bowland Limited Temporary shale gas exploration at Preston New Road Environmental Statement
Draft 3 | 24 May 2014
C:\RICHARD\RICHARD - WORK\JOBS\CUADRILLA\ISSUED DOCUMENTS\PRESTON NEW ROAD\2015-05-29 ES & PL DOCS FINAL\ES VOL 2 FINAL
APPENDICIES\PNR_ES_VOL2_APPNDX L_INDUCED SEISMICITY.DOCX
Page L45
which is 1.6m of slightly sandy Clay, 4.1m of fine and medium Sand and then another sandy Clay to the base of the hole at 15mBGL (-6.2mOD).
133. The nearest BGS borehole to Preston New Road that fully penetrates the superficial deposits, is located 2km to the northwest at Mythop. The log for this borehole does not give detail of the superficial deposits, however it does indicate that rockhead is at 34.1mBGL (-21.9mOD).
134. Other nearby boreholes which fully penetrate the superficial deposits are located at Weeton Camp (3km north), Kirkham (6km east). The thickness of the superficial deposits at these locations was relatively consistent, and ranged between 29 and 36m. The superficial deposits in both boreholes were stratified.
135. The borehole at Weeton Camp encountered 7m of Upper Boulder Clay over 8m of fluvioglacial Middle Sands. Below the Middle Sands another layer of clay (Lower Boulder Clay) was encountered of 14m thickness. To the north at Thistleton Bridge the superficial geology contained much coarser material and as noted to contain boulders. The Upper Boulder Clay is interpreted as being approximately 3.5m thick over a 15m layer of Middle Sands described as sand, gravel, and boulders. The Lower Boulder Clay is interpreted as being present between 18.5mBGL and 35.6mBGL, where the clay content of the superficial deposits increases. This strata is described as clay with boulders, and classified as a sandy marl.
136. The Kirkham borehole is located on peat (5.3m thick) and glacial sands (approx. 20m thick), with the Upper Boulder Clay absent, A 10.6m layer of compact stony clay (Lower Boulder Clay) was encountered below the glacial sands.
L6.5 Regional stress data
137. The in situ stress field that currently affects an area and their interaction with the faulting within the region is a key relationship in assessing the induced seismicity risk. Pre-existing faults will have formed under previous stress conditions but their reactivation and the orientation of the displacement that occurs is related to the current stress regime. It can be used to predict the orientation of potential fractures induced by hydraulic fracturing and the stress state of faults.
138. The principal stresses that are applied to a rock can be divided into three components, the vertical component (σv) and two horizontal components (σh max and σh min). The vertical component of stress is generally assumed to equal the weight of the overlying rock. The two horizontal components represent the minimum and maximum horizontal stresses and are a related to the vertical stress, the stress history of the area, regional tectonic stresses and local stress perturbations due to the structural setting. Changes in minimum horizontal stress are interpreted with depth. Fractures will tend to open up (the width) in the direction of minimum horizontal stress and grow/propagate parallel to the direction of the maximum horizontal stress
69, therefore it is important to
understand the direction of stress directions both for exploration purposes, but also for mitigation of induced seismicity.
139. The GMI (2011)51
report summarises the local stress in the vicinity of the Preese Hall well. The average σh max azimuth from the Preese Hall-1 well was recorded as
69
Richard E. Goodman (1989). Introduction to Rock Mechanics, 2nd
Edition. University of
California at Berkeley.

Cuadrilla Bowland Limited Temporary shale gas exploration at Preston New Road Environmental Statement
Draft 3 | 24 May 2014
C:\RICHARD\RICHARD - WORK\JOBS\CUADRILLA\ISSUED DOCUMENTS\PRESTON NEW ROAD\2015-05-29 ES & PL DOCS FINAL\ES VOL 2 FINAL
APPENDICIES\PNR_ES_VOL2_APPNDX L_INDUCED SEISMICITY.DOCX
Page L46
173° ± 7° as shown in Figure 11 below. The Preese Hall-1 well lies approximately 3.5km north of the Site. No specific information on the in situ stress field for the Site is available but it is expected that the orientation of the regional stress will be relatively consistent across the region however, the stress orientation and magnitude will be measured in the vertical pilot hole and will form the basis of the stress information used in the HFP that will be authorised by DECC before hydraulic fracturing can commence.

Cuadrilla Bowland Limited Temporary shale gas exploration at Preston New Road Environmental Statement
Draft 3 | 24 May 2014
C:\RICHARD\RICHARD - WORK\JOBS\CUADRILLA\ISSUED DOCUMENTS\PRESTON NEW ROAD\2015-05-29 ES & PL DOCS FINAL\ES VOL 2 FINAL
APPENDICIES\PNR_ES_VOL2_APPNDX L_INDUCED SEISMICITY.DOCX
Page L47
Figure 11: Preese Hall-1 average σh max azimuth (from GMI 201151
) shown on the World Stress Map
53.
140. The de Pater & Baisch (2011)4 report synthesizes the GMI (2011)
51 and StrataGen
(2011)52
reports, and reports on the magnitude of the principal stresses with depth, see Figure 12 below. The following formula can be used to calculate the vertical stress, σv.
σv = ∫ ( ( ) )
Where: ρ(z) formation bulk density
g gravitational acceleration
z depth

Cuadrilla Bowland Limited Temporary shale gas exploration at Preston New Road Environmental Statement
Draft 3 | 24 May 2014
C:\RICHARD\RICHARD - WORK\JOBS\CUADRILLA\ISSUED DOCUMENTS\PRESTON NEW ROAD\2015-05-29 ES & PL DOCS FINAL\ES VOL 2 FINAL
APPENDICIES\PNR_ES_VOL2_APPNDX L_INDUCED SEISMICITY.DOCX
Page L48
141. Horizontal stresses can be determined by analysing the pressure decline that follows the in-situ shut-in period of a mini-fracture test. Horizontal stresses are determined from the shut-in pressure (the steady pressure reached during crack propagation of a hydraulic fracturing test). The following formulae, presented and discussed within GMI (2011)
51, were extrapolated from test results, whereby K
and K’ are effective stress ratios
Where: K and K’ = effective stress ratios
σhmin = minimum horizontal stress
σhmax = maximum horizontal stress
u = pore pressure.
142. Direct measurements of pore pressure were not available during the Preese Hall operations due to the low permeability of the Bowland shales. Therefore GMI (2011)
55 assumed a hydrostatic pore pressure profile. The formulas used by GMI
(2011)51
above calculate the effective stresses in the rock.
143. The StrataGen (2011)52
calculations assume a column of water yielding slightly different horizontal stress results.
144. De Pater and Baisch (2011)4 report the findings of the two reports.
σh max = between 68.9 MPa to 71.7 MPa.
σh min = between 41.4 MPa to 44.1 MPa.

Cuadrilla Bowland Limited Temporary shale gas exploration at Preston New Road Environmental Statement
Draft 3 | 24 May 2014
C:\RICHARD\RICHARD - WORK\JOBS\CUADRILLA\ISSUED DOCUMENTS\PRESTON NEW ROAD\2015-05-29 ES & PL DOCS FINAL\ES VOL 2 FINAL
APPENDICIES\PNR_ES_VOL2_APPNDX L_INDUCED SEISMICITY.DOCX
Page L49
Figure 12: Graph showing the relationship of depth (m and ft.) to the magnitude of principle effective stresses (MPa). The information was recorded at the Preese Hall-1 well approximately 3.5km north of the Preston New Road site during a series of mini-fracture tests. The bold shape markers are taken from de Pater and Baisch (2011)
4. The crossed
markers are taken from the GMI (2011)51
report table of stress results. The dashed markers are calculated from the formulas above given in the GMI (2011)
51 report.
145. The equations above give average σv, σh max and σh min values of 62.2MPa, 73.4MPa and 43.6MPa respectively at approximately 2,440m.
0
1000
2000
3000
4000
5000
6000
7000
8000
9000
10000
0
500
1000
1500
2000
2500
3000
0 20 40 60 80 100
Dep
th (ft) D
epth
(m
)
Stress (MPa)
σv
σhmin
σhmax
σv (calc)
σhmin (calc)
σhmax (calc)
Shmin (MPa)
Shmax (lower) (MPa)
Shmax (upper) (MPa)

Cuadrilla Bowland Limited Temporary shale gas exploration at Preston New Road Environmental Statement
Draft 3 | 24 May 2014
C:\RICHARD\RICHARD - WORK\JOBS\CUADRILLA\ISSUED DOCUMENTS\PRESTON NEW ROAD\2015-05-29 ES & PL DOCS FINAL\ES VOL 2 FINAL
APPENDICIES\PNR_ES_VOL2_APPNDX L_INDUCED SEISMICITY.DOCX
Page L50
146. In addition the World Stress Map53
, Baptie (2010)70
and data from the Nuclear Decommissioning Authority at Sellafield
71, provide the following complementary
stress data as presented in Table 6.
Table 6: Stress data from alternative sources.
Source σh,min σh,max σh, max
direction Comments
De Pater and Baisch (2011)
4
43.6MPa 73.4MPa 173° ± 10° As shown in Figure 12 at 8000ft depth (2438m)
World Stress Map
53
13.8MPa 43.7MPa 161° ± 12° Several test results exist for the region. Results shown here at 1500m depth.
Baptie (2010)
70
- - 139° Estimates of magnitude of ridge push force vary between 20-40MPa.
NDA data71
16MPa 29MPa 165° Horizontal stresses at 800m depth. These results are similar to those shown at 800m on the graph above.
147. It is important to understand that the effective stress values recorded above are at different depths which accounts for the discrepancy between readings. The test methods used to calculate the stress values vary depending upon the reporting requirements in each case.
148. Both the σh max and σh min magnitudes as well as the σh max azimuth given by the de Pater & Baisch (2011)
4 synthesis report, lie within 10 to 20° of that collected by
The World Stress Map53
, Baptie (2010)70
and the NDA71
. This difference in the orientation of principle stresses at Preese Hall-1 compared to regional data is important to consider, but it is within reasonable ranges of the data presented by GMI (2011)
51 and therefore this is a reasonable source of data to establish the
effect of regional in situ stresses on faults within the vicinity of the Site.
149. On the basis of the data reviewed it is considered the de Pater & Baisch (2011)4
report can be used as a reasonable source to establish the effect of the regional stress on localised faulting around the Preston New Road site. Therefore a σh max of between 68.9 and 71.7MPa and σh min between 41.4 and 44.1MPa is appropriate.
150. Based on the mechanisms outlined above, the orientation of faults within the area (north north-east to south south-west) and the existing in situ stress regime, any fault movement within the vicinity of the Site is expected to be strike slip
4. A key
consideration from stress field analysis in the Bowland Shales is that there are large differential stresses (i.e. the difference between σh min and σh max is large)
4
however, the stress orientation and magnitude will be measured in the vertical pilot hole and will form the basis of the stress information used in the HFP that will be authorised by DECC before hydraulic fracturing can commence.
70
Baptie, B. (2010). Seismogenesis and state of stress in the UK. Tectonophysics, Volume 482,
pp. 150-159. 71
Tunbridge, L. W. (1994). Resolution Of In-Situ Stress Orientation and Magnitude at Sellafield,
s.l.: Nirex.

Cuadrilla Bowland Limited Temporary shale gas exploration at Preston New Road Environmental Statement
Draft 3 | 24 May 2014
C:\RICHARD\RICHARD - WORK\JOBS\CUADRILLA\ISSUED DOCUMENTS\PRESTON NEW ROAD\2015-05-29 ES & PL DOCS FINAL\ES VOL 2 FINAL
APPENDICIES\PNR_ES_VOL2_APPNDX L_INDUCED SEISMICITY.DOCX
Page L51
L6.6 Natural seismicity
151. This section provides a discussion on natural seismicity within the UK and is presented to put the Preese Hall 2.3ML and 1.5ML induced seismic events of April and May 2011 respectively in a UK seismicity perspective.
152. The British Geological Survey holds an extensive record of seismic events in the UK with data going back to before the 1700’s. The records vary in both quality and sensitivity over time, with a marked improvement of the quality of data from 1970 onwards due to the introduction of a dedicated monitoring program.
153. Seismicity is concentrated in north-west England, south-west England, northern Midlands as well as the Welsh border. One of the most seismically active areas in the UK is the Caernarvon area in North Wales
72.
154. The north-east and south-east records a lower seismicity, however there is some focused activity near Chichester and Dover. Offshore there is activity in the English Channel and in the Central Grabens of the North Sea.
72.
155. Table 7 shows the guidelines for catalogue completeness, in terms of recorded magnitudes. For example, a catalogue of events between 1985 and the present day will only be complete for magnitudes greater than 2.5 MW.
Table 7: Catalogue completeness for British earthquakes depending on year.
Year Magnitude greater than (Mw)
1985 2.5
1970 3.0
1750 4.0
1650 5.0
156. Figure 13 shows the spatial distribution of seismic events within the 10,000km2
area centred on the Preston New Road site, which shows the local area surrounding the Preston New Road site is affected by a relatively low level of seismicity. The location induced seismic events that occurred at the Preese Hall well site in 2011 are located 3.5km to the north of the Preston New Road well site. A cluster of events to the south of the site are due to induced seismic events related to coal mining. However, older earthquakes in some areas are shown on the map.
157. Compared to the regional seismicity of the UK, the seismic events induced by hydraulic fracturing at the Preese Hall well site are within the range of magnitudes commonly felt across the country; typically the UK will get tens to hundreds of seismic events of a similar magnitude to those induced during hydraulic fracturing each year. A summary of natural seismic events (onshore and offshore) above the detection limits that have occurred within the region are summarised in Figure 13.
72
Musson, R. (2006). British Earthquakes, s.l.: British Geological Survey.

Cuadrilla Bowland Limited Temporary shale gas exploration at Preston New Road Environmental Statement
Draft 3 | 24 May 2014
C:\RICHARD\RICHARD - WORK\JOBS\CUADRILLA\ISSUED DOCUMENTS\PRESTON NEW ROAD\2015-05-29 ES & PL DOCS FINAL\ES VOL 2 FINAL
APPENDICIES\PNR_ES_VOL2_APPNDX L_INDUCED SEISMICITY.DOCX
Page L52
Figure 13: Seismic events within a 10,000km2 area centred on the Preston New Road
Site73
. Data was obtained from the BGS earthquake catalogue for the UK. The age range of the BGS catalogue for the area is from 1931 to the present day. The figure is orientated north.
158. There have been a number of recent seismic events in the Irish Sea. On the morning of the 25
th August 2013 there was a series of 3 events including a
magnitude ML 3.2 event. This event was felt extensively around the Lancashire coast with isolated reports from Bangor in North wales and the Isle of Man, as shown in Figure 14. There were no reports of damage. On the 31
st August 2013 a
seismic event of magnitude ML 2.6 also occurred, as shown in Figure 15. The cluster of these events would imply that they form part of the same series of events; however the event on the 31
st had its hypocentre 5.3km deeper than the
events that preceded it although vertical resolution here is poor.
73
From e-mail communication with the BGS dated 15/08/2013

Cuadrilla Bowland Limited Temporary shale gas exploration at Preston New Road Environmental Statement
Draft 3 | 24 May 2014
C:\RICHARD\RICHARD - WORK\JOBS\CUADRILLA\ISSUED DOCUMENTS\PRESTON NEW ROAD\2015-05-29 ES & PL DOCS FINAL\ES VOL 2 FINAL
APPENDICIES\PNR_ES_VOL2_APPNDX L_INDUCED SEISMICITY.DOCX
Page L53
Figure 14: Location of magnitude 3.2 ML seismic event that occurred on 25th August 2013, showing locations where the event was felt
74. The figure is orientated north.
Figure 15: Location of seismic events in the Irish Sea in late October
75. The figure is
orientated north.
74
British Geological Survey (2013). URL:
<http://www.quakes.bgs.ac.uk/earthquakes/recent_events/20130825095801.html#page=summary>
[site accessed: 06/09/2013]. 75
British Geological Survey. (2013). URL:
<http://earthquakes.bgs.ac.uk/earthquakes/recent_events/20130831063458.html#page=additional>
[site accessed: 06/09/2013].

Cuadrilla Bowland Limited Temporary shale gas exploration at Preston New Road Environmental Statement
Draft 3 | 24 May 2014
C:\RICHARD\RICHARD - WORK\JOBS\CUADRILLA\ISSUED DOCUMENTS\PRESTON NEW ROAD\2015-05-29 ES & PL DOCS FINAL\ES VOL 2 FINAL
APPENDICIES\PNR_ES_VOL2_APPNDX L_INDUCED SEISMICITY.DOCX
Page L54
159. The largest instrumental onshore seismic event occurred on 19th July 1984 in the Lleyn Peninsula, North Wales and had a magnitude of 5.4ML. The seismic event occurred at a depth of 22km and was felt over an area of around 240,000km
2. The
maximum intensity was 6 EMS (European Macroseismic Scale), which is defined as “slightly damaging” and an abstracted description of potential effects from the EMS scale may include the following:
160. “Many people are frightened and run outdoors. Some objects fall. Many houses suffer slight structural damage like hair-line cracks and fall of small pieces of plaster. Some structural damage to the most vulnerable structures”.
161. Actual recorded damage consisted of widespread cracks in plaster and falls of some chimneys and weak plaster.
162. Due the location of earthquakes and the relative distribution of urban centres, the largest earthquakes do not necessarily cause the greatest amount of damage. The most damaging onshore seismic event was the 1884 Colchester earthquake. The BGS estimates that the magnitude of the seismic event was 4.6 ML, with a maximum intensity in the epicentral area of 8 EMS. 1,250 buildings were estimated to have been affected by damage with accounts listing collapse of chimney stacks, roofs untiled and broken windows
76. There was considerable
damage to churches, with a spire reported collapsed at one church.
L6.7 Background seismic monitoring
163. Naturally and anthropogenically induced signals are produced across the UK constantly. It is important to measure and understand the background seismicity in order to understand the potential level of induced seismicity from hydraulic stimulation in the larger seismic context.
164. To ensure the performance of the real-time monitoring systems noise measurements were taken between the 6
th and 13
th November, 2013 by Q-con
GmbH at the proposed seismic monitoring stations around the Preston New Road site
77. This is discussed further in Section L6.7.2.
165. In order to monitor the background seismicity, Cuadrilla installed a surface seismic monitoring system around the Becconsall drilling site, which is located approximately 15km south of Blackpool (10.5km south of the site).
166. The background seismic monitoring system installed at Becconsall comprised four monitoring stations (designated; D01, D02, D03 and D04) and use LE3D three-component seismometers and Smart-24R® 24bit data loggers. The background monitoring was undertaken between 26th April 2012 and 1st October 2012
78.
76
Essex Family History. <URL: http://www.essex-family-history.co.uk/earthquake.htm> 77
Q-con GmbH (2013) Plumpton Seismic Network – Siting & Noise Measurements. Q-con report
CUA005 78
Stang, H. (2012) Seismic Monitoring Network Becconsall, Installation & Commissioning. Q-
con report CUA002.

Cuadrilla Bowland Limited Temporary shale gas exploration at Preston New Road Environmental Statement
Draft 3 | 24 May 2014
C:\RICHARD\RICHARD - WORK\JOBS\CUADRILLA\ISSUED DOCUMENTS\PRESTON NEW ROAD\2015-05-29 ES & PL DOCS FINAL\ES VOL 2 FINAL
APPENDICIES\PNR_ES_VOL2_APPNDX L_INDUCED SEISMICITY.DOCX
Page L55
Figure 16: Google Earth Pro image of the 4 station location. Diameter of the circles is 500m and 3,000m, respectively. The location of Becconsall 1 is indicated by an arrow (Data SIO, NOAA, US Navy, NGA, GEBCO – © Google Earth Pro, © Infoterra Ltd & Bluesky 2013).
Background Seismicity L6.7.1
167. The mean background noise level for each locality is reported by Q-con. An extract of this data is shown below graphically in Figure 17 below for the period between 1
st June and 1
st July 2012.
N
500m

Cuadrilla Bowland Limited Temporary shale gas exploration at Preston New Road Environmental Statement
Draft 3 | 24 May 2014
C:\RICHARD\RICHARD - WORK\JOBS\CUADRILLA\ISSUED DOCUMENTS\PRESTON NEW ROAD\2015-05-29 ES & PL DOCS FINAL\ES VOL 2 FINAL
APPENDICIES\PNR_ES_VOL2_APPNDX L_INDUCED SEISMICITY.DOCX
Page L56
Figure 17: Background noise as a function of time. (C) 01/06/12 – 01/07/12; (Extracted from Q-con seismic monitoring reports
56).
168. Figure 17 shows an example of the variation in background seismicity over the specified time. It shows the following features:
It is apparent that there is a strong correlation of the background noise between day and night;
Although there is a tight band of data between around 102 and 10
4nm/s there is
a consistent and persistent higher band of data shown up to approximately 106
nm/s. This higher level of noise shows a variability that is dependent on geographical location;
169. Two natural seismic events were recorded during this monitoring period which was also recorded by the BGS permanent monitoring network. A 1.6ML earthquake was recorded near Wigan with a hypocentral depth of around 8km and an epicentral distance of approximately 15km from the Becconsall-1 well. These observations demonstrate that natural seismicity occurs in the vicinity of the Fylde.
Waveform recordings from these natural events were used to analyse the near surface amplitude amplification at the Becconsall site and the amplitude attenuation with distance.
Background siting and noise measurements for the L6.7.2
Preston New Road surface array
170. Background siting and noise measurements of the proposed Preston New Road seismic network were undertaken by Q-con on the 6th to 13th November, 2013. To ensure that the performance of the proposed surface array meets the requirements of the system.
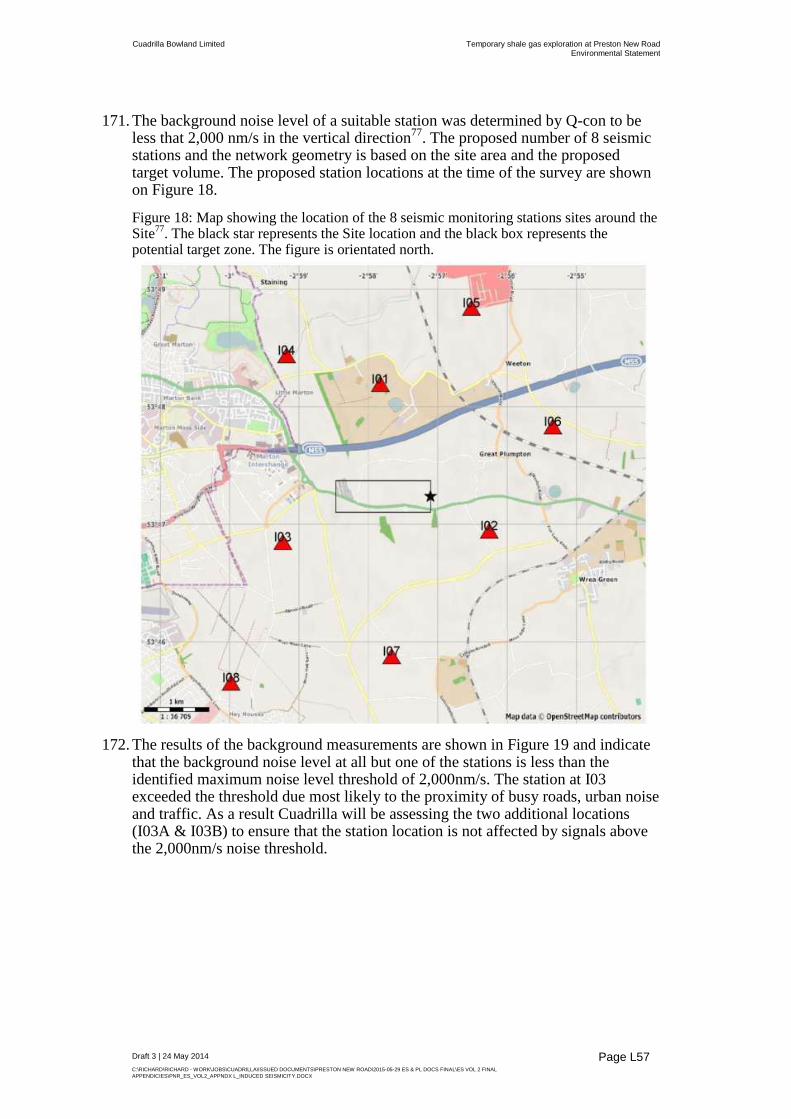
Cuadrilla Bowland Limited Temporary shale gas exploration at Preston New Road Environmental Statement
Draft 3 | 24 May 2014
C:\RICHARD\RICHARD - WORK\JOBS\CUADRILLA\ISSUED DOCUMENTS\PRESTON NEW ROAD\2015-05-29 ES & PL DOCS FINAL\ES VOL 2 FINAL
APPENDICIES\PNR_ES_VOL2_APPNDX L_INDUCED SEISMICITY.DOCX
Page L57
171. The background noise level of a suitable station was determined by Q-con to be less that 2,000 nm/s in the vertical direction
77. The proposed number of 8 seismic
stations and the network geometry is based on the site area and the proposed target volume. The proposed station locations at the time of the survey are shown on Figure 18.
Figure 18: Map showing the location of the 8 seismic monitoring stations sites around the Site
77. The black star represents the Site location and the black box represents the
potential target zone. The figure is orientated north.
172. The results of the background measurements are shown in Figure 19 and indicate that the background noise level at all but one of the stations is less than the identified maximum noise level threshold of 2,000nm/s. The station at I03 exceeded the threshold due most likely to the proximity of busy roads, urban noise and traffic. As a result Cuadrilla will be assessing the two additional locations (I03A & I03B) to ensure that the station location is not affected by signals above the 2,000nm/s noise threshold.

Cuadrilla Bowland Limited Temporary shale gas exploration at Preston New Road Environmental Statement
Draft 3 | 24 May 2014
C:\RICHARD\RICHARD - WORK\JOBS\CUADRILLA\ISSUED DOCUMENTS\PRESTON NEW ROAD\2015-05-29 ES & PL DOCS FINAL\ES VOL 2 FINAL
APPENDICIES\PNR_ES_VOL2_APPNDX L_INDUCED SEISMICITY.DOCX
Page L58
Figure 19: Results of background noise measurements at Preston New Road. Blue bars denote the median ground velocity at the individual sites computed in the frequency band 5-40 Hz on the vertical channel. The percentage of values below a threshold of 2,000 nm/s as well as the median noise value is stated on top of each bar. (C) 06/11/13 – 13/11/13; (Extracted from Q-con report
77).
173. At all station locations, the background noise level is dominated by local sources, in particular traffic, industry, farming and animals (cattle and sheep). However these noise contaminations usually occur only at one station at a time and therefore do not reduce the detection capabilities of the station network.
174. Figure 20 shows an example of the variation in the amplitude of background seismicity (in the frequency band 5-40Hz) both vertically and horizontally at site I06 over 29.5 hours from the 11
th November to 12
th November 2013. It shows the
following features:
It is apparent that there is a strong difference in the level of background noise between day and night;
The night –time noise is manifested as a tight band of data between 10-6
and 10
-7 nm/s.

Cuadrilla Bowland Limited Temporary shale gas exploration at Preston New Road Environmental Statement
Draft 3 | 24 May 2014
C:\RICHARD\RICHARD - WORK\JOBS\CUADRILLA\ISSUED DOCUMENTS\PRESTON NEW ROAD\2015-05-29 ES & PL DOCS FINAL\ES VOL 2 FINAL
APPENDICIES\PNR_ES_VOL2_APPNDX L_INDUCED SEISMICITY.DOCX
Page L59
Figure 20: Amplitude of background seismic noise as a function of time in the frequency band 5-40Hz as a function of time measure at site I06. The background noise level is calculated on a sliding time window of 1 minute length and is expressed by the 2σ interval of ground movement (so-called “95% interval I95”, i.e. 95% of the measured data is below the given noise amplitude). Top: vertical component, the red line indicates a threshold amplitude of 2,000 nm/s. The percentage of all data points not exceeding this threshold and the median I95 value is given in the bottom left corner. Bottom: horizontal components, the red line indicates a noise amplitude of 10,000 nm/s. Extracted from Q-con seismic monitoring reports
77).
L6.8 Maximum magnitude estimate
175. During and after hydraulic fracturing of the Preese Hall-1 two exceptional induced seismic events were recorded (2.3 ML and 1.5 ML), which were felt at the surface and caused some public attention and media interest
4.
176. It is proposed that the exploration activities at the Site will include hydraulic fracturing. However, with implementation of the proposed mitigation measures (see Section L10), it is anticipated that seismic events of similar magnitude to the Preese Hall events or greater are very unlikely to occur. Nonetheless, it is important to understand the potential maximum magnitude so that a ‘before mitigation’ scenario can be assessed as part of the EIA. The following text discusses the work that has been done to determine a maximum magnitude associated with the planned fracturing operations in the area.

Cuadrilla Bowland Limited Temporary shale gas exploration at Preston New Road Environmental Statement
Draft 3 | 24 May 2014
C:\RICHARD\RICHARD - WORK\JOBS\CUADRILLA\ISSUED DOCUMENTS\PRESTON NEW ROAD\2015-05-29 ES & PL DOCS FINAL\ES VOL 2 FINAL
APPENDICIES\PNR_ES_VOL2_APPNDX L_INDUCED SEISMICITY.DOCX
Page L60
Maximum magnitude results L6.8.1
177. The results from the modelling carried out by de Baisch and Vörös (2011)79
indicate that the maximum likely magnitude of induced seismic event in the Fylde area caused by fracture operations equivalent to those carried out at the Preese Hall well is 3.1 ML. Their results are presented in Figure 21and discussed below.
178. A maximum 3.1 ML event is supported by the observation of maximum magnitudes of coal mining induced earthquakes in the UK (up to magnitude 3.0 ML), which is considered to provide a realistic upper limit of induced seismicity
13.
Figure 21: Maximum earthquake magnitude simulated in for various parameter combinations as a function of the parameter storage coefficient
4. A good fit to observation
data was only obtained for parameter combinations leading to Mmax = 2.4, however in the parameter range considered possible, the maximum magnitude is ML = 3.1.
179. The results indicate that event magnitudes increase as the storage coefficient (S) decreases. The storage coefficient (S) of 10
-10m/Pa was based upon a best fitting
model (for parameters of porosity and fault thickness) and subsequent comparison with observational data. In this context, the storage coefficient refers to the volume of water that an aquifer releases or takes into storage per unit surface area per unit change in head. A good fit to observation data was only obtained for parameter combinations leading to Mmax = 2.4, however in the parameter range considered possible, the maximum magnitude is ML = 3.1.
180. Wong (2013)80
, states that the main weakness of this analysis is the method of modelling fracture propagation
80, however this is mitigated by the model as it
simplifies the shear plane to a single plane. Simplifying the model however does present the weakness of under-representing the hydraulic opening properties of the rock and under estimating the amount of seismic events. Wong (2013)
80
considers the probability of this maximum value being exceeded to be low.
79
Baisch, S., Vörös, R. (2011). Geomechanical study of Blackpool seismicity. Report No.
CUA001. 80
Wong, J. (2013). Hydraulic Fracture Modelling Method, s.l.: Arup.

Cuadrilla Bowland Limited Temporary shale gas exploration at Preston New Road Environmental Statement
Draft 3 | 24 May 2014
C:\RICHARD\RICHARD - WORK\JOBS\CUADRILLA\ISSUED DOCUMENTS\PRESTON NEW ROAD\2015-05-29 ES & PL DOCS FINAL\ES VOL 2 FINAL
APPENDICIES\PNR_ES_VOL2_APPNDX L_INDUCED SEISMICITY.DOCX
Page L61
181. With the implementation of the proposed mitigation measures (see Section L10) a 3.1 ML seismic event is considered very unlikely
4.
Comparative induced seismicity L6.8.2
182. The following text discusses the results of a comparison of typical maximum magnitudes from other industries within the UK. Induced seismicity associated with other industries is discussed in more detail within Section L3.3 and is summarised within Table 8.
Table 8: Comparison of maximum magnitude of seismicity from different common sources of induced seismicity, adapted from Davies et al. (2013)
39.
Industry Typical maximum magnitudes*
Mining 1.6 to 5.6 M
Tunnelling -1.0 to 2.4 M
Oil and gas 1.0 to 7.3 M
Water injection (Oil and gas) 1.9 to 5.1 M
Reservoir impoundment 2.0 to 6.3 (possible 7.9 M)
Waste disposal 2.0 to 5.6 M
Research boreholes 2.8 to 3.1 M
Solution mining 1.0 to5.2 M
Geothermal operations 1.0 to 4.6 M
Hydraulic fracturing to 3.8 M
*Magnitude type varies (MW, ML and M0)
183. Green et al. (2012)13
considered numerical simulations and historical records of maximum observed magnitudes from coal-mining induced earthquakes to conclude that a realistic maximum magnitude of induced seismicity associated with hydraulic fracturing is around 3ML. In addition, the Royal Society and Royal Academy of Engineering (2012) report stated that “There is an emerging consensus that the magnitude of seismicity induced by hydraulic fracturing would be no greater than 3 ML”.
184. As well as comparing the magnitude of induced seismic events to other industries, it is also important to put induced seismicity into the context of the natural seismicity of an area. On the basis of magnitude recurrence rates of natural seismic events in the UK a magnitude 3ML natural seismic event is estimated to occur approximately three times a year. Such an event would typically be felt by a few people who are at rest or in the upper floors of buildings at levels of vibrations similar to that of a passing truck
14. It should be noted that these natural
events usually occur at greater depths (5 to 20km) and therefore the impact on the Earth’s surface is not directly comparable to induced seismicity (typically at depths less than 5km).
185. When compared to other common sources of induced seismicity, the maximum magnitude of seismicity related to hydraulic fracturing is relatively low. To date,

Cuadrilla Bowland Limited Temporary shale gas exploration at Preston New Road Environmental Statement
Draft 3 | 24 May 2014
C:\RICHARD\RICHARD - WORK\JOBS\CUADRILLA\ISSUED DOCUMENTS\PRESTON NEW ROAD\2015-05-29 ES & PL DOCS FINAL\ES VOL 2 FINAL
APPENDICIES\PNR_ES_VOL2_APPNDX L_INDUCED SEISMICITY.DOCX
Page L62
the largest induced seismic event experienced by the UK was approximately 3.1 ML in 1984 in Nottinghamshire due to mining activities
81.
L6.9 Independent review maximum magnitude
186. As part of the EIA process for assessment of induced seismicity associated with hydraulic fracturing, Arup commissioned an independent review by Geomecon GmbH of Germany into the maximum magnitude estimates that were carried out by Q-con for the Bowland Basin. The following describes the work carried out by Geomecon in the context of the following key requirements:
Review of maximum magnitude simulations carried out by Q-con;
Additional comments of the estimation of potential maximum magnitude; and
Estimation of maximum magnitudes following implementation of mitigation measures.
Review of maximum magnitude simulations by Q-con L6.9.1
187. This review is based on the following key publications:
Baisch and Voros (2011). Geomechanical Study of Blackpool Seismicity79
;
De Pater and Baisch (2011). Geomechanical Study of Bowland Shale Seismicity, Synthesis Report
4; and
Baisch et al. (2010). A numerical model for fluid injection induced seismicity at Soultz-sous-Forêts
82.
188. The methodology used by Q-con to predict the maximum magnitude of an induced seismic event within the Bowland Basin requires assumptions that simplify the model. The validity of these assumptions cannot be entirely verified, therefore calibration of the model parameters based on field experience is required. This has been done by Q-Con for the Upper Bowland Shale based on the range of the observed effects from the previous Preese Hall induced seismic event. This type of modelling with the associated assumptions is frequently used for this type of assessment. Their predictive result is that an induced seismic event can be maximum 3.1ML in the Bowland Shale with similar injection volumes to that used at Preese Hall-1 well.
Additional comments on the estimation of potential L6.9.2
maximum magnitude
189. As already stated by de Pater and Baisch (2011)4 the seismic response to hydraulic
treatment in Preese Hall shows characteristics that resemble geothermal reservoirs much more than stimulation of hydrocarbon reservoirs, like overall larger magnitudes of seismic events, the increase of maximum magnitudes with time,
81
Redmayne, D. W. (1988). Mining induced seismicity in UK coalfields identified on the BGS
National Seismograph Network. Geological Society, London, Engineering Geology Special
Publications, Volume 5, pp. 405-413. 82
Baisch, S., Vörös, R., Rothert, E., Stang, H., Jung, R., Schellschmidt, R., (2010). A numerical
model for fluid injection induced seismicity at Soultz-sous-Forêts. International Journal of Rock
Mechanics & Mining Sciences. Vol.47, pp.405-413.

Cuadrilla Bowland Limited Temporary shale gas exploration at Preston New Road Environmental Statement
Draft 3 | 24 May 2014
C:\RICHARD\RICHARD - WORK\JOBS\CUADRILLA\ISSUED DOCUMENTS\PRESTON NEW ROAD\2015-05-29 ES & PL DOCS FINAL\ES VOL 2 FINAL
APPENDICIES\PNR_ES_VOL2_APPNDX L_INDUCED SEISMICITY.DOCX
Page L63
on-going seismic activity after shut-in and the largest magnitude event occurring after shut in.
Maximum magnitudes after mitigation measures L6.9.3
190. A Traffic Light System is one of the proposed mitigation measures to prevent seismic events that lead to felt seismicity at the surface. This is a monitoring and decision-making tool regarding the duration and intensity of pumping levels during hydraulic stimulations as it has been used in geothermal industry. It is based on observed unit increases in magnitude following fracture stages, often called the trailing effect or post-injection magnitude increase.
191. The observed trailing effect of the induced seismicity at the Preese Hall-1 well was a magnitude unit increase of 0.9
3. Observed trailing effects in other cases of
reservoir stimulation have led to a magnitude unit increase of 0.8 after shut-in (i.e. Deep- Heat-Mining Project, Basel
36). De Pater and Baisch (2011)
4 consider the
post-injection magnitude increase of 0.9 magnitude units to represent a worst case scenario. For conservatism, this assessment considers a worst case post-injection magnitude increase of 1.0 magnitude units.
192. Therefore, if a Traffic Light System Red level trigger of 0.5 ML occurs (as recommended by Green et al. (2012)
13) a post-injection magnitude increase will
be limited to 1.5 ML, which is considered to be the minimum limit of felt vibrations at the surface.
L6.10 Seismic Receptors
Introduction L6.10.1
193. This section provides a discussion of the identified potential seismic receptors within the Preston New Road well site study area. Potential receptors have been identified through a combination of desk based review and a study area walkover.
Methodology L6.10.2
Study Area
194. The size of the seismic study area was considered prior to the walkover. The radius was determined on the basis of a preliminary assessment of modelled ground motions (PGV). On the basis of this preliminary assessment a radius of 5km extending from the Preston New Road well site was considered reasonable to represent a study area for the purpose of carrying out the seismic walkover (see Figure 22).
195. A walkover of the Preston New Road well site study area was carried out by two Arup staff on Wednesday 9
th October 2013. The study area refers to an area with a
radius distance of 5km from the Preston New Road well site (see Figure 22 below).
196. The aim of the study area walkover was to develop an understanding of the potential seismic sensitive receptors local to the Preston New Road well site. This included understanding the typical construction and condition of various building types and infrastructure within the study area. It is noted that this study area walkover was not intended to form a complete survey of all buildings within the study.

Cuadrilla Bowland Limited Temporary shale gas exploration at Preston New Road Environmental Statement
Draft 3 | 24 May 2014
C:\RICHARD\RICHARD - WORK\JOBS\CUADRILLA\ISSUED DOCUMENTS\PRESTON NEW ROAD\2015-05-29 ES & PL DOCS FINAL\ES VOL 2 FINAL
APPENDICIES\PNR_ES_VOL2_APPNDX L_INDUCED SEISMICITY.DOCX
Page L64
197. The Preston New Road study area boundary overlaps with the study area boundaries for the Grange Hill and Roseacre Wood well sites (see Figure 22). Therefore data obtained during the walkovers for these two study areas were also considered (collected on 5-6
th August 2013 and 8
th October 2013 respectively).

Cuadrilla Bowland Limited Temporary shale gas exploration at Preston New Road Environmental Statement
Draft 3 | 24 May 2014
C:\RICHARD\RICHARD - WORK\JOBS\CUADRILLA\ISSUED DOCUMENTS\PRESTON NEW ROAD\2015-05-29 ES & PL DOCS FINAL\ES VOL 2 FINAL
APPENDICIES\PNR_ES_VOL2_APPNDX L_INDUCED SEISMICITY.DOCX
Page L65
Figure 22: Seismic study area for Preston New Road (green circle). The yellow dots represent locations visited during the walkover for the site.

Cuadrilla Bowland Limited Temporary shale gas exploration at Preston New Road Environmental Statement
Draft 3 | 24 May 2014
C:\RICHARD\RICHARD - WORK\JOBS\CUADRILLA\ISSUED DOCUMENTS\PRESTON NEW ROAD\2015-05-29 ES & PL DOCS FINAL\ES VOL 2 FINAL
APPENDICIES\PNR_ES_VOL2_APPNDX L_INDUCED SEISMICITY.DOCX
Page L66
Desk Based Review L6.10.3
198. The findings of the desk based review included determining the locations of the following types of potential receptors.
Wells – including the Site exploration well and other wells;
Infrastructure – including roads, railway, bridges, utilities, pipelines, etc.;
Special buildings – including listed buildings, schools, hospitals, churches, monuments, stately homes, listening stations, etc.;
Residential buildings; and
Industrial/commercial buildings.
Site Walkover Observations L6.10.4
199. This section details the main observations made during the study walkover in respect of the general types of receptors. The receptors encountered during this study are shown in Figure 23, Figure 24 and Figure 25.As per the desk study review, receptors have been separated into the following types:
Infrastructure – including roads, railway, bridges, utilities, pipelines, etc.(see Figure 23);
Special buildings – including listed buildings, schools, hospitals, churches, monuments, stately homes, listening stations, etc. (see Figure 24);
Residential areas (see Figure 25);
Industrial/commercial buildings.
200. The following section is not intended to form the basis of a full building survey of the study area. It is only meant to serve as a high level guide to understanding the type of receptors present within the study area. In particular, it is noted that the residential areas identified within Figure 25 do not include all of the more isolated residential properties between more built up areas. These properties have been noted and considered as part of this assessment, but for ease of presentation they have not been labelled within Figure 25.
201. Due to the rural nature of the site there are very few industrial/commercial buildings within the study area. The only notable industrial/commercial buildings are present within the more built up area of Wesham and Kirkham to the south-west of the proposed Roseacre well site.

Cuadrilla Bowland Limited Temporary shale gas exploration at Preston New Road Environmental Statement
Draft 3 | 24 May 2014
C:\RICHARD\RICHARD - WORK\JOBS\CUADRILLA\ISSUED DOCUMENTS\PRESTON NEW ROAD\2015-05-29 ES & PL DOCS FINAL\ES VOL 2 FINAL
APPENDICIES\PNR_ES_VOL2_APPNDX L_INDUCED SEISMICITY.DOCX
Page L67
Figure 23: Potential infrastructure receptors identified within the seismic study area.

Cuadrilla Bowland Limited Temporary shale gas exploration at Preston New Road Environmental Statement
Draft 3 | 24 May 2014
C:\RICHARD\RICHARD - WORK\JOBS\CUADRILLA\ISSUED DOCUMENTS\PRESTON NEW ROAD\2015-05-29 ES & PL DOCS FINAL\ES VOL 2 FINAL
APPENDICIES\PNR_ES_VOL2_APPNDX L_INDUCED SEISMICITY.DOCX
Page L68
Figure 24: Potential special buildings receptors identified within the seismic study area.

Cuadrilla Bowland Limited Temporary shale gas exploration at Preston New Road Environmental Statement
Draft 3 | 24 May 2014
C:\RICHARD\RICHARD - WORK\JOBS\CUADRILLA\ISSUED DOCUMENTS\PRESTON NEW ROAD\2015-05-29 ES & PL DOCS FINAL\ES VOL 2 FINAL
APPENDICIES\PNR_ES_VOL2_APPNDX L_INDUCED SEISMICITY.DOCX
Page L69
Figure 25: Potential residential buildings receptors identified within the seismic study area.

Cuadrilla Bowland Limited Temporary shale gas exploration at Preston New Road Environmental Statement
Draft 3 | 24 May 2014
C:\RICHARD\RICHARD - WORK\JOBS\CUADRILLA\ISSUED DOCUMENTS\PRESTON NEW ROAD\2015-05-29 ES & PL DOCS FINAL\ES VOL 2 FINAL
APPENDICIES\PNR_ES_VOL2_APPNDX L_INDUCED SEISMICITY.DOCX
Page L70
L6.11 Preston New Road Future Baseline
202. The LCC planning application website83
has been reviewed for parish councils within the study area. On the basis of this review it is unlikely that there will be any new receptors within the lifetime of the proposed development.
203. Over the lifetime of the proposed development, it is unlikely the population of the study area will increase significantly.
83
Lancashire County Council. URL
<http://planningregister.lancashire.gov.uk/planappsearch.aspx> [site accessed
15/08/2013]

Cuadrilla Bowland Limited Temporary shale gas exploration at Preston New Road Environmental Statement
Draft 3 | 24 May 2014
C:\RICHARD\RICHARD - WORK\JOBS\CUADRILLA\ISSUED DOCUMENTS\PRESTON NEW ROAD\2015-05-29 ES & PL DOCS FINAL\ES VOL 2 FINAL
APPENDICIES\PNR_ES_VOL2_APPNDX L_INDUCED SEISMICITY.DOCX
Page L71
L7 Review and selection of criteria for ground motion hazard
L7.1 Introduction
205. A review of ground motion criteria is recommended by the protocol developed by DoE in the US
15. The following presents the findings of a review of published
legislation, guidance and standards associated with assessing tolerable exposure limits of ground motions/ground borne vibrations from natural and induced seismicity.
206. For clarity, ground motions and ground borne vibrations are generally considered to mean the same thing. However, the following text refers to ground motions in the context of seismicity and ground borne vibrations in the context of construction activities.
207. At present there is very little UK based published guidance for assessing the impacts of induced seismicity. As a result, it was considered reasonable to review published guidance and standards associated with other activities that have the potential to induce ground motions/ground borne vibrations, including piling, blasting, mining and traffic induced ground borne vibrations. In addition, due reference has been made to relevant published technical literature, where appropriate international guidance has been reviewed for context. The criteria described in the subsequent sections are values that define thresholds of acceptability in relation to observed effects.
208. Although British Standards provide reasonable recommendations with regard to acceptable ground borne vibrations in relation to construction activities, they do not specifically consider ground motions from seismic events. Therefore, the European Macroseismic Scale guidance, EMS-98
84 and the USGS Earthquake
Hazard program, Shake Map85
, have been reviewed to contribute to the process of defining ground motion criteria. Based on this review, appropriate criteria have been presented.
Amplitude descriptors L7.1.1
209. The following terms are important in terms of this discussion:
Peak ground velocity (PGV) – The maximum instantaneous absolute value of the velocity of the ground. Often ground velocities are measured in three orthogonal axes. Then PGV might either refer to the absolute maximum of one of these components or might refer to the maximum of the resultant velocity (i.e. the length of the velocity vector);
Peak particle velocity (PPV) - The maximum instantaneous absolute value of the velocity of the ground (mostly used synonymously to PGV); and
Peak ground acceleration (PGA) – The maximum instantaneous absolute value of the acceleration of the ground.
84
Grunthal, G. (1998). European Macroseismic Scale. Centre Europèean de Géodynamique et de
Séismologie. 85
United States Geological Survey. (2013). URL
<http://earthquake.usgs.gov/earthquakes/shakemap/>

Cuadrilla Bowland Limited Temporary shale gas exploration at Preston New Road Environmental Statement
Draft 3 | 24 May 2014
C:\RICHARD\RICHARD - WORK\JOBS\CUADRILLA\ISSUED DOCUMENTS\PRESTON NEW ROAD\2015-05-29 ES & PL DOCS FINAL\ES VOL 2 FINAL
APPENDICIES\PNR_ES_VOL2_APPNDX L_INDUCED SEISMICITY.DOCX
Page L72
210. Ground motion criteria associated with earthquakes are typically defined in terms of PGA or PGV. Ground borne vibration criteria associated with construction activities are typically defined in terms of component PPV, which is the PPV in any component (the maximum velocity in one of measured directions) or in terms of resultant PPV (the maximum length of the velocity vector).
211. It is important to note that the criteria defined within this section are not to be used for design purposes. They are only considered as criteria to assess the effects associated with ground motions predicted for various seismic scenarios.
L7.2 Considerations for ground motion assessment
212. The application of ground motions rather than event magnitudes to assess the effects of induced seismicity leads to the need to clarify the factors relevant to ground motions, including event duration and ground motion frequency content. Assumptions have been made with regard to these factors on the basis of published relationships and experience gained from the two exceptional seismic events at Preese Hall in 2011
40.
213. As stated above, an effort has been made to base ground motion criteria on existing and accepted engineering standards that are used in industries that have the potential to produce ground motions, such as mining and construction.
Ground motion event duration L7.2.1
214. Ground borne vibration criteria associated with construction activities are typically classified in terms of continuous and transient vibrations. Continuous vibrations are typically long duration and as such give rise to dynamic magnification due to resonance
86. As a result of dynamic magnification, BS5228-
2:200986
recommends that criteria for continuous vibrations are reduced by a factor of 1.5 to 2.5 (depending on individual circumstances). Transient vibrations are typically shorter duration and temporarily sustained vibrations.
215. It is noted that small seismic events typically have very short durations (less than 5 seconds). Indeed, reports of felt vibrations from the 2.3 ML seismic event at Preese Hall indicated that vibrations lasted for only a few seconds
40. Therefore,
for this assessment ground motions shall be treated as transient rather than continuous.
Ground motion frequency L7.2.2
216. The effects of ground motions and ground borne vibrations are typically controlled by their dominant frequencies. This has been considered in the process of review and selection of ground motions criteria.
217. The consideration of dominant frequencies for induced seismic events is based on the Brune model (Brune 1970
87), which enables the dominant frequency (f0) to be
calculated as a function of stress drop (Δσ) and seismic moment (M0) using the following equation:
86
BS5228-2:2009. Code of practice for noise and vibration control on construction and open sites.
Part 2: vibration. 87
Brune, J., (1970). Tectonic stress and the spectra of seismic shear waves from earthquake,
Journal of Geophysical Research. Vol.75, pp.4997-5009.

Cuadrilla Bowland Limited Temporary shale gas exploration at Preston New Road Environmental Statement
Draft 3 | 24 May 2014
C:\RICHARD\RICHARD - WORK\JOBS\CUADRILLA\ISSUED DOCUMENTS\PRESTON NEW ROAD\2015-05-29 ES & PL DOCS FINAL\ES VOL 2 FINAL
APPENDICIES\PNR_ES_VOL2_APPNDX L_INDUCED SEISMICITY.DOCX
Page L73
√
where:
vs is s-wave velocity = 2800 m/s (based on vs = (μ/ρ)0.5 where μ=20 GPa (Eisner et
al. 201140
); ρ= 2600kg/m3
(Andrews 201362
)).
Δσ is stress drop = 0.5 MPa (based on Baisch and Vörös 201179
).
M0 is seismic moment (M0 can be calculated for different magnitudes (MW) using MW = 2/3*Log(M)-6.1 (Hanks and Kanamori 1979
88)).
218. On the basis of this equation the dominant frequency (or corner frequency) for different magnitudes are as follows:
For MW = 1: dominant frequency (or corner frequency) of 30Hz;
For MW = 2: dominant frequency (or corner frequency) of 10Hz; and
For MW = 3: dominant frequency (or corner frequency) of 3 Hz.
219. Baisch and Voros (2011)82
state that:
“based on classical earthquake models, it is likely that a 2.6 ML earthquake causes maximum ground vibrations around 10-20Hz, with vibration amplitudes quickly decreasing at higher frequencies”.
220. Considering the dominant frequencies that have been calculated above for various low magnitudes, a dominant frequency of < 10 Hz is reasonable for assessment.
L7.3 Ground motion criteria associated with earthquakes
221. Earthquakes are often measured or classified in terms of the typical observed effects, known as earthquake intensity, defined in Europe using the European Macroseismic Scale (EMS)
84. Although the correlation of earthquake intensity
with traditional ground motion parameters is difficult, the state of practice is discussed in subsequent sections. This section also provides further details with regard to the intensity classification schemes defined by the EMS guidance
84 used
in Europe and the USGS ShakeMap
85, which uses a combination of intensity and
ground motion amplitude indicators.
European Macroseismic Scale (EMS) L7.3.1
222. The EMS, which classifies earthquake intensity in terms of observed effects, was developed with the intention of providing a consistent approach to defining earthquake intensity in Europe. In the context of the EMS, intensity can be defined as the severity of ground shaking on the basis of observed effects on buildings/structures, the environment and the landscape.
88
Hanks, T.C., Kanamori, H.K. (1979). A moment magnitude scale. Journal of geophysical
research. Vol. 84, pp.2348-2350.

Cuadrilla Bowland Limited Temporary shale gas exploration at Preston New Road Environmental Statement
Draft 3 | 24 May 2014
C:\RICHARD\RICHARD - WORK\JOBS\CUADRILLA\ISSUED DOCUMENTS\PRESTON NEW ROAD\2015-05-29 ES & PL DOCS FINAL\ES VOL 2 FINAL
APPENDICIES\PNR_ES_VOL2_APPNDX L_INDUCED SEISMICITY.DOCX
Page L74
223. The description of typical observed effects is based on more detailed classifications of building damage, building vulnerability and descriptors of human perception, which are discussed in detail within Grunthal (1998)
84.
224. It is important to bear in mind that following the 2.3 ML seismic event at Preese Hall on the 1
st April 2011, the BGS received 23 reports of the shaking being
experienced by people. These reports were used to determine the earthquake intensity, which indicated earthquake intensity to be predominantly II EMS
89,
which is described as “felt only by very few individuals at rest in houses”.
USGS Shake Map® L7.3.2
225. Shake Map®, developed by the US Geological Survey (USGS), is an automated system which combines instrumental measurements of shaking (where possible) with information about local geology and the seismic source to estimate intensity measurements. This automated program maps the spatial distribution of measured or interpolated (where necessary) ground motion indicators (PGA, PGV, PSA). Instrumental intensity is subsequently calculated on the basis of regression relationships between Modified Mercalli Intensity (MMI) and measured or interpolated ground motions
90,91.
226. Instrumental intensity and ground motion parameters are subsequently correlated with high level descriptions of potential damages and levels of perceived shaking. These high level descriptions of perceived shaking and potential damage have been derived with consideration of the existing descriptions in the MMI scale.
Published correlations of intensity and ground motion L7.3.3
parameters
227. This section draws on the review of the EMS intensity scale and the MMI intensity scale used in Shake Map® described in Sections L7.3.1 and L7.3.2.
228. Research suggests that there is considerable uncertainty in the correlation between ground motion indicators (PGA, PGV and PPV) and the observed effects of an earthquake (see Figure 26). The correlation is complex and is also related to ground motion frequency and duration as well as the region specific building stock fragility. A very large scatter of the data can be expected. Correlations between peak ground motion and intensities below V have not been widely studied. Furthermore, exponential interpolations for PGV between intensities II and V by Wald et al. (1999)
92 do not seem to match data presented by van Eck et
al. (2006)93
(for intensities between I and VII). On this basis no single correlation equation provides a definitive comparison of intensity and ground motion parameters and it is important that this uncertainty is taken into consideration.
89
British Geological Survey. <URL:
http://www.bgs.ac.uk/research/earthquakes/BlackpoolApril2011.html> [site accessed 11/09/2013] 90
Wood, H.O., Neumann. (1931). Modified Mercalli intensity scale of 1931. Bulletin of the
Seismology Society of America. Vol.21, pp.277-283. 91
Richter, C.F. (1958). Elementary seismology. W.F. Freeman & Co. 92
Wald, D.J., Quitoriano, V., Heaton, T.H., Kanamori, H. (1999). Relationship between peak
ground acceleration, peak ground velocity and Modified Mercalli intensity for earthquakes in
California. Earthquake spectra. Vol.15, pp.557-564. 93
van Eck, T., Goutbeek, F., Haak, H., Dost, B. (2006). Seismic hazard due to small-magnitude,
shallow-source, induced earthquakes in The Netherlands. Engineering Geology, Vol.87, pp.105-
121.

Cuadrilla Bowland Limited Temporary shale gas exploration at Preston New Road Environmental Statement
Draft 3 | 24 May 2014
C:\RICHARD\RICHARD - WORK\JOBS\CUADRILLA\ISSUED DOCUMENTS\PRESTON NEW ROAD\2015-05-29 ES & PL DOCS FINAL\ES VOL 2 FINAL
APPENDICIES\PNR_ES_VOL2_APPNDX L_INDUCED SEISMICITY.DOCX
Page L75
229. Despite the uncertainty in the results of correlations between ground motion and instrumental intensity, studies by Wald et al. (1999)
92 have developed a practical
equation between Modified Mercalli Intensity (Imm) and PGA or PGV for the California region. These equations are used by Shake Map® and the correlations between PGA, PGV and intensity are presented within Figure 26, which presents a number of published relationships between PGA and intensity (MMI or MSK) for intensities between V and IX.
Figure 26: Various published relationships of peak horizontal ground acceleration versus intensity. Adapted from Wald et al. (1999)
92.
Conclusions L7.3.4
230. Summarising this preliminary guidance on observed relations between ground motion and intensity, the following conclusions can be made. It should be noted, however, that these are presumably based on the observation of earthquakes with magnitudes above 4 and that ground motions frequencies are not taken into

Cuadrilla Bowland Limited Temporary shale gas exploration at Preston New Road Environmental Statement
Draft 3 | 24 May 2014
C:\RICHARD\RICHARD - WORK\JOBS\CUADRILLA\ISSUED DOCUMENTS\PRESTON NEW ROAD\2015-05-29 ES & PL DOCS FINAL\ES VOL 2 FINAL
APPENDICIES\PNR_ES_VOL2_APPNDX L_INDUCED SEISMICITY.DOCX
Page L76
account. This is therefore not directly comparable to low magnitude induced seismic events, but has been presented for information.
Table 9: Summary of review of ground motions associated with earthquakes. EMS intensity effect descriptions from EMS Guidance
84 and equivalent approximate ground
motions from Wald et al (1999)92
.
Effect (based on EMS and MMI intensity descriptions)
Equivalent intensity (EMS and MMI)
Approximate equivalent ground motion
PGA (%g) PGV (mm/s)
Ground motions only detectable by instrumentation.
I <0.17 <1
Range of minimum ground motions perceived by humans.
II-III 0.17 – 1.4 1 – 11
Range of ground motions felt by few to many people, but no damage.
IV 1.4 – 3.9 11 – 34
Range of ground motions felt by few to most and may cause slight damage to few of the most vulnerable buildings.
V 3.9 – 9.2 34 – 81
Range of ground motions felt by most and may cause slight to moderate damage to few to some unreinforced structures
VI 9.2 – 18 81 – 160
Range of ground motions that may frighten most and may cause slight to moderate damage to few to some reinforced structures (no earthquake resistant design). Substantial to very heavy damage to many unreinforced structures.
VII 18 – 34 160 – 310
Range of ground motions that may cause serious very heavy damage few to some reinforced structures (earthquake resistant design) and a few to some older weaker unreinforced buildings may collapse.
VIII 34 – 65 310 – 600
Slight damage – non-structural damage, e.g. cracks to plaster.
Moderate damage – slight structural damage e.g. cracks in many walls, partial collapse of chimneys, cracks in columns and structural walls.
Substantial to very heavy damage – moderate structural damage e.g. large cracks in most walls, cracks in columns, spalling of concrete cover.
Very heavy damage – heavy structural damage e.g. serious failure of walls, large cracks in structural elements.
231. There is considerable uncertainty in the correlation between intensity levels, description of expected damage to local building stock and predicted ground motion level factors PGA and PGV.

Cuadrilla Bowland Limited Temporary shale gas exploration at Preston New Road Environmental Statement
Draft 3 | 24 May 2014
C:\RICHARD\RICHARD - WORK\JOBS\CUADRILLA\ISSUED DOCUMENTS\PRESTON NEW ROAD\2015-05-29 ES & PL DOCS FINAL\ES VOL 2 FINAL
APPENDICIES\PNR_ES_VOL2_APPNDX L_INDUCED SEISMICITY.DOCX
Page L77
L7.4 Ground borne vibration criteria associated with construction activities
232. To complement the review of ground motion criteria associated with earthquakes, a review of ground borne vibration criteria associated with construction activities has been carried out. This includes activities such as piling, blasting, mining and traffic induced ground motions. Where possible UK specific literature has been reviewed (i.e. British Standards, CIRIA), and where there are gaps in the literature, European and International guidance has been reviewed. It should be noted that some of these types of vibrations have much longer durations compared to ground motions associated with earthquakes.
233. The aim of this review is to identify the criteria, in terms of component peak particle velocity (PPV), for acceptable levels of ground motions in relation to the following:
Physical damage to buildings;
Physical damage to civil infrastructure;
Human activity interference.
234. In addition, a comment has been made with regard to the assessment of interference with sensitive equipment and activities.
Physical damage to buildings
235. In the context of building damage from ground borne vibrations associated with construction activities, damage can be categorised in the following categories: (1) ‘threshold cracking’ – cosmetic damage due to cracking; (2) ‘minor damage’ – non permanent cracking, fallen objects, broken windows; and (3) ‘major damage’ – permanent cracks, foundations movement, settlement
97.
236. UK mineral planning guidance94
, which relates to mining activities, states that transient ground vibrations should be limited to a maximum PPV of 12mm/s “as measured at vibration sensitive buildings”.
237. BS 7385-2:199395
and BS 5228-2:200996
recommend a component PPV of 15mm/s as a maximum criterion for “unreinforced, light framed structures or residential or light commercial buildings”. Above this level of vibration, building structures could be damaged in the context of the “cosmetic damage or threshold cracking”.
238. For “reinforced or framed structure or industrial and heavy commercial buildings” BS 7385-2:1993
95 and BS 5228-2:2009
96 recommend a PPV of
50mm/s as a maximum criterion in the context of cosmetic damage or ‘threshold cracking’ for vibrations of all frequencies.
Physical damage to civil infrastructure
239. Some high level guidance on the damage criteria for civil structures from vibration, including, services and utilities, bridges, retaining walls and basement
94
Department for Communities and Local Government. (1995). Mineral Planning Guidance 14:
Environmental Act 1995 – review of mineral planning permissions. 95
BS7385-2:1993. Evaluation and measurement of vibration in buildings – Part 2: Guide to
damage levels from groundborne vibration.

Cuadrilla Bowland Limited Temporary shale gas exploration at Preston New Road Environmental Statement
Draft 3 | 24 May 2014
C:\RICHARD\RICHARD - WORK\JOBS\CUADRILLA\ISSUED DOCUMENTS\PRESTON NEW ROAD\2015-05-29 ES & PL DOCS FINAL\ES VOL 2 FINAL
APPENDICIES\PNR_ES_VOL2_APPNDX L_INDUCED SEISMICITY.DOCX
Page L78
walls, is provided within BS 5228-2:200996
and Dowding (2000)97
.There is no specific guidance in relation to damage criteria for road and rail.
240. The relative PPV values produced by a variety of sources, including road and rail are summarised within. Table 10. For comparison, the range of ground vibrations for a Red Light magnitude (0.5ML) has also been presented on the basis of the analysis presented within Section L8.3.2.
Table 10: Peak particle velocities (PPV) from various sources of ground vibration (from TRL Research Report 53
98 (1986)).
Source of ground vibration PPV (mm/s) Range of PPV at 10m distance from source (mm/s)
Minimum Maximum
Road traffic 0.1 0.8 <0.1 – 0.15
Trains 0.1 1.5 0.15
Tunnelling machines 0.15 6 0.35 – 1.5
Explosive demolition 2 30 -
1kg dynamite 1.5 90 60
For comparison
Potential 0.5 ML seismic event (see analysis in Section L8.3.2)
0.01 at epicentre (5
th percentile
value)
0.2 at epicentre (95
th percentile
value)
-
Human activity interference.
241. The human body can detect magnitudes of vibration lower than those that would normally cause mechanical or structural problems, therefore the exposure limits for human body perception and response are considerably lower than those for building damage. In general, the lower threshold exposure limits for human body perception are between 0.14 and 1mm/s.
242. As shown in Figure 27, criteria for ground borne vibration vary according to the frequency of the vibration. Criteria also vary depending on the exposure time, i.e. transient vs. continuous vibration.
96
BS5228-2:2009. Code of practice for noise and vibration control on construction and open sites.
Part 2: vibration. 97
Dowding, C.H. (2000). Construction vibrations. Second edition. Prentice-Hall. Englewood
Cliffs, NJ. 98
New, B.M. (1986). Ground vibration caused by civil engineering works. Transport and Road
Research Laboratory. Research Report 53.

Cuadrilla Bowland Limited Temporary shale gas exploration at Preston New Road Environmental Statement
Draft 3 | 24 May 2014
C:\RICHARD\RICHARD - WORK\JOBS\CUADRILLA\ISSUED DOCUMENTS\PRESTON NEW ROAD\2015-05-29 ES & PL DOCS FINAL\ES VOL 2 FINAL
APPENDICIES\PNR_ES_VOL2_APPNDX L_INDUCED SEISMICITY.DOCX
Page L79
Figure 27: Left: recommended levels of human sensitivity to vibration due to blasting99
. Middle: reference levels for vibration perception and response from traffic
100. Right:
thresholds for vibrations due to pile-driving101
Physical damage or interference of sensitive equipment/activities;
243. Due to the sensitivity of certain equipment to vibrations (e.g. MRI scanners), this equipment has built in dampening and uncoupling to ensure that the equipment is not adversely affected by vibrations. Vibrations that exceed the capacity of these dampening and uncoupling measures may be detrimental to the equipment and may produce blurred images, hence reducing the diagnostic utility of the equipment.
244. Nonetheless, sensitive equipment, such as those installed in hospitals and universities will be designed to withstand typical external vibration sources such as traffic and trains (to maximum PPV of approximately 1.5mm/s). The ground motions produced by a maximum magnitude 1.5 ML event will be within the range of maximum ground motions produced by other sources of ground motion, such as traffic and trains. In addition, the maximum magnitude of induced seismic events (0.5 to 1.5 ML) will be well within the range of magnitudes experienced throughout the UK hundreds to thousands of times a year. It is therefore considered that there will be no additional effect of vibration on sensitive equipment/activities as a result of the Project and this has not been assessed further.
99
EM 1110-2-3800. (1972). Systematic drilling and blasting for surface excavations. US Army
Corps of Engineers. 100
Barneich, J. (1985). Vehicle induced ground motion. In: Gazetas, G., Selig, E. (Eds.), Vibration
problems in geotechnical engineering. Proceedings of a Symposium by the Geotechnical
Engineering Division in conjunction with the ASCE Convention in Detroit, Michigan Oct. 22. 101
Athansopoulos, G.A., Pelekis, P.C. (2000). Ground vibrations from sheetpile driving in urban
environment: measurements, analysis and effects on buildings and occupants. Soil Dynamics and
Earthquake Engineering. Vol. 19, pp.371-387.
Response from blasting Response from traffic Response from piling

Cuadrilla Bowland Limited Temporary shale gas exploration at Preston New Road Environmental Statement
Draft 3 | 24 May 2014
C:\RICHARD\RICHARD - WORK\JOBS\CUADRILLA\ISSUED DOCUMENTS\PRESTON NEW ROAD\2015-05-29 ES & PL DOCS FINAL\ES VOL 2 FINAL
APPENDICIES\PNR_ES_VOL2_APPNDX L_INDUCED SEISMICITY.DOCX
Page L80
L7.5 Conclusions and recommendations
245. On the basis of this review of ground motions associated with earthquakes and ground borne vibrations associated with construction activities and blasting, ground motion criteria have been selected for use within this assessment.
246. In general the recommended ground motion criteria have been based on UK guidance. Recommended criteria are summarised in Table 11 to Table 13 below.
Table 11: Summary of recommended ground motion criteria to be used for assessment of likely significant effects in the context of damage to particular building receptors. Unless otherwise stated the criteria provided is in terms of component PPV measured at the ground surface.
Receptor Criteria (mm/s)
Comments Source reference
Vibration sensitive buildings 12mm/s (no specific frequency)
Above which a building may be affected by cosmetic damage.
Mineral Planning Guidance 14
94
Unreinforced or light framed structure or residential or light commercial buildings
20mm/s at 15Hz
Above which a building may be affected by cosmetic damage.
BS7385-2:1993
95
Reinforced or framed structure or industrial and heavy commercial buildings
50mm/s at 4Hz and above
Above which a building may be affected by cosmetic damage.
BS7385-2:1993
95
Table 12: Summary of recommended ground motion criteria to be used for assessment of likely significant effects in the context of damage to particular civil infrastructure receptors. Unless otherwise stated the criteria provided is in terms of component PPV measured at the ground surface.
Receptor Criteria (mm/s)
Comments Source reference
National grid high pressure pipeline
50mm/s If deep mining is proposed within 1km of pipeline then National Grid shall be consulted.
National Grid (2006)
102
Utilities 30mm/s Maximum level of vibrations for which utilities should be subjected. Special studies may be required.
BS5228-2:2009
86
Bridges 51mm/s Above which building structures could be damaged under the category of ‘threshold cracking’.
Dowding, (2000)
97
Highways Naturally produce vibrations, therefore any assets should be able to withstand the level of vibration from roads and rail.
Railways
Retaining walls 10 to 40mm/s
Maximum criteria at the toe and crest respectively for transient vibration.
BS5228-2:2009
96
102
National Grid. (2006). Specification for safe working in the vicinity of National Grid high
pressure gas pipelines and associated installations – requirements for third parties. Document ref
T/SP/SSW/22.

Cuadrilla Bowland Limited Temporary shale gas exploration at Preston New Road Environmental Statement
Draft 3 | 24 May 2014
C:\RICHARD\RICHARD - WORK\JOBS\CUADRILLA\ISSUED DOCUMENTS\PRESTON NEW ROAD\2015-05-29 ES & PL DOCS FINAL\ES VOL 2 FINAL
APPENDICIES\PNR_ES_VOL2_APPNDX L_INDUCED SEISMICITY.DOCX
Page L81
Table 13: Summary of recommended ground motion criteria to be used for assessment of likely significant effects in the context of human perception. Unless otherwise stated the criteria provided is in terms of component PPV measured at the ground surface.
Receptor Criteria Comments Source reference
Vibrations perceptible to humans
0.5mm/s Perceptible in residential environments*.
BS5228-2:200986
and BS6472-2:2008
103
1mm/s Level above which is likely to cause complaint*.
*Perception criteria vary according to source and frequency and receptor response.
L7.6 Future considerations
247. DECC recommendations for the mitigation of induced seismicity is for the implementation of a traffic light system. This traffic light system is discussed in further detail within Section L10 and uses trigger levels for green, amber and red events defined by specific magnitude seismic events.
248. In contrast, this section has reviewed the ground motions associated with damage to buildings and infrastructure and human perception. This has subsequently been used to assess the likely significant effects associated with induced seismicity owing to the fact that the vibrations at the ground surface (felt and/or monitored instrumentally) are dependent on the source (i.e. depth and movement mechanism) and the pathway of the seismic wave (i.e. s-wave velocity of the subsurface). It is therefore considered that an approach based on ground motions may be more sensible for the mitigation of induced seismicity, rather than an approach based on magnitude.
249. This type of approach is well accepted in the context of the mitigation of vibrations due to other activities such as blasting, and as demonstrated in this review, the criteria for blasting (which can cause similar style events to shallow, low magnitude events associated with induced seismicity – i.e. short duration) are well established within construction guidance.
250. It is noted that UKOOG2 state that “an evolutionary approach to risk assessment
and mitigation should be adopted by operators whereby more conservative assessments and controls are adopted at the exploration phase. As experience is gained within the area, and where induced seismic events have not occurred, operators may propose different monitoring and mitigation measures.” On this basis it may be considered appropriate to move towards a ground motion based approach as experience is gained in the Bowland Basin area.
103
BS6472-2:2008. Guide to evaluation of human exposure to vibration in buildings. Blast-
induced vibration.

Cuadrilla Bowland Limited Temporary shale gas exploration at Preston New Road Environmental Statement
Draft 3 | 24 May 2014
C:\RICHARD\RICHARD - WORK\JOBS\CUADRILLA\ISSUED DOCUMENTS\PRESTON NEW ROAD\2015-05-29 ES & PL DOCS FINAL\ES VOL 2 FINAL
APPENDICIES\PNR_ES_VOL2_APPNDX L_INDUCED SEISMICITY.DOCX
Page L82
L8 Assessment of the potential hazard of induced Seismicity
L8.1 Introduction
251. This section presents the results of a seismic hazard assessment for induced seismicity associated with the exploratory activities at the Site. The results of this seismic hazard assessment have been used to assess the likely significant effects of induced seismicity associated with the construction, operation (including drilling, hydraulic fracturing and flow testing) and decommissioning of the Preston New Road well site.
252. As discussed in Section L5.3, L5.4 and L5.6 it is considered that there will be no effects associated with induced seismicity for the construction and decommissioning phases. As a consequence the following section only considers the effects associated with the operational phase (including drilling, hydraulic fracturing and flow testing).
253. As discussed in the assumptions and limitation section (Section L5.7), the hydraulic fracturing activities of the operational phase present the greatest risk of induced seismicity compared to flow testing and drilling. Any effects associated with flow testing will be significantly less than those associated with hydraulic fracturing (see Section L3.5). It is also considered that no mechanism exists for induced seismicity associated with drilling (see Section L3.6). Consequently, the results of the seismic hazard discussed below, and the discussion on the significance of the effects (discussed in Section L9) are for induced seismicity associated with hydraulic fracturing.
254. Seismic hazard refers to the expected levels of ground motion related to induced seismicity, not only the expected magnitude. As discussed in Section L7, it is the ground borne vibrations associated with seismic events that relate directly to acceptability criteria.
255. To determine the seismic ground motion hazard at a site two approaches can be taken; either a probabilistic seismic hazard assessment (PSHA) or a deterministic seismic hazard assessment (DSHA). The former considers multiple potential seismic sources and the probability of an event occurring at these locations, whereas the latter considers individual, typically worst credible, scenario events, of a defined size and location. For the purpose of determining the seismic hazard associated with induced seismicity at the Site a DSHA has been carried out.
256. The results of the DSHA are presented within Section L8.3 in terms of peak ground velocity (PGV), which can be compared to typical building damage criteria to assess the effects of induced seismicity (Section L9).
L8.2 Deterministic seismic hazard assessment methodology
257. The DSHA method is based on Idriss (1985)104
and considers the following:
104
Idriss, I.M. (1985). Evaluating seismic risk in engineering practice. Proceedings 11th
International Conference of Soil Mechanics and Foundation Engineering. State of the Art Report.

Cuadrilla Bowland Limited Temporary shale gas exploration at Preston New Road Environmental Statement
Draft 3 | 24 May 2014
C:\RICHARD\RICHARD - WORK\JOBS\CUADRILLA\ISSUED DOCUMENTS\PRESTON NEW ROAD\2015-05-29 ES & PL DOCS FINAL\ES VOL 2 FINAL
APPENDICIES\PNR_ES_VOL2_APPNDX L_INDUCED SEISMICITY.DOCX
Page L83
Definition of seismic source – in terms of an estimate of maximum magnitude, hypocentral depth and location; and
Definition of appropriate ground motion prediction equation(s) (GMPEs, see Section L8.2.2) for the region and tectonic environment.
258. The analyses have calculated peak ground velocity (PGV) in mm per second for different earthquake scenarios.
Seismic source parameters L8.2.1
The source of induced seismicity associated with hydraulic fracturing, including
the mechanism of seismicity is discussed in detail in Section L3.4. The seismic
event scenarios discussed below have been derived on the basis of a source event
occurring within the area that may be affected by hydraulic fracturing, including a
contingency for anticipated fracture growth. This area is defined by the Red Line
Drawing as presented within Figure 1 which has been determined on the basis of
considering the following:
The trajectory and extent of vertical and horizontal wells;
Maximum anticipated extent of the designated fracture zone (with allowance for a contingency of a factor of safety of 2).
259. On the basis of the above, the Red Line has been determined to be a maximum of 2km west of the Preston New Road site with a contingency for horizontal wells to be orientated approximately 30 to 40° north or south of west (270°).
260. The focal depth is considered to be depth to the top of the Upper Bowland Shale, since this is technically the highest strata that may be stimulated.
Seismic event scenarios
261. Various earthquake scenarios have been assessed to determine the significant likely effects on receptors and to determine a maximum acceptable magnitude event. The earthquake scenarios adopted in this study are presented in Table 14.
Table 14: Seismic event scenarios considered for the purposes of the assessments
of seismic hazard and associated effects.
Seismic Event Scenario
Mag (ML)
Source Location Depth (km)
Purpose
Implementation of mitigation measures
1 0.5 Source defined by the Red Line presented within Figure 1
1.5km To calculate the spatial distribution of ground motions for a 0.5 ML
seismic event for a source area based on the Red Line Drawing and at the depth of the top of the Upper Bowland Shale.
2 1.5 1.5km To calculate the spatial for a 1.5 ML
seismic event for a source area based on the Red Line Drawing and at the depth of the top of the Upper Bowland Shale. distribution of ground motions
Maximum magnitudes

Cuadrilla Bowland Limited Temporary shale gas exploration at Preston New Road Environmental Statement
Draft 3 | 24 May 2014
C:\RICHARD\RICHARD - WORK\JOBS\CUADRILLA\ISSUED DOCUMENTS\PRESTON NEW ROAD\2015-05-29 ES & PL DOCS FINAL\ES VOL 2 FINAL
APPENDICIES\PNR_ES_VOL2_APPNDX L_INDUCED SEISMICITY.DOCX
Page L84
Implementation of mitigation measures
262. A 1.5 ML seismic event is based on previous observations of increases in magnitude following hydraulic fracturing stages, often called the trailing effect. The observed trailing effect during induced seismic events at Preese Hall led to a 0.9 unit magnitude increase following shut in, which is similar to other industry examples (e.g. EGS at Basel) and is discussed in more detail in Section L6.9.3. A trailing effect of a unit increase in magnitude of 1.0 is considered for this study.
Without mitigation measures
263. A 3.1 ML seismic event has been estimated as a theoretical maximum magnitude event that may occur within the Licence area. In reality, this is considered to have a very low likelihood because embedded mitigation measures are required to be implemented at all stages. However, it is considered useful for comparison to assess the effects of a theoretical maximum magnitude 3.1ML induced seismic event for the Licence area (based on volumes of fracturing fluid used at Preese Hall-1 well) and to demonstrate the reduction in ground motion hazard achieved though implementation of the mitigation measures.
264. Although not considered part of the main assessment, because embedded mitigation measures are required to be implemented at all stages, it is of interest to note that for this scenario to occur three very unlikely events are required to occur simultaneously, including: 1) The volume of pumping fluid per stage is similar to that used in the Preese Hall operations without minimisation; 2) The Traffic light System (described in Section L10.7) fails to fulfil its purpose; and 3) Fluid is transmitted into a critically stressed fault and it fails. Considering these points above, the likelihood of a 3.1 ML seismic event is considered very low due to the effectiveness of the mitigation measures that have been implemented as part of the Project (see Section L10). The proposed exploratory activities will not take place without implementation of the mitigation measures.
265. The assessment of a 3.1 ML earthquake has been discussed separately within Section L9.4.2.
Hypocentral depths
266. The hypocentral depth is the depth from ground level to the hypocentre of a seismic event. The hypocentral depth has been considered to be the equivalent to the highest strata that could be potentially hydraulically fractured. In the case of the Preston New Road well, this is the top of the Upper Bowland Shale, which is anticipated to be at approximately 1.5 km depth. The hypocentral depth that will be used for further analysis will be 1.5 km.
Seismic pathways L8.2.2
Ground motion prediction equations (GMPEs)
267. Ground-motion prediction equations (GMPEs) allow an estimation of ground motion parameters of engineering interest (Y), such as peak ground acceleration, peak ground velocity, or response spectral values as a function of a few independent parameters (magnitude, M, source-to-site distance, R, site classification, S, fault mechanism, SoF, etc). The uncertainty in the GMPE is represented by the standard deviation (σ) from the mean logarithmic values.

Cuadrilla Bowland Limited Temporary shale gas exploration at Preston New Road Environmental Statement
Draft 3 | 24 May 2014
C:\RICHARD\RICHARD - WORK\JOBS\CUADRILLA\ISSUED DOCUMENTS\PRESTON NEW ROAD\2015-05-29 ES & PL DOCS FINAL\ES VOL 2 FINAL
APPENDICIES\PNR_ES_VOL2_APPNDX L_INDUCED SEISMICITY.DOCX
Page L85
268. It is preferable to use a GMPE derived from local data, however this is only possible in regions of high seismicity, where there is dense station coverage. In the case of the region of Lancashire, UK, this is not currently possible. Therefore a GMPE must be selected which has been derived from a data set for a similar local geology, a similar range of magnitudes and similar focal depths. Anthropogenically induced seismic events are normally of shallow depths and small magnitude. Most published GMPEs on the other hand are derived for moderate to large magnitude naturally occurring events at greater depths.
269. Several relationships have been considered. Those presented within Table 15 have been considered to best represent the expected scenario at the Preston New Road well site, with regard to magnitude range, geology and focal depth.
Table 15: Summary of GMPEs used in this study.
GMPE no.
Equation Region Comments
1 PML (1982105
, 1985
106 and
1988107
).
Worldwide recordings, but intended for UK application.
Derived for nuclear facilities over 20 years ago
2 Reitbrock et al. (2013)
108
UK application Derived on the basis of weak ground motion and stochastic simulations.
3 Akkar et al. (2013)
109
Pan European database Shallow (<30km) focal depths; to MW as low as 4.0; up to 200km distance; spectral acceleration 0.01s to 4s.
4 Douglas et al. (2013)
110
Derived from various ground motion datasets of induced (geothermal) and natural seismicity from Basel, Geysers, Hengill, Roswinkel, Soultz and Voerendaal.
Shallow earthquakes at close source-to-site distances; MW 1.0-5.0; focal depth ≤5km; hypocentral distances ≤20km; for spectral accelerations ≤0.5s.
5 Richter methodology
California A relationship between earthquake magnitude and ground motion at the surface is provided by the classical definition of the Richter-Magnitude (ML).
This relationship is location specific and needs to be calibrated for a specific region.
See Section L3.1 for a definition of MW.
105
PML. (1982). British Earthquakes. Report for CEGB, BNFL and SSEB. No 115/82. 106
PML. (1985). Seismological studies for UK Hazard Analysis. Report for CEGB. No 346/85. 107
PML. (1988) UK Uniform Risk Spectra. Report for NNC. No 498/88. 108
Reitbrock, A., Strasser, F., Edwards, B. (2013). A stochastic earthquake ground-motion
prediction model for the United Kingdom. Bulletin of the Seismological Society of America. Vol.
103. Pp57-77. 109
Akkar, S., Sandikkaya, M.A., Bommer, J.J. (2013). Empirical ground-motion models for point-
and extended-source crustal earthquake scenarios in Europe and the Middle East. Bulletin of
Earthquake Engineering. doi: 10.1007/s10518-013-9461-4. 110
Douglas, J.D., Edwards, B., Convertito, V., Sharma, N., Tramelli, A., Kraaijpoel, D., Carera,
B.M., Maercklin, N., Troise, C. (2013). Predicting ground motion from induced earthquakes in
geothermal areas. Bulletin of the Seismological Society of America. Vol.103, pp.1875-1897.

Cuadrilla Bowland Limited Temporary shale gas exploration at Preston New Road Environmental Statement
Draft 3 | 24 May 2014
C:\RICHARD\RICHARD - WORK\JOBS\CUADRILLA\ISSUED DOCUMENTS\PRESTON NEW ROAD\2015-05-29 ES & PL DOCS FINAL\ES VOL 2 FINAL
APPENDICIES\PNR_ES_VOL2_APPNDX L_INDUCED SEISMICITY.DOCX
Page L86
Magnitude scales in GMPEs
270. In the context of low magnitude seismic events that are particularly relevant to induced seismicity, magnitudes are commonly recorded as local magnitude (ML), as described within the glossary section of this Appendix, Section L3.1. However in most recent GMPEs the moment magnitude scale (MW) is preferred. MW and ML will be very similar for low magnitude seismic events, therefore for simplicity it has been assumed that MW is equivalent to ML.
GMPEs for the UK
271. Due to the locality of the proposed activities, it is considered necessary to assess the suitability of GMPEs for the UK.
272. A recent review of GMPEs for the UK region has been carried out by Arango et al. (2012)
111 with specific reference to the hazard associated with nuclear
facilities. The authors show evidence that the scarcity of ground motion records within the UK results in a large amount of uncertainty associated with the prediction of ground motions
111.
273. As a result seismic hazard assessments for regions within the UK are typically based on a combination of GMPEs derived from earthquake records from stable continental regions and active crustal regions (with appropriate weightings)
111.
274. The problem of the scarcity of ground motion, such is the case for the UK, may be resolved by deriving GMPEs using stochastic simulations. This is the case for a recent GMPE derived for the UK (Reitbrock et al. 2013
108), which is based on a
numerical model that has been calibrated using parameters derived from local weak motion data.
275. However, it is understood that the (Reitbrock et al. 2013108
) equation under predicts ground motions by, on average, 2σ112
. A more detailed discussion of the comparison of this GMPE and various other relevant GMPEs are included within Reitbrock et al. 2013
108. Therefore, existing GMPEs for the UK are not considered
appropriate for the assessment of seismic hazard from induced seismicity in this assessment and they have not been taken further.
L8.3 Deterministic seismic hazard assessment results
276. This section presents the results of the DSHA for the exploration stage of the Preston New Road well site. The DSHA has been carried out in accordance with the methodology presented within Section L8.2. Results are presented in terms of peak ground velocity (PGV). The results of the DSHA have been used to determine the significant likely effects of induced seismicity within the area, which is discussed within Section L9.
111
Arango, M.C., Free, M.W., Lubkowski, Z.A., Pappin, J.W., Musson, R.M.W., Jones, G.,
Hodge, E. (2012). Comparing predicted and observed ground motions from UK earthquakes. 15th
World Conference in Earthquake Engineering, Lisboa, 2012. 112
Personal communication between Rory McCully and Lee Taylor (sent on 05/09/2013).

Cuadrilla Bowland Limited Temporary shale gas exploration at Preston New Road Environmental Statement
Draft 3 | 24 May 2014
C:\RICHARD\RICHARD - WORK\JOBS\CUADRILLA\ISSUED DOCUMENTS\PRESTON NEW ROAD\2015-05-29 ES & PL DOCS FINAL\ES VOL 2 FINAL
APPENDICIES\PNR_ES_VOL2_APPNDX L_INDUCED SEISMICITY.DOCX
Page L87
Ground motion prediction comparison L8.3.1
Introduction
277. In order to understand the relationships between the various ground motion prediction methodologies that have been discussed within Section L8.2.2, a comparison study has been undertaken.
278. The ground motion prediction methodologies that have been compared include the following:
Akkar et al. (2013) GMPE;
Douglas et al. (2013) GMPE;
Original Richter methodology.
279. For the purposes of this comparison the following scenarios have been considered. The Akkar et al. (2013) GMPE includes a non-linear site amplification function that is based on VS30 and a reference PGA on rock. The VS30 parameter is used to estimate the local site amplification caused by shallow geology (≤30m depth).VS30
is usually calculated on the basis of the average shear wave velocity calculated over the top 30m, however due to the absence of data on the engineering characteristic of the superficial deposits, the site classification is and consistent with the informed notion that the upper 30m comprises deposits of “dense or medium dense sand and/or gravel or stiff clay; several tens of metres thick”
113. As
a relatively conservative approach a VS30 of 200m/s has been selected for the site.
280. It is noted that the Douglas and Richter methods have been defined for a hard rock reference and are therefore not originally extended to allow for amplification of the near surface layers. This has been accounted for by including an amplification factor in accordance with recommendations based the classification table within BS EN 1998-1:2004 (Eurocode 8)
113. An amplification factor of 1.5 (EC8 Soil
Type C = min VS30 180m/s) and 1.8 (EC8 Soil Type D = less than VS30 180m/s) have been considered as they broadly correspond to the VS30 value of 200m/s that has been determined for use within the Akkar et al. (2013) GMPE. Analysis shows that although there is little difference between the two factors, a factor of 1.8 has been used herein as being more conservative.
Table 16: Summary of earthquake scenarios considered for the comparison of attenuation methodology.
Attenuation methodology
Magnitude (ML)
Hypocentral depth (km)
VS30 (m/s) Amplification factor (according to EC8
113)
Dominant frequency (Hz)
Akkar et al. (2013)
1 3 200 N/A N/A
2
3
Douglas et al. (2013)
1 3 N/A 1.8 N/A
2
3
113
BS EN 1998-1:2004 (Eurocode 8). Design of structures for earthquake resistance. General
rules, seismic actions and rules for buildings.

Cuadrilla Bowland Limited Temporary shale gas exploration at Preston New Road Environmental Statement
Draft 3 | 24 May 2014
C:\RICHARD\RICHARD - WORK\JOBS\CUADRILLA\ISSUED DOCUMENTS\PRESTON NEW ROAD\2015-05-29 ES & PL DOCS FINAL\ES VOL 2 FINAL
APPENDICIES\PNR_ES_VOL2_APPNDX L_INDUCED SEISMICITY.DOCX
Page L88
Attenuation methodology
Magnitude (ML)
Hypocentral depth (km)
VS30 (m/s) Amplification factor (according to EC8
113)
Dominant frequency (Hz)
Original Richter methodology
1 3 N/A 1.8 15
2
3
1 20
2
3
Results
281. The results of the comparison are presented in attenuation curves presented in Figure 28 to Figure 30. The results are discussed in subsequent sections in relation to a comparison of the attenuation methodologies.
Figure 28: Attenuation curves (16th percentile, 50
th percentile and 84
th percentile) of PGV
(mm/s) derived from Akkar et al. (2013) and Douglas et al. (2013) GMPE for a magnitude 1.0 ML seismic event with a hypocentre at 3km. The attenuation curves for the Richter method are also presented for 15Hz and 20Hz.

Cuadrilla Bowland Limited Temporary shale gas exploration at Preston New Road Environmental Statement
Draft 3 | 24 May 2014
C:\RICHARD\RICHARD - WORK\JOBS\CUADRILLA\ISSUED DOCUMENTS\PRESTON NEW ROAD\2015-05-29 ES & PL DOCS FINAL\ES VOL 2 FINAL
APPENDICIES\PNR_ES_VOL2_APPNDX L_INDUCED SEISMICITY.DOCX
Page L89
Figure 29: Attenuation curves (16th percentile, 50
th percentile and 84
th percentile) of PGV
(mm/s) derived from Akkar et al. (2013) and Douglas et al. (2013) GMPE for a magnitude 2ML seismic event with a hypocentre at 3km. The attenuation curves for the original Richter method are also presented for 15Hz and 20Hz.
Figure 30: Attenuation curves (16th percentile, 50
th percentile and 84
th percentile) of PGV
(mm/s) derived from Akkar et al. (2013) and Douglas et al. (2013) GMPE for a magnitude 3ML seismic event with a hypocentre at 3km. The attenuation curves for the original Richter method are also presented for 15Hz and 20Hz.

Cuadrilla Bowland Limited Temporary shale gas exploration at Preston New Road Environmental Statement
Draft 3 | 24 May 2014
C:\RICHARD\RICHARD - WORK\JOBS\CUADRILLA\ISSUED DOCUMENTS\PRESTON NEW ROAD\2015-05-29 ES & PL DOCS FINAL\ES VOL 2 FINAL
APPENDICIES\PNR_ES_VOL2_APPNDX L_INDUCED SEISMICITY.DOCX
Page L90
Akkar et al. (2013) vs. Douglas et al. (2013)
282. For all magnitudes (1 to 3 ML) and up to approximately 50km epicentral distance, the general shape of the Akkar et al. (2013) and Douglas et al. (2013) attenuation curves are very similar.
283. For epicentral distances of between 0.01 and 10km and for a seismic event of magnitude 1 ML, the Akkar et al. (2013) equation predicts PGVs of over twice that predicted by the Douglas et al. (2013) equation. At epicentral distances of between 10 and 100km the attenuation curves tend to agree better.
284. From 50km to >100km the Douglas et al. (2013) attenuation curve decreases rapidly relative to the Akkar et al. (2013) curve, which decreases at a more steady rate.
285. The standard deviations (16th
and 84th
percentile) are similar for both GMPEs. For a magnitude 2 ML seismic event the predictions tend to agree better from 0.01 to 60km. However, for magnitude 3 ML, between epicentral distances of 0.01 and 50km, the Douglas et al. (2013) equation predicts PGVs of nearly three times that predicted by the Akkar et al. (2013) equation.
Richter method vs. GMPEs
286. The attenuation curves for the Richter method (15 and 20Hz) have the same general shape for all magnitudes.
287. In general, for all magnitudes, and for small epicentral distances of between 0.01 and 3km, predicted PGVs for both Richter methods (15 and 20Hz) are greater than those predicted by both GMPEs. At approximately 3km the attenuation curves for the Richter method (15 and 20Hz) decrease more rapidly relative to those predicted by the GMPEs.
Conclusions
288. The predicted ground motions calculated using GMPEs Akkar et al. (2013) and Douglas et al. (2013) have been compared to measured ground motions from the six small (1.2 to 2.8 ML) natural seismic events that occurred within the UK and were recorded on the local seismic monitoring network at Becconsall during the period 28
th April 2012 to 1
st April 2012
54,55,56,57,58 Although data is too scarce to
make a statistically significant conclusion, on the basis of observation the Akkar et al. (2013) equation tends to agree with measured ground motions better than the Douglas et al. (2013) equation. All subsequent analysis has therefore been undertaken using the Akkar et al. (2013) equation only.
289. It is recommended that the Akkar et al. (2013) GMPE is calibrated and amended using seismic data collected for natural seismic events during the monitoring period.
Deterministic seismic hazard results – during L8.3.2
exploration
290. The results of the DSHA do not account for any micro zonation or directivity of source and in accordance with the discussion on site classification within Section L8.2.2, a site classification for the upper 30m, VS30 of 200m/s has been used as a site wide value, which is considered to be a reasonably conservative assumption.

Cuadrilla Bowland Limited Temporary shale gas exploration at Preston New Road Environmental Statement
Draft 3 | 24 May 2014
C:\RICHARD\RICHARD - WORK\JOBS\CUADRILLA\ISSUED DOCUMENTS\PRESTON NEW ROAD\2015-05-29 ES & PL DOCS FINAL\ES VOL 2 FINAL
APPENDICIES\PNR_ES_VOL2_APPNDX L_INDUCED SEISMICITY.DOCX
Page L91
291. The results are presented as contour maps presenting the spatial distribution of PGV (see Figure 32 and Figure 34). The results are also presented in terms of peak ground velocity versus epicentral distance (see Figure 31 and Figure 33). These figures have been prepared to present the results for a seismic source location defined by the Red Line. This ensures that the PGVs predicted for all possible individual seismic source locations within the Red Line are encompassed within the same figure
292. Built into the Akkar et al. (2013) GMPE is a function that enables the standard deviation (σ) to be plotted, which enables the user to assess the variation in the data. In this case PGV is presented in terms of the following statistical variables:
95th
percentile (mean+2σ) = the probability of the PGV produced by a single induced seismic event exceeding the predicted 95
th percentile value is 5%.
84th
percentile (mean+1σ) = the probability of the PGV produced by a single induced seismic event exceeding the predicted 84
th percentile value is 16%.
50th
percentile (mean) = the probability of the PGV produced by a single induced seismic event exceeding the predicted 50
th percentile value is 50%.
16th
percentile (mean-1σ) = the probability of the PGV produced by a single induced seismic event exceeding the predicted 16
th percentile value is 84%.
5th
percentile (mean-2σ) = the probability of the PGV produced by a single induced seismic event exceeding the predicted 5
th percentile value is 95%.
293. In the context of this assessment, the maximum ground motions are of most interest. However, it should be understood that measured ground motions will vary depending on directivity of source and micro zonation, which have not been accounted for in the analysis. To account for this, the following discussion of predicted ground motions for each seismic scenario presents a range of values based on the 50
th percentile (mean) and 95
th percentile (mean+2σ) predicted
values.
With implementation of mitigation measures
Seismic scenario 1 (0.5 ML)
294. Ground motions predicted for a Scenario 1 seismic event using the Akkar et al. (2013) GMPE are presented within Figure 31. The 95
th percentile (mean+2σ)
values are presented in the form of a contour map to illustrate the approximate spatial distribution of ground motions (see Figure 32).
295. The results indicate that, for a magnitude 0.5 ML seismic event located at 1.75km depth with an event source within the area defined by the ‘Red Line’, maximum predicted ground motions are anticipated to be between 0.04 (50
th percentile) and
0.2mm/s (95th
percentile or upper bound) at the Preston New Road well site.
296. Maximum predicted ground motions attenuate with distance from the epicentre as described below:
At 3km from the epicentre ground motions are predicted to reduce to between 0.04 (50
th percentile) and 0.16mm/s (95
th percentile), well below the ground
motion resulting from road traffic.

Cuadrilla Bowland Limited Temporary shale gas exploration at Preston New Road Environmental Statement
Draft 3 | 24 May 2014
C:\RICHARD\RICHARD - WORK\JOBS\CUADRILLA\ISSUED DOCUMENTS\PRESTON NEW ROAD\2015-05-29 ES & PL DOCS FINAL\ES VOL 2 FINAL
APPENDICIES\PNR_ES_VOL2_APPNDX L_INDUCED SEISMICITY.DOCX
Page L92
At 5km from the epicentre ground motions are predicted to reduce to between 0.03 (50
th percentile) and 0.12mm/s (95
th percentile).
At 10km from the epicentre ground motions are predicted to reduce to between 0.01 (50
th percentile) and 0.05mm/s (95
th percentile).
297. These predicted ground motions are all below recommended thresholds for human perception and cosmetic damage.
Figure 31: Peak ground velocity (PGV) (5th percentile, 16
th percentile, 50
th percentile, 84
th
percentile and 95th percentile) estimated for a seismic event of ML = 0.5 and depth
H=1.5km. The GMPE by Akkar et al. (2013) is used.

Cuadrilla Bowland Limited Temporary shale gas exploration at Preston New Road Environmental Statement
Draft 3 | 24 May 2014
C:\RICHARD\RICHARD - WORK\JOBS\CUADRILLA\ISSUED DOCUMENTS\PRESTON NEW ROAD\2015-05-29 ES & PL DOCS FINAL\ES VOL 2 FINAL
APPENDICIES\PNR_ES_VOL2_APPNDX L_INDUCED SEISMICITY.DOCX
Page L93
Figure 32: Peak ground velocity (PGV) (95th percentile) estimated for an earthquake of
ML = 0.5 and depth H=1.5km with a seismic source within the area defined by the ‘Red Line’. The use of the Red Line as the source ensures that all possible individual source locations within the Red Line are encompassed within the same figure The GMPE by Akkar et al. (2013) is used.

Cuadrilla Bowland Limited Temporary shale gas exploration at Preston New Road Environmental Statement
Draft 3 | 24 May 2014
C:\RICHARD\RICHARD - WORK\JOBS\CUADRILLA\ISSUED DOCUMENTS\PRESTON NEW ROAD\2015-05-29 ES & PL DOCS FINAL\ES VOL 2 FINAL
APPENDICIES\PNR_ES_VOL2_APPNDX L_INDUCED SEISMICITY.DOCX
Page L94
Seismic Scenario 2 (1.5 ML)
298. Ground motions predicted for a Scenario 2 seismic event using the Akkar et al. (2013) GMPE are presented within Figure 33. These predicted ground motions are all below recommended thresholds for cosmetic damage and slightly exceed those for human perception. The 95
th percentile values are presented in the form of a
contour map to illustrate the approximate spatial distribution of ground motions (see Figure 34).
299. The results indicate that, for a magnitude 1.5 ML seismic event located at 2.2km depth and with an event source within the area defined by the ‘Red Line’, maximum predicted ground motions are anticipated to be between 0.5 (50
th
percentile) and 1.9mm/s (95th
percentile or upper bound) at the Preston New Road well site.
300. Maximum predicted ground motions attenuate with distance from the epicentre as described below:
At 3km from the ‘Red Line’ ground motions are predicted to reduce to 0.4 (50
th percentile) and 1.5mm/s (95
th percentile). PPV from train sourced ground
vibrations vary between 0.1 and 1.5mm/s.
At 5km from the epicentre ground motions are predicted to reduce to between 0.3 (50
th percentile) and 1.2mm/s (95
th percentile).
At 10km from the epicentre ground motions are predicted to reduce to between 0.1 (50
th percentile) and 0.5mm/s (95
th percentile). Road traffic
results in PPV between 0.1 and 0.8mm/s98
.
Figure 33: Peak ground velocity (PGV) (5th percentile, 16
th percentile, 50
th percentile, 84
th
percentile and 95th percentile) estimated for a seismic event of ML = 1.5 and depth
H=1.5km. The GMPE by Akkar et al. (2013) is used.

Cuadrilla Bowland Limited Temporary shale gas exploration at Preston New Road Environmental Statement
Draft 3 | 24 May 2014
C:\RICHARD\RICHARD - WORK\JOBS\CUADRILLA\ISSUED DOCUMENTS\PRESTON NEW ROAD\2015-05-29 ES & PL DOCS FINAL\ES VOL 2 FINAL
APPENDICIES\PNR_ES_VOL2_APPNDX L_INDUCED SEISMICITY.DOCX
Page L95
Figure 34: Peak ground velocity (PGV) (95th percentile) estimated for an earthquake of ML = 1.5 and depth H=1.5km with a seismic source within the area defined by the ‘Red Line’. The use of the Red Line as the source ensures that all possible individual source locations within the Red Line are encompassed within the same figure. The GMPE by Akkar et al. (2013) is used.

Cuadrilla Bowland Limited Temporary shale gas exploration at Preston New Road Environmental Statement
Draft 3 | 24 May 2014
C:\RICHARD\RICHARD - WORK\JOBS\CUADRILLA\ISSUED DOCUMENTS\PRESTON NEW ROAD\2015-05-29 ES & PL DOCS FINAL\ES VOL 2 FINAL
APPENDICIES\PNR_ES_VOL2_APPNDX L_INDUCED SEISMICITY.DOCX
Page L96
L9 Quantify the likely significant effects from induced seismic events
L9.1 Introduction
301. This section of the report provides a discussion on the assessment of the likely significant effects from induced seismicity and specifically ground motion hazards on receptors. The effects have subsequently been quantified. The seismic hazard associated with the construction, exploration and decommissioning phases of the proposed exploratory activities at the Preston New Road well site is discussed within Section L8. The assessment of the seismic hazard considers a variety of embedded mitigation measures as listed within L5.7 and described in more detail within Section L10.
302. As discussed in Section L5.3, L5.4 and L5.6 it is considered that there will be no effects associated with induced seismicity for the construction and decommissioning phases. As a consequence the following section only considers the effects associated with the operational phase (including drilling, hydraulic fracturing and flow testing).
303. As discussed in the assumptions and limitation section (Section L5.7), the hydraulic fracturing activities of the operational phase present the greatest risk of induced seismicity compared to flow testing and drilling. Any effects associated with flow testing will be significantly less than those associated with hydraulic fracturing (see Section L3.5). It is also considered that no mechanism exists for induced seismicity associated with drilling (see Section L3.6). Consequently, the results of the seismic hazard discussed below, and the discussion on the significance of the effects (discussed in Section L9) are for induced seismicity associated with hydraulic fracturing.
304. The potentially sensitive receptors (i.e. those that could adversely affected by an induced seismic event) have been separated into the following classes:
Physical damage to buildings;
Physical damage to civil infrastructure;
Human activity interference.
305. The quantification of the likely significant effects has been undertaken through consideration of the location and vulnerability (or damage/nuisance potential) of particular identified receptors, the selected criteria for ground vibration and the selected GMPEs. The potential for deformation of the well or nearby wells as a result of induced seismicity is discussed in Section 11.7.7 of Chapter 11, Hydrogeology and Ground Gas.
L9.2 Significance Criteria
306. In order to quantify the likely significant effects, the risk (combination of probability and consequence) and subsequently the significance of the effect have been estimated. This has been carried out in accordance with the framework defined within Table 17 to Table 20 below.
307. To reduce the significance of the effects of induced seismicity, mitigation measures have been presented which will be deployed by the operator. The

Cuadrilla Bowland Limited Temporary shale gas exploration at Preston New Road Environmental Statement
Draft 3 | 24 May 2014
C:\RICHARD\RICHARD - WORK\JOBS\CUADRILLA\ISSUED DOCUMENTS\PRESTON NEW ROAD\2015-05-29 ES & PL DOCS FINAL\ES VOL 2 FINAL
APPENDICIES\PNR_ES_VOL2_APPNDX L_INDUCED SEISMICITY.DOCX
Page L97
intention of these mitigation measures is to reduce the risk of felt magnitude seismic events occurring (generally greater than 1.5ML), rather than preventing very low magnitude seismic events (less than 0.5ML) occurring altogether. These mitigation measures are considered embedded mitigation measures and therefore will be considered as part of the assessment (see Section L5.7).
308. The consequence classification described in Table 17 below is based upon the effects of seismicity on structures and human response. This is based upon the well accepted EMS intensity scale, which classifies earthquake intensity in terms of observed effects, as described in Section L7.3.1. It is noted that the for any magnitude earthquake, the ground motion and subsequent EMS intensity will vary depending on local environmental conditions such as the ground conditions within the surface geology.
Table 17: Classification of consequence (if ground motion hazard occurs at a site) with mitigation measures.
Classification Definition
High consequence
A major incident resulting in significant damage. May be correlated to a seismic event of EMS intensity VIII, or USGS Shake Map® intensity VIII or higher.
Physical damage to buildings and/or civil infrastructure
A seismic event that may cause significant structural damage to buildings and civil infrastructure. A few well-built ordinary buildings show serious failure of walls, while weak older structures may collapse.
Interference with human activity
A seismic event that is felt by all. Building collapse and significant structural damage may cause significant harm to humans, including fatalities.
Medium consequence
A moderate localised effect. May be correlated to a seismic event of EMS intensity V to VII, or USGS Shake Map® intensity V to VII.
Physical damage to buildings and/or civil infrastructure
A seismic event that may cause minor non-structural damage to buildings and civil infrastructure, i.e. cracking of masonry building or window panes breaking to moderate levels of structural damage such as small cracks in walls and chimneys falling down.
Interference with human activity
A seismic event that is felt by all. Falling debris due to structural damage may cause some minor injuries
Low consequence
A localised minor effect with no significant impact. May be correlated to a seismic event of EMS intensity II to IV or USGS Shake Map® intensity II to IV.
Physical damage to buildings and/or civil infrastructure
No damage to buildings or civil infrastructure. Windows, doors and dishes may rattle.
Interference with human activity
A seismic event that may be perceptible to a few to many people. May feel light trembling. No injuries anticipated.
Very Low consequence
Slight environmental effect May be correlated to a seismic event of EMS intensity I or USGS Shake Map® intensity I.
Physical damage to buildings and/or civil infrastructure
No damage to buildings or civil infrastructure.
Interference with human activity
An event below the level of human perception, which can only be detected using extremely sensitive measurement devices. No injuries.

Cuadrilla Bowland Limited Temporary shale gas exploration at Preston New Road Environmental Statement
Draft 3 | 24 May 2014
C:\RICHARD\RICHARD - WORK\JOBS\CUADRILLA\ISSUED DOCUMENTS\PRESTON NEW ROAD\2015-05-29 ES & PL DOCS FINAL\ES VOL 2 FINAL
APPENDICIES\PNR_ES_VOL2_APPNDX L_INDUCED SEISMICITY.DOCX
Page L98
Table 18: Classification of probability/likelihood (of ground motion hazard at a site) with mitigation measures.
Classification Definition
High Likelihood
Seismic source, pathway and receptor exist. Established mechanism of seismicity that is anticipated to cause repeated occurrences per duration of exploration operations in the area.
Based on typical events associated with hydraulic fracturing, a seismic event of less than magnitude 0 ML is considered highly likely.
Medium Likelihood
Seismic source, pathway and receptor exist. Established mechanism of seismicity that is not inevitable. Anticipated to occur several times per duration of exploration operations in the area.
Based on typical events associated with hydraulic fracturing, the likelihood of a seismic event of magnitude >0.0 to 0.5 ML is considered medium.
Low Likelihood
Seismic source, pathway and receptor exist. Established mechanism of seismicity, however the linkage is not certain and events anticipated to occur infrequently per duration of exploration operations in the area. Industry examples, or has occurred in previous Cuadrilla operations.
Based on typical events associated with hydraulic fracturing, the likelihood of a seismic event of magnitude >0.5 to 1.5 ML is considered low.
Very low likelihood
Rarely encountered, never reported, or highly unlikely. Exceptional circumstances, few industry examples.
Seismic source, pathway and receptor exist, but circumstances are such that it is improbable that an event would occur duration of exploration operations in the area. Rarely or never reported and very few if any industry examples are available.
Based on typical events associated with hydraulic fracturing and maximum magnitude predictions for the Licence area, the likelihood of a seismic event of magnitude >1.5 is considered very low.
Table 19: Estimate of risk rating. (NB: All risk magnitudes in the context of induced seismicity are considered to be adverse).
Risk Matrix Consequence
High Moderate Low Very Low
Pro
ba
bil
ity
High likelihood
Major Major Major Moderate
Medium likelihood
Major Major Moderate Minor
Low likelihood
Major Moderate Minor Minor
Very low likelihood
Moderate Minor Minor Negligible
309. In this assessment, ‘Significant’ environmental effects are those assessed to be either moderate or major. ‘Not significant’ environmental effects are those assessed to be minor or negligible. Where Significant effects have been identified mitigation is required, as described in Table 20.
310. A description of the risk responses are presented within Table 20.

Cuadrilla Bowland Limited Temporary shale gas exploration at Preston New Road Environmental Statement
Draft 3 | 24 May 2014
C:\RICHARD\RICHARD - WORK\JOBS\CUADRILLA\ISSUED DOCUMENTS\PRESTON NEW ROAD\2015-05-29 ES & PL DOCS FINAL\ES VOL 2 FINAL
APPENDICIES\PNR_ES_VOL2_APPNDX L_INDUCED SEISMICITY.DOCX
Page L99
Table 20: Description of risk responses.
Risk magnitude Description
Major Major risks must be acted upon as a priority and reduced before the project can continue. The level of exposure is considered to be too high to continue.
Moderate Moderate risks must be acted upon, but they do not pose such an immediate threat and thus the project can continue while the risk response measures are integrated and/or performed.
Minor Minor risks may not require responses – it may be effective enough simply to monitor the risk to ensure that it does not rise during the project.
Negligible Negligible risks do not require responses.
L9.3 Seismic Receptors
311. To assess the likely significant effects associated with induced seismicity, the location and sensitivity of receptors has been determined through a high level desk based review and site walkover. This also enabled a judgement to be made with regard to building types within the area, which subsequently informed the determination of receptor sensitivity. The determination of receptor sensitivity was also informed through the process of reviewing criteria in the context of perceptible and damaging ground motions. Due to the high level review of building types within the area it is noted that an element of engineering judgement is incorporated into the assessment.
312. The section describes the ground motion criteria applied within the assessment and the location of receptors within the seismic study area.
Ground Motion Criteria L9.3.1
313. A detailed review of ground motion criteria in the context of earthquakes and ground borne vibrations from construction activities has been carried out and is presented within Section L7. Section L7.5 provides summary tables of recommended ground motion criteria to be used as the basis of this assessment and these tables are summarised below in Table 21 with regard to damage to buildings, damage to civil infrastructure and interference of human activities.
314. Receptors have been assigned sensitivity classes in accordance with their corresponding ground motion criteria. The sensitivity classes have been defined within Table 21 below.
Table 21: Summary of recommended ground motion criteria to be used for assessment of likely significant effects. See Table 11 to Table 13 for specific references.
Sensitivity Class*
Receptor Criteria Comment
N/A Sensitive equipment or activities.
It is considered that there will be no additional effect of vibration on sensitive equipment/activities as a result of the Project and this has not been assessed further.
Class IA Residential environments. 0.5mm/s Perceptible in residential environments.
Class IB Residential environments. 1.0mm/s Level above which is likely to cause complaint.
Class II Damage to sensitive 12mm/s Shall not exceed 12mm/s.

Cuadrilla Bowland Limited Temporary shale gas exploration at Preston New Road Environmental Statement
Draft 3 | 24 May 2014
C:\RICHARD\RICHARD - WORK\JOBS\CUADRILLA\ISSUED DOCUMENTS\PRESTON NEW ROAD\2015-05-29 ES & PL DOCS FINAL\ES VOL 2 FINAL
APPENDICIES\PNR_ES_VOL2_APPNDX L_INDUCED SEISMICITY.DOCX
Page L100
Sensitivity Class*
Receptor Criteria Comment
buildings.
Class III Unreinforced or light framed structure or residential or light commercial buildings.
20mm/s at 15Hz Cosmetic damage, i.e. cracking of plaster.
Class IV Civil infrastructure
>30mm/s**
National grid high pressure pipeline and other pipelines.
Ground vibration to be limited to a maximum of 75mm/s.
Utilities.
Maximum level of vibrations to which services should be subjected (30mm/s for transient vibrations).
Bridges. Above which structures could be damaged under the category of ‘threshold cracking’ (51mm/s)
Class V Reinforced or framed structure or industrial and heavy commercial buildings.
50mm/s Cosmetic damage, i.e. cracking of plaster.
*Sensitivity class assigned on the basis of selected ground motion criteria.
**Criteria of >30mm/s assigned as a minimum. Criteria for individual features likely to be higher, i.e. National Grid pipeline recommend a maximum PPV of 50mm/s.
Receptor Locations L9.3.2
315. The location of seismic sensitive receptors with respect to the Preston New Road well site has been determined and the characteristics of seismic sensitive receptors are discussed in Section L6.10.
L9.4 Significance of Effects
Significance of Effects of the Ground Motion Hazard L9.4.1
316. This section of the report provides a discussion on the assessment of the likely significant effects of the ground motion hazard on receptors. The quantification of the likely significant effects has been undertaken through consideration of the location and vulnerability (or damage/nuisance potential) of particular identified receptors and the selected ground motion criteria (in accordance with Table 21).
317. A detailed review of ground motion criteria was carried out and is presented within Section L7. The findings of this review are summarised within Table 21 above in the context of damage to buildings, damage to infrastructure and human perception. Receptors have been assigned sensitivity classes in accordance with their corresponding ground motion criteria.
318. These criteria presented below have subsequently been used to assess the likely significant effects of the ground motion hazards in the context of these receptors types and sensitivity classes. The likely significant effects have then been quantified using the significance criteria and the risk rating matrix which are presented within Section L9.2.

Cuadrilla Bowland Limited Temporary shale gas exploration at Preston New Road Environmental Statement
Draft 3 | 24 May 2014
C:\RICHARD\RICHARD - WORK\JOBS\CUADRILLA\ISSUED DOCUMENTS\PRESTON NEW ROAD\2015-05-29 ES & PL DOCS FINAL\ES VOL 2 FINAL
APPENDICIES\PNR_ES_VOL2_APPNDX L_INDUCED SEISMICITY.DOCX
Page L101
319. The predicted ground motions presented as contours within, Figure 32, and Figure 34 and are presented in graphical format.in Figure 35 and Figure 36. These figures also illustrate the ground motion criteria for specific sensitivity classes (as defined within Table 21), and have subsequently been used to determine the likely significant effects of the ground motion hazard on receptors (as summarised within Table 22).
Figure 35: Peak ground velocity (PGV) (95th percentile, 84
th percentile and 50
th
percentile) estimated for a seismic event of magnitude 0.5 ML and depth (H) = 1.5 km. The GMPE by Akkar et al. (2013) is used. Ground motion criteria associated with various receptor sensitivity classes is also presented.

Cuadrilla Bowland Limited Temporary shale gas exploration at Preston New Road Environmental Statement
Draft 3 | 24 May 2014
C:\RICHARD\RICHARD - WORK\JOBS\CUADRILLA\ISSUED DOCUMENTS\PRESTON NEW ROAD\2015-05-29 ES & PL DOCS FINAL\ES VOL 2 FINAL
APPENDICIES\PNR_ES_VOL2_APPNDX L_INDUCED SEISMICITY.DOCX
Page L102
Figure 36: Peak ground velocity (PGV) (95th percentile, 84
th percentile and 50
th
percentile) estimated for a seismic event of magnitude 1.5 ML and depth (H) = 1.5km. The GMPE by Akkar et al. (2013) is used. Ground motion criteria associated with various receptor sensitivity classes is also presented.
320. The significance of effects due to construction, operation and decommissioning has been reviewed in accordance with the framework set out in Table 17 to Table 20. The significance of effects and risk responses are summarised within Table 22 and Table 23 below.
Table 22: Summary of the significant effects of induced seismicity at the Preston New Road well site for specific seismic scenarios.
Seismic scenario
Mag (ML)
Figure reference
Summary of the likely significant effects
With implementation of mitigation measures
1 0.5 Figure 32 and Figure 35
Vibrations are not anticipated to be felt at the ground surface and will only be detected instrumentally.
Damage to buildings or infrastructure is not anticipated. Locally intensities of up to I European Macroseismic Scale (EMS) (EMS I = not felt).
2 1.5 Figure 34 and Figure 36
Vibrations may be felt in the most sensitive situations local to the Preston New Road well site.
Locally intensities of up to II European Macroseismic Scale
Damage to buildings and infrastructure is not anticipated.
(EMS) may be felt (EMS II = scarcely felt effects, only detected by very few individuals in the most sensitive situations, i.e. at rest indoors).

Cuadrilla Bowland Limited Temporary shale gas exploration at Preston New Road Environmental Statement
Draft 3 | 24 May 2014
C:\RICHARD\RICHARD - WORK\JOBS\CUADRILLA\ISSUED DOCUMENTS\PRESTON NEW ROAD\2015-05-29 ES & PL DOCS FINAL\ES VOL 2 FINAL
APPENDICIES\PNR_ES_VOL2_APPNDX L_INDUCED SEISMICITY.DOCX
Page L103
Table 23: Summary of the significance of effects of induced seismicity at the Preston New Road well site for specific scenarios, with a description of the associated risk response.
Seismic scenario
Mag (ML)
Significance of effects Risk response
Implementation of mitigation measures
1 0.5 Likelihood medium. Consequence very low. Risk magnitude minor and significance of effect not significant.
Minor risks do not require mitigation measures above the embedded mitigation measures.
2 1.5 Likelihood low. Consequence low. Risk magnitude minor and significance of effect not significant.
Minor risks do not require mitigation measures above the embedded mitigation measures.
Maximum considered magnitude 3.1 ML earthquake L9.4.2
scenario (without implementation of embedded
mitigation measures)
321. The main assessment of the effects of induced seismicity described within Section L9.4 focuses specifically on the scenarios that are considered possible during the Project (0.5 ML and 1.5 ML).This discussion on a 3.1 ML event should not be considered part of the main assessment. It is considered useful for comparison to assess the effects of a theoretical maximum magnitude 3.1ML induced seismic event for the Licence area (based on volumes of fracturing fluid used at Preese Hall-1 well) and to demonstrate the reduction in ground motion hazard achieved though implementation of the mitigation measures.
322. Although not considered part of the main assessment, because embedded mitigation measures are required to be implemented at all stages, it is of interest to note that for this scenario to occur three very unlikely events are required to occur simultaneously, including: 1) The volume of pumping fluid per stage is similar to that used in the Preese Hall operations without minimisation; 2) The Traffic light System (described in Section L10.7) fails to fulfil its purpose; and 3) Fluid is transmitted into a critically stressed fault and it fails. Considering these points above, the likelihood of a 3.1 ML seismic event is considered very low due to the effectiveness of the mitigation measures that have been implemented as part of the Project (see Section L10). The exploration activities will not take place without implementation of these mitigation measures.
323. For consistency the assessment of the seismic hazard of the 3.1ML scenario the same source parameters and pathway parameters have been used to the main assessment (i.e. source depth 1.5km). The predicted ground motions have been derived for a point source (the Site) instead of using the Red Line..
324. The predicted ground motions indicate that if a 3.1 ML seismic event occurred then the following effects may occur:
Vibrations may be felt up to 65km from the Site;
Some minor cosmetic damage, such as cracking plaster, to local sensitive structures and possibly some local unreinforced buildings;
Rare minor damage to most sensitive civil infrastructure;
No damage anticipated to reinforced buildings.

Cuadrilla Bowland Limited Temporary shale gas exploration at Preston New Road Environmental Statement
Draft 3 | 24 May 2014
C:\RICHARD\RICHARD - WORK\JOBS\CUADRILLA\ISSUED DOCUMENTS\PRESTON NEW ROAD\2015-05-29 ES & PL DOCS FINAL\ES VOL 2 FINAL
APPENDICIES\PNR_ES_VOL2_APPNDX L_INDUCED SEISMICITY.DOCX
Page L104
325. Although not part of the main assessment, an assessment of the significance of the risk, in accordance with Table 17 to Table 20 is as follows:
Likelihood of a 3.1ML event occurring is considered very low;
Consequence of a 3.1 ML event is considered medium;
The risk magnitude significance is minor and not significant.
Effects of liquefaction L9.4.3
326. The levels of vibrations caused by induced seismicity associated with the exploration activities will be far below the levels required to cause liquefaction.
327. There is no mechanism for liquefaction to occur, therefore the risk magnitude is considered to be “so low as to be negligible”.
Effects of slope instability L9.4.4
328. Due to the very low hazard of induced seismicity associated with the exploration activities at the Site, and the typically level topography of the region, the hazard of soil and rock instability is considered to be virtually impossible.
329. There is no mechanism for liquefaction to occur, therefore the risk magnitude is considered to be “so low as to be negligible”.
Effects of settlement causing surface deflections from L9.4.5
gas extraction
330. It has been suggested that exploration for shale gas can cause settlement of the ground surface. Settlement from extractive hydrocarbon industries has occurred in the past by either:
1) Removing large quantities of rock, for example in the coal industry; or
2) Removing liquid and gas in pore spaces between the rock causing the rock to consolidate, for example in the oil and gas industries.
331. Settlement, and more importantly deflection, of the ground surface can cause architectural and structural problems to buildings, services and infrastructure.
332. “Shale gas production does not remove from underground” (DECC 20131),
therefore the first potential mechanism for causing settlement, by removing large quantities of rock, will not occur at the Site. The second potential mechanism for causing settlement, consolidation or compaction due to extraction of liquids and gas will not occur at the Site because the “amount that shale rock changes with the extraction of gas is expected to be almost zero” (DECC 2013
1). In addition,
the ground surface is some 2.5 to 3km or more above the target reservoir, the horizontal wells in the shale will be no more than 8.5 inches in diameter, and the fractures created are equivalent in size to a grain of sand. Hence there is no mechanism for the extraction of gas to cause deflection of the ground surface.
333. It should be noted that the Preston New Road well is an exploration well and is not, at present, planned for full scale production. As such there is no plan to extract any great quantity of gas, merely investigate the possible rates of gas flow

Cuadrilla Bowland Limited Temporary shale gas exploration at Preston New Road Environmental Statement
Draft 3 | 24 May 2014
C:\RICHARD\RICHARD - WORK\JOBS\CUADRILLA\ISSUED DOCUMENTS\PRESTON NEW ROAD\2015-05-29 ES & PL DOCS FINAL\ES VOL 2 FINAL
APPENDICIES\PNR_ES_VOL2_APPNDX L_INDUCED SEISMICITY.DOCX
Page L105
in the Bowland Basin. Therefore, the risk that the extraction of shale gas will cause deflection of the ground surface during exploration at the Site is considered to be “so low as to be negligible”.
Effects of settlement from gas extraction causing L9.4.6
earthquakes
334. It has been suggested that exploration for shale gas can cause settlement that leads to induced seismicity in a similar way as is being experienced in Groningen, Holland. Induced seismicity from hydrocarbon extraction is known to occur and can cause distress to people who feel the vibrations, occasionally architectural damage to structures and rarely structural damage to structures, services and infrastructure.
335. The type of reservoir targeted by the Preston New Road well (low porous shale) is very different from the reservoir at Groningen, Holland (porous sandstone). Therefore the exploration activities for shale gas causing settlement that leads to induced seismicity will not occur at the Site.
336. DECC (2013)1 confirms this statement by saying: “There is no evidence from
more than a decade of very active shale gas operations in the US to suggest any effect of this kind. However, there is long-term monitoring of seismicity in Lancashire, and analysis of the events recorded on the BGS National Earthquake Monitoring System will alert scientists and regulators to changes in the natural background seismicity of the area. An additional BGS National Earthquake Monitoring System station is being installed in Lancashire”. The additional monitoring station is being installed by Cuadrilla for the BGS.
337. It should be noted that the Preston New Road well is an exploration well and is not, at present, planned for full scale production. As such there is no plan to extract any great quantity of gas, merely investigate the possible rates of gas flow in the Bowland basin. Therefore, the risk that exploration for shale gas can cause settlement that leads to induced seismicity during the exploration phase at the Site is considered to be “so low as to be negligible”.
Effects of fluid migration and changes in the stress L9.4.7
regime in the Bowland Basin inducing seismicity in
deep basement faults
338. It has been suggested that fluid migration and changes in the stress regime in the Bowland Basin could induce seismicity in deep basement faults. This relates to regional faults that are present over large areas, which may have more stored energy and could potentially cause earthquakes in excess of the maximum predicted ‘local’ earthquake of 3.1 ML (possibly up to the maximum predicted earthquake for the UK approximately 5 to 6 ML). This is also sometimes known as triggered seismicity or the butterfly effect. The butterfly effect is the sensitive dependence on initial conditions, where a small change at one place in a non-linear system can result in large differences in a later state. Throughout this document, the terminology butterfly effect is used to characterise non-linear behaviour, where small, localised stress perturbations on a fault lead to a large magnitude earthquake
79. However, an earthquake of magnitude 6 ML would
require fault slip over a length of approximately 10km. Obviously stress perturbations caused by the scale of hydraulic fracturing considered for

Cuadrilla Bowland Limited Temporary shale gas exploration at Preston New Road Environmental Statement
Draft 3 | 24 May 2014
C:\RICHARD\RICHARD - WORK\JOBS\CUADRILLA\ISSUED DOCUMENTS\PRESTON NEW ROAD\2015-05-29 ES & PL DOCS FINAL\ES VOL 2 FINAL
APPENDICIES\PNR_ES_VOL2_APPNDX L_INDUCED SEISMICITY.DOCX
Page L106
exploration purposes at the Site will act over a significantly smaller length. Therefore it is considered that an upper bound estimate of seismicity based on movement of deep basement faults is considered implausible.
339. In addition, Cuadrilla has carried out an extensive and detailed 3D geophysical (seismic) survey of the area around the site, identified the major faults and will avoid hydraulic fracturing within the vicinity of these faults. Cuadrilla have also committed to “flowback” to minimise the build-up of pressure in the reservoir. As stated previously DECC1 has committed to “long-term monitoring of seismicity in Lancashire” that will “alert scientists and regulators to changes in the natural background seismicity of the area” (DECC 2013
1). On this basis, it is considered
that induced seismicity of deep basement faults resulting from fluid migration and changes in the stress regime due to shale gas exploration in the Bowland Basin will not occur at the Site
340. It should be noted that the Preston New Road well is an exploration well and is not, at present, planned for full scale production. As such there is no plan to extract any great quantity of gas, merely investigate the possible rates of gas flow in the Bowland basin. Therefore, the risk of fluid migration and changes in the stress regime inducing seismicity in deep basement faults during the exploration phase at the Site is considered to be “so low as to be negligible”.
Effects of ground motion hazard causing salt cavern L9.4.8
instability at the nearby Preesall salt mine
341. Damage to the local Preesall salt mines due to induced seismicity associated with shale gas exploration activities at Preston New Road has been identified as a risk. It is understood that an application is currently pending for the Preesall Saltfield Underground Storage project. A seismic hazard report was carried out by Mott Macdonald for the proposed Preesall Saltfield Underground Storage project
114,
which114
stated that the risk of cavern instability due to seismicity (induced or natural) was confirmed to be negligible.
342. A literature review uncovered very few references to seismic events causing instability of salt caverns. The majority of literature available relevant to ‘salt caverns’ and ‘seismicity’ were studies on salt cavern collapse as a source of microseismicity, rather than as a consequence of natural or induced seismicity.
343. It is therefore considered that the risk of ground motion hazard causing salt cavern instability at the nearby Preesall Salt Mine is “so low as to be negligible”.
L9.5 Cumulative and interactive effects
344. Cumulative effects can be defined as “the impacts of the environment which result from incremental impacts of the action when added to past, present and reasonable foreseeable future actions, regardless of who undertakes other actions. Cumulative impacts can result from individually minor but collectively significant actions taking place over a period of time”
115.
114
Mott MacDonald. (2011). Preesall Underground Gas Storage Facility, Lancashire – Geological
Summary Report. Doc. Ref.: 9.2.2. 115
Institute of Environmental Management and Assessment (IEMA). (2011). The state of
environmental impact assessment practice in the UK.

Cuadrilla Bowland Limited Temporary shale gas exploration at Preston New Road Environmental Statement
Draft 3 | 24 May 2014
C:\RICHARD\RICHARD - WORK\JOBS\CUADRILLA\ISSUED DOCUMENTS\PRESTON NEW ROAD\2015-05-29 ES & PL DOCS FINAL\ES VOL 2 FINAL
APPENDICIES\PNR_ES_VOL2_APPNDX L_INDUCED SEISMICITY.DOCX
Page L107
345. In addition to the direct effects of induced seismicity, which are typically associated with the ground motion hazard, the cumulative and interactive effects have also been considered. These effects may include the following:
1) Cumulative and interactive effects of the Preston New Road and Roseacre Wood works occurring together;
2) Cumulative and interactive effects of hydraulic fracturing and initial flow testing occurring together on the same well pad;
3) Cumulative and interactive effects of initial flow testing and drilling occurring together at the same well pad;
4) Cumulative and interactive effect of Roseacre Wood occurring at the same time as other developments in the area.
Cumulative and interactive effects of the Preston New L9.5.1
Road and Roseacre Wood works occurring together
346. This cumulative and interactive effect relates to the assumption that the exploration activities at Preston New Road and Roseacre Wood may occur at the same time.
347. As discussed in Section L5.7, in the context of induced seismicity, the hydraulic fracturing activities present the greatest risk of induced seismicity compared to other phases/activities, such as flow testing. The assessment of effects of induced seismicity associated with hydraulic fracturing at the Preston New Road well has been presented within Section L9.4.
348. Cuadrilla has confirmed that they will carry out hydraulic fracturing activities at one site at a time and will never have simultaneous hydraulic fracturing activities. The cumulative and interactive effects of hydraulic fracturing activities occurring at Preston New Road and Roseacre Wood at the same time have therefore not been assessed further.
349. Although hydraulic fracturing will not occur at Preston New Road and Roseacre Wood together, it is understood that hydraulic fracturing activities may occur on one site at the same time as flow testing occurring on the other site (simultaneous flow testing and hydraulic fracturing activities). As discussed in Section L3.5, there is no evidence to indicate that induced seismic events during flow testing will be greater than those during hydraulic fracturing.
350. Any increase in pressure experienced during hydraulic fracturing will dissipate during flow testing due to the flowback of gas and fracture fluid to the surface. On this basis it is considered that there will be no additional effects associated with simultaneous hydraulic fracturing and flow testing activities (in addition to those described in Section L9.4 for hydraulic fracturing only).
351. Therefore, the risk rating for the cumulative and interactive effects the Preston New Road and Roseacre Wood works occurring together is the same as the risk magnitude for hydraulic fracturing described in Section L9.4.

Cuadrilla Bowland Limited Temporary shale gas exploration at Preston New Road Environmental Statement
Draft 3 | 24 May 2014
C:\RICHARD\RICHARD - WORK\JOBS\CUADRILLA\ISSUED DOCUMENTS\PRESTON NEW ROAD\2015-05-29 ES & PL DOCS FINAL\ES VOL 2 FINAL
APPENDICIES\PNR_ES_VOL2_APPNDX L_INDUCED SEISMICITY.DOCX
Page L108
Cumulative and interactive effects of hydraulic L9.5.2
fracturing and initial flow testing occurring together on
the same well pad
352. This cumulative and interactive effect relates to the assumption that the hydraulic fracturing and flow testing may occur at the same time on the same well pad.
353. The assessment of the simultaneous hydraulic fracturing and initial flow testing at the same well pad will be the same as simultaneous hydraulic fracturing and flow testing at Preston New Road and Roseacre Wood (as described in Section L9.5.1).
354. Therefore, the risk rating for the cumulative and interactive effects of induced seismicity associated with Preston New Road and Roseacre Wood works occurring together is the same as the risk magnitude for hydraulic fracturing described in Section L9.4.
Cumulative and interactive effects of initial flow testing L9.5.3
and drilling occurring together at the same well pad
355. This cumulative and interactive effect relates to the assumption that the flow testing may occur at the same time as drilling on the same well pad.
356. As discussed in Section L3.6, there is no mechanism for drilling inducing seismicity. Therefore, the results of the assessment of simultaneous drilling and flow testing as the same well pad will be the same as flow testing. As described in Section L5.7, the effects of induced seismicity associated with flow testing will not be greater than that associated with hydraulic fracturing and the assessment of the effects of flow testing have been based on the worst case, i.e. the hydraulic fracturing activities.
357. Therefore, the risk magnitude for the cumulative and interactive effects of initial flow testing and drilling occurring together on the same well pad is the same as the risk magnitude for hydraulic fracturing described in Section L9.4.
Cumulative and interactive effect of Preston New Road L9.5.4
occurring at the same time as other developments in the
area
358. This cumulative and interactive effect relates to the assumption that other developments in the area (with a mechanism for inducing seismicity) may occur at the same time as the Project.
Above ground developments
359. Whilst other above ground developments (i.e. typical construction activities such as housing and highway etc.) may occur within the area at the same time, there is no mechanism for these activities to induce seismicity. There will be no effects in addition to those described for hydraulic fracturing (see Section L9.4) and this has not been assessed further.
Below ground developments
360. The cumulative and interactive effects of the Preston New Road and Roseacre Wood Projects occurring together have been discussed in Section L9.4.

Cuadrilla Bowland Limited Temporary shale gas exploration at Preston New Road Environmental Statement
Draft 3 | 24 May 2014
C:\RICHARD\RICHARD - WORK\JOBS\CUADRILLA\ISSUED DOCUMENTS\PRESTON NEW ROAD\2015-05-29 ES & PL DOCS FINAL\ES VOL 2 FINAL
APPENDICIES\PNR_ES_VOL2_APPNDX L_INDUCED SEISMICITY.DOCX
Page L109
361. It is understood that the only other significant below ground project in the area, that may be capable of inducing seismicity, is the proposed gas storage project at the nearby abandoned salt mines at Preesall (situated approximately 12km north-west of the Site).
362. A report by the BGS on the geology of the Preesall saltfiled116
and a seismic hazard report by Mott Macdonald
114 were reviewed to understand the seismic
hazard associated with the proposals for underground gas storage at Preesall.
363. The BGS report116 states that: “although the Preesall site is in an area which is
dominated by geological structures which could be considered as liable to activation, observed seismicity in the past on these structures has been low…The likelihood of any fault reactivation near the site causing a direct rock rupture hazard is extremely small; such an event has never happened anywhere in the UK in historical times, as the larger UK earthquakes have depths considerably in excess of their rupture dimensions.”
364. The Mott Macdonald seismic hazard report114
concurred with the findings of the BGS report116 and stated that: “the risk of cavern instability due to seismicity (induced or natural) was confirmed to be negligible”. An assessment of induced seismicity resulting from existing cavern roof collapse (which is a known mechanism of inducing seismicity) was also undertaken. This concluded that the energy released would be within the regional seismic range.
365. As a conservative approach, it is considered that the effects of induced seismicity associated with the Preesall gas storage project will be similar to the worst case scenario considered for hydraulic fracturing at the Site with implementation of mitigation measures (i.e. Scenario 2 – 1.5 ML). Based on the assessment of ground motion hazard described within Section L9.4 for a Scenario 2 (1.5 ML) seismic event, the risk magnitude of the cumulative and interactive effects of the Preeseall gas storage project occurring at the same time as the Project is considered to be minor.
L9.6 Assessment summary matrix
366. The risk magnitude or significance associated with the likely significant effects of induced seismicity has been evaluated according to the methodology described within Section L9.2. The results of this risk assessment have been described within preceding text and summarised below within Table 24.
367. In summary, the risk magnitude for each likely significant effect has been assessed as Minor or Negligible. This assessment has been made on the basis of the mitigation measures described within Section L10 being implemented as embedded mitigation measures, i.e. form part of the proposed Project. Therefore no additional mitigation measures are considered necessary and residual effects are therefore also Minor or Negligible.
116
British Geology Survey (2005). The geology of the Preesall Saltfield area. Keyworth,
Nottingham.

Cuadrilla Bowland Limited Temporary shale gas exploration at Preston New Road Environmental Statement
Draft 3 | 24 May 2014
C:\RICHARD\RICHARD - WORK\JOBS\CUADRILLA\ISSUED DOCUMENTS\PRESTON NEW ROAD\2015-05-29 ES & PL DOCS FINAL\ES VOL 2 FINAL APPENDICIES\PNR_ES_VOL2_APPNDX L_INDUCED SEISMICITY.DOCX
Page L110
Table 24: Induced seismicity assessment summary matrix.
Item no.
Hazard/event/impact Source Pathway Receptor(s) Probability
Consequence Risk Magnitude
Proposed Mitigation Residual Risk
Construction of the Well Pad and Access
No anticipated effects
Installation of the Surface and Buried arrays
No anticipated effects
Drilling
No anticipated effects
Hydraulic fracturing, initial flow testing and extended well testing
1 Ground motion hazard from induced seismicity associated with hydraulic fracturing (Scenario 1 – 0.5 ML seismic event).
Hydraulic fracturing – Propagation and growth of engineered fractures / hydraulic fracturing injection fluid causing movement on a fault plane.
→ The ground – modelled using ground motion prediction equation – Akkar et al (2013).
→ Surface and below ground structures, including buildings, infrastructure, and human response.
Medium Very low Minor No additional mitigation required.
Minor
2 Ground motion hazard from induced seismicity associated with hydraulic fracturing (Scenario 2 – 1.5 ML seismic event).
→ → Low Low Minor No additional mitigation required.
Minor
3 Ground motion hazard from induced seismicity associated with hydraulic fracturing (Scenario 3 – 3.1 ML seismic event).
→ → Very low Moderate Minor No additional mitigation required.
Minor
4 Effects of well integrity. See Section 11.7.7 of Chapter 11, Hydrogeology and Ground Gas. Very low Low Minor No additional mitigation required.
Minor
5 Effects of liquefaction. No plausible linkage – vibrations caused by induced seismicity associated with the exploration activities will be far below the levels required to cause liquefaction.
No additional mitigation required.
Negligible
6 Effects of slope instability. No plausible linkage – considered to be virtually impossible due to the very low hazard of induced seismicity at the Site, and the typically level topography of the region.
No additional mitigation required.
Negligible
7 Effects of settlement causing surface deflections from gas extraction.
No plausible linkage – no removal of rock mass and volume change virtually zero, therefore no mechanism for the extraction of gas to cause deflection of the ground surface.
No additional mitigation required.
Negligible
8 Effects of settlement from gas extraction causing earthquakes.
No plausible linkage – temporary gas extraction from low porosity shales will not result in settlement that can cause earthquakes. No additional mitigation required.
Negligible
9 Effects of fluid migration and changes in the stress regime in the Bowland Basin inducing seismicity in deep basement faults.
No plausible linkage – because of the lack of regional faults at the Site, temporary nature of activities and low background seismicity, no mechanism this effect is identified.
No additional mitigation required.
Negligible
10 Effects of ground motion hazard causing salt cavern instability at the nearby Preesall salt mine.
No plausible linkage – seismic hazard report concluded risk magnitude is negligible. No additional mitigation required.
Negligible
Decommissioning and Restoration
No anticipated effects
Cumulative and interactive effects
11 Cumulative and interactive effects of the Preston New Road and Roseacre Wood works occurring together.
The risk magnitude for the cumulative and interactive effects of the Roseacre Wood and Preston New Road works occurring together is the same as the risk magnitude for hydraulic fracturing described in Section L9.4 (see items 1 to 10 above).

Cuadrilla Bowland Limited Temporary shale gas exploration at Preston New Road Environmental Statement
Draft 3 | 24 May 2014
C:\RICHARD\RICHARD - WORK\JOBS\CUADRILLA\ISSUED DOCUMENTS\PRESTON NEW ROAD\2015-05-29 ES & PL DOCS FINAL\ES VOL 2 FINAL APPENDICIES\PNR_ES_VOL2_APPNDX L_INDUCED SEISMICITY.DOCX
Page L111
Item no.
Hazard/event/impact Source Pathway Receptor(s) Probability
Consequence Risk Magnitude
Proposed Mitigation Residual Risk
12 Cumulative and interactive effects of hydraulic fracturing and initial flow testing occurring together on the same wellpad.
The risk magnitude for the cumulative and interactive effects of the hydraulic fracturing and initial flow testing occurring together on the same wellpad is the same as the risk magnitude for hydraulic fracturing described in Section L9.4 (see items 1 to 10 above).
13 Cumulative and interactive effects of initial flow testing and drilling occurring together at the same wellpad.
The risk magnitude for the cumulative and interactive effects of initial flow testing and drilling occurring together at the same wellpad is the same as the risk magnitude for hydraulic fracturing described in Section L9.4 (see items 1 to 10 above).
14 Cumulative and interactive effect of Preston New Road occurring at the same time as other developments in the area.
The risk magnitude for the cumulative and interactive effects of Preston New Road works occurring at the same time as other developments in the area is the same as the risk magnitude for hydraulic fracturing described in Section L9.4 (see items 1 to 10 above).

Cuadrilla Bowland Limited Temporary shale gas exploration at Preston New Road Environmental Statement
Draft 3 | 24 May 2014
C:\RICHARD\RICHARD - WORK\JOBS\CUADRILLA\ISSUED DOCUMENTS\PRESTON NEW ROAD\2015-05-29 ES & PL DOCS FINAL\ES VOL 2 FINAL
APPENDICIES\PNR_ES_VOL2_APPNDX L_INDUCED SEISMICITY.DOCX
Page L112
L10 Induced seismicity mitigation measures
L10.1 Introduction
368. Felt seismicity up to magnitude 2.3 ML occurred during hydraulic fracturing operations at Cuadrilla’s Preese Hall well in 2011. Hydraulic fracturing operations were suspended pending a review of the seismicity and recommendations for future hydraulic fracturing operations. A number of reports were produced in response to and following these induced seismic events including, but not limited to:
a. Green, C.A., Styles, P., and Baptie, B.J., (2012), Preese Hall Shale Gas Fracturing Review and Recommendations for Induced Seismic Mitigation
13;
b. The Royal Society and The Royal Academy of Engineering, (2012), Shale gas extraction in the UK: a review of hydraulic fracturing (DES2597)
14;
c. UK Onshore Operators Group’s UK Onshore Shale Gas Well Guidelines2;
and
d. DECC. (2014). Fracking UK shale: understanding earthquake risk1.
e. DECC. (2014). Extended well tests and Frac Plan guidance document22
.
369. The documents listed above are the prevailing sources of recommendations for good industry practice going forward, in addition to the requirements announced in Parliament via a written ministerial statement by the Secretary of State for Energy and Climate Change on December 13
th 2012
3.
370. This Appendix takes the recommendations from all the above documents and combines the similar recommendations to make a single comprehensive list that should be in place before future hydraulic fracturing operations could be recommenced in order to minimise the likelihood of felt induced seismic events from future hydraulic fracturing operations.
371. In summary, the following principal mitigation measures are recommended:
Reviewing available information on geology, structure (including faults) and in situ stresses in the vicinity of the proposed Site to avoid hydraulically fracturing into, or close to, existing critically stressed faults;
Carry out risk based geomechanical assessments of proposed hydraulic fracturing with regard to known faults (including maximum magnitude estimates);
Monitoring background induced and natural seismicity before, during and after hydraulic fracturing;
Evolutionary approach to risk assessment and mitigation – Fracture evolution and operational mitigation including a mini-fracture stage prior to the initial main hydraulic fracturing stage and reduced per stage volumes of hydraulic fracturing fluids compared to those used at Preese Hall. This stepped progressive approach to hydraulic fracturing will consist of an initial mini-fracture stage and modest initial pumped volumes building up to a maximum pump volume of 765m
3 per stage (less than half of the average volumes

Cuadrilla Bowland Limited Temporary shale gas exploration at Preston New Road Environmental Statement
Draft 3 | 24 May 2014
C:\RICHARD\RICHARD - WORK\JOBS\CUADRILLA\ISSUED DOCUMENTS\PRESTON NEW ROAD\2015-05-29 ES & PL DOCS FINAL\ES VOL 2 FINAL
APPENDICIES\PNR_ES_VOL2_APPNDX L_INDUCED SEISMICITY.DOCX
Page L113
pumped per stage at Preese Hall). As this process continues, an understanding of the performance of the reservoir during hydraulic fracturing is developed;
Monitor the extent of fracture growth during hydraulic fracturing using a buried microseismic array;
Implementation of the Traffic Light System (via the surface seismic monitoring array);
Flowback in the case of Amber (0.0 ML) or Red (0.5ML) seismic events between hydraulic fracturing stages in accordance with the Traffic Light System.
L10.2 Mitigation measures – site selection and site characterisation
Review of desk based information L10.2.1
372. Recommendations for future hydraulic fracturing activities include a review of available geological and geophysical data for the Site and the surrounding area to characterise the stratigraphy and structural geology of the area
1,2,3,13,14. This is
required as a first step in order to confirm that hydraulic fracturing does not occur within or close to regional faults
1. Details of the background site characterisation
on the regional geology from publically available sources described above (Section L6) have been used to inform the selection of an appropriate site for shale gas exploration.
373. Following a review of the desk based information it can be seen that a number of regional scale faults have been identified and the location and nature have been considered as part of the site selection process. The following faults have been identified and have been avoided in the site selection process: the Woodsfold Fault, the Larbreck Fault, the Thistleton Fault and the Mid-Elswick Graben Faults (see Figure 5). In the absence in the information to the contrary we have made the conservative assumption that these faults are critically stressed and have been avoided for the purposes of hydraulic fracturing as part of the site selection process.
374. In addition to the review of the regional geology and existing 2D geophysical data, Cuadrilla commissioned a bespoke 3D geophysical (seismic) survey by CCG to investigate subsurface ground conditions. The interpretation of the 3D geophysical (seismic) survey was carried out by Cuadrilla geophysicists. An independent assessment of the data acquisition, processing and interpretation was carried out by Arup’s sub consultant DMT GmbH (see Section L10.2.2 below for further details of this review).
3D geophysical (seismic) survey L10.2.2
375. A 3D geophysical (seismic) survey was recommended by as part of the site characterisation process
2,13
,14. UKOOG
2 suggest that site characterisations could
include desk based studies of existing geological maps, seismic reflection data, background seismicity data from the BGS, i.e. a 3D geophysical (seismic) survey is not a mandatory requirement.

Cuadrilla Bowland Limited Temporary shale gas exploration at Preston New Road Environmental Statement
Draft 3 | 24 May 2014
C:\RICHARD\RICHARD - WORK\JOBS\CUADRILLA\ISSUED DOCUMENTS\PRESTON NEW ROAD\2015-05-29 ES & PL DOCS FINAL\ES VOL 2 FINAL
APPENDICIES\PNR_ES_VOL2_APPNDX L_INDUCED SEISMICITY.DOCX
Page L114
376. The Bowland 3D geophysical (seismic) survey covers an area of approximately 100km² with the objective to image the Carboniferous strata. The survey was carried out in order to investigate the subsurface stratigraphy and geological structure, including faults.
377. The survey was carried out by CGG Veritas between March and June 2012. The survey was originally designed as a vibroseis survey, but due to permit restrictions for vibrator vehicle access to farmland the survey was completed using approximately 91% explosives and 9% vibroseis sources. The time domain data processing was done in CGG Veritas’ UK offices in Crawley between July 2012 and October 2012. Subsequently a prestack depth migration was applied to the data. The processed results were interpreted in-house by Cuadrilla Resources Ltd. and a digital geological model of the layers and faults was constructed.
Data acquisition
378. The assessment of the data acquisition operation is based on the quality assurance report
117 documenting the work of EPI, the consultant overseeing the field work.
The actual layout of source and receiver points was affected by local topographical and permitting constraints and, to compensate for loss of coverage around the larger obstacles, additional source points were placed.
379. Figure 37 below shows the locations of source and receiver stations for the seismic survey. Some data gaps were unavoidable. The data gaps described did not materially affect the quality of the survey at the depth of interest within the Bowland Shale. The following data gaps have been identified:
One location around the town of Kirkham. The data gap affects the result to a maximum travel time of approximately 1,000 ms, corresponding to an estimated maximum depth of 1,800 m; and
Two locations in the vicinity of Kirkham. The data gap affects the result to a maximum travel time of approximately 500 ms, corresponding to an estimated maximum depth of 900m.
117
EPI, (2012), 3D Land Seismic Survey Quality Assurance Report, Report no. 1316, Rev. 1.0.

Cuadrilla Bowland Limited Temporary shale gas exploration at Preston New Road Environmental Statement
Draft 3 | 24 May 2014
C:\RICHARD\RICHARD - WORK\JOBS\CUADRILLA\ISSUED DOCUMENTS\PRESTON NEW ROAD\2015-05-29 ES & PL DOCS FINAL\ES VOL 2 FINAL
APPENDICIES\PNR_ES_VOL2_APPNDX L_INDUCED SEISMICITY.DOCX
Page L115
Figure 37: The location of source and receiver stations for the 3D geophysical (seismic) survey.
Data processing
380. The assessment of the data processing operation was carried out by DMT and is based on the CGG Veritas data processing report
118. The general processing route
used prestack time migration (PreSTM) and is considered to be the industry standard for an initial data processing. The effort taken to obtain best solutions for this particular survey and to document the choice of the workflow appears, to DMT, to be above average for the industry.
381. The choice of parameters tends to be in favour of improved signal to noise ratio, therefore sacrificing resolution along the way. However, the documentation indicates that parameter decisions have been targeted to improve structural interpretability of the results in the Bowland Shale. This is an acceptable method of analysis as it targets one of the key recommendations from DECC
1 to identify
the faults in the vicinity of any hydraulic fracturing operations.
Interpretation for site characterisation
382. Our assessment of the interpretation carried out by Cuadrilla is based on interpreted sections in and around the Site, as presented within Figure 6 to Figure 9 in Section L6.3.
118
CGG Veritas, (2012), Seismic Data Processing Report (Time) for Bowland, Lancashire. 3D
PSTM Onshore, North West UK, (Project Number PE-12-082).
Preston New Road

Cuadrilla Bowland Limited Temporary shale gas exploration at Preston New Road Environmental Statement
Draft 3 | 24 May 2014
C:\RICHARD\RICHARD - WORK\JOBS\CUADRILLA\ISSUED DOCUMENTS\PRESTON NEW ROAD\2015-05-29 ES & PL DOCS FINAL\ES VOL 2 FINAL
APPENDICIES\PNR_ES_VOL2_APPNDX L_INDUCED SEISMICITY.DOCX
Page L116
383. The framework for building the interpretation uses PreSTM and PreSDM processing results, 2D and borehole seismic data, geophysical well log data, and drilled formation tops and is as complete as possible and suitable for reliable correlation of geological interfaces to seismic markers. The generation of synthetic seismograms and 3D derived attributes as aids for the interpretation process conforms to the exploration industry’s best practices.
384. The interpreted sections show three horizons, namely Variscan, Upper Bowland, and Lower Bowland. The seismic result used is the prestack depth migration.
385. The Cuadrilla interpretation is likely to reasonably reflect the local geological situation based on other publically available information including the peer reviewed technical journal and conference papers as well as the local and regional geological memoirs produced by the British Geological Survey. It should be noted that the Grange Hill, Preese Hall, Thistleton and Elswick boreholes located within the same region were used to verify the geophysical interpretation.
386. The independent review carried out by Arup / DMT identified and confirmed the presence of ‘local’ faults located within the Lower Bowland shale along the path of and nearby the proposed horizontal wells as interpreted and recorded by Cuadrilla.
387. Regional scale faults have been identified in the 3D geophysical (seismic) survey carried out by Cuadrilla. The Preston New Road vertical and horizontal wells do not cross regional faults. However, a small scale local fault has been identified by the 3D geophysical (seismic) survey extending through the Upper and Lower Bowland Shales and the vertical and horizontal wells are likely to intersect this fault.
388. Depending upon the results of the drilling and the initial testing of the vertical well there is the potential that Cuadrilla will hydraulically fracture within the vicinity of this local fault. However, the risks of induced seismicity will be effectively controlled by the embedded mitigation measures described within the section.
Faults and hydraulic fracturing L10.2.3
The 3D geophysical (seismic) survey has identified faults within the Site, as such the following section describes the approach to faulting and hydraulic fracturing. The following are specific recommendations regarding hydraulic fracturing near known (and unknown) faults:
UKOOG2, recommends:
o “The risks of fault movement can be mitigated by the identification of stressed faults and where practicable, by the avoidance of fracturing fluids entering stressed faults”;
o “Operators should carry out site-specific surveys prior to hydraulic fracturing to characterise local stresses and identify nearby faults”; and
o “Operators should not overlook the potential presence of faults that cannot be detected” in the vicinity of the proposed hydraulic fracturing.
The Royal Society and The Royal Academy of Engineering14
recommends “Hydraulic fracturing near a fault with a high slip tendency should be avoided”.

Cuadrilla Bowland Limited Temporary shale gas exploration at Preston New Road Environmental Statement
Draft 3 | 24 May 2014
C:\RICHARD\RICHARD - WORK\JOBS\CUADRILLA\ISSUED DOCUMENTS\PRESTON NEW ROAD\2015-05-29 ES & PL DOCS FINAL\ES VOL 2 FINAL
APPENDICIES\PNR_ES_VOL2_APPNDX L_INDUCED SEISMICITY.DOCX
Page L117
Green et al (2012)13
recommends the “Characterisation of any possible active faults in the region using all available geological and geophysical data”.
DECC1 recommends to “review the available information on faults in the area
of the well to confirm that wells are not drilled into, or close to, existing faults which could provide the mechanism for [inducing] an earthquake”.
389. The British Standard definition (BS5930119
) states that a fault is; “A fracture or fracture zone along which there has been recognisable displacement”. Faults can be large and regional in scale extending for many 100’s of kilometres in plan with throws of many 100’s of meters, or they can be very small with lengths of a few centimetres and throws of a few millimetres. The British Standard definition of faults therefore includes millimetre scale movements over centimetre scale areas. This small scale of faulting is pervasive in every rock type (and some soils), and is ubiquitous in the Bowland Basin (as it is in all rock formations all over the world).
390. We propose the following definition of faulting in the context of the hydraulic fracturing in the Bowland Basin:
A regional fault is here defined as fault identified by the British Geological Survey and presented on their 1:50,000 scale mapping; and
A small scale fault is here defined as fault not identified by the British Geological Survey or presented on their 1:50,000 scale mapping and generally confined to a single group of rocks i.e. intra-system/period for example predominately within the Carboniferous. A small scale fault may be visible on a site specific 3D geophysical (seismic) survey depending on the quality of the survey data and level of interpretation.
391. It is, therefore, impossible to avoid small scale potentially critically stressed faulting in the planning of exploratory and production wells. A small scale local fault has been identified near the Site, see Figure 6, and has not been identified on BGS maps. The risk of induced seismicity associated with these small scale faults is mitigated using the measures described within this section.
392. The methodology proposed to manage hydraulic fracturing operations in the vicinity of regional faults is discussed within Section L10.5.
Conclusion L10.2.4
393. The location of the site selected by Cuadrilla to construct the vertical and horizontal well has taken into account the geological and structural conditions in the region and the vertical well and the horizontal wells have been located in the most favourable ground conditions to minimise the risk of felt induced seismicity from shale gas exploration operations.
L10.3 Mitigation measures – risk based geomechanical assessment
394. As recommended by UKOOG2 for future hydraulic fracturing activities, operators
should implement a risk based approach to demonstrate that adequate controls are in place to reduce the risk magnitude of induced seismicity. This requires a detailed understanding of the geological structures within the vicinity of the Site
119
British Standards Institution. BS 5930: 1999. Code of Practice for Site Investigations

Cuadrilla Bowland Limited Temporary shale gas exploration at Preston New Road Environmental Statement
Draft 3 | 24 May 2014
C:\RICHARD\RICHARD - WORK\JOBS\CUADRILLA\ISSUED DOCUMENTS\PRESTON NEW ROAD\2015-05-29 ES & PL DOCS FINAL\ES VOL 2 FINAL
APPENDICIES\PNR_ES_VOL2_APPNDX L_INDUCED SEISMICITY.DOCX
Page L118
at reservoir level, including fault geometry and activity. An understanding of the geomechanical properties of the rock is also required along with the regional stress regime. This information can be used to determine the likely maximum magnitude of induced seismicity for a given injection volume and subsequently to demonstrate that the controls implemented will reduce maximum magnitudes to acceptable levels, hence reducing the risk magnitude of induced seismicity.
395. De Pater and Baisch (2011)4 concluded that a 3.1 ML induced seismic event is the
largest that could occur for an injection volume similar to that used during the second stage at Preese Hall-1 (i.e. 2,245m
3).
396. A review of the geological structures in the vicinity of the Site was also undertaken as part of this assessment on the basis of Cuadrilla’s interpretation of the 3D geophysical (seismic) survey (and confirmed by Arup and DMT). This assessment also considered the existing stress regime, level of natural seismicity and the geomechanical properties of the rock to critically assess the study by De Pater and Baisch (2011)
4. Arup and DMT concluded that the estimate of
maximum magnitude of 3.1 ML by De Pater and Baisch (2011)1 is reasonable.
397. To assess the effects of induced seismicity and hence the risk magnitude, it was considered that all faults are ‘critically stressed’. This has been assumed for the assessment due to it being a worst case scenario. However in reality not all faults will be critically stressed, therefore prior to the submission of the HFP work will be carried out to understand whether nearby faults are indeed critically stressed or not. The findings of this study will be presented within the HFP that is required to be authorised by DECC before hydraulic fracturing can commence in accordance with the recommendations on the HFP
22.
398. In view of the assumption above that all faults are critically stressed, it was considered that the approach to hydraulic fracturing would ensure that the offset distance from the location of a hydraulic fracture stage and a regional fault will be two times the anticipated fracture length (anticipated fracture length may vary during the lifetime of the Project depending on the Project phase and associated proposed injection volumes).
399. On this basis a 1.5 ML induced seismic event is considered to be the maximum magnitude event that could occur given the embedded mitigation measures that will be in place.
L10.4 Mitigation measures – baseline seismic monitoring
400. An important part recommended mitigation measure is to establish the background levels of induced and natural seismicity around the Site. In conjunction with Green et al. (2012)
13 and Royal Society and Royal Academy of
Engineering14
, DECC1 recommend that “Background seismicity will then be
monitored for a period of several weeks before hydraulic fracturing operations commence to provide a baseline against which activity detected during and after fracturing operations can be compared”. This is required to establish background levels of natural and induced seismicity and will be carried out for a period of at least 4 weeks prior to commencing hydraulic fracturing. Cuadrilla is proposing to install a surface array comprising eight stations buried at c.0.8m BGL and positioned to create a series of offset triangles, see Figure 18.

Cuadrilla Bowland Limited Temporary shale gas exploration at Preston New Road Environmental Statement
Draft 3 | 24 May 2014
C:\RICHARD\RICHARD - WORK\JOBS\CUADRILLA\ISSUED DOCUMENTS\PRESTON NEW ROAD\2015-05-29 ES & PL DOCS FINAL\ES VOL 2 FINAL
APPENDICIES\PNR_ES_VOL2_APPNDX L_INDUCED SEISMICITY.DOCX
Page L119
401. It is proposed that the seismic data collected during the 4 week monitoring period will be supplemented by the seismic data collected by the BGS network of seismographs. This data is collected continuously and transmitted for real-time processing and analysis. This will enhance the understanding of background seismicity.
402. Seismic monitoring will also occur during and after hydraulic fracturing activities in accordance with the description provided in the section on the ‘Traffic Light System’ and the ‘Summary of instrumentation’ below.
403. An independent assessment of the baseline monitoring proposal has been carried out by DMT GmbH & Co. KG (DMT), Germany and it has concluded the quantity and location of the proposed array is satisfactory for the Project.
L10.5 Mitigation measures - fracture evolution and operational mitigation
404. A key recommendation by UKOOG2 and the Secretary of State for Energy and
Climate Change3 is to implement an “evolutionary approach to risk assessment
and mitigation”2 and to undertake a “more cautious…and progressive”
3 approach
to operations. This will enable operators to develop and understanding of the geomechanical response of the rock in relation to induced seismicity.
405. It is considered important to note that the purpose of hydraulic fracturing is to create very closely spaced network of fractures adjacent to the well in order to collect gas from the shale reservoir. The purpose of hydraulic fracturing is not to create a few large fractures that extend over long distances, vertically or horizontally.
406. In order to achieve these objectives and reduce the risk magnitude associated with induced seismicity Cuadrilla will monitor the location, orientation and extent of induced fractures to ensure that hydraulic fracturing does not occur within the vicinity of regional faults. The proposed offset distance from the location of a hydraulic fracture stage and a regional fault is two times the anticipated fracture length. The anticipated fracture length may vary during the lifetime of the Project depending on the Project phase and associated proposed injection volumes.
407. The HFP, that will be authorised by DECC, will describe the methodology to be carried out during hydraulic fracturing to ensure that hydraulic fractures do not interact with regional faults. In accordance with the recommendations described above, this methodology will consist of a stepped progressive process that uses various techniques such as a mini-fracture stage prior to the initial hydraulic fracturing stage (and as deemed necessary by Cuadrilla), increasing pumped volumes of hydraulic fracturing fluids and microseismic monitoring to understand the performance of the reservoir during hydraulic fracturing (these operational mitigations are discussed further in the sections on ‘Mini-fractures’ and ‘Reduced injection volumes’ below). This will enable Cuadrilla to adjust the hydraulic fracturing operations to achieve the objectives described above and design future hydraulic fractures stages. This can be summarised by the following points:
1. During initial drilling operations and mini-fracture stage Cuadrilla will collect data pertinent to informing the design of the hydraulic fracture model;

Cuadrilla Bowland Limited Temporary shale gas exploration at Preston New Road Environmental Statement
Draft 3 | 24 May 2014
C:\RICHARD\RICHARD - WORK\JOBS\CUADRILLA\ISSUED DOCUMENTS\PRESTON NEW ROAD\2015-05-29 ES & PL DOCS FINAL\ES VOL 2 FINAL
APPENDICIES\PNR_ES_VOL2_APPNDX L_INDUCED SEISMICITY.DOCX
Page L120
2. The model will be used to define the initial hydraulic fracture stage which will be designed to initiate a conservative hydraulic fracture growth approximately equal to one third to one half of the maximum stage size as authorised by DECC;
3. The orientation and extent of hydraulic fracturing will be monitored in real time during and after stages to evaluate the model and ensure the hydraulic fracture performance is within the design objectives;
4. This iterative process will allow the performance of the previous hydraulic fracture stage to be used to design the next hydraulic fracture stage to ensure the design objectives are maintained.
408. The maximum injection volume for each hydraulic fracture stage is 750m3. This is
half of the average per stage injection volume used at Preese Hall. Preliminary models based on the fracture stages at Preese Hall-1 indicate the likely predicted length of fracture growth from the well to be between approximately 50m and 150m
52 (the variation is dependent on geomechanical properties of the reservoir
rock and the volume of fracture fluid injected).
409. Cuadrilla are anticipating that the horizontal well bore, or the area intended to be hydraulically stimulated, will encounter a number of small scale faults. Each hydraulic fracture stage will be monitored in real time during and after each hydraulic fracture stage to measure the location, orientation and extent of microseismic activity. If the monitoring indicates that a fault may be reacting to the hydraulic fracturing and showing signs of producing a seismic event greater than or equal to 0.5ML, then the pumping parameters may be amended (which are constantly monitored) or hydraulic fracture stage will be terminated early.
Mitigation measures – mini-fracture L10.5.1
410. An important mitigation measure to reduce the risk of induced seismicity is to carry out a mini-fracture stage prior to the initial main hydraulic fracture stage in any one formation
2,13,14. The Royal Society and The Royal Academy of
Engineering14
quoting API (2009)120
note that “The fracture behaviour of a particular formation is commonly characterised using small pre-fracturing injection tests with microseismic monitoring. Subsequent operations can then be modified accordingly”.
During initial drilling operations and mini-fracture stage Cuadrilla will collect data pertinent to informing the design of subsequent hydraulic fracturing stages. The exact nature and extent of the mini-fracture stage will be provided in the HFP.
Mitigation measures - reduced injection volumes per L10.5.2
stage compared to Preese Hall
411. One of the most significant mitigation measures against future induced seismic events is to reduce the volumes of hydraulic fracturing fluids for each hydraulic fracturing event
1,13
. Green et al. (2012)13
states “Seismicity can be mitigated by modifying (the) job procedure, principally by reducing injected volume (followed by) rapid flowback”. The Royal Society and The Royal Academy of Engineering
14
120
American Petroleum Industry, API. (2009). Hydraulic fracturing operations: well construction
and integrity guidelines, API guidance document HF1, American Petroleum Institute: Washington
DC.

Cuadrilla Bowland Limited Temporary shale gas exploration at Preston New Road Environmental Statement
Draft 3 | 24 May 2014
C:\RICHARD\RICHARD - WORK\JOBS\CUADRILLA\ISSUED DOCUMENTS\PRESTON NEW ROAD\2015-05-29 ES & PL DOCS FINAL\ES VOL 2 FINAL
APPENDICIES\PNR_ES_VOL2_APPNDX L_INDUCED SEISMICITY.DOCX
Page L121
quoting de Pater and Baisch (2011)4 note that “seismicity was only induced
following hydraulic fracturing stages where larger volumes of fluid were injected and/or where there was little or no flowback of fluids.”
412. McGarr (1976)121
and more recently McGarr (2014)122
was able to demonstrate there is a relationship between injection volumes and induced seismicity, and calculated the total released seismic moment resulting from volume change by multiplication of the shear modulus of the rock, the change in volume and a geometric factor which is usually close to 1.
413. The quantities of water to be injected are likely to be in the order of 15m3 for the
mini-fracture stage and up to 750m3 per main hydraulic fracture stage. This
compares to Preese Hall where the largest fracture and mini-fracture stage was 2,245m
3 and a per stage average of 1,672m
3.The planned quantities of fracture
fluids to be injected and the number of hydraulic fractures stages will be provided in the HFP.
L10.6 Mitigation measures - microseismic monitoring of fracture growth
414. An important part of the mitigation measures is to be able to locate the induced fractures and measure the extent of their growth during hydraulic fracturing at the Preston New Road site. The DECC
1, Green et al. (2012)
13 and Royal Society and
Royal Academy of Engineering report14
recommend that a “Until the characteristics of fracking in a particular formation are well established, in addition to the real time monitoring described above, … a permanent buried seismometer system will record the usual microseismic events (of magnitude much less than 0.5 ML) that accompany all fracking activity. These can be used to establish exactly how far the fractures penetrate into the surrounding rock. This will allow the effectiveness of the fracture to be evaluated but also ensure that the size is as predicted and that the fracture has not extended further than planned, e.g., toward any near surface fresh water aquifer”.
415. Cuadrilla are proposing to install a buried microseismic array composed of approximately 10 real time buried monitoring locations seismometers and 70 storage and harvest buried monitoring locations, buried at a depth at a depth of up to 100m. Burial limits the masking effects of the local anthropogenically produced vibrations e.g. wind, vehicle and train movements, construction activities etc. Data from the 10 real time buried monitoring stations will be linked to hydraulic fracturing operations in order to monitor fracture growth.
416. Cuadrilla will monitor the location, orientation and extent of induced fractures to ensure that hydraulic fracturing does not occur within the vicinity of regional faults, near surface groundwater resources and other underground receptors.
417. The HFP that will be authorised by DECC22
, describes the methodology to be carried out during hydraulic fracturing, This consists of stepped progressive process that uses various techniques such as mini fractures, variable pumped
121
McGarr, A. (1976). Seismic moments and volume changes. Journal of Geophysical Research.
Vol 81, pp.1487-1494. 122
McGarr, A. (2014). Maximum magnitude earthquakes induced by fluid injection. Journal of
Geophysical Research: Solid Earth. Vol. 119.

Cuadrilla Bowland Limited Temporary shale gas exploration at Preston New Road Environmental Statement
Draft 3 | 24 May 2014
C:\RICHARD\RICHARD - WORK\JOBS\CUADRILLA\ISSUED DOCUMENTS\PRESTON NEW ROAD\2015-05-29 ES & PL DOCS FINAL\ES VOL 2 FINAL
APPENDICIES\PNR_ES_VOL2_APPNDX L_INDUCED SEISMICITY.DOCX
Page L122
volumes of hydraulic fracturing fluids and microseismic monitoring to understand the performance of the reservoir during hydraulic fracturing.
418. The progressive program of increasing pumped volumes will allow Cuadrilla to model fracture growth during successive stages. Monitoring of fracture growth will allow Cuadrilla to validate the model and manage fracture growth by adjusting future hydraulic fracturing operations to ensure hydraulic fractures do not propagate to within the vicinity of regional faults.
419. It should be noted that during hydraulic fracture operations the 80 buried array stations will need to be visited weekly to change batteries. The buried array stations will contain 3 instruments which will include either single component geophones or a 3 component seismometer and single component geophones.
420. An independent assessment of the proposed buried array has been carried out by DMT GmbH & Co. KG (DMT), Germany and it has concluded that the quantity and location of the proposed buried array is satisfactory for the Project.
L10.7 Mitigation measures – Traffic Light System during hydraulic fracturing (pumping)
421. A Traffic Light System (TLS) is the recommended tool to manage the potential for induced seismicity due to hydraulic fracturing during hydraulic injection (pumping). Cuadrilla will implement a TLS, using the trigger levels for green, amber and red events defined by DECC, see Figure 38 and Figure 39.
422. The DECC1, Green et al. (2012)
13 and Royal Society and Royal Academy of
Engineering report14
recommend that “Once fracking commences, “real time” seismic monitoring will be used to operate a “traffic-light” warning protocol under which operations will be halted and pressures immediately reduced if a seismic event of magnitude greater than 0.5 ML is detected”.
423. The seismic array responsible for implementing the TLS consists of eight seismometer stations at ground surface as part of the surface array. The instruments measure ground vibrations. All stations will be installed prior to the first hydraulic fracturing operation in order to allow for background noise monitoring over a period of 4 weeks and subsequent data interpretation. Details of the equipment, processing and operation of the TLS are described in Section L10.8 below.
424. The TLS will be implemented for hydraulic fracturing monitoring of seismic activity. During hydraulic fracturing monitoring, data is transmitted in real-time to the data centre located at the Site. The Seismic Monitoring (TLS) Contractor will inform the operator’s On-site Fracturing Supervisor immediately in the event that an Amber or Red TLS event has occurred. Seismic real-time monitoring will be documented in daily reports (during hydraulic fracturing activities) and submitted to DECC.
425. Hydraulic fracturing monitoring will be implemented as part of the TLS under the regime summarised within Section L10.7.1 to Section L10.7.3 and Figure 38 and Figure 39 below.
426. Cuadrilla will supply a daily update on the observed seismicity on their website. The result presented on the website will provide information on the number of events if amber or red.

Cuadrilla Bowland Limited Temporary shale gas exploration at Preston New Road Environmental Statement
Draft 3 | 24 May 2014
C:\RICHARD\RICHARD - WORK\JOBS\CUADRILLA\ISSUED DOCUMENTS\PRESTON NEW ROAD\2015-05-29 ES & PL DOCS FINAL\ES VOL 2 FINAL
APPENDICIES\PNR_ES_VOL2_APPNDX L_INDUCED SEISMICITY.DOCX
Page L123
427. An independent assessment of the proposed Traffic Light System has been carried out by DMT GmbH & Co. KG (DMT), Germany and it has concluded that the quantity and location of the proposed surface array is satisfactory for the Project and provides redundancy.
Green level: <0 ML L10.7.1
428. As long as the induced seismicity is <0ML while pumping operations will continue in line with the HFP. Cuadrilla will submit daily reports promptly to DECC.
Amber level: 0 ML to < 0.5 ML L10.7.2
429. If an event occurs in the amber range while pumping the fracture stage can be completed. On completion of the injection the flowback procedure will be initiated, see Table 25 for details. Cuadrilla will submit daily reports to DECC, including characterisation and location of seismic events.
430. Cuadrilla will assess the microseismic and hydraulic fracturing data and inform DECC on the following future operations:
Post injection seismic monitoring period;
Flowback period.
431. The original HFP may proceed with caution, possibly at reduced parameters.
Red level: >0.5 ML L10.7.3
432. If an event occurs in the red range while pumping the fracture stage will be aborted and the flowback procedure will be initiated, see Table 25 for details. Cuadrilla will submit daily reports to DECC, including characterisation and location of seismic events.
433. Cuadrilla will assess the microseismic and hydraulic fracturing data and recommend to DECC on the following future operations:
Post injection seismic monitoring period;
Flowback period;
Cuadrilla will commence discussions with DECC regarding methodology for continuation or termination of hydraulic fracturing operations.

Cuadrilla Bowland Limited Temporary shale gas exploration at Preston New Road Environmental Statement
Draft 3 | 24 May 2014
C:\RICHARD\RICHARD - WORK\JOBS\CUADRILLA\ISSUED DOCUMENTS\PRESTON NEW ROAD\2015-05-29 ES & PL DOCS FINAL\ES VOL 2 FINAL APPENDICIES\PNR_ES_VOL2_APPNDX L_INDUCED SEISMICITY.DOCX
Page L124
Figure 38: DECC infographic showing the Traffic Light Sytem1
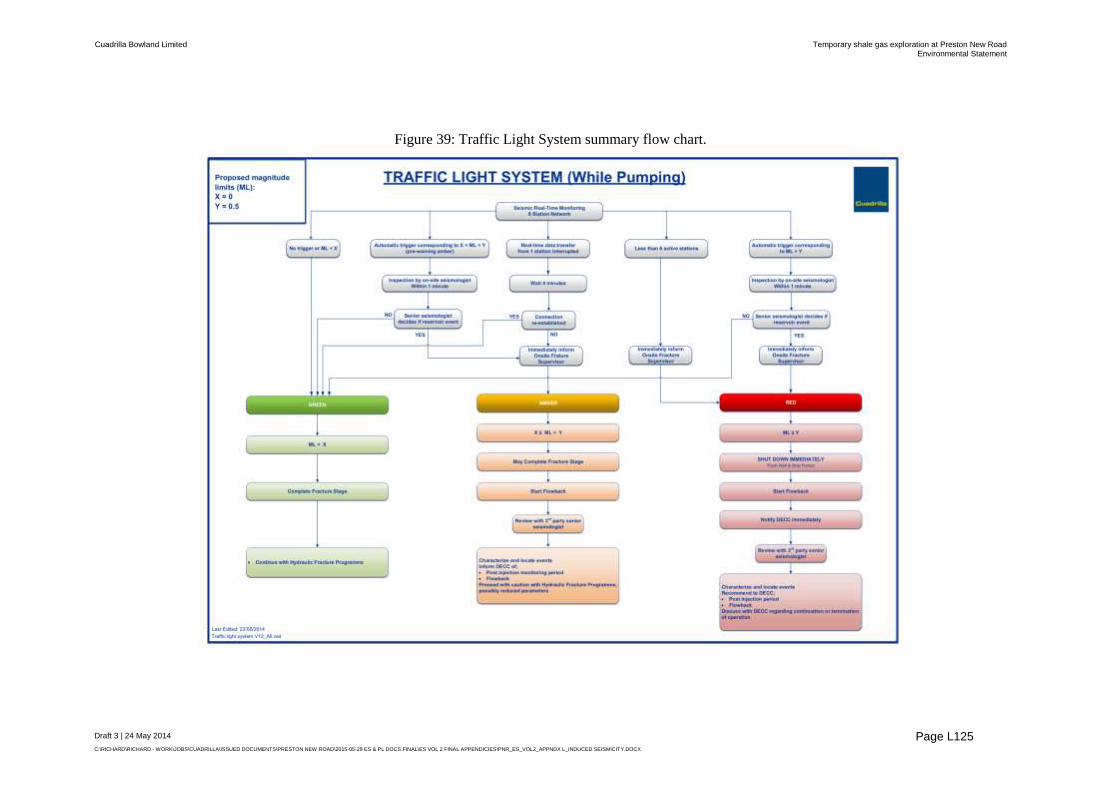
Cuadrilla Bowland Limited Temporary shale gas exploration at Preston New Road Environmental Statement
Draft 3 | 24 May 2014
C:\RICHARD\RICHARD - WORK\JOBS\CUADRILLA\ISSUED DOCUMENTS\PRESTON NEW ROAD\2015-05-29 ES & PL DOCS FINAL\ES VOL 2 FINAL APPENDICIES\PNR_ES_VOL2_APPNDX L_INDUCED SEISMICITY.DOCX
Page L125
Figure 39: Traffic Light System summary flow chart.

Cuadrilla Bowland Limited Temporary shale gas exploration at Preston New Road Environmental Statement
Draft 3 | 24 May 2014
C:\RICHARD\RICHARD - WORK\JOBS\CUADRILLA\ISSUED DOCUMENTS\PRESTON NEW ROAD\2015-05-29 ES & PL DOCS FINAL\ES VOL 2 FINAL
APPENDICIES\PNR_ES_VOL2_APPNDX L_INDUCED SEISMICITY.DOCX
Page L126
Flowback L10.7.4
434. A significant mitigation measure that will be employed at the Site to mitigate future induced seismic events is to ‘flowback’ in the case of Amber or Red seismic events, between hydraulic fracturing stages. As recommended by DECC
1,
flowback is the process whereby the hydraulic fracturing fluid is allowed to flowback up the well to the surface containment system after the hydraulic fracturing stage to minimise the build-up of fluid pressure within the formation. The disposal of flowback fluid is discussed in Chapter 17 Resources and Waste. It is estimated by Cuadrilla that 15-25% of hydraulic fracturing fluid returns to the surface during initial flowback. The quantity of flowback fluid returned during all testing is estimated at 40%
435. Once a TLS Amber or Red alert has been initiated, the geophysicist will inform the On-site Fracturing Supervisor immediately. A dedicated communication link between the Onsite Seismologist and the On-site Fracturing Supervisor will be available.
436. Once the On-site Fracturing Supervisor has been informed that a positive Red level event has occurred they will initiate shut down and flowback procedure as described in Table.
Table 25: Flowback procedure in the event of an Amber or Red TLS event.
If there is no proppant in the wellbore or in the near wellbore:
Stop pumping operations and switch over to flowback. It is estimated to take 5
minutes to initiate flowback.
If there is proppant in the wellbore or in the near well bore:
Continue pumping with a non-proppant flush sufficient to over displace the well
bore volume by 15m3 into the formation
Stop pumping operations and switch over to flowback. It is estimated to take 5
minutes to initiate flowback.
The length of the flowback will be determined by the Operator and DECC
L10.8 Instrumentation
437. The 8 surface instruments of the surface array that facilitates the TLS will record induced and natural seismicity to provide a baseline of background seismicity for the site. The seismicity will be recorded for at least 4 weeks prior to commencement of hydraulic fracture operations and downloaded for analysis and interpretation. The surface array will be installed just below the ground surface (approximately 0.8m).
438. Cuadrilla are proposing to install a buried microseismic array composed of approximately 10 real time geophones linked to a central monitoring station on the site to monitor fracture growth during the hydraulic fracturing operations.
439. It is noted that in addition to the 10 real time monitoring stations Cuadrilla will also install 70 store and harvest stations to monitor seismicity before, during and after hydraulic fracturing. The data from the stations will be retrieved and

Cuadrilla Bowland Limited Temporary shale gas exploration at Preston New Road Environmental Statement
Draft 3 | 24 May 2014
C:\RICHARD\RICHARD - WORK\JOBS\CUADRILLA\ISSUED DOCUMENTS\PRESTON NEW ROAD\2015-05-29 ES & PL DOCS FINAL\ES VOL 2 FINAL
APPENDICIES\PNR_ES_VOL2_APPNDX L_INDUCED SEISMICITY.DOCX
Page L127
analysed on a daily basis during hydraulic stimulation operations. This buried array will be installed in boreholes up 100m below ground level.
Monitoring system – surface array L10.8.1
Traffic Light System – equipment
440. The description of the equipment presented below has been prepared by Cuadrilla and their specialist seismological consultants Qcon GmbH of Germany. The surface array for the purposes of implementing the TLS consists of 8 seismometer stations. Each station is equipped with a 3-component surface seismometer and data logger. All seismometers have been calibrated individually by the manufacturer. The stations will be at ground surface (or buried to approximately 0.8mBGL).
441. The instruments measure ground vibrations (thus peak particle velocity (PPV) is measured directly) and all recordings are GPS time stamped. The sampling frequency is 200 Hz and the time-continuous data recordings are stored locally. In parallel, the time-continuous data is transferred by cell phone modem to a data centre. During real-time monitoring operations, the data centre is located at the Site. An independent back-up copy of all data will exist.
442. The instrumental noise level is approximately 15 nm/s (rms), which is about two orders of magnitude below the (expected) seismic background noise level. Consequently, the sensitivity of the recording instruments (the detection threshold) is solely determined by the seismic background noise level.
443. The stations are designed to be completely independent, low maintenance units and usually need to be visited only for exchanging batteries and/or data read-out after offline monitoring.
444. The equipment for the surface instruments in the surface array will be contained with an equipment box with the seismometer installed at around 0.8m depth approximately 1.2m away from the equipment box, see Figure 40 and Figure 41 below.
Figure 40: Schematic of Traffic light monitoring equipment (© Qcon)
Figure 41: Photograph of Traffic light monitoring equipment (© Qcon)

Cuadrilla Bowland Limited Temporary shale gas exploration at Preston New Road Environmental Statement
Draft 3 | 24 May 2014
C:\RICHARD\RICHARD - WORK\JOBS\CUADRILLA\ISSUED DOCUMENTS\PRESTON NEW ROAD\2015-05-29 ES & PL DOCS FINAL\ES VOL 2 FINAL
APPENDICIES\PNR_ES_VOL2_APPNDX L_INDUCED SEISMICITY.DOCX
Page L128
Site selection criteria
445. Appropriate site selection for the seismic instruments is of key importance. For this, potential seismometer locations have been identified based on satellite images. Candidate locations fulfil the following requirements:
Avoidance of sources of cultural seismic noise (e.g. railway, main roads, industrial facilities);
Avoidance of sources of natural noise (e.g. trees, rivers, sea, wildlife);
Avoidance of sources of electrical signals (e.g. power lines, transmission towers);
Avoidance of areas prone to flooding;
Avoidance of areas considered unsuitable for founding instruments (i.e. ground too soft to support foundation for instrument and housing); and
Avoidance of environmentally sensitive areas.
446. Following the review of the above site selection criteria, 8 potential sites have been identified and noise monitoring has been carried as described in Section L6.7.2. Station locations are presented in Figure 18. The station at I03 exceeded the threshold of 2000nm/s due most likely to the proximity of busy roads, urban noise and traffic. As a result Cuadrilla will be assessing the two additional locations to ensure that the station location is not affected by signals above the 2,000 nm/s noise threshold. At the time of writing this had not been carried out.
447. All stations will be installed to provide at least 4 weeks of baseline monitoring prior to the first hydraulic fracturing operation. These stations may remain for the lifetime of the Project.
Traffic Light System – event detection
448. Proper functioning of the seismic stations is confirmed on a continuous basis by remote administration.
449. The description of processing presented below has been prepared by Cuadrilla and their specialist seismological consultants Q-con GmbH of Germany.
450. All data processing will be performed by an experienced suitably qualified seismologist. The proposed automatic processing steps can be summarized as follows:
Event detection: a coincidence-based detector will be operated on the time-continuous data stream, which requires a positive detection on 6 out of 8 of the vertical trigger channels. An amplitude threshold based trigger will be set at 9,000 nm/s (approximately 0 ML – 0km epicentral distance and 2.2km hypocentre) in combination with an STA/LTA- trigger. This trigger design ensures that reservoir events with magnitude ≥0 ML are always detected. At the same time, the STA/LTA trigger can be sensitive to much smaller magnitudes (i.e. <-0.5 ML) depending on the time-dependent noise conditions.
After positive event detection, P- and S-phase onsets are automatically determined. The underlying signal processing combines a number of best-in-

Cuadrilla Bowland Limited Temporary shale gas exploration at Preston New Road Environmental Statement
Draft 3 | 24 May 2014
C:\RICHARD\RICHARD - WORK\JOBS\CUADRILLA\ISSUED DOCUMENTS\PRESTON NEW ROAD\2015-05-29 ES & PL DOCS FINAL\ES VOL 2 FINAL
APPENDICIES\PNR_ES_VOL2_APPNDX L_INDUCED SEISMICITY.DOCX
Page L129
class algorithms (e.g. waveform polarity filtering, error-prediction filtering, higher order statistic, genetic algorithms and others) and has been successfully tested with the most challenging data sets.
The hypocentre location of the event will be determined with a linearized inversion algorithm. The confidence limits of the hypocentre location will be determined.
The magnitude (ML) of the event will be determined using the Richter magnitude scale (which is also being used by BGS). If hypocentre location errors exceed the pre-defined threshold value of 300m laterally and/or vertically, the (preliminary) event magnitude will be determined by assuming that the event has occurred at the flow exit.
The traffic light system will be updated. In case of threshold exceedance, audible and visual warnings are activated.
451. In parallel to the automatic processing, a qualified field seismologist will be quality controlling the automatic processing results. The quality control comprises the following steps:
Supervising SOH (state of health) of all stations; in the unlikely event of technical failure of several stations (i.e. when data from less than 6 seismic stations is available, which will be the minimum number of stations for operating the TLS), the seismologist immediately informs the On-site Fracturing Supervisor to stop the operations (TLS red).
Inspecting time continuous data stream and the performance of the event trigger.
Reviewing all automatically determined phase onset times and adjusting them if required; updating hypocentre and magnitude determination and TLS control.
Identifying noise detections (false detections); due to their waveform characteristics, false triggers can be immediately distinguished from reservoir events. It should be noted, however, that a natural earthquake occurring close to the reservoir cannot be distinguished from an induced earthquake as the underlying physical deformation mechanisms are the same. Due to the extremely low seismicity rate in the Site, the occurrence probability of natural seismicity is very low. This will be further confirmed as part of the pre-hydraulic fracture monitoring.
452. The processing results are summarised in a detailed report which is delivered to Cuadrilla.
453. The magnitude and hypocentre location of the event, as well as the TLS status, are reported within one to three minutes after the event has occurred. A delay of three minutes is only expected in the case of a poor data transmission due to weak cell phone coverage. The determination by the onsite seismologist to check if the event is real is included within the one to three minutes.
454. Seismic real-time monitoring will be documented in daily reports covering a 24 hour data recording period. Daily reports will be sent from the field seismologist to Cuadrilla. The daily reports will document the state of health of the monitoring

Cuadrilla Bowland Limited Temporary shale gas exploration at Preston New Road Environmental Statement
Draft 3 | 24 May 2014
C:\RICHARD\RICHARD - WORK\JOBS\CUADRILLA\ISSUED DOCUMENTS\PRESTON NEW ROAD\2015-05-29 ES & PL DOCS FINAL\ES VOL 2 FINAL
APPENDICIES\PNR_ES_VOL2_APPNDX L_INDUCED SEISMICITY.DOCX
Page L130
stations, measured PPV at all stations, seismic event detections, event magnitudes, hypocentre locations and TLS incidents including false alarms.
L10.9 Summary of seismic monitoring system
455. There are two different types of seismic monitoring arrays proposed at the Site. These arrays are capable of measuring various aspects of seismicity and are being considered for different purposes in line with the recommendations above. Table 26 below summarises the proposed arrays and the reasons for their installation.
Table 26: Summary of seismic monitoring arrays proposed at the Site.
Array Quantity and Depth Purpose
Surface array 8 number surface instruments buried at c.0.8m BGL.
Monitoring background levels of natural and induced seismicity;
Real time monitoring for the TLS.
Will assess:
Location of induced seismicity;
Magnitude of induced seismicity.
Real time buried array Approximately 10 stations buried up to 100m BGL.
Monitoring real time fracture growth;
Will assess:
Location of induced seismicity;
Magnitude of induced seismicity;
Extent of fracture growth; and
Orientation of fracture growth.
Stored and harvest buried array
Approximately 70 stations buried up to 100m BGL.
Monitoring fracture growth;
Informing design of future hydraulic fracturing stages;
Will assess:
Location of induced seismicity;
Magnitude of induced seismicity;
Extent of fracture growth; and
Orientation of fracture growth.
L10.10 Alternatives to the Traffic Light System thresholds
456. There is some debate even within the reports listed in Section L10.1 above whether a ‘magnitude-based’ Traffic Light System is most appropriate for hydraulic fracturing because the magnitude of the induced seismic event does not necessarily control damage; “a small event close to a structure can be just as disruptive in terms of vibration as a large event further away” (Majer et al. 2008 in The Royal Society and The Royal Academy of Engineering report
14). An
alternative approach would be to require the shale gas industries to comply with the same stringent requirements as other construction industries (e.g. quarrying), that are regulated by maximum allowable vibration levels at controlling sensitive structure locations.
457. Whilst the geomechanics of the Bowland Shale is being better defined during the exploration phase, the Traffic Light System offers a robust system for the limitation of induced seismic events. The Traffic light system is generally stricter than the stringent requirements of the construction industries as the Traffic Light

Cuadrilla Bowland Limited Temporary shale gas exploration at Preston New Road Environmental Statement
Draft 3 | 24 May 2014
C:\RICHARD\RICHARD - WORK\JOBS\CUADRILLA\ISSUED DOCUMENTS\PRESTON NEW ROAD\2015-05-29 ES & PL DOCS FINAL\ES VOL 2 FINAL
APPENDICIES\PNR_ES_VOL2_APPNDX L_INDUCED SEISMICITY.DOCX
Page L131
System limits potential vibrations to the limit of human perception rather than to prevent damage to structures or property. In addition the duration of vibrations from induced seismic events are shorter (seconds) than the vibration periods for the construction industry that can last days.
458. It should be noted that the TLS required for hydraulic fracturing in the UK is significantly more stringent than the maximum ‘allowed’ induced seismic event for other hydrocarbon industries in the UK such as coal mining where magnitude >3.0ML events have been observed
81.
459. In addition, the TLS for hydraulic fracturing in the UK is significantly more stringent than required globally for similar activities, see the examples below:
Example 1: The traffic light system for the natural gas storage field in Bergemeer, Holland has the induced seismicity red trigger level set at magnitude 3.5 ML
123.
Example 2: The US DoE protocol15
has its’ amber level set at the level of shaking detectable by humans (1.5 ML) and the red trigger level is set at the level where ground shaking could damage buildings in the area. Based on the more stringent DIN4150 code, Baisch & Vörös (2011)
79 suggest that the red
trigger level should be set at 1.7 ML accounting for a post-injection magnitude increase (“trailing effect”) of 0.9 magnitude units (ML).
L10.11 Summary of mitigation
460. Following the felt induced seismic event that was attributed to hydraulic fracturing of Cuadrilla’s Preese Hall well, several measures have been incorporated into the Project as embedded mitigation. These measures are a requirement of the DECC
1, UKOOG
2 and were announced in Parliament as a
written statement by the Secretary of State for Energy and Climate Change on December 13
th 2012
3. These measures include:
Reviewing available information on geology, structure (including faults) and in situ stresses in the vicinity of the proposed Site to avoid hydraulically fracturing into, or close to, existing critically stressed faults;
Carry out risk based geomechanical assessments of proposed hydraulic fracturing with regard to known faults (including maximum magnitude estimates);
Monitoring background induced and natural seismicity before, during and after hydraulic fracturing;
Evolutionary approach to risk assessment and mitigation – Fracture evolution and operational mitigation including a mini-fracture stage prior to the initial main hydraulic fracturing stage and reduced per stage volumes of hydraulic fracturing fluids compared to those used at Preese Hall. This stepped progressive approach to hydraulic fracturing will consist of an initial mini-fracture stage and modest initial pumped volumes building up to a maximum pump volume of 765m
3 per stage (less than half of the average volumes
pumped per stage at Preese Hall). As this process continues, an
123
Gasopslag Bergermeer. <URL:
http://www.gasopslagbergermeer.nl/nieuws/TAQA_maatregelen_bodembeweging> [site accessed
19/03/2014].

Cuadrilla Bowland Limited Temporary shale gas exploration at Preston New Road Environmental Statement
Draft 3 | 24 May 2014
C:\RICHARD\RICHARD - WORK\JOBS\CUADRILLA\ISSUED DOCUMENTS\PRESTON NEW ROAD\2015-05-29 ES & PL DOCS FINAL\ES VOL 2 FINAL
APPENDICIES\PNR_ES_VOL2_APPNDX L_INDUCED SEISMICITY.DOCX
Page L132
understanding of the performance of the reservoir during hydraulic fracturing is developed;
Monitor the extent of fracture growth during hydraulic fracturing using a buried microseismic array;
Implementation of the Traffic Light System (via the surface seismic monitoring array);
Flowback in the case of Amber (0.0 ML) or Red (0.5ML) seismic events between hydraulic fracturing stages in accordance with the Traffic Light System.
461. The Project proposals include hydraulic fracturing and extended well testing activities. Therefore, according to the DECC requirements
22, Cuadrilla are
required to submit a description of the controls described above to mitigate induced seismicity in the HFP. The HFP will be authorised by DECC prior to commencement of hydraulic fracturing activities.
462. Table 27 below summaries the key recommendations made in order to minimise the likelihood of felt induced seismic events from future hydraulic fracturing operations and shows how these recommendations have been implemented by Cuadrilla for the Site.
Table 27: How Cuadrilla has implemented the key recommendations to mitigate induced seismicity.
Recommended Mitigation Measure
Cuadrilla’s Implementation Strategy
Review available information on geology, structure and in situ stresses within the vicinity of the proposed Site to avoid hydraulically fracturing into, or close to, existing critically stressed faults
1,2,3,13,14 .
Cuadrilla have carried out an extensive desk study to identify the faults in the vicinity of the Preston New Road site. This has been carried out through review of geological maps and memoirs, relevant peer reviewed published literature on the local and regional geology, in-house expertise and knowledge, interpretation of bespoke 3D geophysical (seismic) survey and end of well reports for the Grange Hill, Thistleton, Elswick and Preese Hall wells. This information has been used to locate the vertical well and horizontal wells in the most favourable ground conditions to avoid regional faults.
Carry out risk based geomechanical assessments of proposed hydraulic fracturing with regard to known faults (including maximum magnitude estimates)
2
Cuadrilla have carried out a review of maximum magnitude induced seismic events within the Bowland Basin, which considers the location, geometry and activity of faults in combination with the geomechanical properties of the rock and the in situ stress regime. This has been reviewed by Arup and DMT and a maximum magnitude estimate of 3.1 ML is considered reasonable (for injection volumes similar to Preese Hall-1). With embedded mitigation the maximum magnitude is considered to be 1.5 ML.
Monitor background induced and natural seismicity before hydraulic fracturing
1,13,14
Cuadrilla will monitor background induced and natural seismicity before hydraulic fracturing.
Monitor background induced and natural seismicity after the hydraulic fracturing
1,14
Cuadrilla will monitor background induced and natural seismicity after hydraulic fracturing.
Monitor background induced and natural seismicity during the hydraulic fracturing
1,2,13,14
Cuadrilla will monitor background induced and natural seismicity during hydraulic fracturing. This will include microseismic monitoring in order to manage the location and

Cuadrilla Bowland Limited Temporary shale gas exploration at Preston New Road Environmental Statement
Draft 3 | 24 May 2014
C:\RICHARD\RICHARD - WORK\JOBS\CUADRILLA\ISSUED DOCUMENTS\PRESTON NEW ROAD\2015-05-29 ES & PL DOCS FINAL\ES VOL 2 FINAL
APPENDICIES\PNR_ES_VOL2_APPNDX L_INDUCED SEISMICITY.DOCX
Page L133
Recommended Mitigation Measure
Cuadrilla’s Implementation Strategy
extent of fracture growth.
Evolutionary approach to risk assessment and mitigation (i.e. fracture evolution and operational mitigation using a stepped progressive approach)
1,3
Cuadrilla will implement a stepped progressive approach that uses a mini-fracture stage prior to the main hydraulic fracturing stage (and as deemed necessary by Cuadrilla), increasing pumped volumes of hydraulic fracturing fluids and microseismic monitoring to understand the performance of the reservoir during hydraulic fracturing. This will enable Cuadrilla to adjust the hydraulic fracturing operations to ensure that hydraulic fractures are within the design objectives. This iterative process will allow the performance of the previous hydraulic fracture stage to be used to design the next hydraulic fracture stage to ensure the design objectives are maintained.
Carry out a mini-fracture stage
2,13,14
A mini-fracture stage will be carried out prior to the initial main hydraulic fracturing stage to determine the geomechanical properties of the formation to inform the hydraulic fracture model. The mini-fracture stage will employ small volume stimulation of approximately 15m
3.
Reduce volumes of hydraulic fracturing fluids
1,13
Cuadrilla will reduce the volumes of hydraulic fluids to 15m3
for mini-fracture stimulations and 750m3 for full stimulations
per hydraulic fracture stage.
Monitor the extent of fracture growth during hydraulic fracturing
1,2,13,14
Cuadrilla will use a buried microseismic array to monitor the extent and orientation of hydraulic fractures to ensure fractures are within the design objectives and to ensure that fractures do not extend to regional faults.
Implementation of a Traffic Light System
1,2,13,14
Cuadrilla will implement the Traffic light system as agreed by DECC in order to locate the hypocentre of the seismicity and determine the magnitude of each event in real time during the hydraulic fracturing stages. Cuadrilla have committed to the dissemination of the status of the TLS at the end of each hydraulic fracture stage.
Flowback of hydraulic fracturing fluids
1,13
Cuadrilla will flowback, in the case of Amber or Red threshold (TLS) seismic events, between hydraulic fracturing stages.
Develop a Hydraulic Fracture Programme (HFP)
2,22
The Project proposals include hydraulic fracturing and extended well testing activities. Therefore, Cuadrilla are required to submit a description of the controls described in L10 to mitigate induced seismicity in the HFP. The HFP will be authorised by DECC prior to commencement of hydraulic fracturing activities.

www.cuadrillaresources.com
www.arup.com