methodology of development of purpose maps in gis environment
TRANSCRIPT
UDK 528.8:004.6:528.88:551.4:631.111.2:634.8Izvorni znanstveni èlanak
Methodology of Development of Purpose Mapsin GIS Environment – Resource Management
Mladen JURIŠIÆ – Osijek1, Stanislav FRANGEŠ – Zagreb2,Ivan PLAŠÈAK – Osijek1, Ante ŠILJEG – Zadar3
ABSTRACT. The purpose of this research was to determine the methodology of landcapability evaluation with regard to an array of objective limiting factors when gro-wing, for example, perennial crops. The methodology of relief parameterization wasused in the method for calculating geomorphological parameters, and pedometricmapping methods were used to calculate pedological variables. Inventory of the actualcondition of land cover was made based on sketches and maps that were gathered du-ring field research. These sketches were then geo-referenced and overlapped withLANDSAT satellite images to determine the actual situation. The best locations for aparticular type of perennial plantation were selected by using logic and spatial queries.Best locations (in this example for vineyards) were identified as an area overlap (areaswith, according to the spatial plan, either valuable, especially valuable or other arablesoils, southern relief exposition with the total annual incident light >1,208 KWh/m2,and the location where the relief slope is not higher than 12% and lower than 2%, orwhere elevation exceeds 110 m and soil acidity does not exceed 5.6 pH). The query re-sulted in a simple map. The map shows areas which are either suitable for viticulture(1) or not suitable for viticulture (0). Similar approach could be used also for thematicmaps of different purposes, for example, urbanization maps, or mapping valuablesources of water, gas, thermal wells and other resources of special importance for thecountry. According to the results obtained in our example of finding the methodologyfor development of thematic maps in GIS environment, the total of 17,782 ha in theCounty area is suitable for viticulture. The best way of developing spatial plans forparticular crops would be to develop maps of negative scores for all crops, and then tostandardize these values to find the best possible crop for each location. Thematic GISlayers can be used as the foundation for loans, advice on what crop to choose, makingdecisions on land re-allocation and land use, reconstruction i.e. modified land use.
Keywords: geo-information systems (GIS), methodology, thematic maps, resourcemanagement, spatial plan, purpose map, EU pre-accession funds.
Jurišiæ, M. et al.: Methodology of Development of Purpose Maps in …, Geod. list 2013, 1, 1–12 1
1 Prof. dr. sc. Mladen Jurišiæ, Faculty of Agriculture, University J. J. Strossmayer, Trg Sv. Trojstva 3, HR-31000Osijek, Croatia, e-mail: [email protected] Plašèak, dipl. ing., Faculty of Agriculture, University J. J. Strossmayer, Trg Sv. Trojstva 3, HR-31000Osijek, Croatia, e-mail: [email protected],
2 Prof. dr. sc. Stanislav Frangeš, Faculty of Geodesy, University of Zagreb, Kaèiæeva 26, HR-10000 Zagreb, Croatia,e-mail: [email protected].
3 Ante Šiljeg, prof., Department of Geography, University of Zadar, Franje Tuðmana 24i, HR-23000 Zadar, Croatia,e-mail: [email protected].
1. Introduction
To improve efficiency and competitiveness of an industry, i.e. efficiency of resourcemanagement in a country, governments of these countries (especially EU memberstates) adopt the so-called operative programmes to stimulate loans to such indu-stries. The goal of such programmes is to increase efficiency of different aspects ofmanagement. For example, it is of great importance for the Republic of Croatiato make an inventory of resources, that is, to improve their use and efficiency.Through various projects (supported by the EU and its programmes related to theuse of pre-accession funds), the Croatian Government stimulates an increasingnumber of small and large entrepreneurs, even family farms, to increase their planta-tions and to become serious producers with a higher share in the market economy.
To allocate funds from such sources in the best possible way, the following is re-quired: to educate economic operators (land owners and company owners, espe-cially those related to resource management) on the possibilities and to carefullychoose among the received loan applications. Among other, it is necessary to havea good knowledge of production potentials of a particular location (land owned bythe requesting party) so that as much funds as possible is invested into areas withthe highest production potential related to targeted production.
Accelerated development of geo-information technologies has taken place also in ourcountry (application in various fields, especially in natural resource management).Inventory of large areas can be made very quickly either by using satellite images orby positioning by means of GPS device or digital aero-photogrammetry (Jurišiæ et al.1999 and Jurišiæ et al. 2005; Husnjak and Bogunoviæ 2002a and 2002b).
Thematic maps of different purposes in Croatian agriculture have been already inthe process of making, although not to a sufficient extent. Among organizedsystems of implemented geo-information technologies, a digital land registry,LPIS (part of the AIACS systems), better known as ARKOD, should be mentionedhere. For example, Croatian Institute of Viticulture and Enology has started todevelop a detailed Vineyard Register, which should provide a general statisticaloverview of all vineyard areas on a single production area as well as potential areas.
The only issues here are what methodology should be used in the process andwhat funds and human resources are required. These issues are addressed in thispaper. The methodology of carrying out the land capability evaluation while con-sidering an array of limiting factors of production for strategic types of perennialplantations is presented on the example of Osijek-Baranja County (Jurišiæ andPlašèak 2009).
2. Work methodology
GIS has been in use in Croatia for the purpose of planning at the regional levelfor some ten years. The methodology used in this example and used for the purpo-se of planning in the field of management of resource use is specific in the partthat parameters for land evaluation are clearly and precisely defined – geomor-phological, pedological and actual condition of land cover. The methodology of pa-rameterization of relief is used for calculation of geomorphological parameters
2 Jurišiæ, M. et al.: Methodology of Development of Purpose Maps in …, Geod. list 2013, 1, 1–12
(Hengl et al. 2003), and pedometric mapping methods are used for calculation ofpedological variables (Hengl 2003). Inventory of the actual condition of land coveris made by using sketches and plans obtained during field data gathering. Thesesketches are then geo-referenced and overlapped with LANDSAT satellite imagesto determine the actual situation.
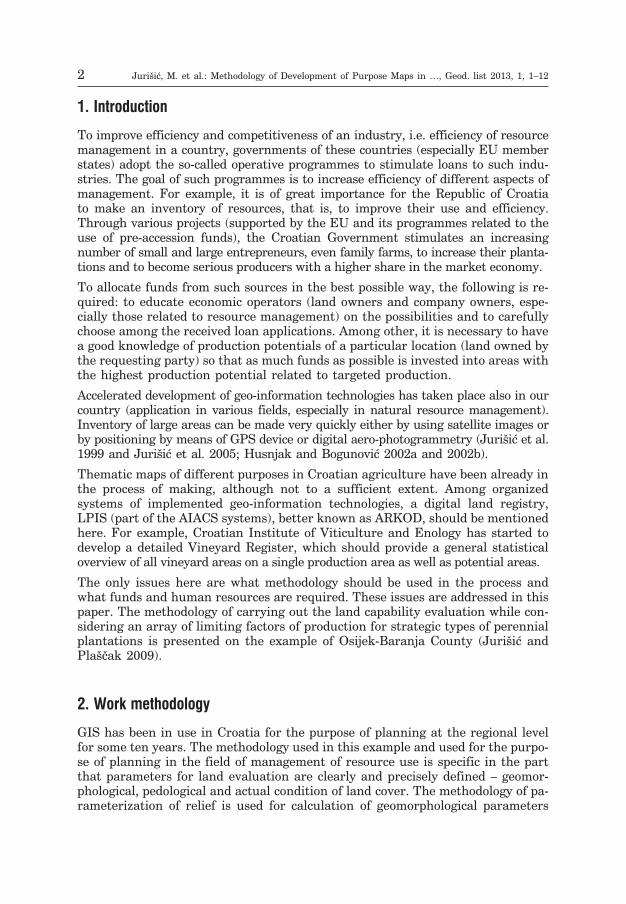
Methodology of raster GIS modelling was used throughout the study, which me-ans that the basic decision making unit was pixel or cell grid square (see Fig. 1).The methodology of preparing thematic layers is presented in the following sub-chapter.
2.1. Field data collection
To evaluate (locate) the current situation in the field in the best possible way, thefield was recorded during the visit to the main economic operators.
Shorter surveys can be carried out in the process with economic operators (tech-nologists). In addition to obtaining important technical data, this also provides aninsight into the main issues in production. Also, each organization is required tosubmit a map showing the current situation and the location. These mostly inclu-de sketches or old plans that were either copied by hand or photocopied and dimi-nished from the original cadastral maps.
Maps very often include a legend on the plot boundaries showing the sorts grown,and each plot has its own identification number.
2.2. Preparation of the thematic GIS layers
In the process of preparing GIS layers several raster resolutions should be used:(a) basic resolution for calculation of suitability – 100 m; (b) LANDSAT image at30 and 15 m resolution; (c) a detailed topographic map 1:100K, also at 15 m reso-lution.
Jurišiæ, M. et al.: Methodology of Development of Purpose Maps in …, Geod. list 2013, 1, 1–12 3
Fig. 1. Raster-based GIS: each thematic layer consists of the smallest unit of pixel orgrid square which is determined by the field resolution.
The total area is 97 � 83 km. Panchromatic image is at 15 m resolution (5508 �
6501 pixels).
According to this methodology the following thematic layers are made:
Topographic map 1:100K (topo100K) – Sheets of 1:100K topographic map, scan-ned and geo-referenced to the coordinate system, are used as GIS foundation. Inour example the total of 19 sheets of topographic map of the Republic of Croatiawere geo-referenced and joined together.
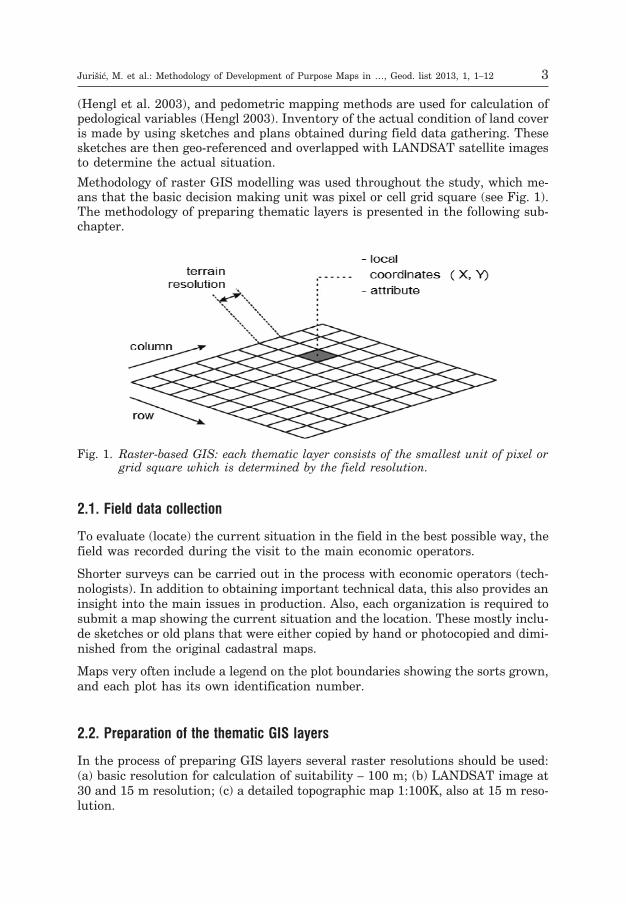
Scanned sketches (tables) – They present the current condition of perennial plan-tations (Fig. 2). In our example sketches and maps of four economic operatorswere gathered for the purpose of this study. After geo-referencing all scannedsketches were transferred into the vector format (Fig. 3).
Digital relief model and relief parameters (DMR, slope, light) – digital relief mo-del (DMR) is produced based on the combination of SRTM DMR (NASA 2005a)and DMR which was developed based on digitalized contour lines from 1:100K to-pographic maps (Fig. 4).
In this case the DMR based on topographic maps has greater absolute accuracy,while SRTM DMR shows greater local detail (changes in the mezzo relief). SRTMDMR was not used in areas with rich vegetation, because SRTM DMR usuallyshows also the surface of such objects, and not the real elevation of the terrain.Two geo-morphological factors were calculated based on DMR: slope (%) and thetotal annual amount of incident light (NASA 2005b).
4 Jurišiæ, M. et al.: Methodology of Development of Purpose Maps in …, Geod. list 2013, 1, 1–12
Fig. 2. and 3. Importing and assessment of old sketches and maps into GIS. Left: Anexample of an old plan; Right: The map of plots can be represented in asatellite image after geo-referencing.
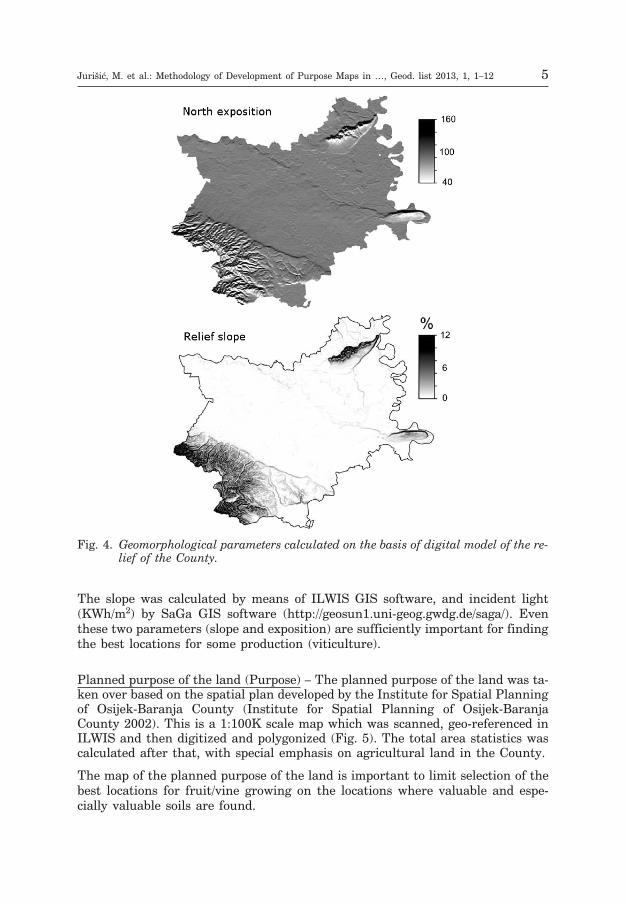
The slope was calculated by means of ILWIS GIS software, and incident light(KWh/m2) by SaGa GIS software (http://geosun1.uni-geog.gwdg.de/saga/). Eventhese two parameters (slope and exposition) are sufficiently important for findingthe best locations for some production (viticulture).
Planned purpose of the land (Purpose) – The planned purpose of the land was ta-ken over based on the spatial plan developed by the Institute for Spatial Planningof Osijek-Baranja County (Institute for Spatial Planning of Osijek-BaranjaCounty 2002). This is a 1:100K scale map which was scanned, geo-referenced inILWIS and then digitized and polygonized (Fig. 5). The total area statistics wascalculated after that, with special emphasis on agricultural land in the County.
The map of the planned purpose of the land is important to limit selection of thebest locations for fruit/vine growing on the locations where valuable and espe-cially valuable soils are found.
Jurišiæ, M. et al.: Methodology of Development of Purpose Maps in …, Geod. list 2013, 1, 1–12 5
Fig. 4. Geomorphological parameters calculated on the basis of digital model of the re-lief of the County.
Pedological parameters (soil_type, soil_pH, soil_carb) – In addition to soil type (de-ep, fertile, gravel or dry), when selecting the soil in the process of vineyard plantingit is of utmost importance to know the content of lime in the land envisaged forplanting, for the depths 0–30 cm and 30–60 cm. Maps of soil acidity and carbonatecontent were made by interpolation of a limited number of pedological profiles.
The database of soil types in Croatia was used (Martinoviæ and Vrankoviæ 1997);the total of 124 profiles from this database can be found in the County area.
The data were interpolated so that a map of soil types was made in the beginning(Alluvial, Chernozems, District Brown Soil, Eutric Brown Soil, Colluvial Soil, LoessSoil, Meadow Soil, Wetland Gley Soil, Pseudo-gleyed Soil, Rendzina, Wetland BlackSoil, Semi-gley) by classifying geomorphological parameters, and then the mean va-lue of pedological parameter was calculated for each soil type (pH, carbonates).
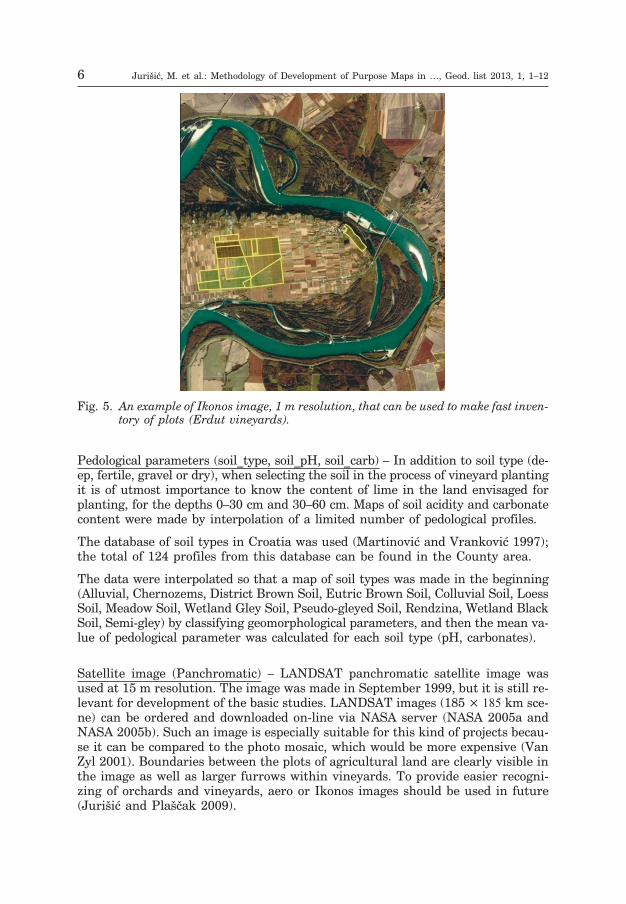
Satellite image (Panchromatic) – LANDSAT panchromatic satellite image wasused at 15 m resolution. The image was made in September 1999, but it is still re-levant for development of the basic studies. LANDSAT images (185 � 185 km sce-ne) can be ordered and downloaded on-line via NASA server (NASA 2005a andNASA 2005b). Such an image is especially suitable for this kind of projects becau-se it can be compared to the photo mosaic, which would be more expensive (VanZyl 2001). Boundaries between the plots of agricultural land are clearly visible inthe image as well as larger furrows within vineyards. To provide easier recogni-zing of orchards and vineyards, aero or Ikonos images should be used in future(Jurišiæ and Plašèak 2009).
6 Jurišiæ, M. et al.: Methodology of Development of Purpose Maps in …, Geod. list 2013, 1, 1–12
Fig. 5. An example of Ikonos image, 1 m resolution, that can be used to make fast inven-tory of plots (Erdut vineyards).
Map importing, geo-referencing and integration were carried out by using theunique methodology as described below:
• Maps are scanned at 150 DPI resolution and more;
• Scanned maps are imported into a GIS software ILWIS and geo-referenced tothe local coordinate system, 1:100K scale;
• Parts of maps are joined and modified according to the desired basic resolutionand detail level;
• Different thematic layers are used for simple (for example, slope maps) and morecomplex calculations (for example, annual amount of direct solar radiation);
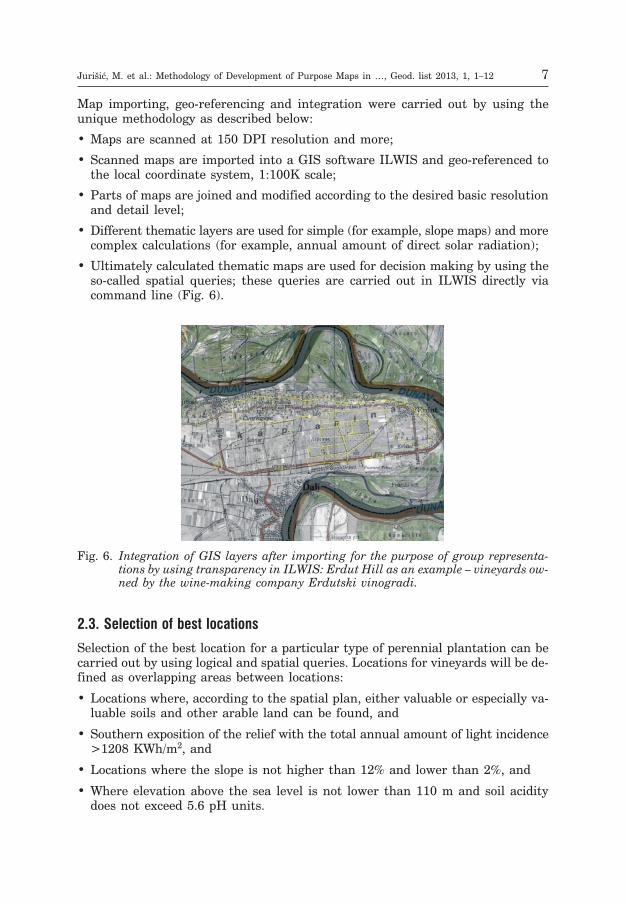
• Ultimately calculated thematic maps are used for decision making by using theso-called spatial queries; these queries are carried out in ILWIS directly viacommand line (Fig. 6).
2.3. Selection of best locations
Selection of the best location for a particular type of perennial plantation can becarried out by using logical and spatial queries. Locations for vineyards will be de-fined as overlapping areas between locations:
• Locations where, according to the spatial plan, either valuable or especially va-luable soils and other arable land can be found, and
• Southern exposition of the relief with the total annual amount of light incidence>1208 KWh/m2, and
• Locations where the slope is not higher than 12% and lower than 2%, and
• Where elevation above the sea level is not lower than 110 m and soil aciditydoes not exceed 5.6 pH units.
Jurišiæ, M. et al.: Methodology of Development of Purpose Maps in …, Geod. list 2013, 1, 1–12 7
Fig. 6. Integration of GIS layers after importing for the purpose of group representa-tions by using transparency in ILWIS: Erdut Hill as an example – vineyards ow-ned by the wine-making company Erdutski vinogradi.

This means that locations will be found that satisfy several important criteria inthe same area (good exposition and good slope, and good elevation...). Such spatialenquiry can be expressed by means of the following ILWIS commands (so-calledILWIS sytnax):
SUITABLE_VINEYARDS {dom=Bool} = iff( ((purpose="ESPECIALLY VALUABLESOIL ") or (purpose="VALUABLE SOIL ") or (purpose="OTHER ARABLE SOILS "))and (light>1220) and (slope<12) and (DMR>110) and (soil_pH>5.6), 1, 0).
This is the so-called "Boolean" operation, because the result of the query will be asimple map showing areas which are either suitable for viticulture (1) or not sui-table for viticulture (0). If the user wishes to increase the selection criteria, he/she
8 Jurišiæ, M. et al.: Methodology of Development of Purpose Maps in …, Geod. list 2013, 1, 1–12
Table 1. List of GIS layers used in the development of the study.
GIS layer Unit Description andcharacteristics Application
topo100KScanned and geo-referenced topogra-phic map 1:100K. Raster map in realcolours. Map size – 5508 � 6501 pixel.
Basic foundation for preparation ofall other GIS layers.
tableScanned, geo-referenced and vecto-rized plot boundaries. Vector map;total around 200 tables/plots.
Showing the current situation andlocations of perennial plantations(PP) in the County area.
DMR M
Digital relief model is a raster mapshowing the field elevation foreach point in the space. Map size –827 � 976 pixels.
It can be used for calculation ofgeomorphological and hydrologicalparameters, but also for 3D repre-sentations.
slope %
Raster map developed on the basisof DMR, showing field inclination.Also in this case 100 m grid wasused.
A very important agro-environ-mental parameter because it isrelated to agricultural production(>12% is not suitable for mechani-zation application).
light KWh/m2Raster map calculated on DMRbasis and knowledge of the solarradiation model.
It can be used to locate the areassuitable for vineyards. Southernexposition shows the highest values.
purpose classPolygon map showing land purposeclasses according to the spatialplan.
Spatial planning of agricultural pro-duction should be limited to the loca-tions where agricultural land is found.
soil_type classRaster map showing soil typesfrom alluvial to chernozem andrenzina soils in mountains.
Based on the soil type, a conclusionon other soil characteristics caneasily be made.
soil_pH 0–15
Raster map produced by interpola-tion of observed values. In this caseaverage was made according to soiltype map.
Acidity is usually the key limitingfactor for agricultural production.
tlo_karb %
Raster map produced by interpola-tion of observed values. In this caseaverage was made according to soiltype map.
Vineyards require more carbonatesoils. Acid soils may result inunder-performance.
Panchrom. 0–256 Raster image. The smallest detail15 m. Map size – 5508 � 6501 pixels.
Useful for recognizing the bounda-ries between agricultural land plots.
can simply change any of the parameters directly in ILWIS command (for exam-ple, slope <10% instead of <12%). Of course, the more strict criteria will result insmaller area of suitable locations (Miklos 1989).
Alternative to this Boolean procedure would be the use of limitations scores. Inthat case every parameter, limiting agro-environmental effect, is translated into alimitation score according to a mathematical or empirical formula. Use of limita-tion (negative) scores in this case is considerably more complex, because relationsamong the negative scores and limiting parameters are unknown. In addition, thenumber of agro-environmental factors can be pretty large, which means conside-rably larger calculations in GIS (Jurišiæ and Plašèak 2009).
3. Results and discussion
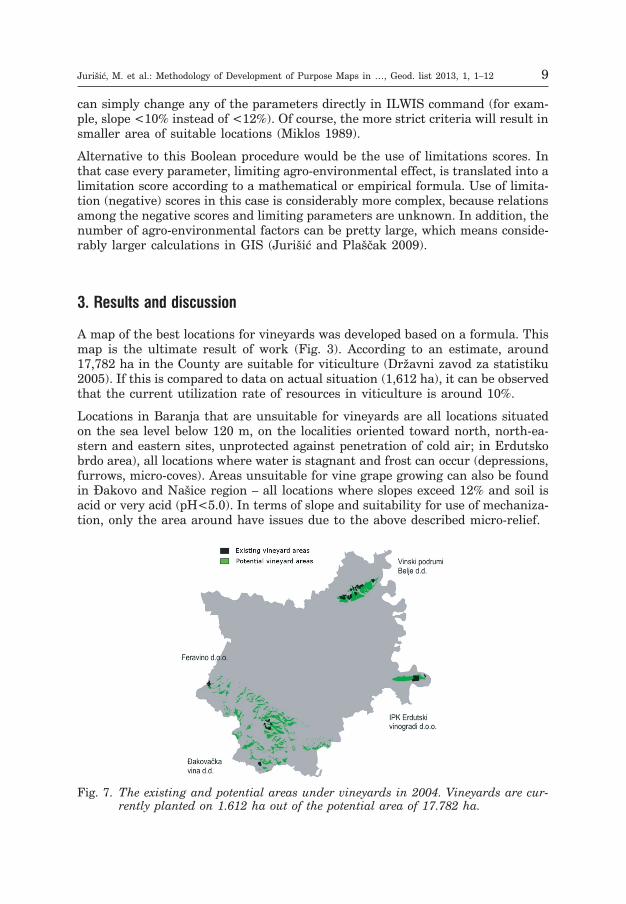
A map of the best locations for vineyards was developed based on a formula. Thismap is the ultimate result of work (Fig. 3). According to an estimate, around17,782 ha in the County are suitable for viticulture (Dr�avni zavod za statistiku2005). If this is compared to data on actual situation (1,612 ha), it can be observedthat the current utilization rate of resources in viticulture is around 10%.
Locations in Baranja that are unsuitable for vineyards are all locations situatedon the sea level below 120 m, on the localities oriented toward north, north-ea-stern and eastern sites, unprotected against penetration of cold air; in Erdutskobrdo area), all locations where water is stagnant and frost can occur (depressions,furrows, micro-coves). Areas unsuitable for vine grape growing can also be foundin Ðakovo and Našice region – all locations where slopes exceed 12% and soil isacid or very acid (pH<5.0). In terms of slope and suitability for use of mechaniza-tion, only the area around have issues due to the above described micro-relief.
Jurišiæ, M. et al.: Methodology of Development of Purpose Maps in …, Geod. list 2013, 1, 1–12 9
Fig. 7. The existing and potential areas under vineyards in 2004. Vineyards are cur-rently planted on 1.612 ha out of the potential area of 17.782 ha.
These scales can be used to find the best locations for planting new vineyards.However, the areas that are not coloured green in the Fig. 7 show areas which co-uld not be recommended as suitable for viticulture, i.e. loans or incentives forthem should not be provided by the County or Government.
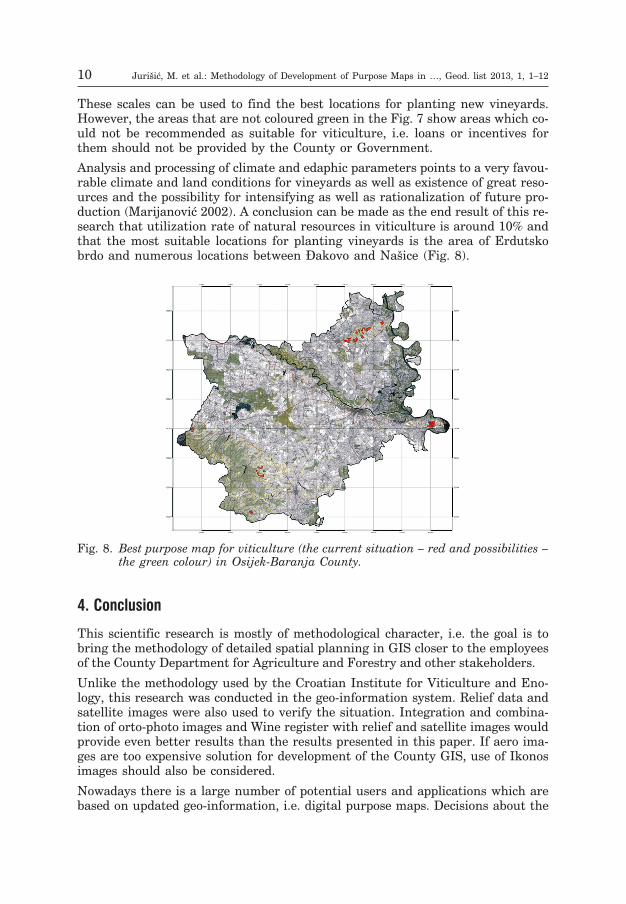
Analysis and processing of climate and edaphic parameters points to a very favou-rable climate and land conditions for vineyards as well as existence of great reso-urces and the possibility for intensifying as well as rationalization of future pro-duction (Marijanoviæ 2002). A conclusion can be made as the end result of this re-search that utilization rate of natural resources in viticulture is around 10% andthat the most suitable locations for planting vineyards is the area of Erdutskobrdo and numerous locations between Ðakovo and Našice (Fig. 8).
4. Conclusion
This scientific research is mostly of methodological character, i.e. the goal is tobring the methodology of detailed spatial planning in GIS closer to the employeesof the County Department for Agriculture and Forestry and other stakeholders.
Unlike the methodology used by the Croatian Institute for Viticulture and Eno-logy, this research was conducted in the geo-information system. Relief data andsatellite images were also used to verify the situation. Integration and combina-tion of orto-photo images and Wine register with relief and satellite images wouldprovide even better results than the results presented in this paper. If aero ima-ges are too expensive solution for development of the County GIS, use of Ikonosimages should also be considered.
Nowadays there is a large number of potential users and applications which arebased on updated geo-information, i.e. digital purpose maps. Decisions about the
10 Jurišiæ, M. et al.: Methodology of Development of Purpose Maps in …, Geod. list 2013, 1, 1–12
Fig. 8. Best purpose map for viticulture (the current situation – red and possibilities –the green colour) in Osijek-Baranja County.

land use and its change are still not made based on objective queries and criteria.Unfortunately, in our country there are no updated and detailed maps of areaswhich would show the actual situation in land use, the real potential of naturalresources (soil, water, relief). All of the basic foundations of geodesy as the cada-stre, aero photos and topographic maps also have not been transformed into digi-tal form and made available to these services. Tools for relatively urgent and ob-jective monitoring of changes in land use (satellite images), changes of the boun-daries between agricultural units (aero-photos), positioning (GPS) and generalcondition of natural and human resources are not used.
Problems with the cadastre, land restitution, allocation and undefined ownershipstructure of land in the state ownership are a limiting factor in the process of de-termining the status and future purpose of these areas. Raising new perennialplantations and stimulation of potential producers (legal and physical entities) re-quires an extremely fast engagement at both national and county level in an ex-tremely short period of time (a few years – EU accession).
In this example of development of a thematic map showing land suitability forgrowth of grape vine, the main microclimate factors limiting successfulness ofproduction in the entire County area are: (a) local frost areas; (b) slope, over 15%;(c) insufficient carbonate content in the soil, i.e. excessive soil acidity. Ideal soilfor grape vine production is mildly sloped (2–12%), of southern, south-westernand western exposition, calcareous or mildly calcareous, with humus contentaround 3%, and of light texture (powdery/sandy loam).
Further steps shall include development of the full multidisciplinary GIZIS (Geo-graphic and Cadastral Information System) of regions with agricultural produc-tion, and education of all key users, primarily employees of the County Develop-ment Department on how to use these tools.
References
Dr�avni zavod za statistiku (2005): Popis poljoprivrede 2003, on-line: www.hzs.hr.Hengl, T. (2003): Pedometric mapping: bridging the gaps between conventional and
pedometric approaches, PhD thesis, University of Wageningen, Enschede, 214.Hengl, T., Gruber, S., Shrestha, D. P. (2003): Digital Terrain Analysis in ILWIS, Lec-
ture notes and users' guide, International Institute for Geo-Information Science &Earth Observation (ITC), Enschede, Netherlands, 45.
Husnjak, S., Bogunoviæ, M. (2002a): Application of GIS technology in land managementin Croatia, Proceedings of paper on CD-ROM of 17th World Congress of Soil Scien-ce, 14–21 August, Bangkok, Thailand, Papers on CD, No 340/1–10.
Husnjak, S., Bogunoviæ, M. (2002b): Komparativna istra�ivanja karte pogodnosti tla zaobradu i karte rizika od erozije tla vodom u Republici Hrvatskoj, Hrvatske vode, go-dina 10, br. 40, 311–320.
Institute for Spatial Planning of Osijek-Baranja County (2002): Prostorni plan �upani-je: korištenje i namjena prostora, �upanijski glasnik br.1/2002.
Jurišiæ, M., Plašèak, I. (2009): Geoinformacijski sustavi GIS u poljoprivredi i zaštiti oko-liša, Ud�benik, Poljoprivredni fakultet Osijek, 145–176.
Jurišiæ, M., Hengl, T., Duvnjak, V., Martiniæ, I. (1999): Agro-ecological and land infor-mation system, Strojarstvo, 41 (5–6), 223–231.
Jurišiæ, M. et al.: Methodology of Development of Purpose Maps in …, Geod. list 2013, 1, 1–12 11
Jurišiæ, M., Hengl, T., Stanisavljeviæ, S. (2005): Prostorno planiranje poljoprivredneproizvodnje – Vinogradarstvo: metodološki vodiè i GIS za odabir novih lokacija zasadnju vinograda, Studija za potrebe Osjeèko baranjske �upanije, Osijek.
Marijanoviæ, I. (2002): Veliki Atlas Hrvatske, Mozaik knjiga, Zagreb, 480.Martinoviæ, J., Vrankoviæ, A. (1997): Baza tala Republike Hrvatske, I-III., Ministarstvo
zaštite okoliša i prostornog planiranja, Zagreb, 365.Miklos, F. (1989): Physiology of temperate zone fruit trees, John Wiley & Sons, 338.NASA (2005a): Moderate Resolution Imaging Spectroradiometer (MODIS) imagery,
on-line: http://edcimswww.cr.usgs.gov/pub/imswelcome/.NASA (2005b): Shuttle Radar Topography Mission (SRTM), on-line by FTP server:
ftp://edcsgs9.cr.usgs.gov/pub/data/.Van Zyl, J. J. (2001): The Shuttle Radar Topography Mission (SRTM): a breakthrough
in remote sensing of topography, Acta Astronautica, 48 (5–12), 559–565.
Metodologija razvoja karata namjene zemljištau GIS okru�enju – upravljanje resursima
SA�ETAK. Svrha ovog istra�ivanja bila je utvrditi metodologiju bonitiranja poljo-privrednog zemljišta s obzirom na niz objektivnih ogranièavajuæih èimbenika koji sepoveæavaju, na primjer, kod višegodišnjih kultura. Metodologija parametrizacije rel-jefa rabljena je za izraèun geomorfoloških parametara, a pedometrijske metode kar-tiranja za izraèun pedoloških varijabli. Stvarno stanje pokrova zemljišta inventarizi-rano je na temelju skica i planova koji su prikupljeni tijekom terenskog istra�ivanja.Te skice su zatim georeferencirane i preklopljene s LANDSAT satelitskim snimkamakako bi se odredilo stvarno stanje. Optimalne lokacije za pojedini tip trajnog nasadaodabrane su primjenom logièkih prostornih upita. One su (u ovom primjeru za vino-grade) identificirane kao podruèja preklapanja (lokacije gdje se prema prostornomplanu nalaze ili vrijedna, osobito vrijedna tla ili ostala obradiva tla i ju�ne ekspozi-cije reljefa s kolièinom ukupne godišnje upadne svijetlosti >1208 KWh/m2 i lokacijegdje nagib reljefa nije veæi od 12% i manji od 2%, odnosno gdje nadmorska visinanije manja od 110 m i gdje tla nisu kiselija od 5.6 pH). Kao rezultat upita dobivenaje jednostavna karta koja pokazuje podruèja koja su pogodna (1) ili nisu pogodna zavinogradarstvo (0). Slièan pristup mo�e se koristiti i na tematskim kartama razlièitesvrhe, na primjer, urbanistièkim planovima, kartama izvora vode, plina, termalnihbunara i drugih resursa od posebnog znaèaja za dr�avu. Prema dobivenim rezultati-ma u našem primjeru, za vinogradarstvo je pogodno ukupno 17.782 ha na podruèju�upanije. Optimalni naèin izrade prostornih planova za pojedine kulture bio bi izra-diti karte negativnih bodova za sve kulture, a zatim standardizirati te vrijednosti ka-ko bi za svaku lokaciju pronašli najbolju moguæu kulturu. Tematski GIS slojevi mo-gu se rabiti kao osnova kreditiranja, savjeta o izboru kulture, donošenja odluka opreraspodjeli i korištenju, rekonstrukciji odnosno prenamjeni korištenja zemljišta.
Kljuène rijeèi: geoinformacijski sustavi (GIS), metodologija, tematske karte, uprav-ljanje resursima, prostorni plan, karta namjene zemljišta, pretpri-stupni fondovi EU.
Primljeno: 2012-10-12
Prihvaæeno: 2013-01-15
12 Jurišiæ, M. et al.: Methodology of Development of Purpose Maps in …, Geod. list 2013, 1, 1–12