retail: driver of innovation
TRANSCRIPT

Research Conferences Publishing Trade Shows
Retail: Driver of Innovation
Prof.Dr.Bernd Hallier
Bildbeispiel

Page 2
..

Page 3
Cornelisz Vroom was documentating the
return of the second VOC East India
Expedition.
The power of retail

Page 4
Rembrandt van Rijn

Page 5
Merchants (wholesalers/retailers) ruled
the world over five thousand years from
the Silk Road uptil Ahold!

Page 6
B. Hallier: Retail/Wholesale Innovation Cycles
1 Colonial Im- and Export; harbour dominance 1800
2 Prussian Custom Union - the focus changes to internal markets and the bigger
area stimulated efficiency like today’s EU
1825
3 Consumer Cooperatives to counter low income 1850
4 Department stores to cope with rich income 1875
5 Retailers Cooperatives to counter department stores 1900
6 Mail Order Houses to cope with the bad economic situation after World War I 1925
7 Supermarkets/Self-service from America after World War II 1950
8 Big Boxes and Shopping Centers as retail formats – EAN and scanning at the
backstage
1975
9 B2B and B2C by Internet – Total Supply Chain, DRR and ECR in-between retail and
consumer fast moving industry at the backstage
2000
10 M-Info, M-Shopping, C2C by Facebook, LinkedIn, YouTube and twitter – integration
of the agricultural suppliers into the Total Supply Chain
2025

Page 7
The Empowerment of Retail by
marketing-tools
branded goods +
great sales forces
below the
line (Vkf)
DPR/shelf
optimizing
scanning
build up
of marketing
national
distribution
split of
rabates
regional
distribution
local
distribution
merchandising
for the retail
efficient consumer
response ECR
computer integra-
ted trading CIT
category
management
category
captains partial
european
production for
private labels
partial
international
partial
global
coorgani-
sation
branded goods industry b retail branded goods industry
Source: Prof. Dr. B. Hallier/ EHI
Consumer impact
via YouTube,
Twitter,
FaceBook etc.

Page 8
Metro-Gruppe
59.960 16,6%
Rewe-Gruppe
54.772 15,2%
Edeka/AVA
47.665 13,2%
Aldi-Gruppe
37.500 10,4%
Tengelmann
26.889 746%
Metro-Gruppe
31.692 11,8%
Rewe AG
28.811 10,8%
Aldi Gruppe
23.100 8,7%
Tengelmann
17.555 6,6%
Asko-Gruppe
17.474 6,6%
Aldi Gruppe 23.100 8,7%
Metro Gruppe 9.835 6,67%
Rewe-Leibbrand 6.480 4,4% Tengelmann 6.385 4,3%
Schaper 4.180 2,8%
?
92.000
20,9%
?
86.000 19,5%
?
78.000 17,7%
?
60.000 13,6%
?
43.000 9,8%
1980
26,3%
1990
44,7%
2000
62,7%
2010 81,6%
Concentration in German Food Retailing Development 1980-2000/ Scenario 2010 Market Shares Top 5
Source:
M+M Eurodata

Page 9
1950
Local
Retailer
The “Expansion-Stairway” of European Retailing
1960 1970
Regional
Retailer
National
Retailer
Distribution
Power
Expansion Western-/Southern Europe
Expansion Eastern Europe
Global Expansion
1980 1990 2000
Page 10
The annual sales of WalMart is
equivalent to the GNP of the Switzerland
- but WalMart is growing faster!
Size of Retailers

Page 11
Important for the retailers are standards
for the international information and
logistics.

Page 12
What is the organizational backstage for
the global retail empires?

Page 13
Case Study 1
EAN/GS1

Page 14
All started with the European Article
Numbering System EAN – initiated by
Albert Heijn (Ahold)
EAN/GS1

Page 15
40 12345 12345 6
Prafix
bbn
bar code
OCR-B-
skript
Check digit
Individual
item number
from the
producer
Normal version of the 13-digit EAN
European Article Numbers(EAN)/
Barcode

Page 16
Scanner- Introduction in Germany
1 7 9 19 43 76 175729 719 966
15442252
3434
4849
7260
9773
12187
14901
17010
18000
1977 1978 1979 1980 1981 1982 1983 1984 1985 1986 1987 1988 1989 1990 1991 1992 1993 1994 1995 1996

Page 17
Consumer sale could be tracked
EAN/GS1

Page 18
Customer Cards / Data
**THANK YOU – COME AGAIN**
WE APPRECIATE YOUR LOYAY PATRONAGE
THANK YOU FOR SHOPPING
A&F MONTVALE, NEW JERSEY
Bacon PC 1,89 F
EGGS PC 1,29 F
TAX ,00 BAL 3,18 F
CASH 3,18 F
11/11/03 11:11 0015 02 0005 100
INQUIRE TODAY HOW OUR BOUNUS SAVING
CLUB CAN SAVE YOUUR MONEY
YOU COULD HAVE SAVED 1.00 TODAY
MY PLEASURE TO SERVE YOU DON

Page 19
FREQUENT SHOPPER PROFILE
Store Number: 000123
Card Number: 654321
JANE Q. SHOPALOT
67 ATLANTIC AVENUE
MANASQUAN NJ 08736
SSN: 999-99-9999
ISSUE DATE 09/10/90
ISSUE STATUS INITIAL
People in houshold = 4
People under age 18 = 2
Owner of any pets = dog
Marital Status = married
Age of person = 34
DATE FIRST SHOPPED : 09/11/90
DATE LAST SHOPPED : 04/11/91
Month: APR MAR FEB
Purchases
GROCERY 42.76 146.23 213.82
DAIRY 7.25 31.97 39.99
MEAT 17.35 81.60 88.79
PRODUCE 20.20 50.62 76.24
DELI 13.45 26.47 43.86
SEAFOOD 30.75 .00 .00
FROZEN 12.60 26.88 33.04
LIQUOR .00 .00 .00
FLORAL 12.50 .00 36.94
Total $ 156.86 363.77 532.68
TOTAL TRIPS 2 5 6
Transparent Customer

Page 20
Customer Segmentation
High purchasing value
High frequency
of purchase
Low frequency
of purchase
(1)
(2) (3)
(4)
„come more often“-Mailing „Thank you“-Mailing
„lost son“-Mailing „scottish“-Mailing
Low purchasing value

Page 21
The next step had been RFID (Radio
Frequency Identification) and WLAN
(Wireless Local Area Network)
New Technologies

Page 22
Parameters with an influence on RFID
Antenna range
Radio frequency field
shape (reflections, failures)
Number of smart
chips
Mix of products on the
pallet (cans, liquids …)
Positioning of smart chips
(alignment, handling,
hidden/covered)
Time available for reading,
speed of movement
Unintended reading
of the smart chip
close to the portal
Number of
bytes to be
read
Page 23
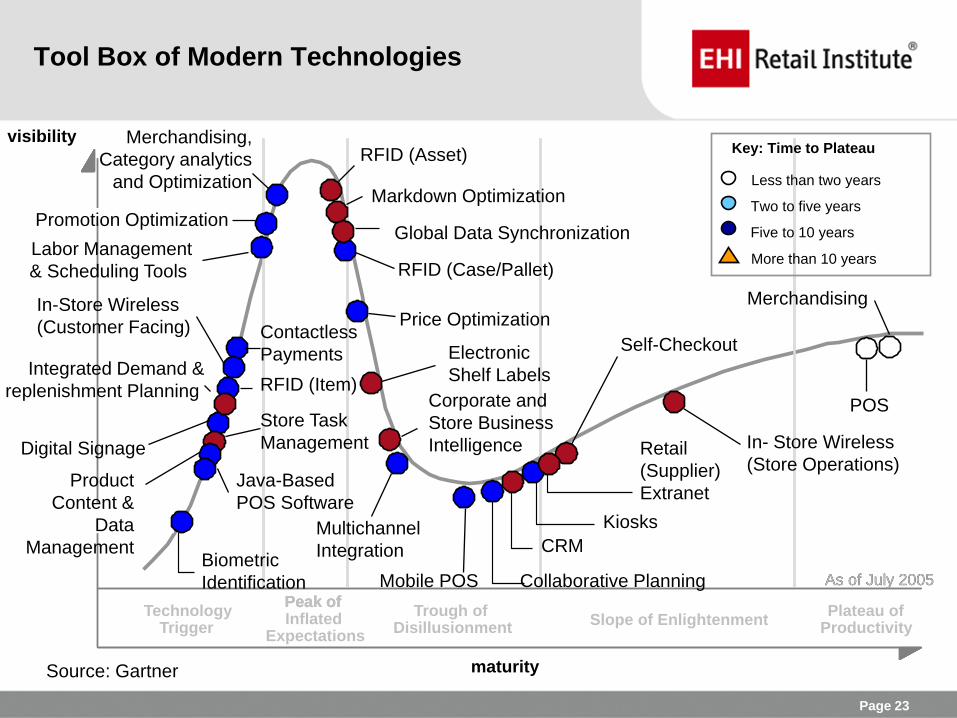
Tool Box of Modern Technologies
Technology Trigger
Peak of Inflated
Expectations
Trough of Disillusionment
Slope of Enlightenment Plateau of
Productivity
As of July 2005
Peak of Peak of
maturity
As of July 2005
visibility
POS
Self-Checkout
Retail
(Supplier)
Extranet
Kiosks
CRM
Mobile POS
Multichannel
Integration
Price Optimization
RFID (Case/Pallet)
RFID (Asset) Merchandising,
Category analytics
and Optimization
Labor Management
& Scheduling Tools
Contactless
Payments
RFID (Item)
Digital Signage
Store Task
Management
Java-Based
POS Software
Promotion Optimization
Integrated Demand &
replenishment Planning
Product
Content &
Data
Management Biometric
Identification
In-Store Wireless
(Customer Facing)
Electronic
Shelf Labels
Corporate and
Store Business
Intelligence
Markdown Optimization
Global Data Synchronization
Merchandising
In- Store Wireless
(Store Operations)
Collaborative Planning
Less than two years
Two to five years
Five to 10 years
More than 10 years
Key: Time to Plateau
Source: Gartner

Page 24
Link to central
merchandise
management system
Employee
PDAs Wireless
Bluetooth
peripherals Information
Terminal Self Check-out
Smart Trolley
Smart Scales
Access Points
Customer PDAs
Wireless
workplaces
Advertising
Displays
RFID
Multimedia
shelfs
METRO Group Future Store: Everything under a single roof!

Page 25
Personal Shopping Assistant
Page 26
The European EAN merged with other
organizations to become GS1 (Global Standard 1)
EAN/GS1

Page 27
Case Study 2

Page 28
In 1994 we had the BSE Scandal (British
Cow Disease)
EHI/Orgainvent
Page 29
Meat was an anonymous product – nobody
knew, if the beef came from the UK!
EHI/Orgainvent
Page 30
Meat sales dropped by 25 percent in
Germany
EHI/Orgainvent

Page 31
Bernd Hallier and six butchers in retail
discussed solutions in analogy to EAN!
EHI/Orgainvent
Page 32
They created the “EHI-Label” for tracing
and tracking of cows and beef
EHI/Orgainvent

Page 33
Name of Meat
Producer and number
of the factory of the
control-list of the
European Union
Logo of Meat Producer
Number within Orgainvent
Born/Breeding/Slaughtered
in the following country
Production-number
Category of Meat
Packed at:
Controlled by:
Sample for Tracement-Label
Name of Item

Page 34

Page 35

Page 36

Page 37
To transform a theoretical approach into
applied sciences – suppliers had to join
the system

Page 38
Cooperating suppliers had been
published as benchmarks

Page 39

Page 40
EHI supported the initiatives by
publications

Page 41
One tool was the monthly magazine
Dynamik im Handel
Page 42
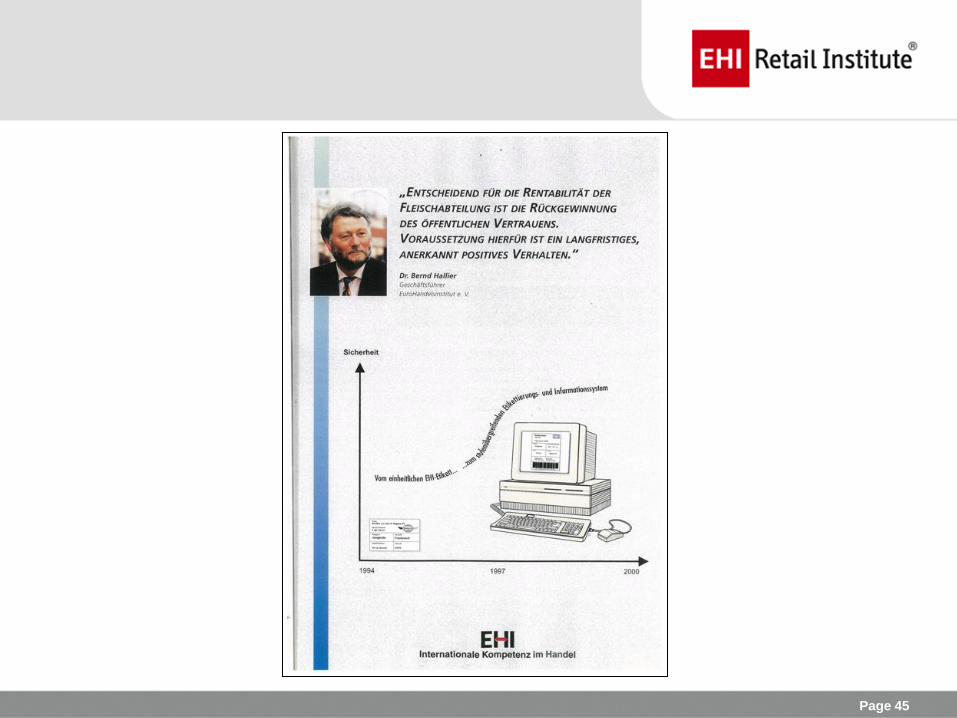
Another tool had been “special editions”
about the topic

Page 43

Page 44
Also two advertisements had been
designed and had been placed 18 times
in EHI publications inbetween 1995 and
2001
Page 45
Page 46

Page 47
Last but not least each quarter the
progress of the EHI-Workshops had
been documented

Page 48
In the year 2000 the pyramid proved 22
steps of effort to regain the consumer
trust!

Page 49

Page 50
One of the brochures had been
distributed to all members of the German
Bundestag

Page 51

Page 52
The Federal Chancellor Gerhard
Schröder had been approached by a
letter of Prof.Dr.Hallier on April 7th 2000
to introduce the label compulsory.

Page 53

Page 54
On April 18th the Federal German
Minister of Agriculture informed his EU-
colleagues about the German decisions

Page 55

Page 56
Meanwhile – pushed by EHI – the Label
and the tracing-system became an EU
Regulation: 1825/2000 and VO (EG)
999/2001
EHI/Orgainvent

Page 57
While in the end of August the draft
version of the new book “From Crisis to
Competence” was finished the EU-
Commission wrote a draft to change from
ear-marks for cows to RFID in 2020!
EHI/Orgainvent

Page 58
If – within national boundaries – there will
not be enough knowledge
institutionalized – then those country’s
suppliers will fall out of the globalized
distribution/production!
EHI/Orgainvent

Page 59
Case Study 3
EHI/GlobalGAP

Page 60
Getting involved via Tracking/Tracing into
agriculture – EHI started EUREPGAP
(European Retailers Produce Good
Agricultural Practice) – now GlobalGAP
EHI/GlobalGAP

Page 61
Continuous Growth
More than 100.000 certified
producers in more than 100 countries
STATISTICS
© GLOBALG.A.P Secretariat |

Page 62
GLOBALG.A.P GOVERNANCE
PARTNERSHIP PRINCIPLE IN ALL DECISION MAKING PROCESSES
Stakeholder

Page 63
GLOBALG.A.P MEMBERS
RETAIL & FOOD SERVICE MEMBERS

Page 64
GLOBALG.A.P MEMBERS
PRODUCER AND SUPPLIER MEMBERS
© GLOBALG.A.P Secretariat | Page 64

Page 65
Se
cre
taria
t
WE OPEN UP OUR STAKEHOLDER ENGAGEMENT
NEW STAKEHOLDER COMMITTEE STRUCTURE
© GLOBALG.A.P Secretariat | Page 65
• Find a common interest and create
your own Stakeholder Committee
• Min 5 GLOBALG.A.P members (min
1 retailer / min 1supplier/ min 1
associate member)
• Follow consistent rules and
templates
• Get Board approval
Stakeholder
Committees
Technical Advisory
Committees
National Technical
Working Groups
Board

Page 66
globalg.a.p Simplified
Producer keeps records of his practice
Producer self-monitoring
Producer inspection
Granting of a reward
Inspection
Documentation
Checklist
Checklist
Certificate

Page 67
How can add-ons benefit from this structure?
© GLOBALG.A.P Secretariat | Page 67
Producer keeps records of his practice
Producer self-monitoring
Producer inspection
Granting of a reward
Inspection
Incl. Add-on
Documentation
Checklist
Checklist
Certificate
Documentation
Add-on Checklist
Add-on Checklist
e.g. Certificate

Page 68
Globalg.a.p database frontend

Page 69
STEP-WISE APPROACH TO GLOBALG.A.P CERTIFICATION
PFA
Foundation
Level
PFA
Intermediate
Level
GLOBALG.A.P
• GLOBALG.A.P Primary Farm
Assurance (PFA): the response for
emerging markets
• Implementation through the
GLOBALG.A.P System following
member demands
• Implementation currently in the USA,
India, Poland, China, Kenya, South
Africa
WAY TO GLOBALG.A.P
National
GAP
Systems
Page 70
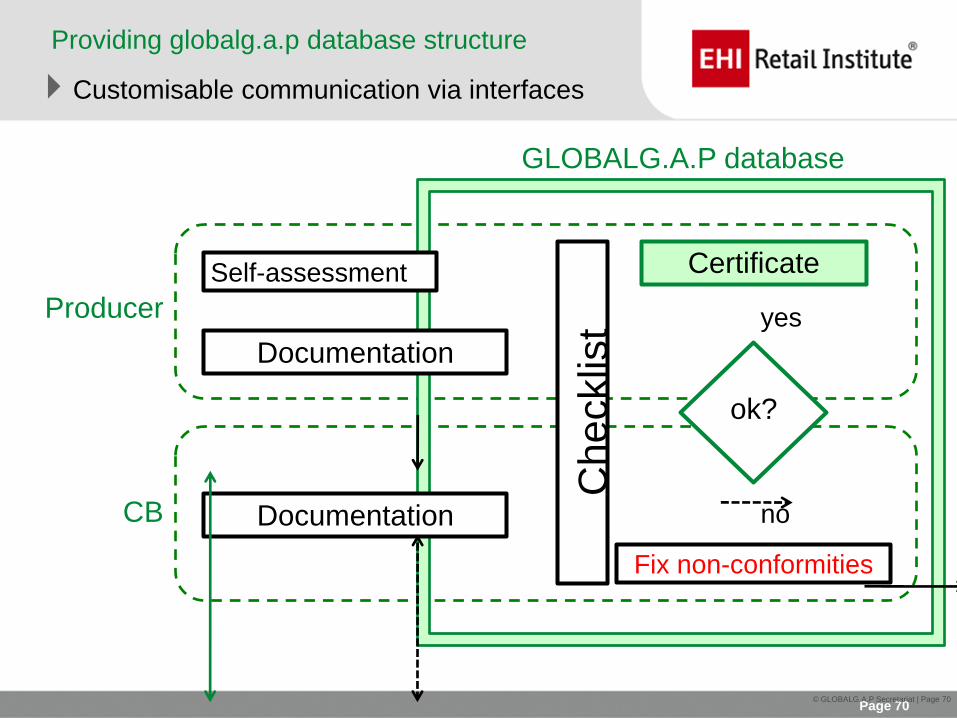
Providing globalg.a.p database structure
Customisable communication via interfaces
© GLOBALG.A.P Secretariat | Page 70
Producer
CB
GLOBALG.A.P database
Self-assessment
Documentation
Documentation
Ch
ecklis
t
ok?
Certificate
Fix non-conformities
yes
no

Page 71
THE FUTURE INTERNET
Actual developments
Farm Management Documentation
Documentation of all farm management actions
Linking from Farm Management Documentation to
certification
Spraying, soil cultivation, field management, ...
Includes potential information for different issues
(e.g. traceability, sustainability)
Checklists Documentation
Download, fill in and upload checklists to the
GLOBALG.A.P Database
Different checklists for IFA, Add-ons and PFA
Information is stored in the database and available
for registered users
Checklist results can be downloaded as pdf
© GLOBALG.A.P Secretariat | Page 71
Open XML Interfaces are available to various existing solutions

Page 72
THE GLOBALG.A.P CERTIFICATION SYSTEM
Independent 3rd Party Certification
• All certification bodies (CB) must be
ISO 65 accredited
• Restricting initial non-accredited
certification activities
• All certification bodies have had
external system and witness
assessments before entering large
scale certification activities
THE GLOBALG.A.P SYSTEM
Publication of All Approved CBs on the
Website
•Status and scope of accreditation
•Contact details
•Country offices
•Worldwide choice of CBs
© GLOBALG.A.P Secretariat | Page 72
Certification Body
Producer/
Producer Group
Accreditation Body Memorandum of
Understanding
Accreditation
ISO 65
Licence
Agreement
Sublicence
Agreement
GLOBALG.A.P
Secretariat

Page 73
DO YOU KNOW ALL RAW MATERIAL PRODUCERS?
EFFECTIVE MANAGEENT OF PRODUCER
INFORMATION
• Use our database to get a
structured overview of your
suppliers
© GLOBALG.A.P. Sekretariat | Seite 73

Page 74
GLOBALG.A.P FLOWERS AND ORNAMENTALS
•RECOGNIZED CERTIFICATION BODIES
• ABCERT AG Germany
• Agrar-Control GmbH Germany
• AgroManagement Denmark
• AGROQUALITA S.p.a Italy
• BCS Öko-Garantie GmbH Germany
• CERES - Certification of Environmental Standards
GmbH Germany
• Certiquality S.r.l. Italy
• Control Union Certifications B.V. Netherlands
• CSQA Certificazioni Srl Italy
• ECAS B.V. Netherlands
• Eco-LOGICA Costa Rica
• ICONTEC Colombi
• IMO - Institute for Marketecology Switzerland
• Institute of Quality & Control Israel
• IRAM-Instituto Argentino de Normalizacion y
Certificacion Argentina
• Lacon - Privatinstitut für Qualitätssicher. und
Zertifizierung Österreich
• LSQA (LATU Sistemas S.A.) Uruguay
• National Britannia Certification Ltd England
• NSF-CMi Certification England
• ProCert Safety AG Switzerland
• SATIVA Desenvolvimento Rural Lda Portugal
• SGS Australia PTY LTD Australia
• The Kenya Flower Council Kenya

Page 75
CERTIFIED PRODUCERS BENCHMARKED SCHEMES
• Belgium
• Switzerland
• Colombia
• Costa Rica
• Germany
• Denmark
• Ecuador
• Egypt
• Spain
• Ethiopia
• England
• Indonesia
• Israel
• Italy
• Kenya
• Sri Lanka
• Morocco
• Netherands
• Portugal
• Turkey
• Tanzania
• Uganda
• South Afrika
• Zambia
In total nearly 600 producers in
2 countries
GLOBALG.A.P FLOWERS AND ORNAMENTALS
© GLOBALG.A.P Secretariat | Page 75
• FLORVERDE – Colombia
• MPS-GAP – Netherlands
• SWISSGAP HORTIKULTUR – Switzerland
• KENYAGAP – Kenya
• KENYA FLOWER COUNCIL – Kenya

Page 76
GLOBALG.A.P NATIONAL TECHNICAL WORKING
GROUPS
MORE LOCAL INPUT IN GLOBALG.A.P STANDARD SETTING
© GLOBALG.A.P Secretariat | Page 76
Europe
Belgium
Bulgaria
Czech Republic
Denmark
France
Germany
Greece
Africa
Cote D‘Ivoire
Egypt
Ghana
Kenya
Senegal
South Africa
Tanzania
Uganda
Italy
Netherlands
Norway (Aqua)
Poland
Spain
Turkey
Ukraine New NTWGs in 2010
North/South America
Argentina
Brazil
Chile (Aqua/FV)
Colombia (Aqua/FV)
Costa Rica
Guatemala
Mexico
Peru
Uruguay
USA
Page 77
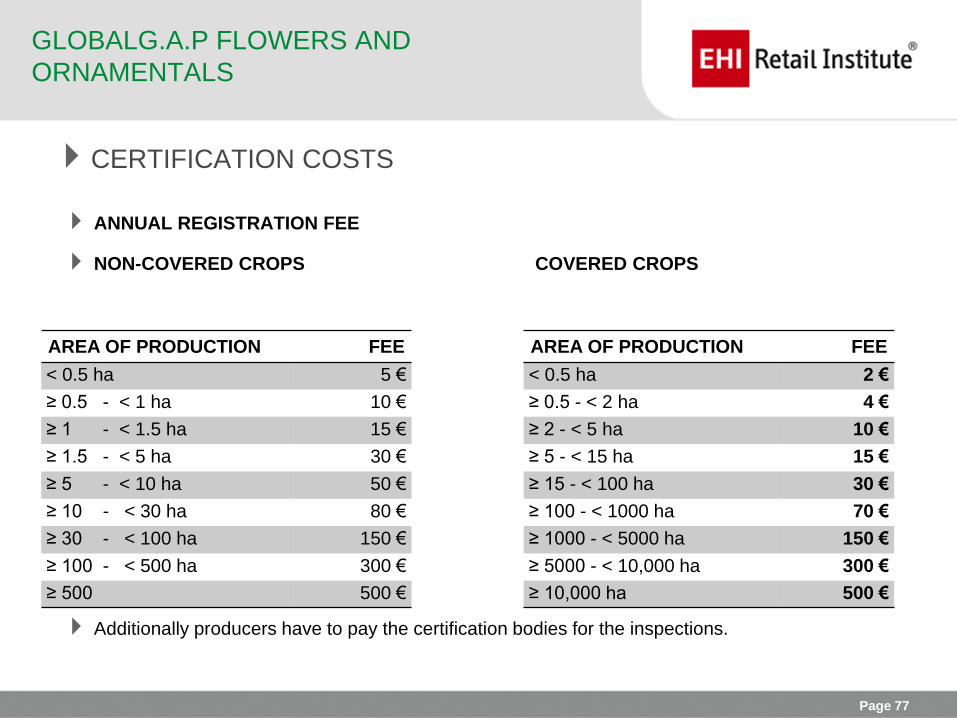
CERTIFICATION COSTS
ANNUAL REGISTRATION FEE
NON-COVERED CROPS COVERED CROPS
Additionally producers have to pay the certification bodies for the inspections.
GLOBALG.A.P FLOWERS AND
ORNAMENTALS
AREA OF PRODUCTION FEE
< 0.5 ha 5 €
≥ 0.5 - < 1 ha 10 €
≥ 1 - < 1.5 ha 15 €
≥ 1.5 - < 5 ha 30 €
≥ 5 - < 10 ha 50 €
≥ 10 - < 30 ha 80 €
≥ 30 - < 100 ha 150 €
≥ 100 - < 500 ha 300 €
≥ 500 500 €
AREA OF PRODUCTION FEE
< 0.5 ha 2 €
≥ 0.5 - < 2 ha 4 €
≥ 2 - < 5 ha 10 €
≥ 5 - < 15 ha 15 €
≥ 15 - < 100 ha 30 €
≥ 100 - < 1000 ha 70 €
≥ 1000 - < 5000 ha 150 €
≥ 5000 - < 10,000 ha 300 €
≥ 10,000 ha 500 €

Page 78
CONTENT OF THE STANDARD
SITE HISTORY AND SITE MANAGEMENT
RECORD KEEPING AND INTERNAL SELF-
ASSESSMENT/INTERNAL INSPECTION
WORKERS HEALTH, SAFETY AND WELFARE
SUBCONTRACTORS
WASTE AND POLLUTION MANAGEMENT,
RECYCLING AND RE-USE
ENVIRONMENT AND CONSERVATION
COMPLAINTS
RECALL/WITHDRAWAL PROCEDURE
GLOBALG.A.P STATUS
LOGO USE
© GLOBALG.A.P Secretariat | Page 78
GLOBALG.A.P FLOWERS AND ORNAMENTALS

Page 79
CONTENT OF THE STANDARD
TRACEABILITY
PROPAGATION MATERIAL
SITE HISTORY AND SITE MANAGEMENT
SOIL MANAGEMENT
FERTILIZER APPLICATION
IRRIGATION/FERTIGATION
INTEGRATED PEST MANAGEMENT
PLANT PROTECTION PRODUCTS
EQUIPMENT
PROPAGATION MATERIAL
SOIL AND SUBSTRATE MANAGEMENT
FERTILIZER USE
HARVESTING
POST-HARVEST TREATMENTS
PLANT PROTECTION PRODUCTS
© GLOBALG.A.P Secretariat | Page 79
GLOBALG.A.P FLOWERS AND ORNAMENTALS

Page 80
HOLISTIC APPROACH TO FARM ASSURANCE
GRASP to producers
Voluntary assessment – no impact on
the GLOBALG.A.P Certificate
Only applicable if a National
Interpretation Guideline is available
(local stakeholder consultation)
1 day individual training course for
GLOBALG.A.P auditors and inspectors
- one stop visit
National Interpretation Guidelines:
Austria, Brazil, Chile, Colombia, Costa
Rica, Kenya, Mexico, Morocco, South
Africa, Spain, Vietnam
GLOBALG.A.P RISK ASSESSMENT ON SOCIAL
PRACTICE (GRASP)
Principles:
• Raising Awareness on social issues
• Risk assessment – transparent results
via GLOBALG.A.P Database
• Providing implementation tools

Page 81
STEP-WISE APPROACH TO GLOBALG.A.P CERTIFICATION
© GLOBALG.A.P Secretariat | Page 81
PFA
Foundation
Level
PFA
Intermediate
Level
GLOBALG.A.P
• GLOBALG.A.P Primary Farm
Assurance (PFA): the response
for emerging markets
• Implementation through the
GLOBALG.A.P System following
member demands
• Implementation currently in the
USA, India, Poland, China,
Kenya, South Africa
GLOBALG.A.P AND SUSTAINABIILITY

Page 82
OUTLOOK
• We can display retailer specific
requirements in add-on
checklists (water usage,
sustainability requirements,
field passport)
• We cooperate with product
labeling initiatives which
• Engage in our Technical
Committees
© GLOBALG.A.P Secretariat | Page 82
GLOBALG.A.P FLOWERS AND
ORNAMENTALS

Page 83
Why are retailers so powerful?
Summary
Page 84
The basic difference between a supplier
and a wholesaler/retailer:
- the supplier depends on his
product
- the retailer can exchange
product A against product B
Summary

Page 85
Retailers have a profile via their
assortment – their product mix!
Summary

Page 86
Today’s retail is mass distribution: this is
only possible by international standards
Summary

Page 87
For the retailer the standard might be
even more important than the product
itself
Summary

Page 88
Standards as enablers for business have
to be created by TeamSpirit between all
stakeholders.
Summary

Page 89
Speaker:
Prof.Dr.Bernd Hallier
EHI Retail Institute
Spichernstraße 55
50672 Cologne
www.ehi.org
www.european-retail-academy.org
Thank you!