restriction mapping & southern blotting made simple
DESCRIPTION
Restriction Mapping & Southern Blotting Made Simple. Class instructions. In this lesson. Importance of complementary base pairing Importance of 5 ’ and 3 ’ ends of DNA Electrophoresis separates by size Blotting keeps the DNA in the same position - PowerPoint PPT PresentationTRANSCRIPT
Restriction Mapping &
Southern Blotting Made SimpleClass instructions

In this lesson• Importance of complementary base pairing• Importance of 5’ and 3’ ends of DNA• Electrophoresis separates by size• Blotting keeps the DNA in the same position• The bands visible on the blot are the labeled ones but other
DNA bands are still present• Southern blotting can be used to find exact matches or
similar matches• Dye labels are used instead of radioisotopes due to safety
considerations• How to interpret restriction maps and Southern blots• How restriction enzymes produce sticky ends
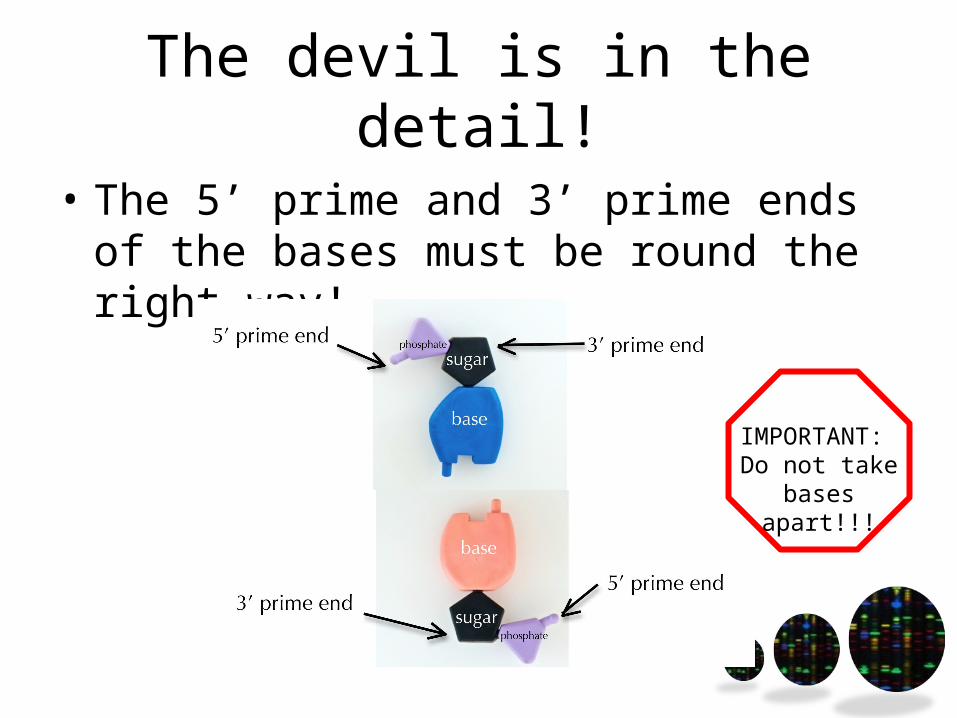
The devil is in the detail!
• The 5’ prime and 3’ prime ends of the bases must be round the right way!
IMPORTANT: Do not take
bases apart!!!
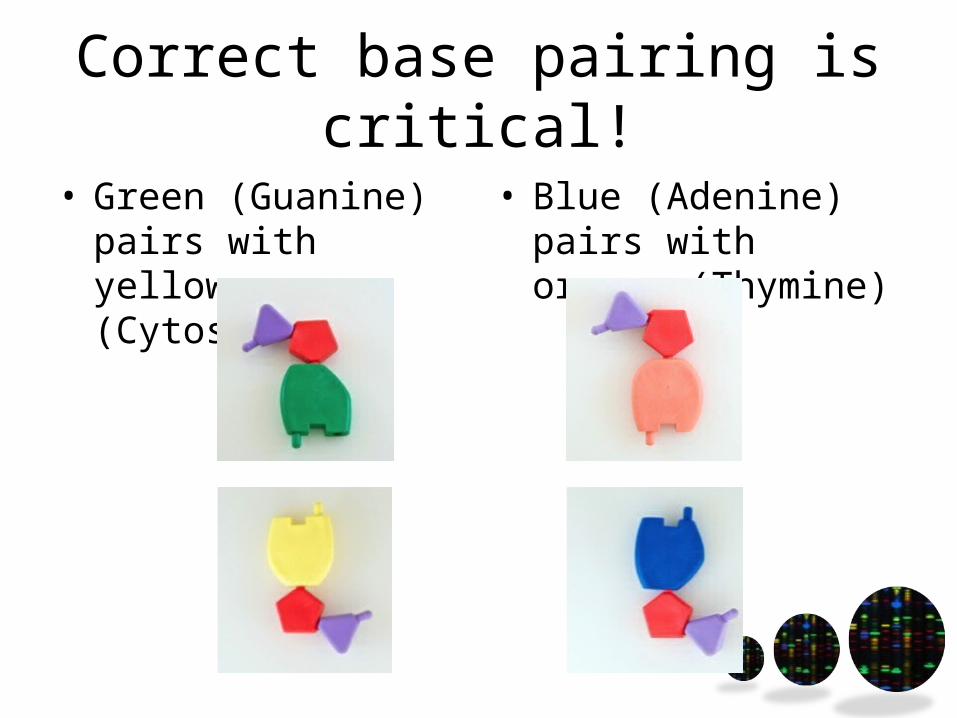
Correct base pairing is critical!
• Green (Guanine) pairs with yellow (Cytosine)
• Blue (Adenine) pairs with orange (Thymine)
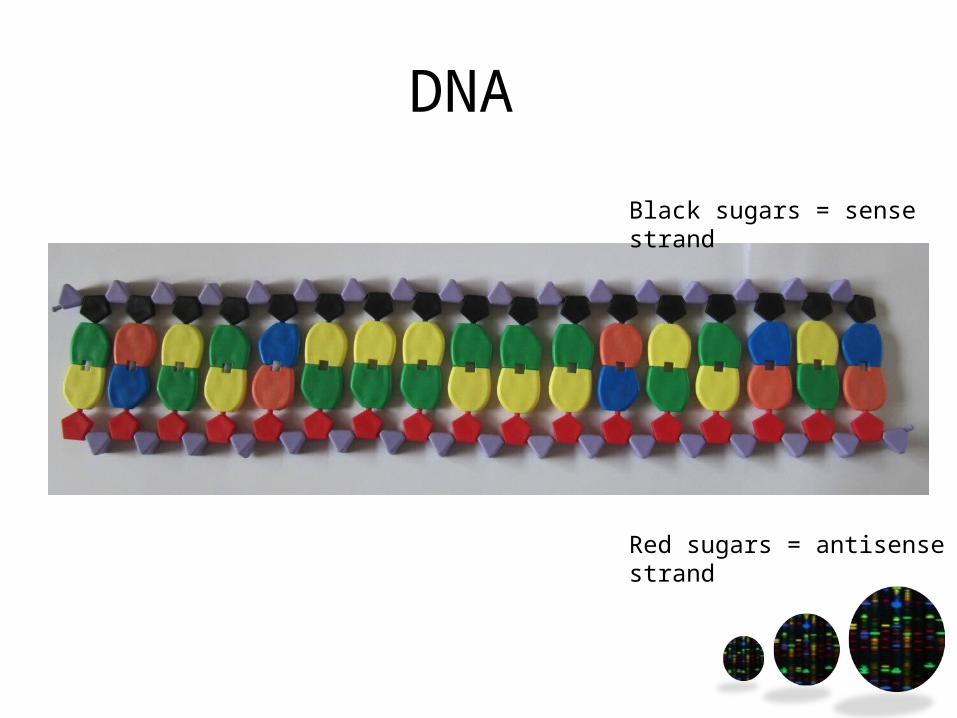
DNA
Black sugars = sense strand
Red sugars = antisense strand

Probe
• Single strand of DNA• Labeled with radioactivity• Used to visualise DNA• Sticks ONLY to sense strand (black
sugars)
The activity
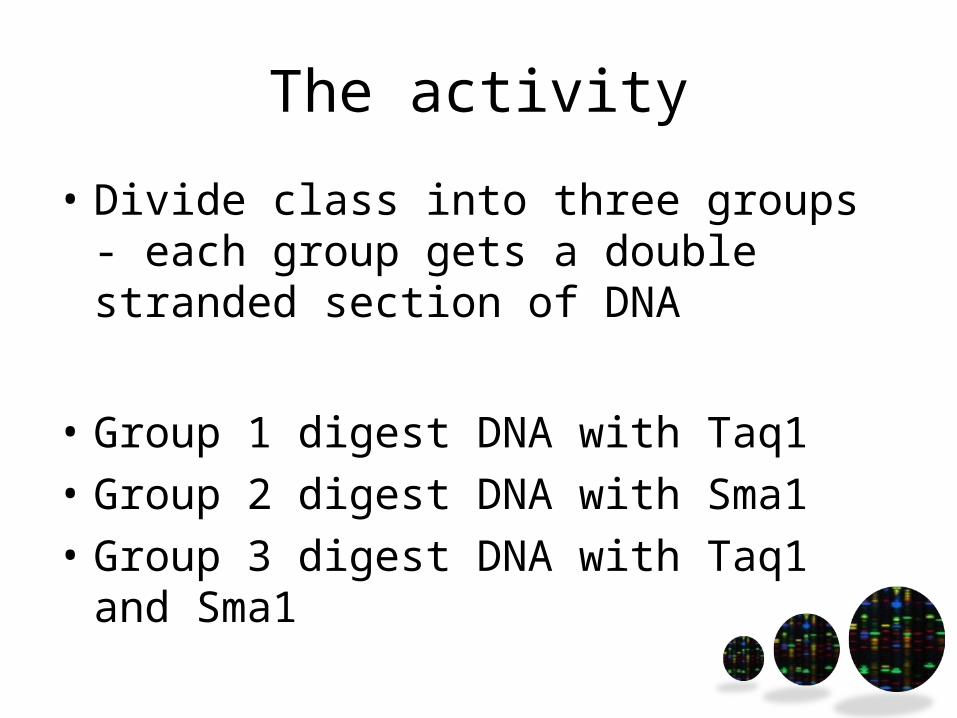
• Divide class into three groups - each group gets a double stranded section of DNA
• Group 1 digest DNA with Taq1• Group 2 digest DNA with Sma1• Group 3 digest DNA with Taq1 and
Sma1
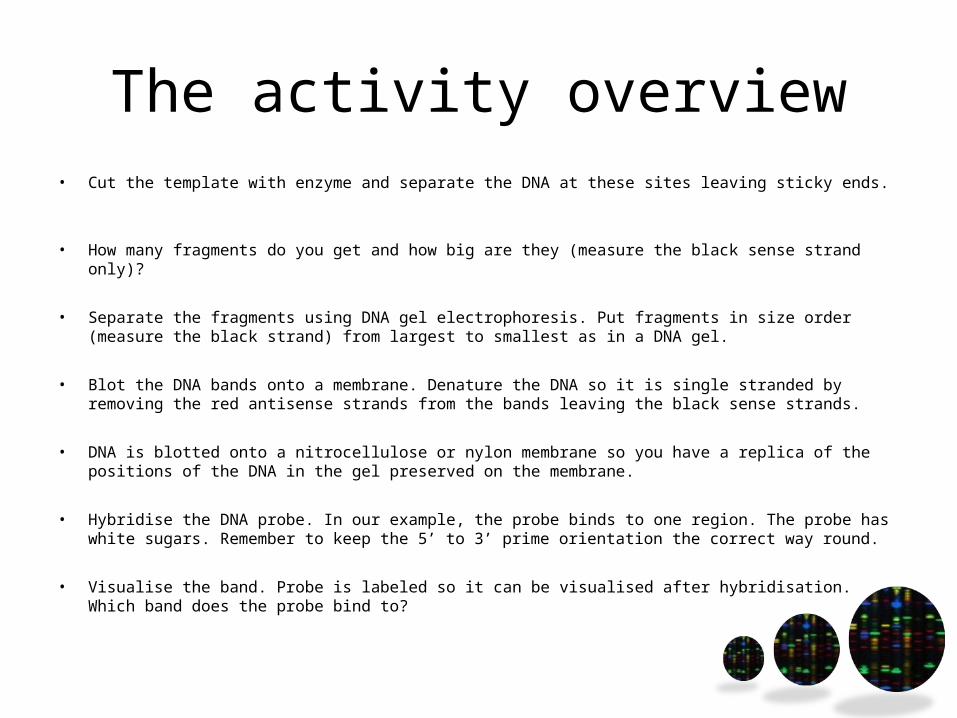
The activity overview• Cut the template with enzyme and separate the DNA at these sites leaving sticky ends.
• How many fragments do you get and how big are they (measure the black sense strand only)?
• Separate the fragments using DNA gel electrophoresis. Put fragments in size order (measure the black strand) from largest to smallest as in a DNA gel.
• Blot the DNA bands onto a membrane. Denature the DNA so it is single stranded by removing the red antisense strands from the bands leaving the black sense strands.
• DNA is blotted onto a nitrocellulose or nylon membrane so you have a replica of the positions of the DNA in the gel preserved on the membrane.
• Hybridise the DNA probe. In our example, the probe binds to one region. The probe has white sugars. Remember to keep the 5’ to 3’ prime orientation the correct way round.
• Visualise the band. Probe is labeled so it can be visualised after hybridisation. Which band does the probe bind to?
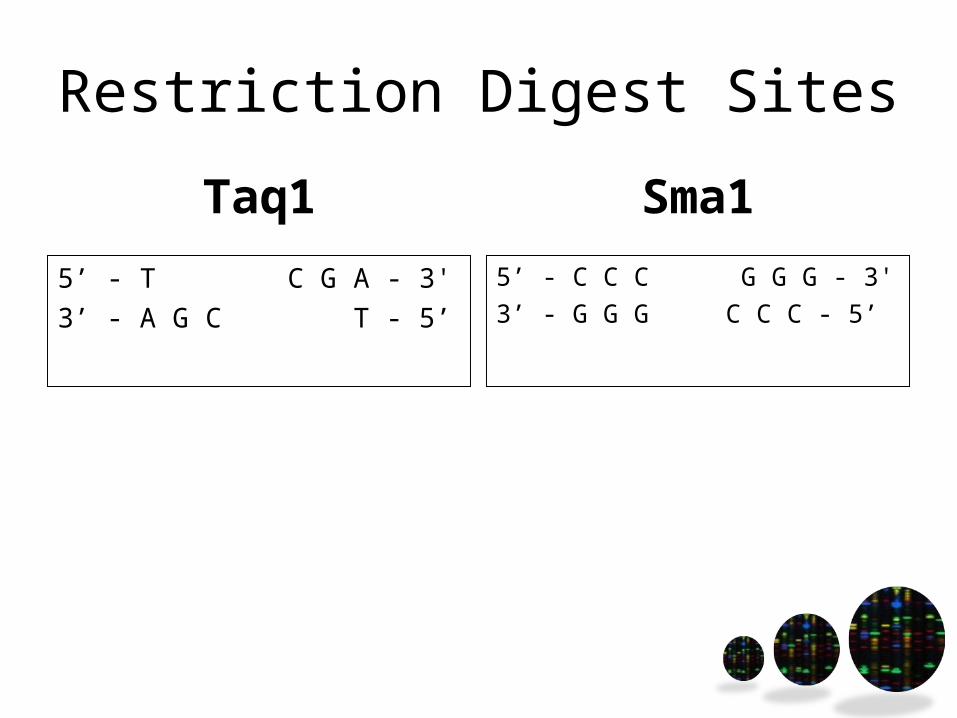
Restriction Digest Sites
Taq1
5’ - T C G A - 3'3’ - A G C T - 5’
Sma1
5’ - C C C G G G - 3'3’ - G G G C C C - 5’

Starting DNA
Black sugars = sense strand
Red sugars = antisense strand

Taq1 digest
probe is visible
BlotResult after
electrophoresis and denaturation
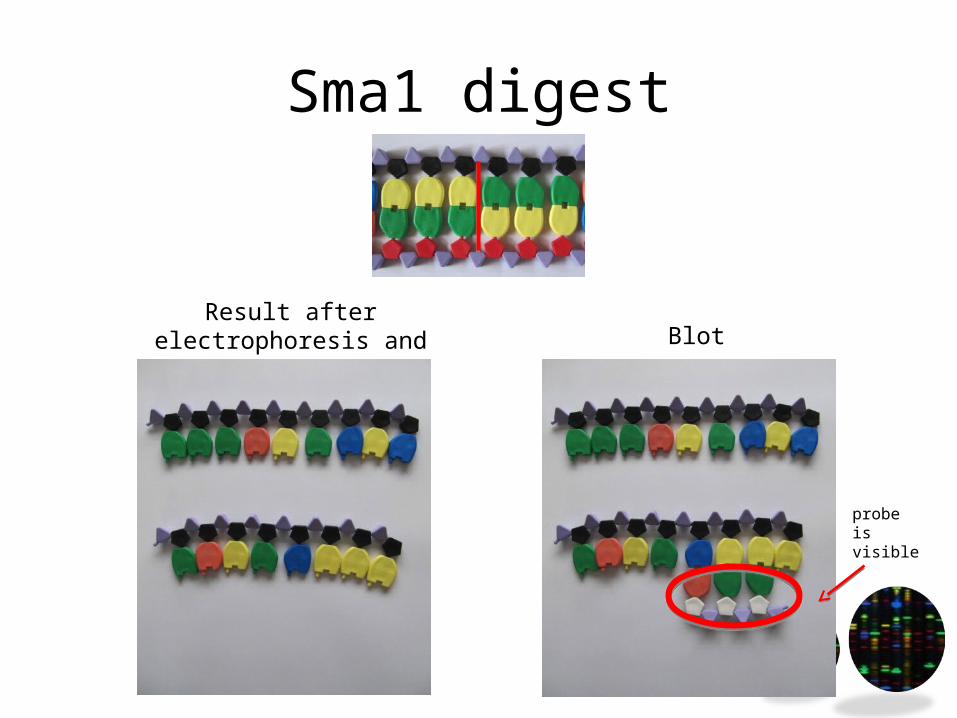
Sma1 digest
probe is visible
Result after electrophoresis and
denaturationBlot

Taq1& Sma1 double digest
probe is visible
Result after electrophoresis and
denaturation

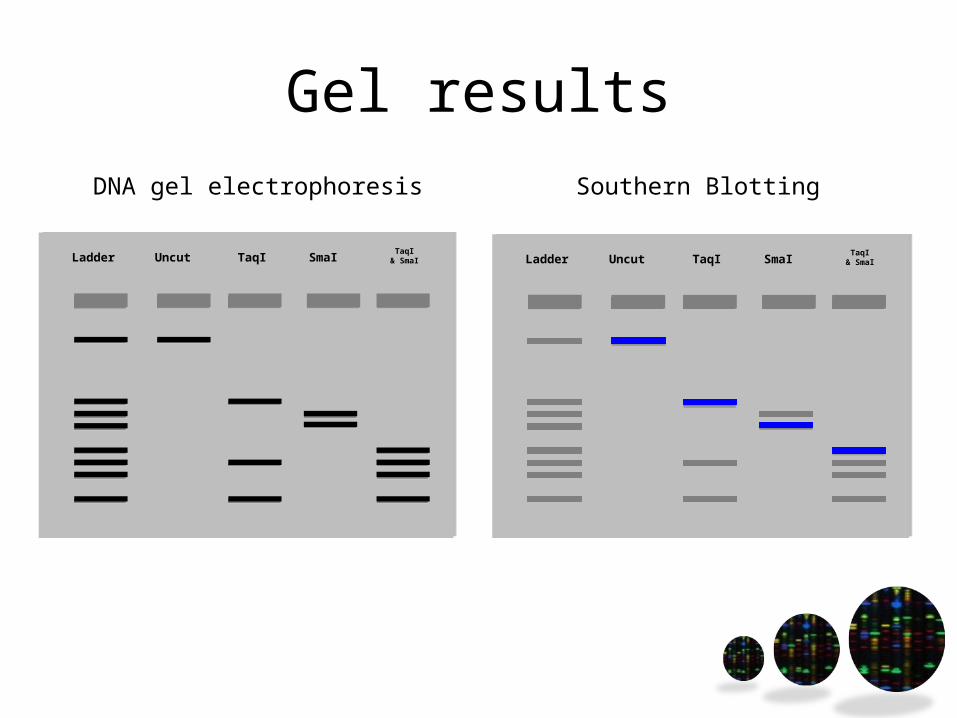
Gel results
Uncut TaqI SmaITaqI
& SmaILadder Uncut TaqI SmaITaqI
& SmaILadder
DNA gel electrophoresis Southern Blotting
Restriction mapping
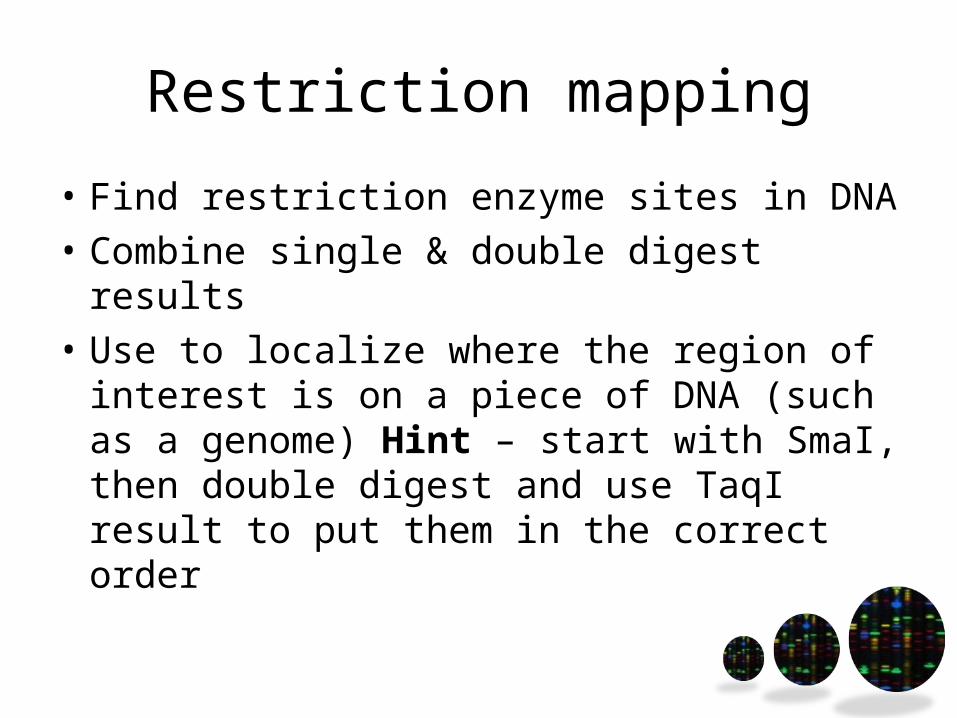
• Find restriction enzyme sites in DNA • Combine single & double digest
results• Use to localize where the region of
interest is on a piece of DNA (such as a genome) Hint – start with SmaI, then double digest and use TaqI result to put them in the correct order
Gel results
Uncut TaqI SmaITaqI
& SmaILadder Uncut TaqI SmaITaqI
& SmaILadder
DNA gel electrophoresis Southern Blotting

Restriction Mapping
Uncut
TaqI digest
SmaI digest
TaqI and SmaI digest
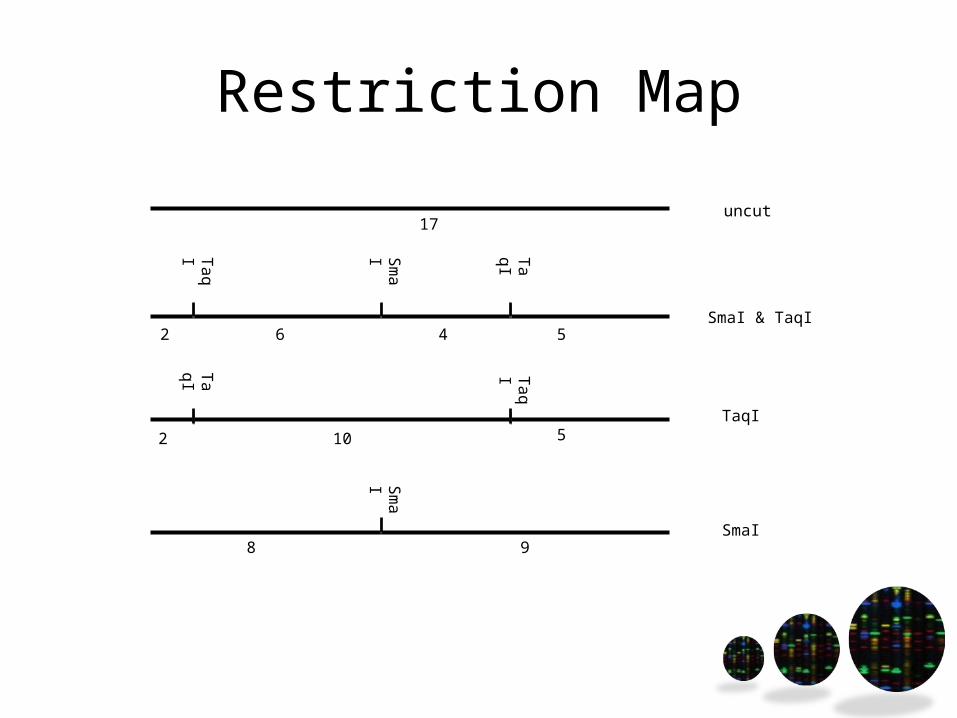
Restriction Map
SmaI
Ta
qITaqI
Ta
qI Taq
I
SmaI
uncut
SmaI & TaqI
TaqI
SmaI
17
62 54
102 5
8 9