respiration dr. zainab h.h dept. of physiology lec9,1o
TRANSCRIPT
RESPIRATION
Dr. Zainab H.HDept. of Physiology
Lec9,1o
objectives
Determine the factors that affect OHDC
Discriminate between Bohr & Haldane effect on O2 &CO2 transport
Describe the effect of respiration on acid – base balance of the blood
OHDC and Exercise
During mild exercise: venous PO2 decrease from 40 mmHg
to 30 mmHg change in percent saturation from 75% to 58%.
arterial percent saturation still 97%. The lowered venous percent
saturation indicates that more O2 has been unloaded to the tissues.
OHDC and Exercise
In the preceding example: 97% – 75% = 22% unloading at rest 97% – 58% = 39% unloading during mild exercise.
During heavier exercise, the venous PO2 can drop to 20 mmHg or lower, indicating a percent unloading of about 80%.
This occurs as a result of the lowered pH and increased temperature in exercising muscles.
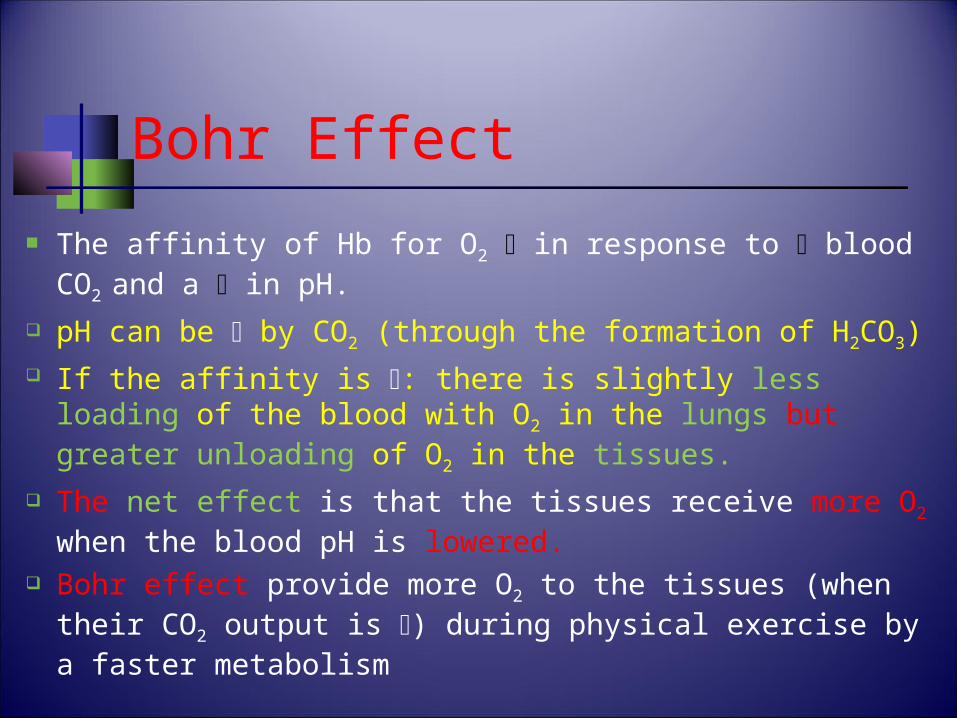
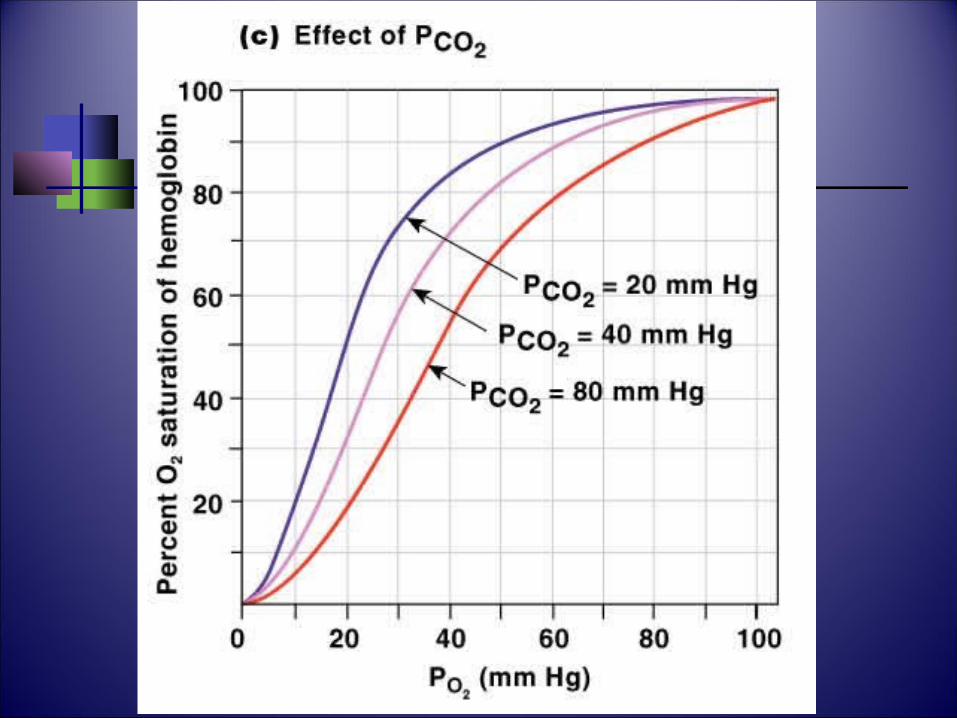
Bohr Effect The affinity of Hb for O2 in response to blood CO2 and
a in pH. pH can be by CO2 (through the formation of H2CO3) If the affinity is : there is slightly less loading of the
blood with O2 in the lungs but greater unloading of O2 in the tissues.
The net effect is that the tissues receive more O2 when the blood pH is lowered.
Bohr effect provide more O2 to the tissues (when their CO2 output is ) during physical exercise by a faster metabolism
Bohr Effect
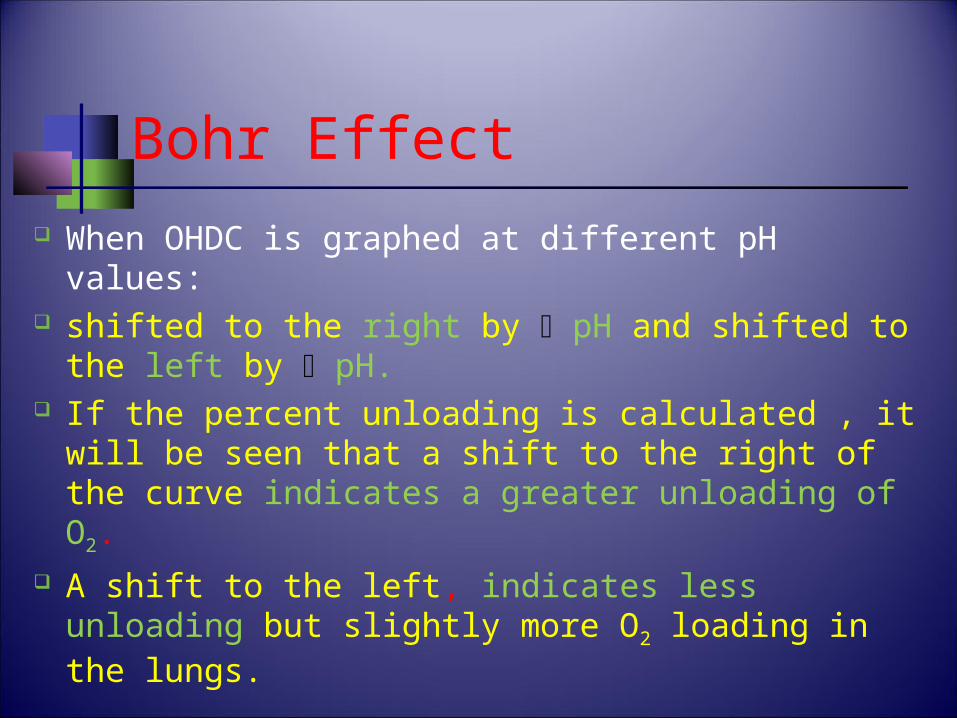
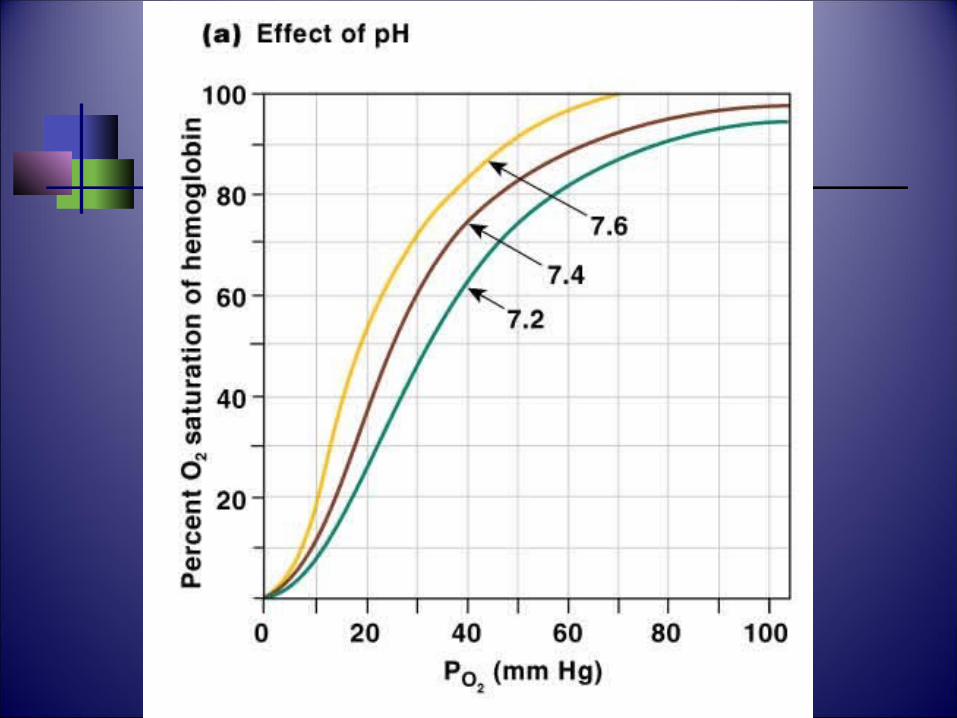
When OHDC is graphed at different pH values:
shifted to the right by pH and shifted to the left by pH.
If the percent unloading is calculated , it will be seen that a shift to the right of the curve indicates a greater unloading of O2.
A shift to the left, indicates less unloading but slightly more O2 loading in the lungs.
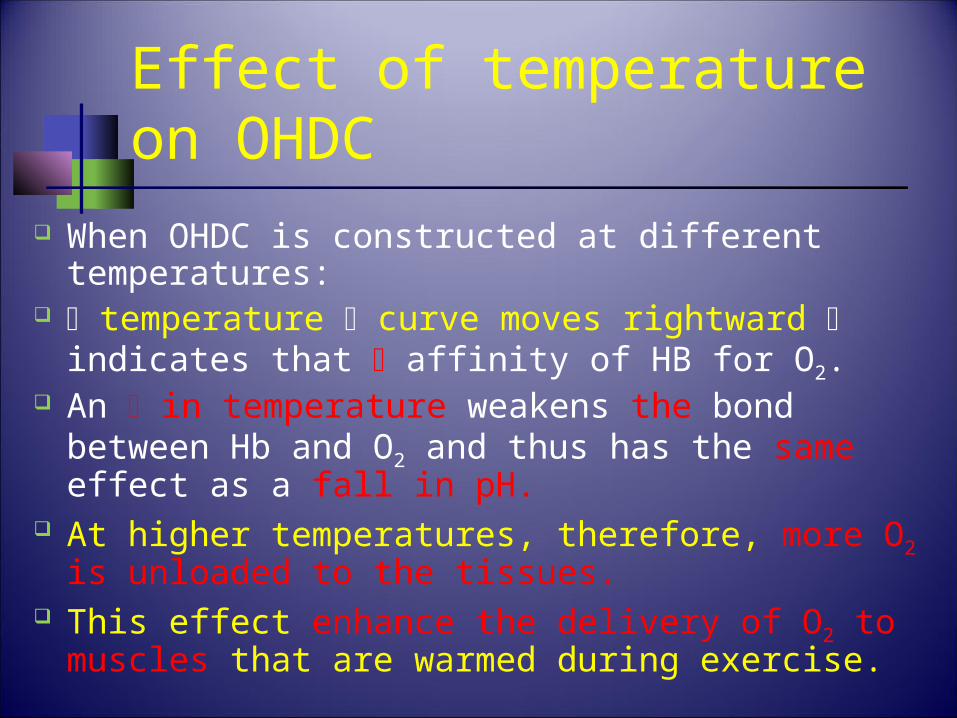
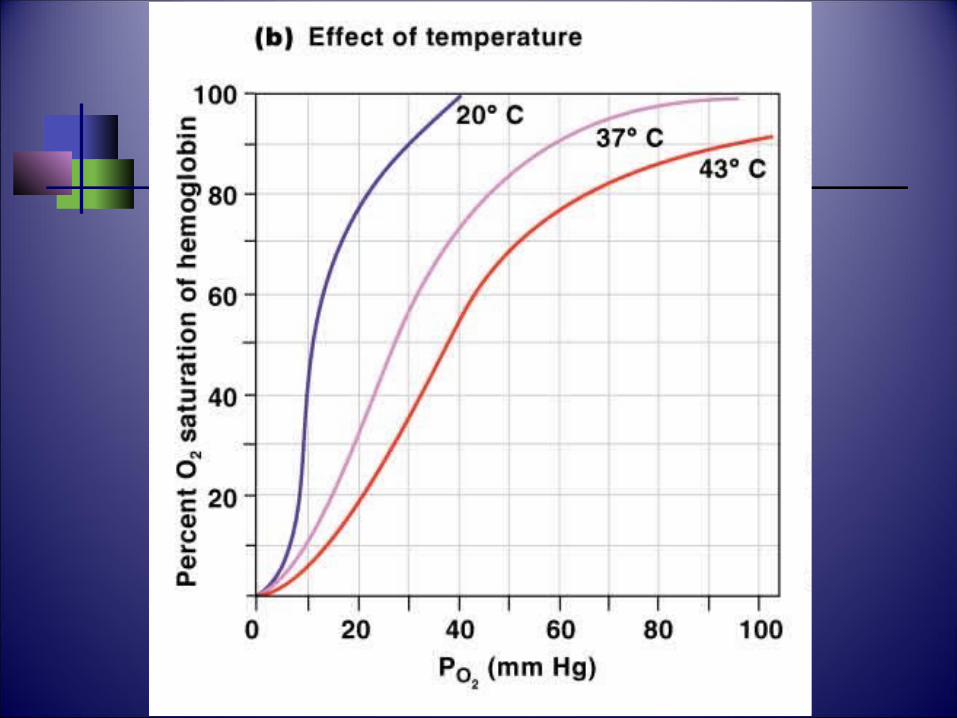
Effect of temperature on OHDC
When OHDC is constructed at different temperatures:
temperature curve moves rightward indicates that affinity of HB for O2.
An in temperature weakens the bond between Hb and O2 and thus has the same effect as a fall in pH.
At higher temperatures, therefore, more O2 is unloaded to the tissues.
This effect enhance the delivery of O2 to muscles that are warmed during exercise.
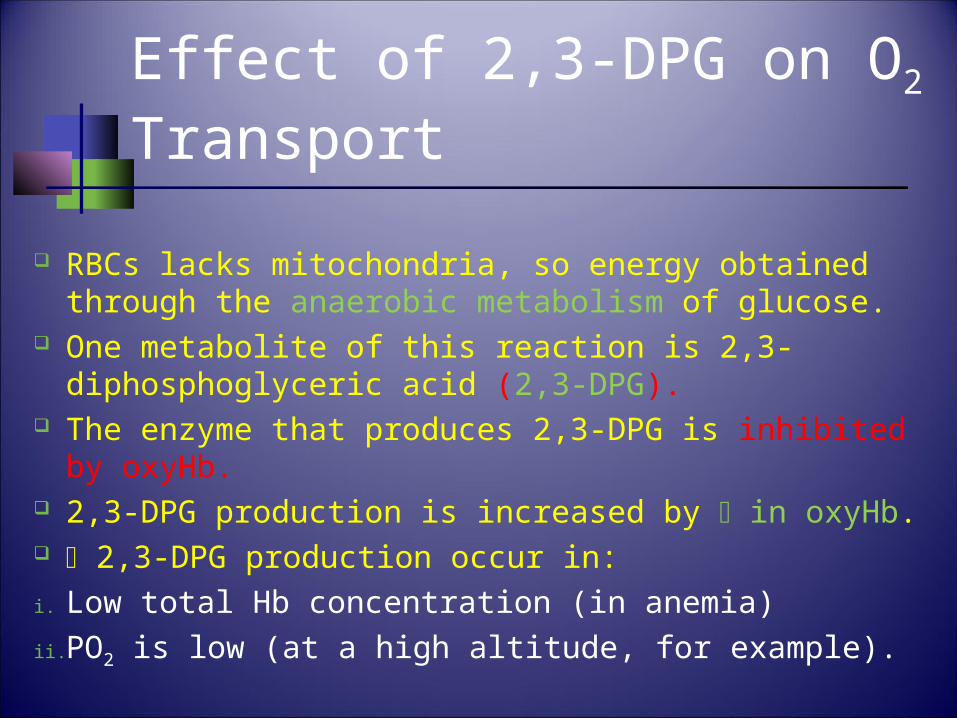
Effect of 2,3-DPG on O2 Transport
RBCs lacks mitochondria, so energy obtained through the anaerobic metabolism of glucose.
One metabolite of this reaction is 2,3-diphosphoglyceric acid (2,3-DPG).
The enzyme that produces 2,3-DPG is inhibited by oxyHb.
2,3-DPG production is increased by in oxyHb. 2,3-DPG production occur in:i. Low total Hb concentration (in anemia)ii. PO2 is low (at a high altitude, for example).

Effect of 2,3-DPG on O2 Transport
Bonding of 2,3-DPG with deoxyHb makes the latter more stable.
Therefore, a higher proportion of the oxyHb will be converted to deoxyHb by the unloading of its O2.
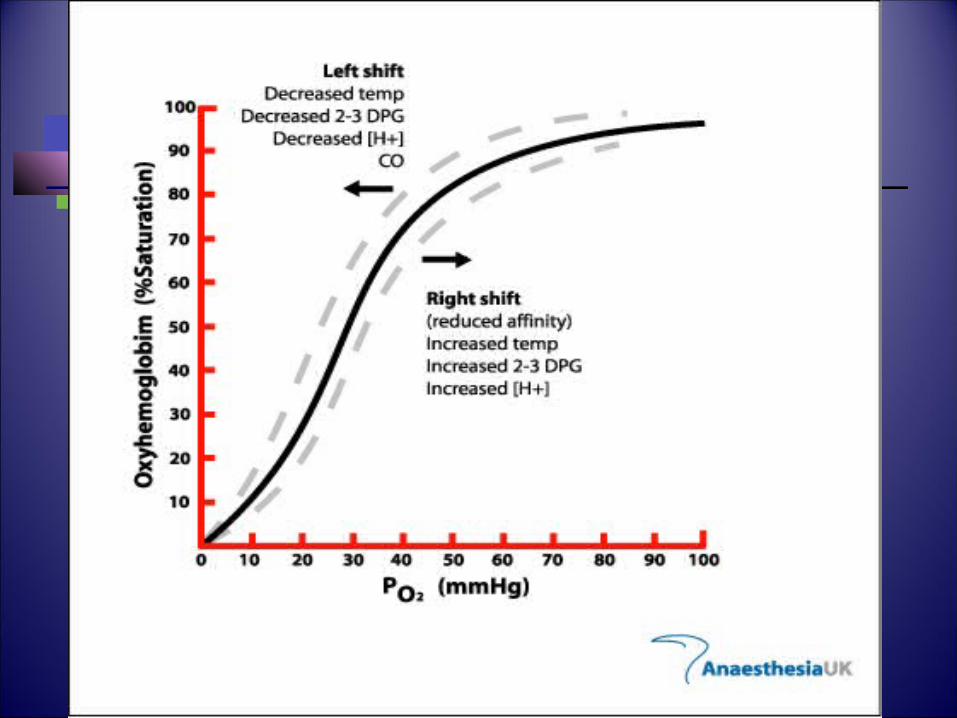
concentration of 2,3-DPG in RBCs increases O2 unloading and shifts the OHDC to the right.
Fetal Hemoglobin
Has 2 -chains in place of the -chains. Normal HbA in the mother is able to bind to 2,3-
DPG in contrast to HbF, and thus has a higher affinity for O2 than does HbA.
Since HbF can have a higher percent oxyHb than HbA at a given PO2, O2 is transferred from the maternal to the fetal blood through the placenta regardless of the PO2 in the maternal blood.
The dissociation curve of HbF is shifted to the left.
Anemia
Total Hb concentration below normal each RBC produces more 2,3-DPG.
Normal Hb concentration of 15g/100 ml unloads about 4.5 ml O2/100 ml at rest.
If the Hb concentration were by half? Under these conditions, as great as 3.3 ml
O2/100 ml is unloaded to the tissues. Because: rise in 2,3-DPG production causes
in the affinity of Hb for O2.
If the hemoglobin–O2 dissociationcurves shift to the right this could be caused by
(A) increased pH (B) decreased 2,3-
diphosphoglycerate (DPG) concentration (C) strenuous exercise (D) fetal hemoglobin (HbF) (E) carbon monoxide (CO) poisoning
Muscle Myoglobin Red pigment found in:
slow-twitch, aerobically respiring skeletal fibers cardiac muscle cells.
Differ from Hb, it has one heme combine with only one O2 molecule.
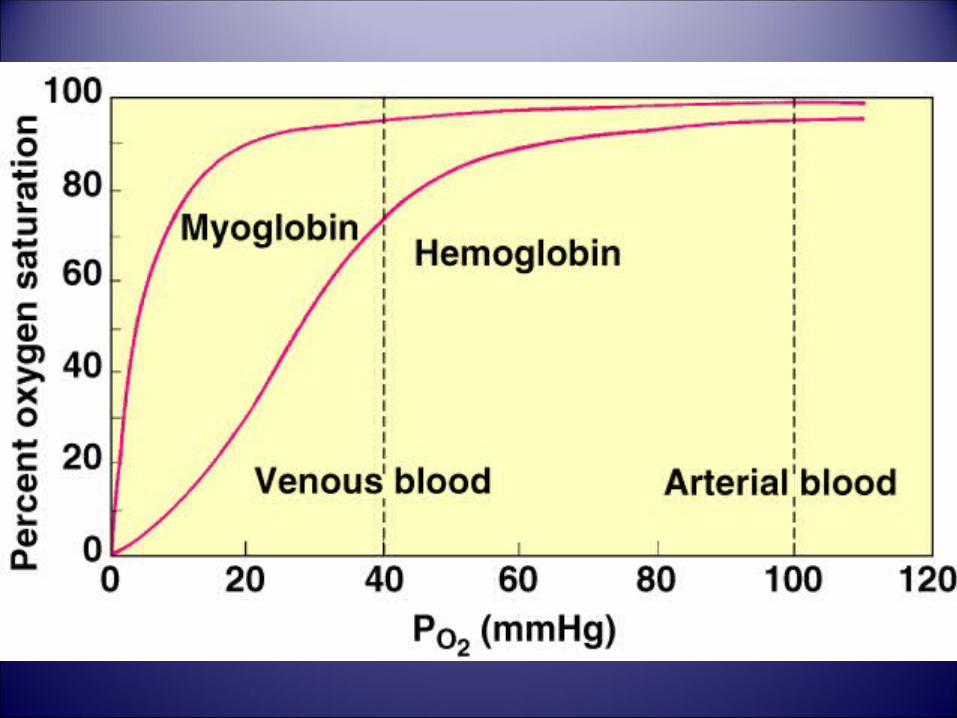
Has a higher affinity for O2 than Hb. Its dissociation curve is shifted to the left of OHDC. The shape of the curve is different from the OHDC
(rectangular), indicating that O2 will be released only when the PO2 becomes very low.
Muscle Myoglobin
Myoglobin may also have an O2-storage function, which is of particular importance in the heart.
During diastole, when the coronary blood flow is greatest, myoglobin can load up with O2. This stored O2 can then be released during systole, when the coronary arteries are squeezed closed by the contracting myocardium.
CO2 Transport
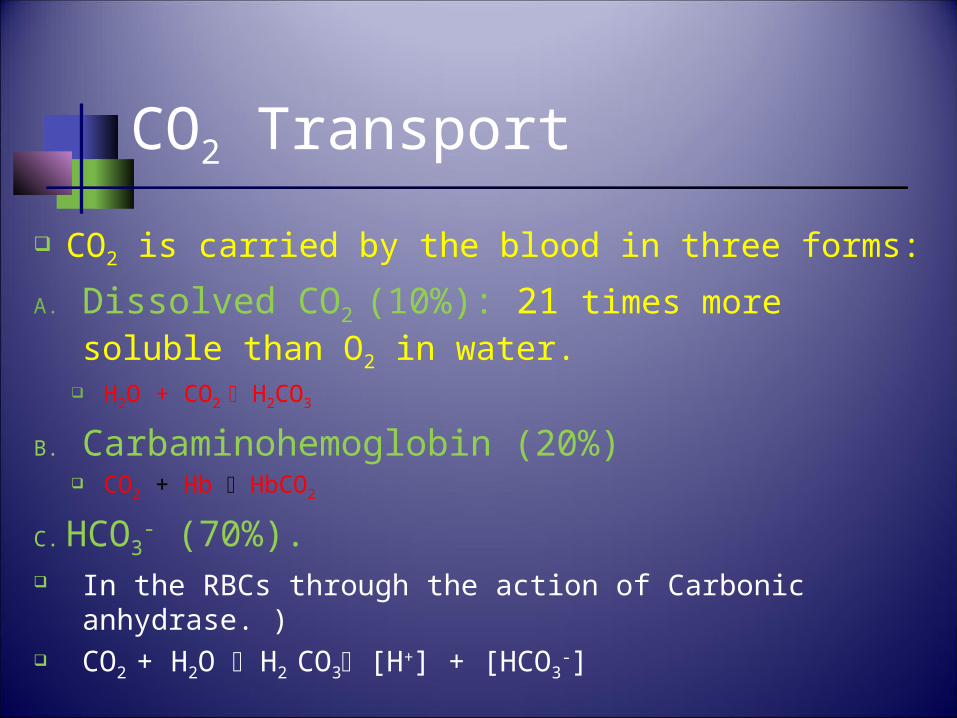
CO2 is carried by the blood in three forms:
A. Dissolved CO2 (10%): 21 times more soluble than O2 in water.
H2O + CO2 H2CO3
B. Carbaminohemoglobin (20%) CO2 + Hb HbCO2
C. HCO3- (70%).
In the RBCs through the action of Carbonic anhydrase. )
CO2 + H2O H2 CO3 [H+] + [HCO3-]
CO2 Transport
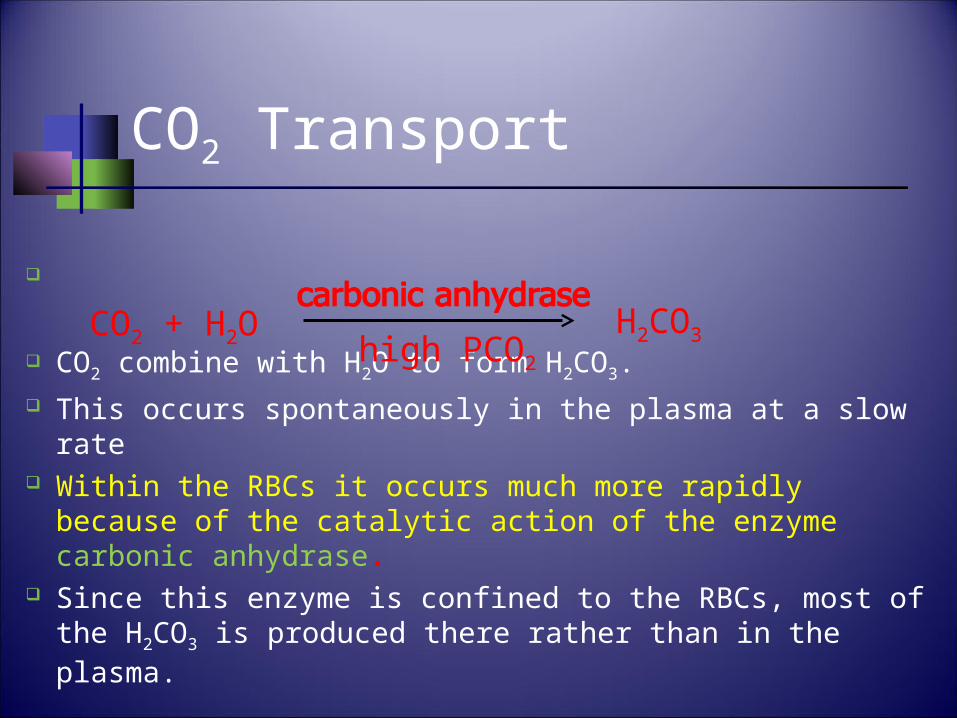
CO2 combine with H2O to form H2CO3. This occurs spontaneously in the plasma at a slow rate Within the RBCs it occurs much more rapidly because
of the catalytic action of the enzyme carbonic anhydrase.
Since this enzyme is confined to the RBCs, most of the H2CO3 is produced there rather than in the plasma.
CO2 + H2O
H2CO3high PCO2
Haldane Effect
Removal of O2 from Hb increases its affinity for CO2.
This allows CO2 to “ride” on the empty Hb.
Is opposite to the Bohr effect. Is quantitatively more important than
the Bohr effect. It promotes the transfer of CO2
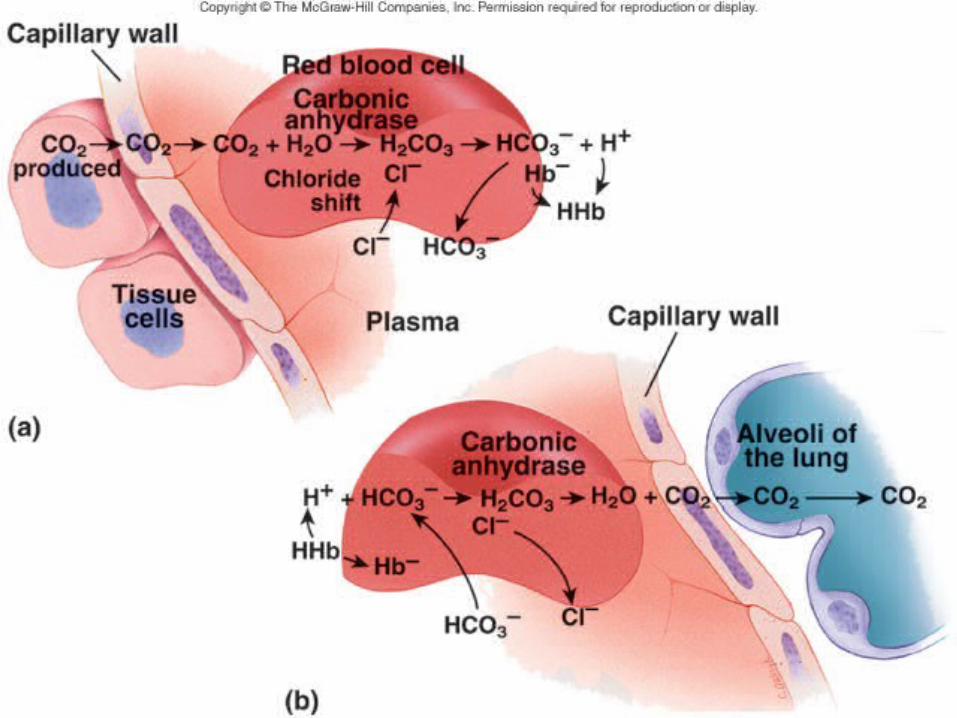
Cl- Shift at Systemic Capillaries
The buildup of H2CO3 concentrations within the RBCs favors the dissociation of these molecules into H+ and HCO3
-
H2CO3 H+ + HCO3-
The H+ released by the dissociation of H2CO3 are largely buffered by their combination with deoxyHb within the RBCs.
Cl- Shift at Systemic Capillaries
Most of the HCO3- formed (unlike H+) in
the RBC, diffuses out into the plasma. As a result: trapping of H+ within RBCs
and the outward diffusion of HCO3-
inside of the RBC gains a net positive charge.
This attracts Cl- to move into the red blood cells as HCO3
- moves out. This is known as the chloride shift.
Hamburger Effect
All of the HCO3- and Cl- generated following
CO2 carriage by the RBC increases the intracellular osmotic pressure.
This causes the cell to swell with extra H2O that diffuses through the cell membrane.
This is called “Hamburger effect.” This is why the haematocrit (HCT) of
venous blood is 3% higher than in arterial blood.
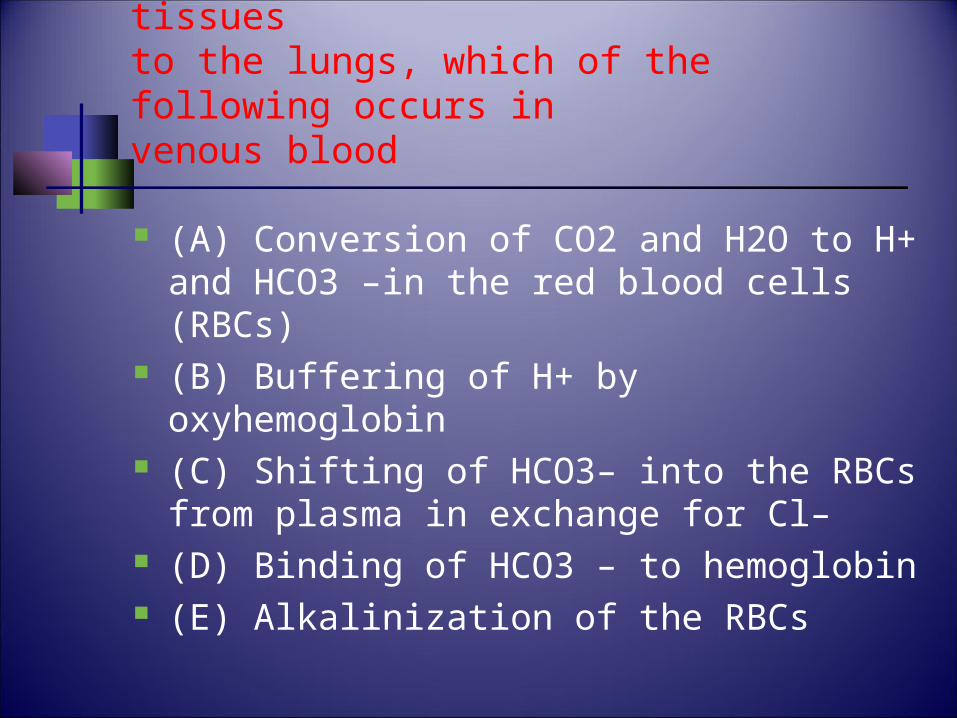
In the transport of CO2 from the tissuesto the lungs, which of the following occurs invenous blood
(A) Conversion of CO2 and H2O to H+ and HCO3 –in the red blood cells (RBCs)
(B) Buffering of H+ by oxyhemoglobin (C) Shifting of HCO3– into the RBCs from
plasma in exchange for Cl– (D) Binding of HCO3 – to hemoglobin (E) Alkalinization of the RBCs
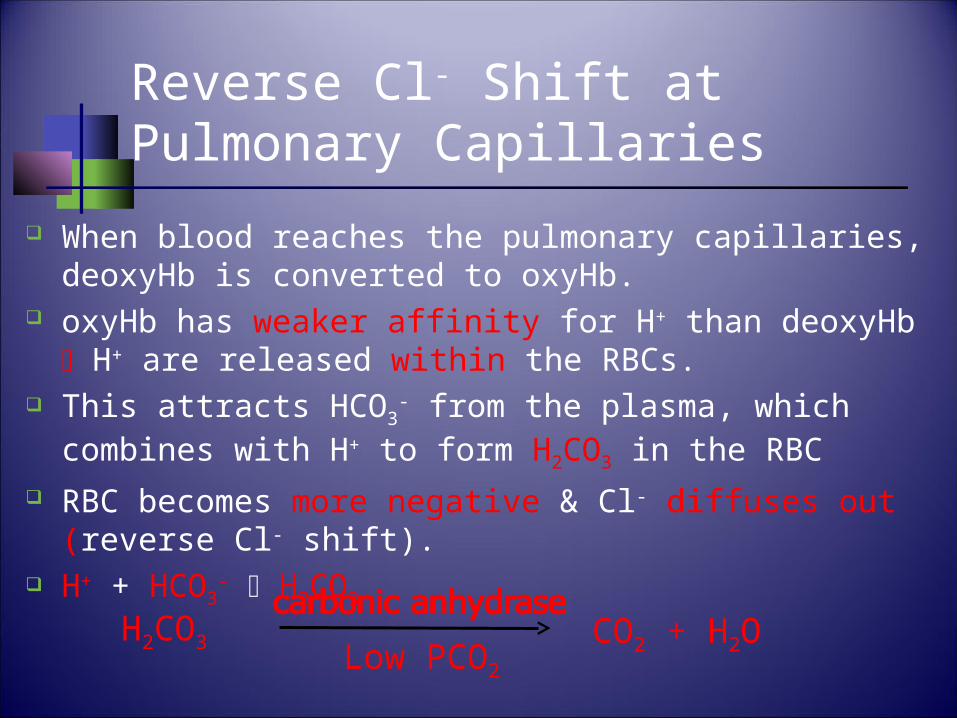
Reverse Cl- Shift at Pulmonary Capillaries
When blood reaches the pulmonary capillaries, deoxyHb is converted to oxyHb.
oxyHb has weaker affinity for H+ than deoxyHb H+ are released within the RBCs.
This attracts HCO3- from the plasma, which combines
with H+ to form H2CO3 in the RBC RBC becomes more negative & Cl- diffuses out
(reverse Cl- shift). H+ + HCO3
- H2CO3
CO2 + H2O
H2CO3 Low PCO2
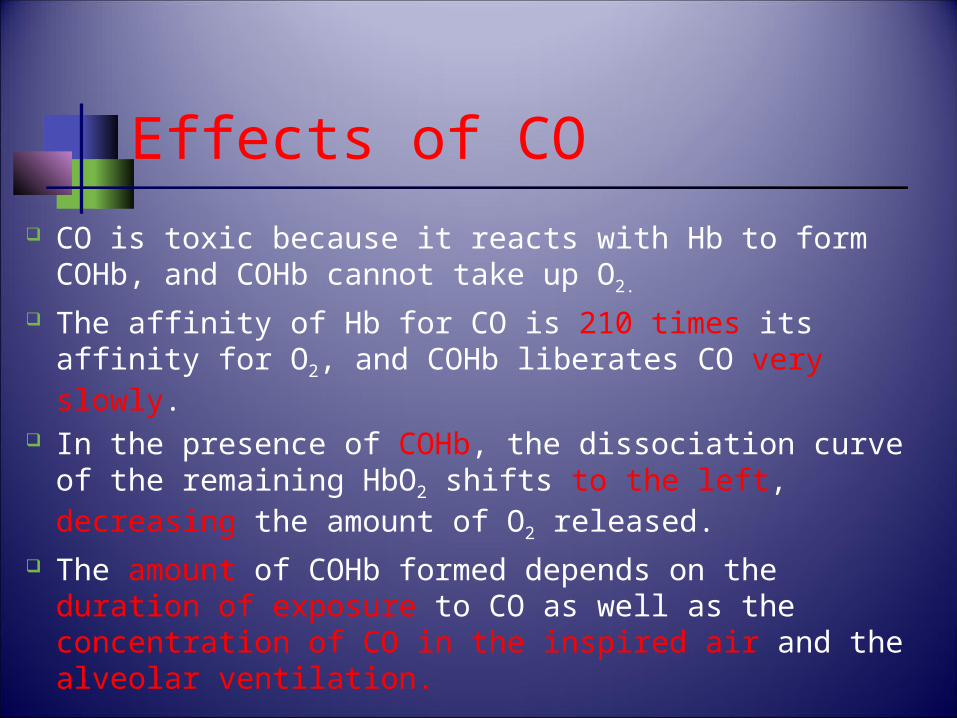
Effects of CO CO is toxic because it reacts with Hb to form COHb,
and COHb cannot take up O2.
The affinity of Hb for CO is 210 times its affinity for O2, and COHb liberates CO very slowly.
In the presence of COHb, the dissociation curve of the remaining HbO2 shifts to the left, decreasing the amount of O2 released.
The amount of COHb formed depends on the duration of exposure to CO as well as the concentration of CO in the inspired air and the alveolar ventilation.
Effects of CO
there is little stimulation of respiration because:A. arterial blood PO2 remains normal
B. carotid and aortic chemoreceptors are not stimulated.
The cherry-red color of COHb is visible in the skin, nail beds, and mucous membranes.
Death results when about 70–80% of the circulating Hb is converted to COHb.
Hypercapnia CO2 retention in the body. initially stimulates respiration, alveolar ventilation
increases and the extra CO2 is expired, but it accumulates when ventilation is compromised.
Retention of larger amounts produces confusion, diminished sensory acuity, and, eventually, coma with respiratory depression and death.
In patients with these symptoms, the PCO2 is markedly elevated, severe respiratory acidosis is present, and the plasma HCO3
– may exceed 40 mEq/L.
Hypercapnia Hypercapnia is exacerbated in ventilation–
perfusion inequality and when alveolar ventilation is inadequate when CO2 production is increased.
In febrile patients there is a 13% increase in CO2 production for each 1°C rise in temperature
High carbohydrate intake increases CO2 production because of the increase in the respiratory quotient.
Hypocapnia Resulted from hyperventilation. In voluntary hyperventilation, the arterial PCO2
falls from 40 15 mm Hg while the alveolar PO2 120 to 140 mm Hg.
Neurotic patients (chronically hyperventilate) show effects of hypocapnia.
Reduced cerebral blood flow by 30% or more (direct constrictor effect of hypocapnia on the cerebral vessels).
The cerebral ischemia causes light-headedness, Dizziness, Paresthesias.
Hypocapnia
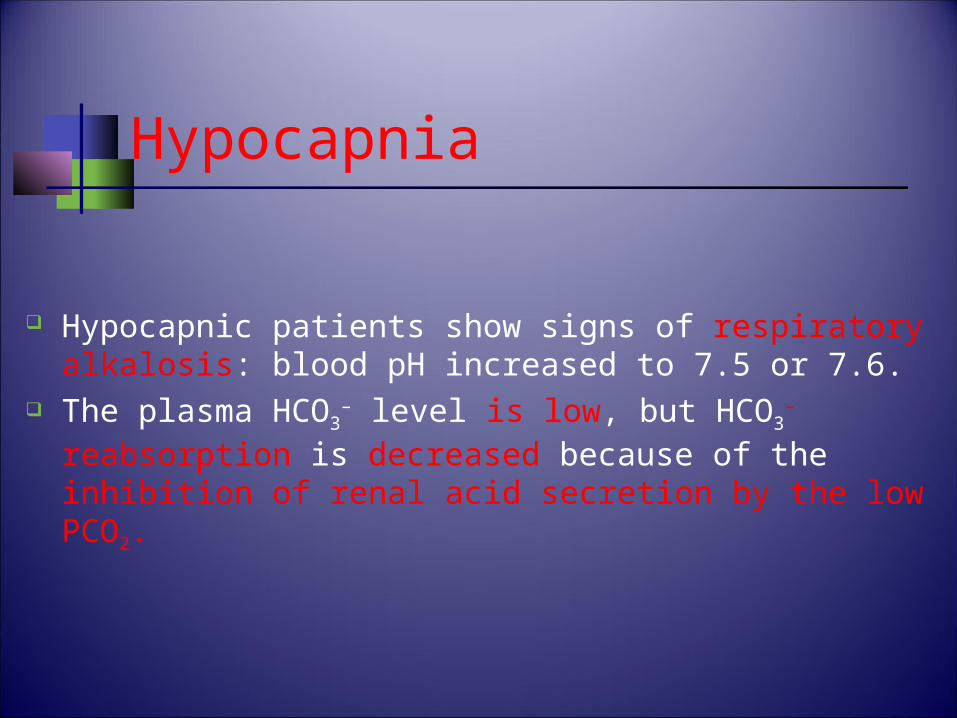
Hypocapnic patients show signs of respiratory alkalosis: blood pH increased to 7.5 or 7.6.
The plasma HCO3– level is low, but HCO3
– reabsorption is decreased because of the inhibition of renal acid secretion by the low PCO2.
Respiratory Acid-Base Balance
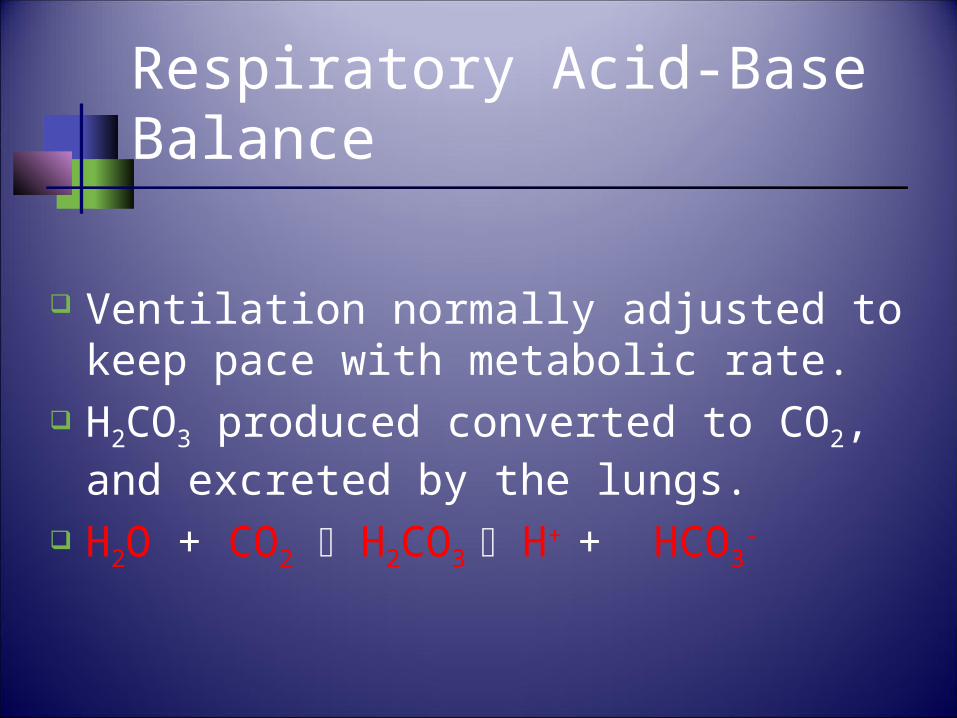
Ventilation normally adjusted to keep pace with metabolic rate.
H2CO3 produced converted to CO2, and excreted by the lungs.
H2O + CO2 H2CO3 H+ + HCO3-
Respiratory Acidosis
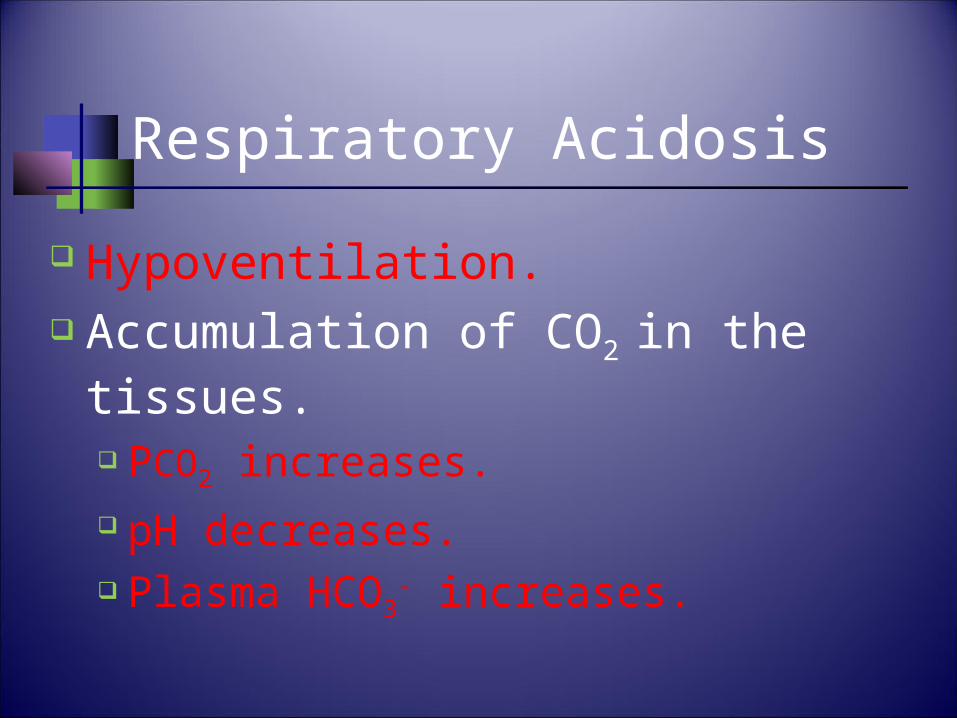
Hypoventilation. Accumulation of CO2 in the tissues.
PCO2 increases. pH decreases. Plasma HCO3
- increases.
Respiratory Alkalosis
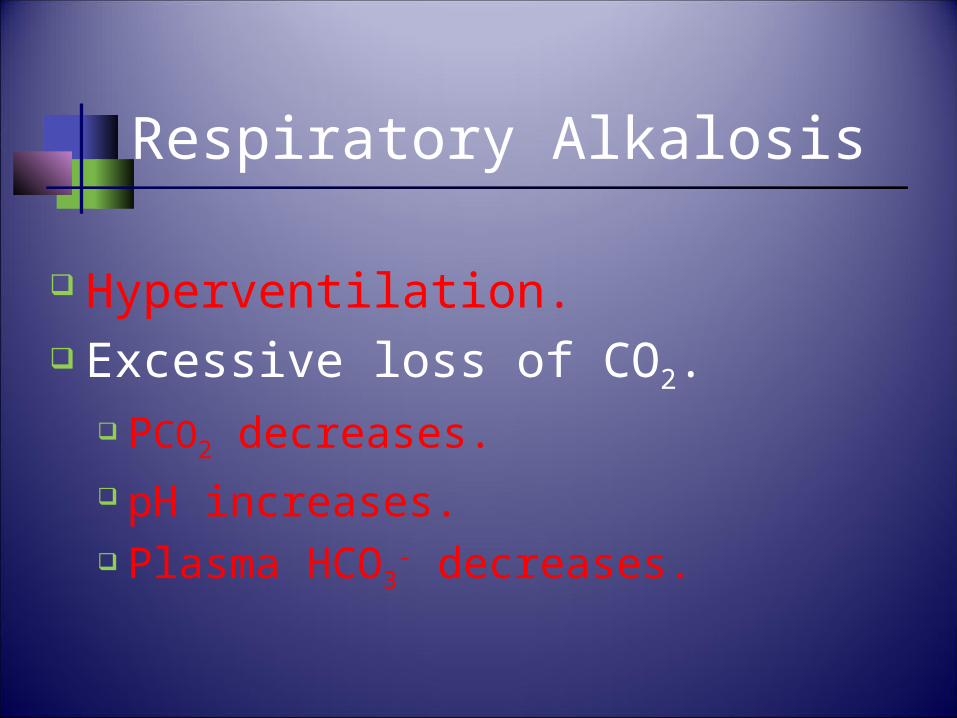
Hyperventilation. Excessive loss of CO2.
PCO2 decreases. pH increases. Plasma HCO3
- decreases.
In acid base balance the normal plasma PCO2 and bicarbonate levels are disturbed. Match the changes in these parameters given below with the disorders in the drop down list
Low plasma PCO2
High plasma PCO2
Decreased plasma bicarbonate (HCO3-)
Increased plasma bicarbonate HCO3-