resource progress curves in primavera p6 (print friendly view)
DESCRIPTION
Resource Progress Curves in Primavera P6TRANSCRIPT

22/08/2015 Resource Progress Curves in Primavera P6 (Print Friendly View)
http://www.projectcontrolsonline.com/Blogs/tabid/103/EntryId/105/ResourceProgressCurvesinPrimaveraP6.aspx 1/8
Resource Progress Curves in Primavera P6 Written by: 2/5/2013 12:22:00
This document discusses the features of P6 that currently link the actual and forecast resourcecurve, while touching on some of shortfalls in managing in P6. In depthcoverage of each feature described herein is beyond the scope of this document.
Displaying a contiguous resource curve linking the actual curve with the remaining curve hasoften seemed not possible in P6, due to most P6 teaching occurring only on the ResourceUsage Profile (where this is not possible). This ability is available in P6 using the ActivityUsage Profile or the Tracking feature.Note that Baseline options are not available in the Resource Usage Profile, only budgetedvalues. Budgeted values essentially do not work once you have progress in your schedule.
Question: What is the difference between Budgeted vs. Baseline? – They are NOT the same.
Sample Resource Usage Profile
The Remaining Units curve starts at zero (0). Planners would like the actual curve tolink with the remaining curve (like it did in P3).
The Budgeted Units are spread over the activity by the Planned Start and PlannedFinish dates of the activity, which will change when the data date moves (foractivities notstarted).
Note: There are no Baseline Units or Baseline Curves available in the ResourceUsage Profile.
Activity Usage Profile
Use the Activity Usage Profile in P6 to view cost or unit values over time according to theselected timescale. The Activity Usage Profile displays resource allocations for all activitiesor for select activities.
AM
the current resources

22/08/2015 Resource Progress Curves in Primavera P6 (Print Friendly View)
http://www.projectcontrolsonline.com/Blogs/tabid/103/EntryId/105/ResourceProgressCurvesinPrimaveraP6.aspx 2/8
This profile can display resource labor, units and costs with periodic vertical bars as well as avariety of cumulative curves (early, late, baseline, earned value (EV)) for periods based onthe selected timescale.
There are a variety of customization options available. Please read the P6 Help for additionalinformation or refer to your company P6 Training Manuals.
Sample Activity Usage Profile
Steps
1. Select View > Show on Bottom > Activity Usage Profile (on the )
2. Periodic amounts are displayed on the left axis, cumulative amounts on the right axis (Theyare not customizable)
3. Display the timescale in weeks for best results, unless your data date is the calendar monthend
toolbar

22/08/2015 Resource Progress Curves in Primavera P6 (Print Friendly View)
http://www.projectcontrolsonline.com/Blogs/tabid/103/EntryId/105/ResourceProgressCurvesinPrimaveraP6.aspx 3/8
4. Customize your headers and footers in Print Preview
To customize the activity usage profile options:
Select Display (or rightclick in the graph) >
Activity Usage Profile Options:
Steps to create an actual curve linked to a remaining units curve:
Resource load the schedule.
Create and assign a project baseline (allows use of the various Earned Value (EV) unitoptions)
In order to get the result desired, you will need to ensure you select the right cumulativecurves.
The Resource Units graph above was created using the following options (For Labor Units):
Baseline Bar
22/08/2015 Resource Progress Curves in Primavera P6 (Print Friendly View)
http://www.projectcontrolsonline.com/Blogs/tabid/103/EntryId/105/ResourceProgressCurvesinPrimaveraP6.aspx 4/8
Actual Bar
Actual Cumulative Curve
Remaining Early Bar
Planned Value Labor Units
Estimate at Completion – Labor Units
The Remaining Early Curve begins at the data date starting at 0 h (which was not the case in P3). Toget a linked curve, either use the Estimate at Completion – Labor Units curve or combine this curvewith the Actual curve to clearly differentiate between historical vs. forecast values.
One option is to show just the curves, without the periodic bars (i.e. just show the curves).
Note: If you remove the bars, some periodic values on the left of the graph will still show, but ignorethem (2, 4, 5, 6, 8 h etc.). Use the cumulative values on the right side of the graph.
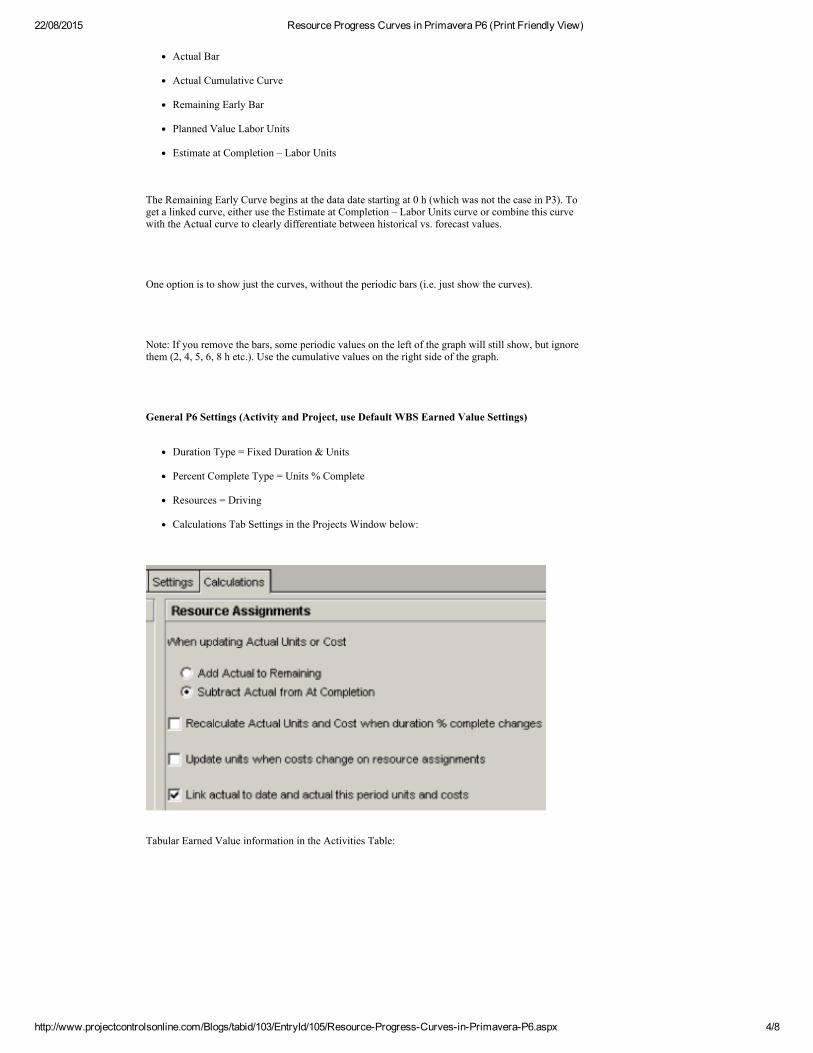
General P6 Settings (Activity and Project, use Default WBS Earned Value Settings)
Duration Type = Fixed Duration & Units
Percent Complete Type = Units % Complete
Resources = Driving
Calculations Tab Settings in the Projects Window below:
Tabular Earned Value information in the Activities Table:

22/08/2015 Resource Progress Curves in Primavera P6 (Print Friendly View)
http://www.projectcontrolsonline.com/Blogs/tabid/103/EntryId/105/ResourceProgressCurvesinPrimaveraP6.aspx 5/8
Note: The above columns have been renamed in this layout.
Tracking Feature:
Summary information all on one page
Provides resource analysis at the Project or WBS level
Tips:
Avoid using Budgeted Values or Curves once you have progress in the schedule.If you don’t have a baseline, you will be dependent on planned dates (which slide).

22/08/2015 Resource Progress Curves in Primavera P6 (Print Friendly View)
http://www.projectcontrolsonline.com/Blogs/tabid/103/EntryId/105/ResourceProgressCurvesinPrimaveraP6.aspx 6/8
Resource Actuals
To accurately capture resource actuals by period requires using the Financial Periods feature inP6, otherwise the overall actual curve will be incorrect as its spread over the activity lifetime.
In the company P6 Production & Staging databases, the financial periods are setup to match thecompany monthly fiscal period cutoffs. Due to P6 Limitations, there is no ability to have multiplevariations of financial periods in version (P6 8.2). The number of periods is limited andcannot overlap.
The cumulative individual actual resource curve for each resource is adjusted every time the data dateis moved until the resource is complete. The actual resource curve is spread based on the resourcecurve assigned, just like the forecast curve is spread. The cumulative curve is a sum of the parts.
The actual units are not stored, by default, by any period, but distributed based on the resource curveassigned (from the resource start date through the data date to the resource finish date.
This means the actual periodic amounts will be adjusted over the lifetime of the activity duration, asnew actuals (earned) are recorded for a resource assignment. This will affect the historical resourcecurves, as they are a rollup of all the activities resource assignments, distributed by the percentagesallocated to the assigned resource curve.
In Summary, do not rely on the accuracy of the historical progress data shown in P6. In order toachieve accurate historical data, store the periodic units in the financial periods feature in P6.The forecast bars and curves are accurate, but only the historical baseline or PV curve is accurate, notthe actual curve.
Resource assignment (historical) with no curve (linear by default)
Activity Usage Profile with a linear curve
more
the current
more

22/08/2015 Resource Progress Curves in Primavera P6 (Print Friendly View)
http://www.projectcontrolsonline.com/Blogs/tabid/103/EntryId/105/ResourceProgressCurvesinPrimaveraP6.aspx 7/8
Same Resource assignment with curve added
Note the significant adjustment of the actual units histogram and curve
Same Activity Usage Profile with a bellshaped curve (same data as above)
While the graphics in P6 are limited, particularly with customization capabilities, they do save timeversus customizing graphs in excel.
It is important, prior to proceeding down a P6 resource management path, to ensure that eachProjects understanding of the abilities of P6 are correct, prior to overcommitting and underdelivering.It is often seen that planners and projects embark on a complex path, without testing if the
will support the requirements.software
Popup Blocked Allow Once Allow Always Options
Related Searches
ConstructionEngineering
Civil Engineering
Project Controls
Project CostManagement
Construction AndProject Management
Construction Projects
Cost Engineering
?
Related Searchby Wander Burst

22/08/2015 Resource Progress Curves in Primavera P6 (Print Friendly View)
http://www.projectcontrolsonline.com/Blogs/tabid/103/EntryId/105/ResourceProgressCurvesinPrimaveraP6.aspx 8/8
Wander Burst Advertisement