resilient southeast exploring opportunities for solar
TRANSCRIPT

Technical Appendix
Res il i ent southeast
Exploring Opportunities for Solar+Storage in Five Cities

2 Resilient southeast: technical appendix
A B O U T T H I S R E P O R TResilient Southeast—Technical Appendix includes detailed supplementary information about the inputs, assumptions, and methodologies supporting the analysis results presented in the Resilient Southeast report series, which explores the obstacles and opportunities for solar PV and battery storage (solar+storage) to strengthen the resilience of communities throughout the Southeast. The series contains individual reports for five cities: Atlanta, GA; Charleston, SC; Miami, FL; New Orleans, LA; and Wilmington, NC. The Technical Appendix includes descriptions of economic modeling methodologies used in the analyses; the methodologies used to determine avoided outage costs; and the details relevant modeling inputs and assumptions. It presents detailed analysis results of evaluations for the potential economic opportunities resulting from the installations of solar alone or solar+storage systems at four types of facilities that could provide services during a disaster. The economic analysis was performed by The Greenlink Group
A B O U T T H I S R E P O R T S E R I E SResilient Southeast is a collection of reports that evaluates the current policy landscape and economic potential for solar and battery storage to provide clean, reliable backup power to critical facilities in five cities: Atlanta, GA; Charleston, SC; Miami, FL; New Orleans, LA; and Wilmington, NC. These reports are produced under the Resilient Power Project (www.resilient-power.org), a joint project of Clean Energy Group and Meridian Institute. The Resilient Power Project works to provide clean energy technology solutions in affordable housing and critical community facilities, to address climate change and resiliency challenges in disadvantaged communities. The Resilient Power Project is supported by The JPB Foundation, Surdna Foundation, The Kresge Foundation, Nathan Cummings Foundation, The New York Community Trust, Barr Foundation, and The Robert Wood Johnson Foundation.
The full report series, including a Series Overview, is available online at www.cleanegroup.org/ceg-resources/resource/resilient-southeast.
A C K N O W L E D G E M E N T SThe authors would like to thank Bryan Jacob at Southern Alliance for Clean Energy and Maria Blais Costello, Samantha Donalds, Meghan Monohan, and Lewis Milford at Clean Energy Group for their valuable input and review of this report. Much appreciation also for the generous support of the foundations and organizations funding this work, in particular, The New York Community Trust for their support of Clean Energy Group’s targeted work in the Southeast. The views and opinions expressed in this report are solely those of the authors.
D I S C L A I M E RThis document is for informational purposes only. The authors make no warranties, expressed or implied, and assume no legal liability or responsibility for the accuracy, completeness, or usefulness of any information provided within this document. The views and opinions expressed herein do not necessarily state or reflect those of funders or any of the organizations and individuals that have offered comments as this document was being drafted. The authors alone are responsible for the contents of this report. Before acting on any information you should consider the appropriateness of the information to your specific situation. The information contained within is subject to change. It is intended to serve as guidance and should not be used as a substitute for a thorough analysis of facts and the law. The document is not intended to provide legal or technical advice.

E x P LO R I N G O P P O R T u N I T I E S F O R S O L A R + S TO R AG E I N F I V E C I T I E S 3
COvER PHOTO :
apollo elementary school in titusville, Fl lost power during hurricane irma and used a solar+storage system to power emergency lights and charge cell phones. this installation is part of the sunsmart emergency shelters program. Nick Waters, Florida Solar Energy Center
REPORT DES IGN & PRODUCT ION:
David Gerratt/NonprofitDesign.com
Contents
4 introduction
7 Research objectives
9 economic Modeling Metholodogy
10 avoided outage costs
12 economic Modeling inputs and assumptions
21 economic Modeling Results
22 Atlanta, GA
24 Charleston, SC
26 Miami, FL
28 New Orleans, LA
31 Wilmington, NC
33 endnotes
A U T H O R S
Seth MullendoreMarriele RobinsonClean Energy Group
A N A LY T I C A L S U P P O R T
Matt CoxXiaojing SunThe Greenlink Group
C l e a n e n e r g y g r o u pClean Energy Group (CEG) is a leading national, nonprofit advocacy organization working on innovative policy, technology, and finance strategies in the areas of clean energy and climate change. CEG promotes effective clean energy policies, develops new finance tools, and fosters public-private partnerships to advance clean energy markets that will benefit all sectors of society for a just transition. CEG created and manages The Resilient Power Project (www.resilient-power.org) to support new public policies and funding tools, connect public officials with private industry, and work with state and local officials to support greater investment in power resiliency, with a focus of bringing the benefits of clean energy to low-income communities. www.cleanegroup.org
T h e g r e e n l i n k g r o u pGreenlink is an Atlanta-based energy research and consulting firm equipped with sophisticated analytical technologies and deep industry knowledge in the clean energy space, receiving accolades from MIT and Georgia Tech, among others. Greenlink provides the evidence and expert analysis needed to evaluate the most pressing issues faced by today’s energy market, namely the integration of a wide range of clean energy options, such as energy efficiency in buildings, demand side management, and centralized and distributed renewable resources. www.thegreenlinkgroup.com
O R G A N I Z AT I O N D E S C R I P T I O N S
4 Resilient southeast: technical appendix
Introduction
Resilient Southeast is a series of reports designed to explore the obstacles and opportunities for solar photovoltaic (PV)
and battery storage to strengthen the resilience of communities throughout the Southeast.
As natural disasters continue to increase in occurrence and severity, the impacts are becoming progressively more severe, and recovery is taking longer. The last two hurricane seasons, with Harvey, Irma, and Maria batter-ing the Southeast in 2017 and Florence and Michael in 2018, have heightened awareness of the fragility of the centralized power grid and the need for more local energy resilience. Major hurricanes left hundreds of thousands of homes, businesses, and community facilities without power across the coastal Southeast.
Vulnerable populations are disproportionately impacted and face increased risk as prolonged power outages become the norm post disaster. Community facilities such as schools, nursing
homes, fire stations, and multifamily housing are increasingly turned to for emergency services and shelter. Ensuring that these facilities can provide critical services, including access to electricity, in the event of an emergency will require investments in energy resilience.
The combination of solar PV and battery storage (solar+storage) offers an innovative alternative to traditional backup generators. While diesel generators are often considered the default solution for energy resilience, they do not necessarily represent the most reliable solution—requiring regular maintenance to avoid failure and subject to disruptions in fuel supply—and they produce negative exter-nalities such as excessive noise and pollution. Solar+storage can deliver reliable backup power during outages and savings through-out the year, leading building owners to increasingly consider and implement the technologies in resilient power solutions.

E x P LO R I N G O P P O R T u N I T I E S F O R S O L A R + S TO R AG E I N F I V E C I T I E S 5
Research Objectives
The purpose of this report series is to evaluate the opportunity for solar+storage to provide clean, reliable, onsite backup
power to critical facilities located across hurri-cane-prone areas of the Southeast. To accom-plish this, Clean Energy Group partnered with The Greenlink Group, an Atlanta-based energy research and consulting firm, as well as local and regional partners to assess the economic, policy, and regulatory landscape for solar+storage for multiple facility types in five cities: Atlanta, GA; Charleston, SC; Miami, FL; New Orleans, LA; and Wilmington, NC. The analysis was applied to four building types: a secondary school, a nursing home, a fire station, and a multifamily housing property. The analysis and landscape review have three primary objectives:
1. Evaluate specific economic opportunities for deployment of customer-sited solar PV and battery storage under current market conditions.
2. Identify local and regional market, policy, and regulatory opportunities and barriers impacting solar+storage deployment.
3. Propose potential solutions to enable greater deployment of solar+storage to enhance energy resilience throughout the Southeast.

6 Resilient southeast: technical appendix
Economic Modeling Methodology
Two scenarios were explored to evaluate the economic opportunity for customer-sited solar and battery storage systems
in four building types across the five South-eastern cities:
1. econoMic scenaRio: The economic scenario evaluates the most cost-effective system configuration based on available electric bill savings opportunities and incentives.
The goal of the economic scenario is to maximize the net present value of the evalu-ated systems over a 25-year period.1 The 25-year period is assumed to be the viable useful life of an installed solar+storage system, assuming battery and inverter replacement after year 15. In cases where a solar or battery storage system installation would not result in a positive net present value (NPV), the most economic scenario is assumed to be the business-as-usual case where no solar or storage system is installed.
2. Resilient scenaRio: The resilient scenario evaluates solar+storage system configurations capable of providing onsite backup power to critical loads for a significant period of time.
The goal of the Resilient scenario is to model a system capable of providing at least several hours of backup power to keep critical services at a facility operational during a grid power outage. The scenario requires that both solar PV and battery storage are installed regardless of the economics of the system. In some cases, the resilient scenario may recommend systems with a negative NPV, indicating that the lifetime cost of the system would outweigh savings realized over time.
In addition to electric bill savings and available incentives, the resilient scenario also explores the economics of the solar+ storage system by factoring in a value for avoided outage costs. The value of avoided outage costs is only considered in evaluating the economic potential of a solar+storage system. The value is not factored into the cost-optimal sizing of components, so a Resilient scenario with avoided outage costs included will have the same size solar and battery storage components as the resilient scenario without avoided outage costs factored in. These avoided outage costs, or improved resilience benefits, are discussed in more detail in the next section.
It is important to note that the Resilient scenario does not account for any of the additional costs associated with making a solar+storage system able to disconnect from the grid and operate independently during a grid disruption, a process known as islanding. Added expenses vary depend-ing on the project and may include additional hardware components, such as a transfer switch or critical load panel; software com-ponents; electrical design complexity, such as isolating critical loads; and permitting costs. These factors must all be considered when determining the full cost of a solar+ storage system designed to deliver backup power.
The two scenarios were applied to four build-ing types: a secondary school, a nursing home, a multifamily housing property, and a fire station. The four building types were selected as a representative proxy for facilities providing critical community services in a disaster, with schools representing emergency shelters, fire stations representing disaster response, nursing homes representing health care services, and

E x P LO R I N G O P P O R T u N I T I E S F O R S O L A R + S TO R AG E I N F I V E C I T I E S 7
Economic Modeling Methodology
F igure 1
How Demand Charge Affect Project Economics
multifamily housing representing residential community shelter-in-place facilities.
To understand the economic viability of solar+ storage for these facilities, the costs of the systems were evaluated against modeled electric bill savings over time. To accomplish this, hourly electricity usage load profiles were generated for each building (see the Economic Modeling Inputs and Assumptions section for
detailed information on how this was done). These load profiles were then modeled against utility electric rate tariffs to determine energy and demand charge savings that could be realized throughout the projected life of the systems.2 Figure 1 illustrates the difference between energy and demand charges and how battery storage can be dispatched to reduce a building’s demand.
How Energy Storage Can Reduce Demand ChargesDemand is the total amount of electric load required by the customer’s electric equipment
operating at any given time. utilities assess demand charges based on the highest average demand, (i.e. Peak Demand) that occurs over any interval (usually 15-minutes) during each billing period, and it is measured in kilowatts. utilities assess energy consumption charges based on the total
amount of electricity consumed over any period, and it is measured in kilowatt-hours.
© Clean energy group
Morning
PEAK DEMAND
Mid-day Night Morning Mid-day Night Morning Mid-day Night
Building aHas high energy consumption and
reaches the same high level of demand throughout the day and night
In scenario 1, Building A and Building B will incur the same peak demand charges over the course of the day, even though Building A will have consumed considerably more energy during that time. In scenario 2, Building B can use energy storage to reduce its mid-day grid energy consumption by meeting some of its demand with on-site stored energy. this could reduce its overall peak demand for the period, resulting in a lower utility bill.
Building B (scenario 1)Only reaches its highest level of demand in the middle of the day, consuming less
energy, but paying the same peak demand premium as Building A
Building B (scenario 2)Stores energy in the morning to offset high demand in the middle of the day,
lowering utility peak demand
Grid energy consumption
stored energy
stored energy consumption
PEAK DEMAND WITH STORAGE

8 Resilient southeast: technical appendix
Avoided Outage Costs
Avoided outage-related costs account for the value of unmet electricity needs during grid outages. In other words,
they represent the aggregated value of losses that would be incurred if a facility were to experience a power outage. For a business, this could include lost workforce productivity, losses due to interruption of sales or services, and expenses related to resuming production. For a critical community service provider, out-age-related costs could also include difficult to monetize losses ranging from lost commu-nications due to lack of cell phone charging or loss of wireless connections to loss of life due to failure of electricity-dependent medical devices, lack of refrigeration for mediations, or disrupted disaster response services.
When an onsite solar+storage system is configured to deliver power to local electric loads during a grid outage, some or all of these outage-related costs can be avoided. While it is difficult to put a value on these avoided costs and even more difficult to monetize the benefits, particularly for public services, there is irrefutable value in keep- ing critical services powered during an emergency.
av o i d e d o u Tag e Co s T M e T h o d o lo g yA variety of methodologies have been devised to assign a monetary value to outage-related costs. The analyses performed for this report series use the Department of Energy’s Interrup-tion Cost Estimate (ICE) Calculator, developed by Lawrence Berkeley National Laboratory and Nexant, Inc., to estimate these costs.3
The calculator approximates the value of unserved energy consumption (kilowatt-hours)
and average unserved power (kilowatts) during a grid outage for various customer types. These outage-related cost valuations are based on two reliability indicators annually reported by utilities to the u.S. Energy Informa-tion Administration: System Average Interruption Duration Index (SAIDI) and System Average Interruption Frequency Index (SAIFI). SAIDI is a measurement of the average length of outages in minutes experienced by customers of the reporting utility. SAIFI is a measurement of how often those power interruptions occur.
As shown in table 1, the customers served by the five utilities evaluated in this report series experienced, on average, about two power outages in 2017, except for those served by Duke Energy Progress, which reported a lower outage frequency. Those outages lasted about three to five hours except for customers in Florida and Georgia. Georgia Power reported an average outage duration of 18 hours, while Florida Power & Light customers experienced an average outage of more than 60 hours.4
These longer outage durations are likely due to the extreme 2017 hurricane season, which resulted in extended outages throughout the coastal Southeast, particularly in Florida. Based on outages occurring between 2015 and 2017, Miami utility customers average 25 hours in outages per year; Atlanta and Charleston customers average 10 hours per year; Wilmington customers average 9 hours per year; and New Orleans customers aver-age 4 hours per year. While 2017 may have been on the more extreme end of the spec-trum for grid outages for some southeastern utilities, outages due to severe weather are expected to increase as global temperatures continue to rise.

E x P LO R I N G O P P O R T u N I T I E S F O R S O L A R + S TO R AG E I N F I V E C I T I E S 9
Avoided Outage Costs
Table 1
Utility Power Outage Duration and Frequency Indexes
city utility saidi (minutes) saiFi
atlanta, Ga Georgia Power 1101 2.19
charleston, sc South Carolina Electric & Gas 330 1.85
Miami, Fl Florida Power & Light Company 3962 2.00
new orleans, la Entergy New Orleans 298 1.85
Wilmington, nc Duke Energy Progress 204 1.39
2017 System Average Interruption Duration Index (SAIDI) and System Average Interruption Frequency Index (SAIFI) values filed through U.S. Energy Information Administration Form 861 by the five utilities included in the economic modeling analyses. Higher SAIDI values indicate longer duration outages. Higher SAIFI numbers indicate more frequent outages. These values include major event days, the occurrence of sustained disruptions affecting at least 10 percent of customers over a 24-hour period.
utility reported SAIDI and SAIFI values were input into the ICE Calculator to determine a monetary amount to assign to losses that could be incurred or avoided by the facilities evaluated. One of the limitations of this valuation methodology is that the calculator only returns values for three broad customer segments: Residential, Small Commercial & Industrial, and Medium and Large Commer-cial & Industrial. Because of this, the resulting outage cost values are only generic proxies for the actual costs an individual building would incur due to a grid outage. These values do not include considerations for the types of critical—in some cases potentially life-saving—services provided by the four building types analyzed. The value society would place on the delivery of critical community and health services would likely be much higher than those of typical commercial customers. As a result, the avoided outage costs used in this report series represent a conservative estimation of true societal value.
As shown in table 2, the ICE Calculator assigns two cost components to value the losses related to a grid outage: the cost of average unserved power (Cost per Average Kilowatt) and the cost of unserved energy (Cost per unserved Kilowatt-hour). The build-ings evaluated fall into either the Medium and Large Commercial & Industrial customer segment or the Small Commercial & Industrial customer segment depending on the modeled building size (see the section on Economic
Modeling Inputs and Assumptions—Building Characteristics). Higher interruption index SAIDI values for the utilities serving Miami and Atlanta are reflected in the ICE Calculator results through higher Cost per Average Kilowatt dollar amounts. It is worth noting that the calculator assigns significantly higher outage cost components to buildings within the Small Commercial & Industrial customer segment.
The ICE Calculator outage cost components allow for a methodology to approximate losses incurred during an outage, but applying these values to future scenarios is challenging. While SAIDI and SAIFI values give a snapshot of out-ages in any given year, there is no publicly avail-able source of historical data with the actual timing and duration of outages that occurred at the utility level; and forecasting future outages is no more than a guessing game.
To simplify the valuation of avoided outage costs, the analysis assumes that, in each year of operation, a customer-sited solar+storage will deliver backup power to defined critical loads during a single extended outage event. The months of September and October, typically the height of the hurricane season in the Southeast, were selected as the most likely timing of an extended outage event in the cities evaluated. The value of powering critical loads for the maximum sustained dura-tion possible during one event in this period is used as a proxy for the cumulative value of avoided outage costs in any given year.

10 Resilient southeast: technical appendix
Table 2
Interruption Cost Estimator Calculator Outage Cost Components
Estimated grid interruption costs generated by the Department of Energy’s Interruption Cost Estimator Calculator for different customer segments in the five cities included in the economic modeling analysis. There are two components to the cost valuation: the cost of average unserved power (Cost per Average Kilowatt) and the cost of unserved energy (Cost per Unserved Kilowatt-hour).
city customer segment Building typescost per average Kilowatt ($/kW)
cost per unserved Kilowatt-hour ($/kWh)
atlanta, Ga Medium & Large Commercial & Industrial
• Fire station • Multifamily housing • Nursing home • Secondary school
280.45 33.47
charleston, sc Medium & Large Commercial & Industrial
• Fire station • Multifamily housing • Nursing home • Secondary school
50.08 16.86
Miami, Fl Medium & Large Commercial & Industrial
• Fire station • Multifamily housing • Nursing home • Secondary school
740.69 46.29
new orleans, la Small Commercial & Industrial
• Fire station • Multifamily housing
185.76 68.97
Medium and Large Commercial & Industrial
• Nursing home • Secondary school
103.93 38.59
Wilmington, nc Small Commercial & Industrial
• Fire station • Multifamily housing
410.36 167.72
Medium & Large Commercial & Industrial
• Nursing home • Secondary school
61.63 25.19
The following formula was used to determine the value of avoided outage costs:
Avoided Outage Cost = kWhO x CostkWh + kWO x CostkW
Where:
kWhO is the electricity consumption of defined critical loads during the longest sustained September/October period that the solar+storage system could deliver backup power in kilowatt-hours [kWh].
CostkWh is the ICE Calculator cost of unserved consumption during an outage in dollars per kilowatt-hour [$/kWh].
kWO is the average power demand of defined critical loads during the longest sustained September/October period that the solar+storage system could deliver backup power in kilowatts [kW].
CostkW is the ICE Calculator cost of average unserved power during an outage in dollars per kilowatt [$/kW].
For example: If a large commercial building in Atlanta had a solar+storage system that was capable of powering 1,000 kilowatt-hours of critical loads at an average power of 100 kilo-watts throughout a 10-hour power outage, the avoided outage cost would be calculated as:
Avoided Outage Cost = (1,000 kWh) x ($33.47/kWh) + (100 kW) x ($280.45/kW) = $61,515
If same outage scenario had occurred in Charleston, the avoided outage cost would be:
Avoided Outage Cost = (1,000 kWh) x ($16.86/kWh) + (100 kW) x ($50.08/kW) = $21,868

E x P LO R I N G O P P O R T u N I T I E S F O R S O L A R + S TO R AG E I N F I V E C I T I E S 11
The difference in avoided outage costs between the two cities is due to differences in the cost of unserved consumption and cost of average unserved power (see table 2), which are higher for Atlanta than Charleston.
While longer-duration extended outages may not always be an annual occurrence, outage costs would be similar, if not higher, for the same duration outage spread over several
occurrences throughout a year. In reality, the cost of outages and value of avoided outage costs would vary significantly from year to year. The annual outage costs used in these analyses should be viewed as more of an average value for outage costs avoided throughout the lifetime of the system rather than indicative of expected avoided outage costs occurring in any specific year.

12 Resilient southeast: technical appendix
Economic Modeling Inputs and Assumptions
This section details relevant inputs and assumption that were used in modeling the sizing and economics of solar PV and
battery storage systems for the four building types in Atlanta, GA; Charleston, SC; Miami, FL; New Orleans, LA; and Wilmington, NC. The section is organized into six categories: General economic assumptions, Building characteristics and energy use, energy Resilience, electric utility service, solar pV system, and Battery storage system.
g e n e r a l e Co n o M i C a s s u M p T i o n sanalysis period. The performance and economics of all systems are evaluated over a 25-year period. It is assumed that a solar PV system will have a lifetime of 25 years. Battery systems are assumed to have an initial 15-year operational lifetime, at which point the battery system and associated hardware, such as the inverter, are replaced. Net present value (NPV) is calculated over the entire 25-year period and includes both upfront and system replacement costs.
discount rate. A discount rate of five percent is used in all NPV calculations.
Federal tax incentives. The analyses assume that all building types can take advantage of the 30 percent federal investment tax credit (ITC) for solar PV. Public schools and fire stations are both owned and operated by government entities, which are not subject to federal taxes. The same would be true for nursing homes and multifamily housing properties that are operated by nonprofit entities, as is common in affordable multifamily housing. The analysis assumes the value of the ITC can be captured through a third-party ownership, leasing, or
tax equity partnership arrangement.5 While these types of financial arrangements may come with additional expenses, such added transactional costs are not considered in this analysis.
The analyses also assume that the ITC can be fully applied to the battery storage portion of a solar+storage system. According to guidance issued by the Internal Revenue Service, battery storage is eligible for the ITC when paired with, and at least 75 percent charged by, onsite solar.6 The analysis assumes that all solar+ storage systems are DC connected, with no ability for the storage system to be charged by the grid. This means that the battery storage system is 100 percent charged by onsite solar and, therefore, eligible to take advantage of the full ITC incentive. It is assumed that the ITC will no longer be available when the battery system is replaced after year 15.
state tax incentives. The State of South Carolina offers a 25 percent commercial tax credit for solar PV systems. The annual value of the tax credit is limited to $3,500 or 50 percent of tax liability, whichever is lower. In cases where the value of the tax credit exceeds $3,500, credits may be carried forward for up to 10 years. For the Charleston analyses, smaller solar systems are assumed to be able to take advantage the full 25 percent tax credit. Larger systems receive the maximum annual tax credit allowed for up to the limit of 10 years. As with the federal ITC, it is assumed all building types can take advantage of the tax credit. unlike the federal tax credit, the state incentive cannot be applied to the battery storage portion of a system.

E x P LO R I N G O P P O R T u N I T I E S F O R S O L A R + S TO R AG E I N F I V E C I T I E S 13
Florida, Georgia, Louisiana, and North Carolina do not offer state tax incentives for solar PV or battery storage.
B u i l d i n g C h a r aC T e r i s T i C s a n d e n e r g y u s ag eFor each city, four building types are evaluated in the modeling analyses: a secondary school, a nursing home, a multifamily housing property, and a fire station. Building sizes, configurations, and energy usage for secondary schools, nursing homes, and multifamily housing are modeled based on the 2012 Commercial Buildings Energy Consumption Survey (CBECS). The CBECS is a national survey of information on the stock of u.S. commercial buildings.7
The CBECS datasets include energy-related building characteristics and energy usage data for various commercial building types depend-ing on the primary use case of the facility.8 Building characteristics vary by location as designated by u.S. census region.
In the analyses:
• Secondary schools are modeled based on the CBECS secondary school building type.
• Nursing homes are assumed to be a mix of residential and inpatient care facilities. The model represents each nursing home as a facility with approximately 67 percent of size and energy use as the CBECS inpatient care facilities building type.
• For multifamily housing properties, only the commercial, common-area portion of the buildings are considered in the analysis. This includes areas such as hallways, offices, and community spaces. The assumption is that the building’s loads are individually metered, so that the common areas are collectively metered on a single commercial utility meter and individual tenant units are
independently metered, each on a separate residential meter. The analysis focus on common area spaces is done to simplify the modeling as opposed to attempting to incorporate individual tenant housing units, which may have significantly different energy usage profiles and be subject to different utility electric rate tariffs. Multifamily housing common areas are modeled based on the CBECS small office building type.
• Fire station building characteristics and energy usage data are based on a prior analysis that The Greenlink Group prepared for the City of Atlanta.9 The prior analysis simulated energy usage for a fire station in Atlanta based on the operation of the facility, the building’s floor area, and energy consumption modeled from monthly electric bill data obtained from the building owner. The characteristics and energy profile of this Atlanta fire station are assumed to be representative of fire stations in all five cities evaluated, so that all fire stations analyzed share the same building and energy use characteristics.
Energy usage load profiles for the buildings are generated using the u.S. Department of Energy’s EnergyPlus™ whole-building energy simulation program.10 The open-source pro-gram is used by engineers, architects, and researchers to model both energy consump-tion and water usage in buildings. The result-ing load profiles include hourly electricity consumption and demand for each building based on climate zone, building size, and primary function. Monthly electricity consump-tion and monthly peak demand are derived from these load profiles. These annual con-sumption and peak demand values, along with building floor space (in square-feet) and number of stories, are shown in table 3 for each building type and location.

14 Resilient southeast: technical appendix
city Building typeFloor space (sq-ft)
number of stories
annual electricity consumption (kWh)
annual peak demand (kW)
atlanta, Ga Secondary school 100,000 2 1,185,000 476
Nursing home 92,700 2 2,111,000 390
Multifamily housing 3,500 3 28,000 10
Fire station 7,600 1 99,000 28
charleston, sc Secondary school 210,900 2 3,614,000 1,109
Nursing home 114,100 3 1,733,000 268
Multifamily housing 1,200 1 18,000 5
Fire station 7,600 1 99,000 28
Miami, Fl Secondary school 78,300 2 1,231,000 296
Nursing home 186,000 3 3,687,000 563
Multifamily housing 2,500 1 24,000 6
Fire station 7,600 1 99,000 28
new orleans, la Secondary school 127,200 2 1,762,000 504
Nursing home 51,000 2 572,000 86
Multifamily housing 4,500 1 133,000 38
Fire station 7,600 1 99,000 28
Wilmington, nc Secondary school 210,900 2 4,120,000 1,353
Nursing home 58,000 2 1,636,000 250
Multifamily housing 1,200 3 17,000 5
Fire station 7,600 1 99,000 28
Table 3
Building Characteristics and Energy Use
Building floor space and number of stories is based on data from the Commercial Buildings Energy Consumption Survey. Annual electricity consumption and peak demand are generated from the U.S. Department of Energy’s EnergyPlus™ energy simulation program.
e n e r g y r e s i l i e n C eSimply installing a solar+storage system does not ensure that a building improves its energy resilience in the face of severe weather and grid disruptions.11 In order to deliver reliable backup power during a grid outage, a solar+ storage system must be designed and config-ured to be able to disconnect from the grid and operate independently, a process known as islanding. Depending on the project, this can add significant additional cost to a system design due to additional hardware components, software components, electrical components, and safety and permitting costs. According to
the National Renewable Energy Laboratory, the cost of making a system islandable may add an additional 10 to 50 percent to the upfront cost of an installation.12
Because of the complexity and uncertainty in evaluating these expenses for any given installation, the analyses do not consider the added cost of making a system islandable when modeling resilient scenarios. While not considered here, these costs are an important factor in any financial decisions regarding a real-world installation designed to provide energy resilience.

E x P LO R I N G O P P O R T u N I T I E S F O R S O L A R + S TO R AG E I N F I V E C I T I E S 15
critical loads. Another key factor in any resilient backup power system design is deter-mining which loads are deemed critical. Critical loads are electricity-consuming equipment and devices that must be kept powered during an outage scenario. These can range from computers to lighting to elevators to medical devices, depending on the facility and services provided during an emergency.
For simplicity, critical loads for the four build-ing types evaluated are approximated as a percentage of the full building load during normal operation. The percentages used vary by building type depending on how the facility would be used in an emergency situation.
Critical loads are defined as follows:
• secondary school: 25 percent of normal operational load. This critical load profile is meant to approximate the utilization of a portion of the school, such as a gymnasium, auditorium, or cafeteria, as a temporary emergency shelter during an extended outage.
• nursing home: 20 percent of normal operational load. This critical load profile is meant to approximate the continued operation of critical medical devices, refrig-eration of medicines, heating and cooling, and basic services to keep residents com-fortable during shorter outages and allow for more time to safely evacuate residents during a prolonged outage.
• Multifamily housing: 100 percent of normal operational common area load. Due to complexities in modeling a mix of multi-unit residential loads and commercial loads, only the common area commercial loads are considered in the analysis. The common area loads include hallways, offices, outdoor and emergency lighting, laundry rooms, elevators, and community spaces. Keeping the common areas fully operational would allow critical services such as clean water, heating and cooling, device charging, and communications to remain available to tenants sheltering in place during an emergency.
• Fire station: 100 percent of normal operational load. This critical load profile assumes the fire station would need to remain fully powered and completely operational during grid outages in order to continue to provide emergency response and critical life-saving services to surround-ing communities.
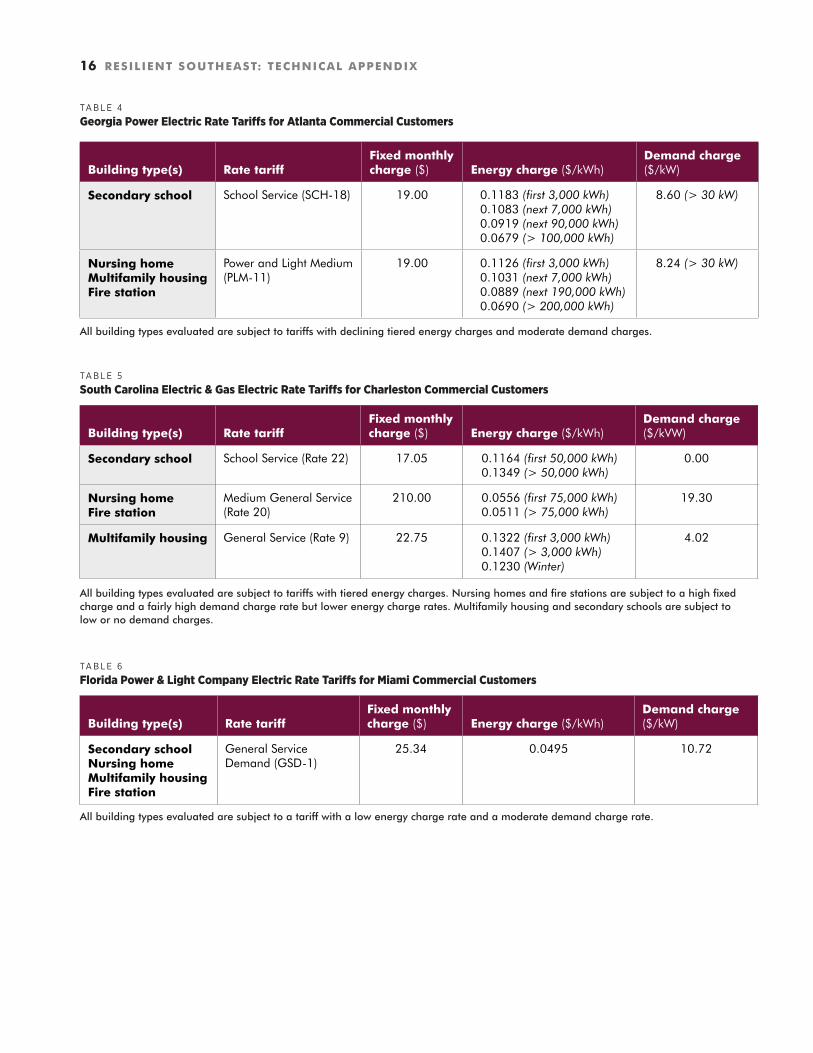
e l e C T r i C u T i l i T y s e r v i C eThe electric rate tariffs used in these analyses are based on active electric rate tariffs offered by the utilities serving the majority of customers in each of the five cities.13 The rate tariff selected for each building type is the rate considered most widely applicable for a com-mercial customer in the specified utility service territory considering facility type and modeled energy use. tables 4–8 detail the cost com-ponents for all electric rate tariffs considered in the analysis by location.
16 Resilient southeast: technical appendix
Table 4
Georgia Power Electric Rate Tariffs for Atlanta Commercial Customers
All building types evaluated are subject to tariffs with declining tiered energy charges and moderate demand charges.
Building type(s) Rate tariffFixed monthly charge ($) energy charge ($/kWh)
demand charge ($/kW)
secondary school School Service (SCH-18) 19.00 0.1183 (first 3,000 kWh) 0.1083 (next 7,000 kWh) 0.0919 (next 90,000 kWh) 0.0679 (> 100,000 kWh)
8.60 (> 30 kW)
nursing home Multifamily housing Fire station
Power and Light Medium (PLM-11)
19.00 0.1126 (first 3,000 kWh) 0.1031 (next 7,000 kWh) 0.0889 (next 190,000 kWh) 0.0690 (> 200,000 kWh)
8.24 (> 30 kW)
Table 5
South Carolina Electric & Gas Electric Rate Tariffs for Charleston Commercial Customers
All building types evaluated are subject to tariffs with tiered energy charges. Nursing homes and fire stations are subject to a high fixed charge and a fairly high demand charge rate but lower energy charge rates. Multifamily housing and secondary schools are subject to low or no demand charges.
Building type(s) Rate tariffFixed monthly charge ($) energy charge ($/kWh)
demand charge ($/kVW)
secondary school School Service (Rate 22) 17.05 0.1164 (first 50,000 kWh) 0.1349 (> 50,000 kWh)
0.00
nursing home Fire station
Medium General Service (Rate 20)
210.00 0.0556 (first 75,000 kWh) 0.0511 (> 75,000 kWh)
19.30
Multifamily housing General Service (Rate 9) 22.75 0.1322 (first 3,000 kWh) 0.1407 (> 3,000 kWh) 0.1230 (Winter)
4.02
Table 6
Florida Power & Light Company Electric Rate Tariffs for Miami Commercial Customers
All building types evaluated are subject to a tariff with a low energy charge rate and a moderate demand charge rate.
Building type(s) Rate tariffFixed monthly charge ($) energy charge ($/kWh)
demand charge ($/kW)
secondary school nursing home Multifamily housing Fire station
General Service Demand (GSD-1)
25.34 0.0495 10.72

E x P LO R I N G O P P O R T u N I T I E S F O R S O L A R + S TO R AG E I N F I V E C I T I E S 17
Table 7
Entergy New Orleans Electric Rate Tariffs for New Orleans Commercial Customers
All building types evaluated are subject to tariffs with declining tiered energy charges and declining tiered demand charges. Energy charge rates are low for all building types, particularly for electricity consumption beyond the first tier. Secondary schools and nursing homes are subject to a high fixed charge for the first 50 kilowatts of demand or less. The buildings are subject to a minimum $508 monthly charge whether demand in that month is above or below 50 kilowatts. Multifamily housing and fire stations are also subject to a fixed charge for demand, but the rate is significantly lower.
Building type(s) Rate tariffFixed monthly charge ($) energy charge ($/kWh)
demand charge ($/kW)
secondary school nursing home
Large Electric Service (LE-24)
508.33 (for first 50 kW)
0.0508 (first 5,000 kWh) 0.0274 (next 10,000 kWh) 0.0265 (next 15,000 kWh) 0.0262 (> 30,000 kWh)
8.58 (50 - 100 kW) 8.04 (100 - 200 kW) 7.70 (> 200 kW)
Multifamily housing Fire station
Small Electric Service (SE-24)
12.64 (for first 3 kW)
0.0624 (first 1,000 kWh) 0.0403 (next 4,000 kWh) 0.0367 (> 5,000 kWh)
5.17 (3 - 17 kW) 6.71 (> 20 kW)
Table 8
Duke Energy Progress Electric Rate Tariffs for Wilmington Commercial Customers
Secondary schools are subject to a fairly high energy charge rate and moderate demand charge rate. Other building types are subject to lower energy charge rates and moderate or no demand charges.
Building type(s) Rate tariffFixed monthly charge ($) energy charge ($/kWh)
demand charge ($/kW)
secondary school Church and School Service (CSG-50)
28.50 0.1583 7.00
nursing home Fire station
Medium General Service (MGS-50)
28.50 0.0684 6.40
Multifamily housing Small General Service (SGS-50)
21.00 0.1079 0.00
electric rate escalation: To incorporate the impact of changing electricity rates over time, the analyses include projected annual escala-tion rates for the energy and demand portions of utility rate tariffs. These escalation rates are based on the u.S. Energy Information Admin-istration’s Annual Energy Outlook 2018 census division specific forecast between 2018 and 2050. Atlanta, Charleston, Miami, and Wilm-ington are in the South Atlantic region, which is projected to have no escalation in electricity rates after accounting for inflation. New Orleans is located in the West South Central region, which is projected to experience a 0.3 percent compound annual growth rate for electric energy rates.14
net energy metering. All of the utilities considered in the analyses are required to offer full retail rate net energy metering
(NEM) except for Georgia Power, which serves Atlanta customers. Retail rate NEM means that any energy that is exported to the grid, not directly consumed or stored onsite, is credited back to the customer at the full retail cost of electricity. There are some restrictions to NEM solar systems, such as a 300-kilowatt system size cap imposed by Entergy New Orleans and limitations on solar generation sizing to no more than typical annual onsite electricity consumption. All solar systems modeled in this analysis comply with existing NEM regulations.
Georgia Power does not offer retail rate net metering. Instead, the utility purchases excess solar generation through its Solar Buy Back program.15 Commercial solar systems less than 250 kilowatts in size are eligible to sell solar energy to Georgia Power through the utility’s renewable energy resources tariff at

18 Resilient southeast: technical appendix
Georgia Power’s Solar Avoided Cost rate as approved by the Georgia Public Service Commission in Docket No. 16573. At the time of this modeling effort, the Solar Avoided Cost rate for Georgia Power was 3.2 cents per kilowatt-hour.
New Orleans City Council regulations prohibit solar net energy metering within the Central Business District of the city due to safety and reliability assurance concerns. All buildings analyzed in New Orleans are assumed to be located outside of the city’s Central Business District, which includes the French Quarter.
Table 9
Maximum Solar System Sizing for Each Building Type
Modeling assumes that 40 percent of rooftop space is economically available for the installation of solar panels.
city Building typeMaximum solar system size (kW)
atlanta, Ga Secondary school 90.9
Nursing home 84.3
Multifamily housing 15.3
Fire station 13.6
charleston, sc Secondary school 192.0
Nursing home 104.0
Multifamily housing 15.3
Fire station 13.6
Miami, Fl Secondary school 71.2
Nursing home 117.0
Multifamily housing 20.4
Fire station 13.6
new orleans, la Secondary school 115.7
Nursing home 30.9
Multifamily housing 20.5
Fire station 13.6
Wilmington, nc Secondary school 192.0
Nursing home 52.7
Multifamily housing 15.3
Fire station 13.6
s o l a r p v s ys T e Msolar system sizing. The analyses assume that approximately 40 percent of a building’s rooftop space is available for the economically viable installation of solar panels. The remain-ing 60 percent of roof space is considered unavailable due to a variety of factors including: roof penetrations, such as venting; rooftop equipment, like water tanks and central air conditioning; and building code offset require-ments. The analyses assume that 40 percent of rooftop space is the upper boundary for solar PV system sizing. In practice, there are other options for expanding solar system sizing beyond this threshold, such as incor-porating solar parking lot canopies, ground-mount solar systems, and elevated rooftop sys-tems, however, these options typically include added upfront costs and are not considered as part of this report series. The solar systems modeled for this report series are assumed to be single-axis roof mount systems.
The maximum solar system sizing for each building type is given in table 9. The differ-ences in system sizing for the same building type in different locations is due to varying building characters as a function of rooftop space, which is determined by total building square-footage as detailed in the Building Characteristics and Energy Usage subsection. All solar system sizes presented in this report series are given in DC system sizing.
solar system cost. Pricing assumptions for the installed cost of a solar PV system are based on data from developers gathered through the Solarize Atlanta campaign, Atlanta’s community-based solar bulk pur-chasing program.16 This data is categorized into three market segments: small systems, medium systems, and large systems. Cost assumptions for these market segments are detailed in table 10. These installed costs are assumed to be representative of general solar installation cost trends throughout the Southeast.

E x P LO R I N G O P P O R T u N I T I E S F O R S O L A R + S TO R AG E I N F I V E C I T I E S 19
solar system performance. Solar system performance is assumed to degrade at an annual rate 0.50 percent over the 25-year expected lifetime of the system.
solar system incentives. All building types evaluated are assumed to be able to take advantage of federal and, where available, state solar tax incentives. Systems are assumed to participate in solar net energy metering where offered.
Duke Energy Progress, the utility serving Wilmington, is the only utility explored in this report series that offers additional solar incen-tives. Duke Energy Progress offers a $0.50 per watt solar rebate for commercial customers and a $0.75 per watt incentive for nonprofit customers.17 The rebate can only be applied the first 100 kilowatts of a solar system, though larger systems can be installed. The program also offers a $0.60 per kilowatt incentive for the first 10 kilowatts of a residential solar installation. The rebate program was fully sub-scribed for 2018 at the time of this analysis, however, it is assumed that all buildings would be eligible to participate in the program when enrollment opened again in 2019. The Duke Energy Progress solar rebate for nonprofit customers, $0.75 per watt, is applied to solar systems modeled for the school and fire station in Wilmington. The commercial customer rebate, $0.50 per watt, is applied to solar systems modeled for the nursing home and multifamily housing property in Wilmington.
B aT T e ry s To r ag e s ys T e MBattery storage system sizing, con- figuration, and performance. Four battery storage system sizing options are considered in the analyses, shown in table 11. These sizing options and their operational charac-teristics are based on product specifications for commercially available LG Chem battery storage systems.
Table 10
Solar PV System Cost Assumptions
solar system categorysystem sizing range (kW)
installed cost ($/W)
small system 0–10 2.97
Medium system 10–25 2.25
large system > 25 1.95
Costs are based on developer data from the Solarize Atlanta campaign.
The analyses assume that all battery storage systems are DC-coupled with onsite solar PV and only charged by solar generation. This configuration allows the battery system to be directly charged by the solar system through a DC charge controller, without efficiency losses due to DC-to-AC and AC-to-DC power conversions. This allows the solar PV and battery storage systems to share a single inverter, reducing overall system costs. DC-coupling also results in a high round trip efficiency for the battery system of 95 percent.
The DC-coupled configuration ensures the batteries are 100 percent charged by onsite solar, allowing the storage system to take full advantage of federal tax incentives for solar. The modeling does not allow for battery systems to be charged by grid electricity at any time.
In modeling each Resilient scenario, the optimal battery system sizing is assumed to be the largest available battery system option with an energy capacity (kilowatt-hour) rating less than the modeled solar system output (kilowatt) rating, unless a larger battery sys- tem is required to meet critical load power requirements. For example, a building with a 75-kilowatt solar system would select a 45.7-kilowatt-hour battery system, the Com-mercial & Industrial—Small system, when modeling the Resilience scenario. This is done for multiple reasons: 1) to ensure a significant duration of backup power, 2) to ensure sufficient solar resources are available to allow for adequate battery system charging, and 3) to minimize overall system cost.

20 Resilient southeast: technical appendix
Table 11
Battery Storage System Sizing Options and Cost Assumptions
Sizing options are based on commercially available LG Chem product offerings. Costs are based on developer data from the Solarize Atlanta campaign.
Battery storage system typepower rating (kW)
energy capacity (kWh)
installed cost Replacement cost
($/kWh) ($) ($/kWh) ($)
small 2.5 9.8 1,060 10,400 568 5,600
commercial & industrial—small 11.8 45.7 1,060 48,400 568 26,000
commercial & industrial—Medium 23.7 91.3 1,060 96,800 568 51,900
commercial & industrial—large 35.5 137.0 1,040 142,500 558 76,400
Battery storage system cost. Installed costs for battery storage systems are based on data from developers gathered through the Solarize Atlanta campaign, shown in table 11. While battery specifications are based on LG Chem systems, the system prices are not based on any single battery storage product offering or brand. These installed costs are assumed to be representative of general battery storage installation cost trends throughout the Southeast.
Battery systems are assumed to have a 15-year lifetime based on performance specifica-tions and expected operation. After year 15, the battery storage system and related hard-ware, including the inverter, is replaced.
The cost of battery storage is projected to decline at an annual rate of eight percent, while installed balance of system costs are projects to decline at an annual rate of five percent.18 Assuming battery storage represents
75 percent of the installed system cost and balance of system costs represent the remain-ing cost, the annual cost decline is assumed to be seven percent per year. Estimated battery storage replacement costs after year 15 are included in table 11. All NPV calculations for combined solar+storage systems include a 2.5 percent inflation rate to convert nominal dollars to real dollars.
Battery storage system incentives. Because all battery storage systems are modeled to be charged exclusively by onsite solar generation, the battery systems are assumed to be eligible to fully take advantage of the federal ITC for the initial cost of the system. The ITC is not assumed to be available for replacement of the battery system after year 15. No additional battery storage systems incentives exist for the locations evaluated in this report series.

E x P LO R I N G O P P O R T u N I T I E S F O R S O L A R + S TO R AG E I N F I V E C I T I E S 21
Economic Modeling Results
This section details economic modeling results for the economic scenario and Resilient scenario for each of the
four building types evaluated. The results are organized in two tables for each city, detailing system sizing and costs, maximum hours of backup power, and economic results.
The first of two tables for each city details modeled system sizing, cost data, and hours of backup power the system can provide.
Cost data includes the upfront cost of solar and battery storage components and the NPV system cost. The NPV system cost represents the total cost of the system after accounting for replacement of components and any available incentives. The NPV system cost includes the total installed cost of the solar and battery storage components; battery storage system replacement costs, accounting for declines in system prices and inflation; and all applicable incentives such as the federal ITC.
Backup power results represent the maximum number of hours that a modeled solar+storage system can deliver power to critical loads over a single sustained period of time. Hours of backup power are calculated for maximum system performance both throughout the year and during the September/October peak hurricane season.
It is important to note that backup power values do not represent the total number of hours the system could power critical loads during an extended outage, only the number of hours it could support those loads for a single sus-tained period of time before the batteries would need to be recharged. For instance, a system that is found to provide a maximum of 12 hours of backup power would be capable of powering critical loads for up to 12 hours
when an outage first occurs. When the solar system is again available to power critical loads and recharge the battery storage system, the system would again provide backup power for up to a 12-hour period. This cycle would continue to repeat any days there were suffi-cient solar resources available to generate electricity. A number of measures could be put into place to extend backup power dura-tions, such as careful management of critical loads. Such measures are beyond the scope of these analyses.
The second of the two tables for each city presents economic results—first year savings, NPV, internal rate of return (IRR), and simple payback period. Economic results for the resil-ient scenarios are presented both with and without savings due to avoided outage costs (AOC), which are difficult to monetize, particularly for public services.
First year savings results are broken down into three categories of savings: electric bill energy savings, electric bill demand savings, and avoided outage costs. Energy savings rep-resent offsetting grid supplied electricity with onsite solar generation, either directly offsetting onsite electricity consumption or through NEM crediting (or solar purchasing in the case of Georgia Power). Demand savings are due to the ability of solar and battery storage to reduce monthly peak demand, which is typically used to calculate the demand charge compo-nents of a commercial electric bill. Reducing peak demand results in savings through lower demand-related charges. Avoided outage costs represent avoided losses that would have otherwise been incurred had the system not been able to provide backup power over a defined period (see the section on Avoided Outage Costs for a detailed discussion of how these costs are calculated).

22 Resilient southeast: technical appendix
aT l a n Ta , g a
When the buildings were analyzed under the Resilient scenario, solar+storage was still found to result in net savings for the sec-ondary school and nursing home, despite the added cost of the battery system. Because the economics of solar PV are not as strong for the multifamily housing property and fire station, and because those buildings do not have high enough electricity demand to incur demand charges—eliminating another value stream for both solar and battery storage—solar+storage was not found to be an economic option for these facilities based on electric bill savings alone.
Factoring in the additional value of avoided outage costs by powering critical loads during grid disruptions significantly improved the lifetime savings for all building types, resulting in positive economics for the solar+storage systems in all cases. In fact, including the savings from avoided outage costs makes the Resilient scenario the most economic option for all building types, with the highest NPV, best IRR, and shortest simple payback period.
Systems modeled for the Resilient scenario can provide backup power to support critical loads for up to 12 hours or more for all build-ing types, except for the nursing home. Due to the energy intensive nature of nursing home operations and constraints on available roof-top space, the solar+storage system modeled for the nursing home is limited to providing a maximum of nine hours of backup power to critical loads at a time, eight hours during hurricane season.
Atlanta ranked as the third best economic opportunity for solar+storage development among the five cities evaluated in this report series.
Analysis results for building types in Atlanta, GA are presented in table 12 and table 13.
Economic outcomes were found to be stronger for the larger facilities, the school and nursing home, largely due to negative impacts from Georgia Power’s low Solar Buy Back rate and the absence of utility demand charges for smaller building types.
The economic scenario analysis found that solar—without battery storage—would be the most economical option for all four build-ing types in Atlanta, based solely on electric bill savings with no consideration of improved energy resilience. For three of the building types, savings would be maximized by installing the largest solar systems possible for the buildings given constraints on available rooftop space.
A smaller solar system was found to be the optimal solution for the multifamily housing property. The reason for this is that the multi-family housing property does not have enough daytime demand for electricity to use the majority of energy generated from a larger solar system onsite, as do the larger facilities. Even the smaller system still exports 30 percent of its electricity to the grid, making the economics less favorable than for buildings able to directly consume more solar production onsite.
In Atlanta, this has a significant impact on the economics of solar PV, as Georgia Power procures exported solar energy at about one-third of the retail electricity rate paid by the multifamily housing property and other build-ings evaluated. Higher levels of solar exports to the grid also negatively impacted economics of solar for the fire station, though to a lesser degree. The multifamily housing property and fire station also face higher installed solar costs per-watt, due to the smaller size of the solar systems relative to the school and nursing home.

E x P LO R I N G O P P O R T u N I T I E S F O R S O L A R + S TO R AG E I N F I V E C I T I E S 23
Building type
Modeled scenario
First year savings ($) net present value ($)
internal rate of return
simple payback period (yrs)energy demand aoc total
secondary school
Economic 14,400 3,700 — 18,100 131,800 13.6% 6.8
Resilient 14,500 4,100 — 18,500 71,900 8.0% 10.2
Resilient (with AOC) 14,500 4,100 25,600 44,200 300,100 21.1% 4.1
nursing home
Economic 14,000 900 — 14,800 94,400 11.7% 7.8
Resilient 14,000 1,700 — 15,700 42,200 6.7% 11.4
Resilient (with AOC) 14,000 1,700 26,800 42,500 263,600 20.5% 4.2
Multifamily housing
Economic 1,300 0 — 1,300 2,700 6.2% 12.0
Resilient 1,900 0 — 1,900 (7,200) 2.3% 17.9
Resilient (with AOC) 1,900 0 2,600 4,500 4,000 5.7% 11.1
Fire station Economic 2,100 0 — 2,100 7,600 7.8% 10.4
Resilient 2,100 0 — 2,100 (1,600) 4.0% 14.9
Resilient (with AOC) 2,100 0 2,700 4,800 24,000 12.0% 6.6
Table 12
Solar PV and Battery Storage System Sizing, Costs, and Maximum Hours of Backup Power for Building Types in Atlanta
Net present value system cost represents the total installed system cost, the cost of replacing battery storage system components, and incorporates incentives available through the federal investment tax credit. Backup power represents the maximum sustained number of hours the system could power critical building loads.
Building type
Modeled scenario
solar (kW)
Battery storageinstalled system cost ($) net present
value system cost ($)
Backup power (hours)
(kW) (kWh) solar Battery annual sept/oct
secondary school
Economic 90.9 — — 177,300 — 124,100 — —
Resilient 90.9 11.8 45.7 177,300 48,400 189,700 12 11
nursing home
Economic 84.3 — — 164,300 — 115,000 — —
Resilient 84.3 11.8 45.7 164,300 48,400 179,200 9 8
Multifamily housing
Economic 10.0 — — 22,500 — 15,800 — —
Resilient 15.3 2.5 9.8 34,500 10,400 34,100 14 14
Fire stationEconomic 13.6 — — 30,600 — 21,400 — —
Resilient 13.6 2.5 9.8 30,600 10,400 31,400 12 11
Table 13
Solar PV and Battery Storage Economic Modeling Results for Building Types in Atlanta
The economics of the resilient scenarios are considered both with and without savings due to avoided outage costs (AOC). Net present value is calculated over a 25-year period and includes replacement costs for battery storage systems in the resilient scenarios.

24 Resilient southeast: technical appendix
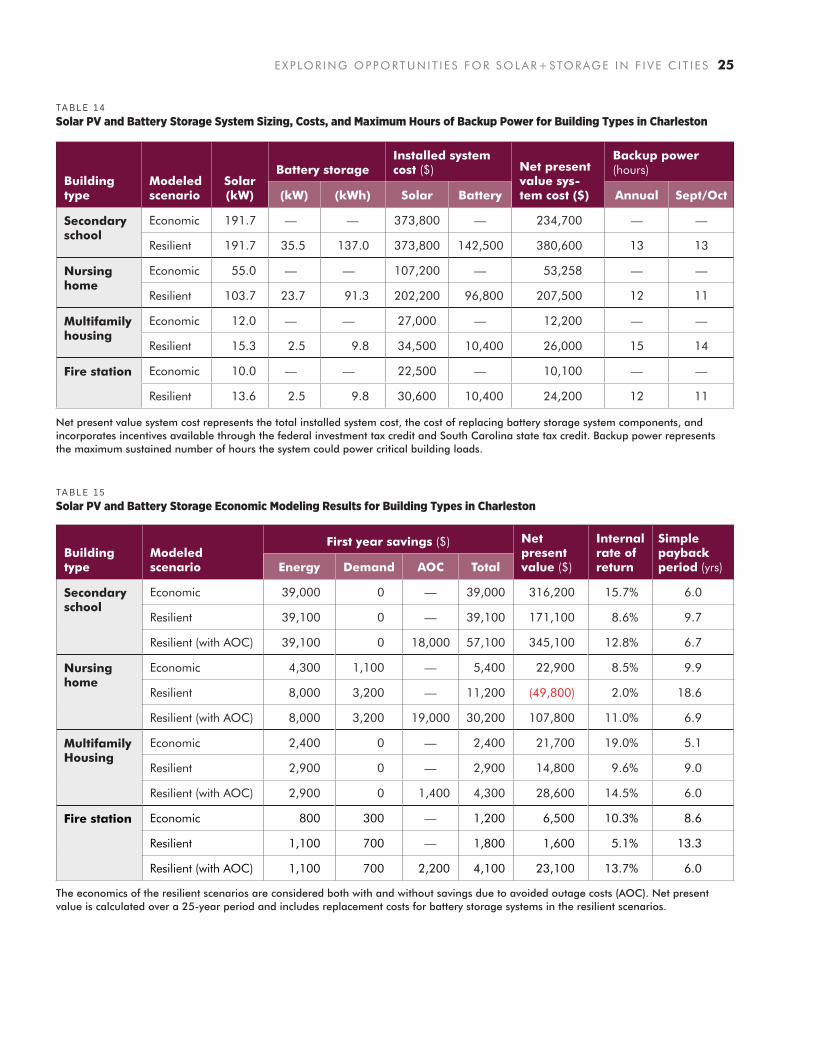
Analysis results for building types in Charleston, SC are presented in table 14 and table 15.
Economic outcomes were found to be positive for all building types across both scenarios, except for the nursing home under the Resil-ient scenario without accounting for avoided outage costs. These encouraging results are in large part due to the availability of a 25 percent South Carolina state tax credit for commercial solar systems, which creates a strong economic case for solar PV investments. The economic scenario analysis found that solar PV, without battery storage, would be the most economical option for all four building types in Charleston, based solely on electric bill savings with no consideration of improved energy resilience.
When the buildings were analyzed under the Resilient scenario, solar+storage was still found to result in net savings for the sec-ondary school, multifamily housing property, and fire station, despite the added cost of the battery system. The nursing home and fire sta-tion are both subject to a utility rate tariff with significantly lower energy charge rates than those for the school and multifamily housing, less than 6 cents per kilowatt-hour, and signifi-cantly higher demand charge rates, more than $19 per kilowatt—the highest demand charge rate of any of the utility tariffs evaluated in this report series. As a result, the economics of solar are not as strong for the nursing home and fire station than the other building types, as is evidenced by lower IRRs and longer
simple payback periods. While higher demand charge rates translate into greater savings through installing battery storage, the savings are not sufficient to offset enough of the cost of the larger battery modeled for the nursing home, which has much higher energy and demand needs to support critical loads than the fire station. Because of this, solar+storage was not found to be a cost-effective option for the nursing home.
Factoring in the additional value of avoided outage costs by powering critical loads during grid disruptions significantly improved the lifetime savings for all building types in Charles-ton, resulting in positive economics for the solar+storage systems in all cases including the nursing home. Accounting for the savings from avoided outage costs makes the Resilient scenario the most economic option for the nursing home and fire station, with the highest NPV, best IRR, and shortest simple payback period.
Systems modeled for the Resilient scenario can provide backup power to support critical loads for up to 12 hours or more for all build-ing types. The multifamily housing property and secondary school had the best resilience outcomes, with solar+storage systems able to deliver backup power supporting critical loads for up to 15 hours and 13 hours respectively.Charleston ranked second best based on economic opportunities for solar+storage development among the five cities evaluated in this report series.
C h a r l e s To n , s C
E x P LO R I N G O P P O R T u N I T I E S F O R S O L A R + S TO R AG E I N F I V E C I T I E S 25
Building type
Modeled scenario
First year savings ($) net present value ($)
internal rate of return
simple payback period (yrs)energy demand aoc total
secondary school
Economic 39,000 0 — 39,000 316,200 15.7% 6.0
Resilient 39,100 0 — 39,100 171,100 8.6% 9.7
Resilient (with AOC) 39,100 0 18,000 57,100 345,100 12.8% 6.7
nursing home
Economic 4,300 1,100 — 5,400 22,900 8.5% 9.9
Resilient 8,000 3,200 — 11,200 (49,800) 2.0% 18.6
Resilient (with AOC) 8,000 3,200 19,000 30,200 107,800 11.0% 6.9
Multifamily housing
Economic 2,400 0 — 2,400 21,700 19.0% 5.1
Resilient 2,900 0 — 2,900 14,800 9.6% 9.0
Resilient (with AOC) 2,900 0 1,400 4,300 28,600 14.5% 6.0
Fire station Economic 800 300 — 1,200 6,500 10.3% 8.6
Resilient 1,100 700 — 1,800 1,600 5.1% 13.3
Resilient (with AOC) 1,100 700 2,200 4,100 23,100 13.7% 6.0
Table 14
Solar PV and Battery Storage System Sizing, Costs, and Maximum Hours of Backup Power for Building Types in Charleston
Net present value system cost represents the total installed system cost, the cost of replacing battery storage system components, and incorporates incentives available through the federal investment tax credit and South Carolina state tax credit. Backup power represents the maximum sustained number of hours the system could power critical building loads.
Building type
Modeled scenario
solar (kW)
Battery storageinstalled system cost ($) net present
value sys-tem cost ($)
Backup power (hours)
(kW) (kWh) solar Battery annual sept/oct
secondary school
Economic 191.7 — — 373,800 — 234,700 — —
Resilient 191.7 35.5 137.0 373,800 142,500 380,600 13 13
nursing home
Economic 55.0 — — 107,200 — 53,258 — —
Resilient 103.7 23.7 91.3 202,200 96,800 207,500 12 11
Multifamily housing
Economic 12.0 — — 27,000 — 12,200 — —
Resilient 15.3 2.5 9.8 34,500 10,400 26,000 15 14
Fire station Economic 10.0 — — 22,500 — 10,100 — —
Resilient 13.6 2.5 9.8 30,600 10,400 24,200 12 11
Table 15
Solar PV and Battery Storage Economic Modeling Results for Building Types in Charleston
The economics of the resilient scenarios are considered both with and without savings due to avoided outage costs (AOC). Net present value is calculated over a 25-year period and includes replacement costs for battery storage systems in the resilient scenarios.

26 Resilient southeast: technical appendix
M i a M i , F l
Analysis results for building types in Miami, FL are presented in table 16 and table 17.
Economic outcomes were mixed the four build-ing types in Miami, with weaker economic benefits than three of the cities evaluated in this report series. The economic case for solar+storage was found to be stronger for the larger facilities, the school and nursing home, due to lower installation costs for larger solar systems and greater opportunities for demand charge savings.
The economic scenario analysis results var-ied by building type for Miami facilities. Solar, without battery storage, represented the most economical option for the secondary school and nursing home, based purely on electric bill savings with no consideration of improved energy resilience. Solar was not found to be a cost-effective option for the smaller buildings—the multifamily housing property and the fire station.
The reason solar PV was not found to be posi-tive option for all building types is primarily due to the design of utility electric rate tariffs offered by Florida Power & Light (FPL). The rate tariff applied to all four building types has a very low energy charge rate, less than 5 cents per kilowatt-hour, and a moderate demand charge rate of about $11 per kilowatt. Both of these factors reduce the economic case for solar PV. Solar was found to be marginally cost-effective for the larger building types primarily because of the greater avail-ability of roof space to install larger solar systems with lower installed costs per watt.
The economic picture did not improve under the Resilient scenarios, with battery storage adding additional costs not fully offset by electric bill savings. Solar+storage was not
found to be positive economic investment for any of the building types evaluated without accounting for savings from avoided outage costs. This is again a reflection of low bill savings potential due to the design of FPL’s commercial electric rate tariff.
Factoring in the additional value of avoided outage costs by powering critical loads during grid disruptions dramatically alters the eco-nomics of solar+storage, resulting in positive economics for all building types. Including the savings from avoided outage costs makes the resilient scenario the most economic option for all four buildings types, with the highest NPV, best IRR, and shortest simple payback period.
For the school and nursing home, accounting for avoided outage costs results in short simple payback periods of less than three years. These impressive results are largely a reflection of extended outages experienced by FPL customers in 2017, primarily due to Hurricane Irma. Avoided outage costs for commercial customers in FPL’s service territory were calculated to be significantly higher than other regions analyzed in the Southeast because of these recent prolonged electric service disruptions.
Systems modeled for the Resilient scenario can provide backup power to support critical loads for up to 11 hours or more for all build-ing types, except for the nursing home. Due to the energy intensive nature of nursing home operations and constraints on available roof-top space, the nursing home’s solar+storage system is limited to providing a maximum of 7 hours of backup power to critical loads at a time, 6 hours during hurricane season.
Miami ranked fourth among the five cities evaluated based on the economic opportunity for solar+storage development.

E x P LO R I N G O P P O R T u N I T I E S F O R S O L A R + S TO R AG E I N F I V E C I T I E S 27
Building type
Modeled scenario
First year savings ($) net present value ($)
internal rate of return
simple payback period (yrs)energy demand aoc total
secondary school
Economic 3,200 1,200 — 4,500 8,800 6.1% 12.2
Resilient 5,800 2,100 — 7,900 (32,500) 2.1% 18.2
Resilient (with AOC) 5,800 2,100 46,000 53,900 410,800 33.2% 2.7
nursing home
Economic 2,000 500 — 2,500 1,400 4.9% 13.6
Resilient 9,200 2,800 — 11,900 (78,600) 1.0% 20.7
Resilient (with AOC) 9,200 2,800 77,700 89,700 670,800 32.0% 2.8
Multifamily housing
Economic — — — — — — —
Resilient 800 200 - 1,000 (12,200) (1.0%) 26.9
Resilient (with AOC) 800 200 2,400 3,400 11,100 9.0% 7.6
Fire station Economic — — — — — — —
Resilient 1,100 300 — 1,400 (11,300) 0.5% 22.1
Resilient (with AOC) 1,100 300 4,900 6,300 35,500 16.0% 5.0
Table 16
Solar PV and Battery Storage System Sizing, Costs, and Maximum Hours of Backup Power for Building Types in Miami
Net present value system cost represents the total installed system cost, the cost of replacing battery storage system components, and incorporates incentives available through the federal investment tax credit. Backup power represents the maximum sustained number of hours the system could power critical building loads.
Building type
Modeled scenario
solar (kW)
Battery storageinstalled system cost ($) net present
value sys-tem cost ($)
Backup power (hours)
(kW) (kWh) solar Battery annual sept/oct
secondary school
Economic 40.0 — — 78,000 — 54,600 — —
Resilient 71.2 11.8 45.7 138,795 48,400 143,697 14 10
nursing home
Economic 25.0 — — 48,800 — 34,100 — —
Resilient 112.7 23.7 91.3 219,800 96,800 246,900 7 6
Multifamily housing
Economic — — — — — — — —
Resilient 10.0 2.5 9.8 22,500 10,400 25,700 15 14
Fire station Economic — — — — — — — —
Resilient 13.6 2.5 9.8 30,600 10,400 31,400 11 11
Table 17
Solar PV and Battery Storage Economic Modeling Results for Building Types in Miami
The economics of the resilient scenarios are considered both with and without savings due to avoided outage costs (AOC). Net present value is calculated over a 25-year period and includes replacement costs for battery storage systems in the resilient scenarios.

28 Resilient southeast: technical appendix
n e w o r l e a n s , l a
Analysis results for building types in New Orleans, LA are presented in table 18 and table 19.
Without accounting for avoided outage costs, economic outcomes were found to be poor for the four building types evaluated in New Orleans. These outcomes are primarily due to the design of electric rate tariffs offered by Entergy New Orleans.
Solar was not found to be an economical investment for any of the building types evalu-ated under the economic scenario. Because solar was found to have a negative NPV in all cases, the most cost-effective solution for the buildings evaluated would be the business-as-usual case of not installing a solar PV system of any size.
The secondary school and nursing home are subject to Entergy’s Large Electric Service tariff, which has an energy charge rate of 5 cents per kilowatt-hour for the first 5,000 kilowatt-hours of energy consumption in each billing period. The energy charge rate then drops to less than 3 cents per kilowatt-hour for remain-ing consumption. This very low second-tier energy charge rate makes it difficult for solar to compete with the price of grid electricity. The Large Electric Service tariff also includes a fixed demand charge of $508.33 for the first 50 kilowatts of energy demand. Because Entergy has structured the charge as a fixed fee, large electric service customers are charged $508.33 each billing period regardless of whether their demand is below 50 kilowatts for that period. This again undercuts the bill savings solar and battery storage can achieve. For example, if installed solar PV and battery storage were to reduce peak demand during a billing period from 50 kilowatts to 30 kilo-watts, no demand saving would be realized under this rate tariff structure.
The multifamily housing facility and the fire station are subject to Entergy’s Small Electric Service tariff, which has an energy charge rate of 6 cents per kilowatt-hour for the first 1,000 kilowatt-hours of energy consumption in each billing period. The energy charge rate then drops to about 4 cents per kilowatt-hour for remaining consumption. While these rates are higher than for Large Electric Service customers, solar is still not economic for these smaller facilities. Part of the reason for this is that the smaller facilities only have enough roof space available to install a smaller solar system, which costs more to install on a per watt basis. The small electric service tariff also includes a fixed demand charge but, at $12.64 for the first 5 kilowatts of demand, its impact is minimal.
The economic picture does not improve under the Resilient scenarios, with battery storage adding additional costs not fully offset by elec-tric bill savings. Solar+storage was not found to be positive economic investment for any of the building types evaluated without accounting for savings from avoided outage costs. This is again a reflection of low bill savings potential due to the design of Entergy’s commercial electric rate tariffs.
Similar to the Miami analyses, factoring in the additional value of avoided outage costs by powering critical loads during grid disruptions significantly alters the economic opportunity for solar+storage. The value of avoided out-age costs was found to be much higher than the potential for electric bill savings for all building types evaluated. Factoring these sav-ings into the analysis results in positive eco-nomics for the four building types, though the economics of solar+storage is only moder-ately favorable for each building type, except for the fire station. The fire station was found to have the strongest economic case for

E x P LO R I N G O P P O R T u N I T I E S F O R S O L A R + S TO R AG E I N F I V E C I T I E S 29
solar+storage, with a less than seven-year simple payback period when accounting for avoided outage costs.
All systems modeled for the Resilient scenario can provide backup power to sup-port critical loads for up to 12 hours or more. The New Orleans nursing home is the only case evaluated in the report series where a larger battery system was modeled to ensure critical loads could be adequately powered
during grid disruptions. The secondary school had the best resilience outcome, with a solar+storage system able to deliver backup power supporting critical loads for up to 14 hours throughout the year and up to 13 hours during hurricane season.
New Orleans ranked last among the five cities evaluated based on the economic opportunity for solar+storage development.
Table 18
Solar PV and Battery Storage System Sizing, Costs, and Maximum Hours of Backup Power for Building Types in New Orleans
Net present value system cost represents the total installed system cost, the cost of replacing battery storage system components, and incorporates incentives available through the federal investment tax credit. Backup power represents the maximum sustained number of hours the system could power critical building loads.
Building type
Modeled scenario
solar (kW)
Battery storageinstalled system cost ($) net present
value sys-tem cost ($)
Backup power (hours)
(kW) (kWh) solar Battery annual sept/oct
secondary school
Economic — — — — — — — —
Resilient 115.7 23.7 91.3 225,500 48,400 250,852 14 13
nursing home
Economic — — — — — — — —
Resilient 30.9 11.8 45.7 60,300 96,800 88,700 12 12
Multifamily housing
Economic — — — — — — — —
Resilient 20.4 2.5 9.8 46,000 10,400 42,200 12 11
Fire station Economic — — — — — — — —
Resilient 13.6 2.5 9.8 30,600 10,400 31,366 12 12

30 Resilient southeast: technical appendix
Building type
Modeled scenario
First year savings ($) net present value ($)
internal rate of return
simple payback period (yrs)energy demand aoc total
secondary school
Economic — — — — — — —
Resilient 4,900 2,800 — 7,800 (143,600) (2.5%) 33.0
Resilient (with AOC) 4,900 2,800 23,200 31,000 6,900 4.8% 10.8
nursing home
Economic — — — — — — —
Resilient 1,300 400 — 1,600 (65,500) (5.6%) 53.9
Resilient (with AOC) 1,300 400 28,600 30,200 800 4.5% 10.4
Multifamily housing
Economic — — — — — — —
Resilient 1,200 400 — 1,600 (19,600) (0.9%) 26.4
Resilient (with AOC) 1,200 400 2,400 4,000 3,600 5.4% 10.5
Fire station Economic — — — — — — —
Resilient 800 200 — 1,000 (16,900) (2.0%) 30.6
Resilient (with AOC) 800 200 2,000 3,000 17,200 10.3% 6.9
Table 19
Solar PV and Battery Storage Economic Modeling Results for Building Types in New Orleans
The economics of the resilient scenarios are considered both with and without savings due to avoided outage costs (AOC). Net present value is calculated over a 25-year period and includes replacement costs for battery storage systems in the resilient scenarios.

E x P LO R I N G O P P O R T u N I T I E S F O R S O L A R + S TO R AG E I N F I V E C I T I E S 31
w i l M i n g To n , n C
Analysis results for building types in Wilmington, NC are presented in table 20 and table 21.
Economic outcomes were found to be positive for all four building types across both scenarios, except for the fire station under the Resilient scenario without accounting for avoided out-age costs. These encouraging results are due in large part to the solar rebate program offered by Duke Energy Progress—the only utility evaluated with a solar incentive pro-gram. The economic scenario analysis found that solar PV, without battery storage, would be the most economical option for all four building types in Wilmington, based solely on electric bill savings with no consideration of improved energy resilience.
When the buildings were analyzed under the Resilient scenario, solar+storage was still found to result in net savings for the sec-ondary school, nursing home, and multifamily housing property, despite the added cost of the battery system. The nursing home and fire station are both subject to the Duke Energy Progress Medium General Service rate tariff, which, at less than 7 cents per kilowatt-hour, has much lower energy charge rates than the school or multifamily housing facility. As a result, the nursing home and fire station have less opportunity for solar electric bill savings, with lower IRRs and longer simple payback periods than the school and multifamily housing.
The nursing home is a larger facility with more available roof space than the fire station, and it can install a larger solar PV system at a lower cost based on dollars per watt, resulting in better overall economics for the nursing home.
The economic case for solar+storage is only marginally better for the multifamily housing property. The multifamily housing property, on Duke Energy’s Small General Service tariff, pays a much higher energy charge rate of about 11 cents per kilowatt-hour, but the tariff does not have a demand charge, which eliminates the potential for battery storage to deliver additional electric bill savings.
Factoring in the additional value of avoided outage costs by powering critical loads during grid disruptions significantly improves the lifetime savings for all four building types, resulting in positive economics for the solar+ storage systems in all cases, including the fire station. Accounting for the savings from avoided outage costs makes the Resilient scenario the most economic option for the fire station, with an IRR of more than 35 percent and a simple payback period of less than three years.
Systems modeled for the resilient scenario can provide backup power to support critical loads for up to 12 hours or more for all building types, except for the nursing home. Like in other locations, the energy intensive nature of nursing home operations and constraints on available rooftop space limit the duration of backup power the solar+storage system can deliver to support critical loads. The nurs-ing home’s solar+storage system is limited to providing a maximum of 6 hours of backup power to critical loads at a time, 4 hours during hurricane season.
Wilmington ranked the best based on its economic opportunities for solar+storage development among the five cities evaluated in this report series.

32 Resilient southeast: technical appendix
Building type
Modeled scenario
First year savings ($) net present value ($)
internal rate of return
simple payback period (yrs)energy demand aoc total
secondary school
Economic 44,500 3,500 — 48,000 472,400 22.3% 4.4
Resilient 44,400 5,400 — 49,800 361,900 13.3% 7.0
Resilient (with AOC) 44,400 5,400 5,100 54,900 411,000 14.6% 6.4
nursing home
Economic 5,200 200 — 5,400 23,100 8.5% 9.8
Resilient 5,200 800 — 6,000 200 4.6% 18.5
Resilient (with AOC) 5,200 800 5,400 11,400 78,200 8.7% 9.7
Multifamily housing
Economic 1,700 0 — 1,700 9,900 10.5% 8.4
Resilient 2,100 0 — 2,100 1,000 4.9% 13.6
Resilient (with AOC) 2,100 0 2,200 4,300 32,100 11.8% 6.8
Fire station Economic 1,400 100 — 1,400 6,000 8.4% 9.9
Resilient 1,400 200 — 1,500 (2,400) 3.5% 15.7
Resilient (with AOC) 1,400 200 8,100 9,600 75,300 35.4% 2.5
Table 20
Solar PV and Battery Storage System Sizing, Costs, and Maximum Hours of Backup Power for Building Types in Wilmington
Net present value system cost represents the total installed system cost, the cost of replacing battery storage system components, and incorporates incentives available through the federal investment tax credit and the solar rebate offered by Duke Energy Progress. Backup power represents the maximum sustained number of hours the system could power critical building loads.
Building type
Modeled scenario
solar (kW)
Battery storageinstalled system cost ($) net present
value sys-tem cost ($)
Backup power (hours)
(kW) (kWh) solar Battery annual sept/oct
secondary school
Economic 192.0 — — 374,400 — 209,600 — —
Resilient 192.0 35.5 137.0 374,400 142,500 349,100 12 12
nursing home
Economic 52.0 — — 101,400 — 52,800 — —
Resilient 52.0 11.8 45.7 101,400 48,400 110,241 6 4
Multifamily housing
Economic 12.0 — — 27,000 — 14,700 — —
Resilient 15.3 2.5 9.8 34,400 10,400 28,800 16 16
Fire station Economic 13.6 — — 30,600 — 14,300 — —
Resilient 13.6 2.5 9.8 30,600 10,400 24,200 12 11
Table 21
Solar PV and Battery Storage Economic Modeling Results for Building Types in Wilmington
The economics of the resilient scenarios are considered both with and without savings due to avoided outage costs (AOC). Net present value is calculated over a 25-year period and includes replacement costs for battery storage systems in the resilient scenarios.

E x P LO R I N G O P P O R T u N I T I E S F O R S O L A R + S TO R AG E I N F I V E C I T I E S 33
1 Net present value (NPV) is defined as the difference between the present value of economic benefits and the present value of expenses over the life of the system. Future benefits and expenses are discounted over time. A positive NPV indicates that it would be economically beneficial to install the system, whereas a negative NPV would indicate that the system would not result in net savings over time. See the Economic Analysis Assumptions section for more informa-tion about the inputs used in calculating NPVs for this analysis.
2 Demand charges, which are usually applied only to commercial utility customers, are typically billed based on the highest rate of electricity consumption a customer experiences during a billing period, measured in kilowatts. This highest level of demand is known as peak demand. For more information about demand charges and how energy storage can lower peak demand, see “An Introduction to Demand Charges,” Clean Energy Group, August 2017, https://www.cleanegroup.org/wp-content/uploads/Demand-Charge-Fact-Sheet.pdf.
3 Lawrence Berkeley National Laboratory and Nexant, Inc, “The Inter-ruption Cost Estimate (ICE) Calculator,” Transmission Permitting and Technical Assistance Division of the u.S. Department of Energy’s Office of Electricity (OE) Delivery and Energy Reliability, Contract No.: DE-AC02-05CH11231, Accessed February 20, 2019, https://icecalculator.com/home.
4 For context, the national average duration for outages in 2015 was just under four hours, with a frequency of 1.4 outages per year. Only Duke Energy Progress performed better than this national average, highlighting a potentially greater need for resilience in the Southeast. See Eto, Joseph H., “Reliability Metrics and Reliability Value-Based Planning,” Lawrence Berkeley National Laboratory, October 2, 2017, https://emp.lbl.gov/sites/default/files/6._170928_necpuc_training_reliability_metrics_and_rvbp.pdf.
5 For more information about solar and battery storage third-party ownership financing structures, see Milford, Lewis and Robert Sanders, “Owning the Benefits of Solar+Storage: New Ownership and Investment Models for Affordable Housing and Community Facilities,” Clean Energy Group, February 5, 2018, https://www.cleanegroup.org/ceg-resources/resource/owning-the-benefits- of-solar-storage.
6 Elgqvist, Emma, Kate Anderson, and Edward Settle, “Federal Tax Incentives for Energy Storage Systems,” National Renewable Energy Laboratory, January 2018, https://www.nrel.gov/docs/fy18osti/70384.pdf.
7 u.S. Energy Information Administration, “Commercial Buildings Energy Consumption Survey (CBECS),” October 31, 2018, https://www.eia.gov/consumption/commercial.
Endnotes
8 See u.S. Energy Information Administration, “Commercial Buildings Energy Consumption Survey (CBECS): Building Type Definitions,” Accessed February 20, 2019, https://www.eia.gov/consumption/commercial/building-type-definitions.php for descriptions of each building type.
9 The Greenlink Group has previously performed more than a dozen analyses on the economics of solar, battery storage, and the combination of the two in the Southeast.
10 National Renewable Energy Laboratory (NREL), “EnergyPlus,” u.S. Department of Energy’s (DOE) Building Technologies Office (BTO), version 9.0.1, October 10, 2018, Accessed February 20, 2019, https://energyplus.net.
11 Some solar inverter manufacturers offer a secure power supply option that allows a standard electric outlet to remain energized during a grid outage. This option is not considered to be a feasible backup power solution for the building types evaluated.
12 McLaren, Joyce and Seth Mullendore, “Valuing the Resilience Provided by Solar and Battery Energy Storage Systems,” National Renewable Energy Laboratory (NREL), January 31, 2018, https://www.cleanegroup.org/ceg-resources/resource/valuing-resilience-solar-battery-energy-storage.
13 The details and availability specific electric rate tariffs are subject to change as utilities alter offerings and propose adjustments to current offerings. The rate tariff details presented here represent those used in the economic analysis and reflect rates details that were current and available to customers as of Fall 2018.
14 All future electricity rates are measured in real 2017 dollars in order to account for price fluctuations due to inflation.
15 Georgia Power, “Solar Buy Back,” Accessed February 20, 2019, https://www.georgiapower.com/company/energy-industry/energy-sources/solar-energy/solar/solar-buy-back.html.
16 Solar CrowdSource, “Solarize Atlanta,” Accessed February 20, 2019, https://www.solarcrowdsource.com/campaign/atlanta-ga.
17 Duke Energy, “Renewable Energy: North Carolina Rebates,” Accessed February 20, 2019, https://www.duke-energy.com/home/products/renewable-energy/nc-solar-rebates.
18 Wood McKenzie, “u.S. Front-of-the-Meter Energy Storage System Prices 2018–2022,” May 9, 2018, https://www.woodmac.com/our-expertise/focus Power--Renewables/U.S.-Front-of-the-Meter- Energy-Storage-System-Prices-2018-2022.

Technical AppendixRes il i ent southeast
www.resilient-power.org
Savings & Revenue
Lighting & Electricity
Running Water
Telecom Elevators & Accessibility
Life-Supporting Technology
Climate Mitigation
+ =+ =Clean
EnergyBatteryStorage
RESILIENTA project of Clean Energy Group
RESILIENT POWER PROTECTING COMMuNITIES IN NEED© Clean energy group
50 State Street, Suite 1, Montpelier, VT 05602 • Phone [email protected] • www.cleanegroup.org
april 2019