resilient food systems, resilient cities:...
TRANSCRIPT

Resilient Food Systems, Resilient Cities: Recommendations for the City of Boston
MAY 2015

2 Resilient Food Systems, Resilient Cities: Recommendations for the City of Boston
A Letter of Support from Boston’s Mayor Martin J. Walsh
I am pleased to announce the completion of the City of Boston’s Food System Resil-ience Study. Shortly after I took office, we launched an effort to map Boston’s Food System and identify points of vulnerability in food availability and access that could arise as a result of a natural disaster. We began by looking at sister cities, selected for best-in-class resilience planning or recent natural disasters. In mapping their food system vulnerabilities, and understanding their responses to these disasters, we have created a set of recommendations which we plan to implement in the coming years.
Boston has long been a leader on climate action, and is now the first city of its size to study and assess food system resilience. Boston has a complex food system of producers, processors, distributors, and retailers that feeds 645,000+ people. More than 100,000 people in our city are food insecure, living without adequate access to fresh, healthy food. We envision a resilient system in which all constituents have access to food, both in their daily lives and in the wake of a natural disaster.
In the fall of 2012, Hurricane Sandy struck New York and New Jersey, causing devastating damages to infrastructure and severely limiting both food availability and access. Boston was lucky to avoid the worst of Sandy, but with climate change we can expect a rise in sea levels and more extreme weather events in the future. We must better prepare our food system to be resilient after disruptions like hurricanes, floods, blizzards, and other natural disasters.
This resilience study was commissioned by the Office of Food Initiatives, and funded by the Henry P. Kendall Foundation and the Local Sustainability Matching Fund, a project of the Funders’ Network for Smart Growth and Livable Cities and the Urban Sustainability Directors Network. Addressing the vulnerabilities this study identified is not going to be easy, but if we work together, we will get there – along the way creating jobs, improving public health, and enlivening public space.
Sincerely,
Martin J. Walsh, Mayor of Boston

ICIC 3
The Importance of Food to the Development of a Resilient CityMany city leaders have prioritized disaster recovery programs and policies in response to the threat of climate change, and the correlative increase in the frequency and severity of natural disasters.1 This has ultimately led policymakers to explore the resilience of a city’s systems to withstand disasters and miti-gate their impact. Although the resilience of U.S. food produc-tion to climate change is being addressed nationally, the ability of urban food systems to withstand and recover from a natural disaster is not considered in most metropolitan resilience plan-ning. Yet, metro food systems that are disrupted by disasters may not return to normal operations for an inordinate amount of time if they are not resilient, which could cause significant food availability and food access issues. The growth of local food manufacturing and urban agriculture also raises questions about how best to mitigate risks associated with climate change impacts at national, regional and local levels.
The term “resilience” in the context of climate adaptation is often used in a broad or descriptive sense. While many defini-tions for resilience exist, at the core are three basic principles: the ability to adapt to changing conditions, withstand disrup-tions, and recover quickly.2 We define a resilient food system —the production, processing and distribution of food—as one that is able to recover from a negative shock and return to normal operations. For the purposes of this study we were narrowly focused on resilience to a natural disaster event in Boston. A resilient food system is characterized by several key components, including flexibility, diversity, redundancy, and adaptability. Additionally, a resilient food system includes individuals and organizations with the capacity to monitor and manage risks and vulnerabilities to shocks. For example, government agencies will be able to monitor risks to food dis-tribution across the city and be able to implement an action plan to mitigate the disruption.
The resilience of Boston’s food system to natural disasters is of increasing interest to the city in the wake of Hurri-cane Sandy, which narrowly missed Boston in 2012, and the record-breaking snowfall in the early months of 2015. Boston’s 2014 Climate Action Plan, a revision of the 2011 version, was rewritten with a focus on resilience and pre-paredness. In addition, the City is pioneering new innovations in natural disaster resilience design through the support of design competitions such as the Boston Living with Water competition. Boston also recently passed a zoning article for urban agriculture that is among the most progressive in the nation, in addition to being a leader in municipally sponsored food access programming, and providing municipal support for local food distribution. A thorough understanding of the resilience of Boston’s food system is necessary to guide policy
and program development for local agriculture that will build a strong and sustainable regional food economy that is able to withstand disruptions that may arise from climate change. It also places Boston at the leading edge of food system initia-tives and resilience planning.3 To the best of our knowledge, the only other city undertaking an analysis of the resilience of their food system is New York.
The recommendations provided in this report are the cul-mination of a one-year study commissioned by the City of Boston’s Office of Food Initiatives, Office of Emergency Management, Office of Environment, Energy and Open Space, and the Transportation Department and supported by funding from the Local Sustainability Matching Fund, a project of the Funders’ Network for Smart Growth and Livable Cities and the Urban Sustainability Directors Network, and the Henry P. Kendall Foundation, a Boston-based foundation focused on developing the regional food system. The Initiative for a Competitive Inner City (ICIC) and Next Street were engaged by the City of Boston to complete the study.4 Our efforts were guided by a local steering committee of 21 experts on resil-ience and food systems in Boston.
The study was designed to develop a framework that would not only be used to assess Boston’s food resilience, but that also could be used to assess food systems in other major cities throughout the U.S. The framework will enable cities to evaluate the exposure of their food system to specific shocks and stresses, identify critical areas of weakness, and design actions and programs to improve resilience. To that end, the study incorporates lessons learned and best practices from other cities undertaking resilience planning: Toronto, San Francisco and New York. As part of our research, we con-ducted a comprehensive literature review, analyzed public and proprietary data and interviewed 63 individuals rep-resenting organizations from across the food system. This report highlights significant findings from our research and provides a set of strategies and actions related to Boston’s food system vulnerabilities that should be included in future resilience planning. Our results also help identify the ways in which the city can participate in a larger regional dialog about food production, processing and distribution and the role Boston can play in strengthening New England’s food system.
The report is divided into four sections:
j A Framework for Food System Resilience Planning and Monitoring (p. 4),
j The State of Play in U.S. Cities (p. 4),j An Assessment of the Resilience of Boston’s Food System
(p. 11),j Strategies and Action for Creating a Resilient Food System
in Boston (p. 24).
4 Resilient Food Systems, Resilient Cities: Recommendations for the City of Boston
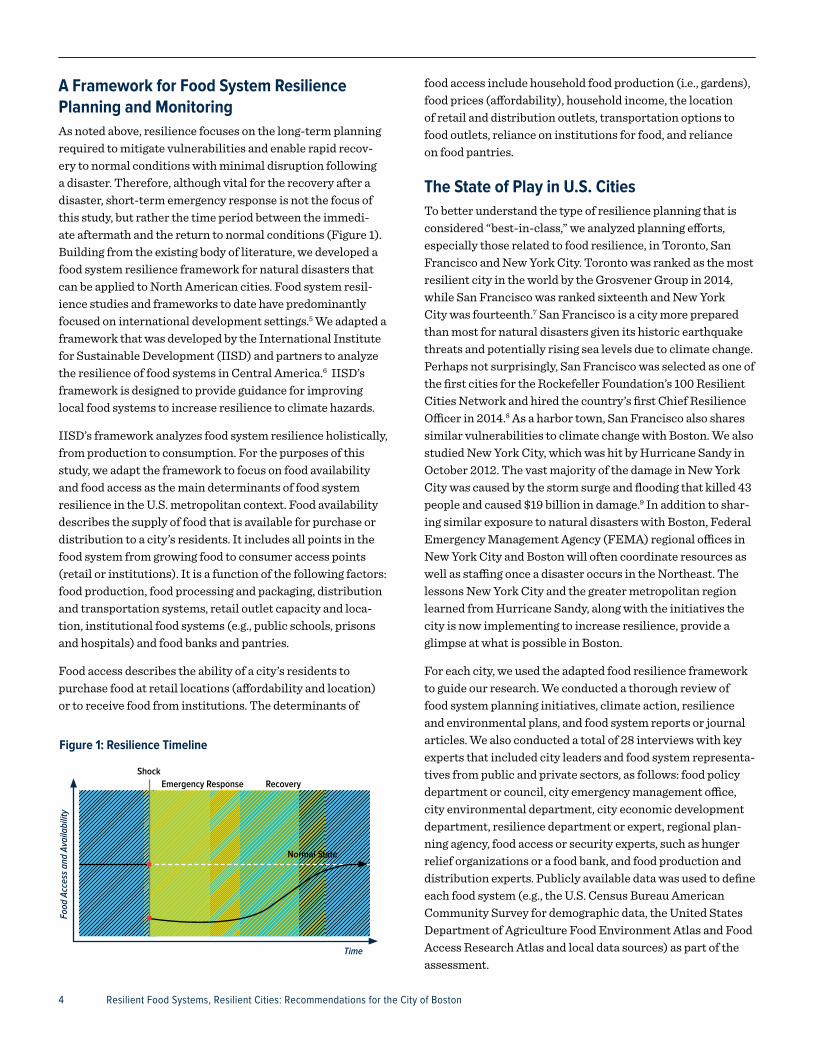
A Framework for Food System Resilience Planning and Monitoring As noted above, resilience focuses on the long-term planning required to mitigate vulnerabilities and enable rapid recov-ery to normal conditions with minimal disruption following a disaster. Therefore, although vital for the recovery after a disaster, short-term emergency response is not the focus of this study, but rather the time period between the immedi-ate aftermath and the return to normal conditions (Figure 1). Building from the existing body of literature, we developed a food system resilience framework for natural disasters that can be applied to North American cities. Food system resil-ience studies and frameworks to date have predominantly focused on international development settings.5 We adapted a framework that was developed by the International Institute for Sustainable Development (IISD) and partners to analyze the resilience of food systems in Central America.6 IISD’s framework is designed to provide guidance for improving local food systems to increase resilience to climate hazards.
IISD’s framework analyzes food system resilience holistically, from production to consumption. For the purposes of this study, we adapt the framework to focus on food availability and food access as the main determinants of food system resilience in the U.S. metropolitan context. Food availability describes the supply of food that is available for purchase or distribution to a city’s residents. It includes all points in the food system from growing food to consumer access points (retail or institutions). It is a function of the following factors: food production, food processing and packaging, distribution and transportation systems, retail outlet capacity and loca-tion, institutional food systems (e.g., public schools, prisons and hospitals) and food banks and pantries.
Food access describes the ability of a city’s residents to purchase food at retail locations (affordability and location) or to receive food from institutions. The determinants of
food access include household food production (i.e., gardens), food prices (affordability), household income, the location of retail and distribution outlets, transportation options to food outlets, reliance on institutions for food, and reliance on food pantries.
The State of Play in U.S. Cities To better understand the type of resilience planning that is considered “best-in-class,” we analyzed planning efforts, especially those related to food resilience, in Toronto, San Francisco and New York City. Toronto was ranked as the most resilient city in the world by the Grosvener Group in 2014, while San Francisco was ranked sixteenth and New York City was fourteenth.7 San Francisco is a city more prepared than most for natural disasters given its historic earthquake threats and potentially rising sea levels due to climate change. Perhaps not surprisingly, San Francisco was selected as one of the first cities for the Rockefeller Foundation’s 100 Resilient Cities Network and hired the country’s first Chief Resilience Officer in 2014.8 As a harbor town, San Francisco also shares similar vulnerabilities to climate change with Boston. We also studied New York City, which was hit by Hurricane Sandy in October 2012. The vast majority of the damage in New York City was caused by the storm surge and flooding that killed 43 people and caused $19 billion in damage.9 In addition to shar-ing similar exposure to natural disasters with Boston, Federal Emergency Management Agency (FEMA) regional offices in New York City and Boston will often coordinate resources as well as staffing once a disaster occurs in the Northeast. The lessons New York City and the greater metropolitan region learned from Hurricane Sandy, along with the initiatives the city is now implementing to increase resilience, provide a glimpse at what is possible in Boston.
For each city, we used the adapted food resilience framework to guide our research. We conducted a thorough review of food system planning initiatives, climate action, resilience and environmental plans, and food system reports or journal articles. We also conducted a total of 28 interviews with key experts that included city leaders and food system representa-tives from public and private sectors, as follows: food policy department or council, city emergency management office, city environmental department, city economic development department, resilience department or expert, regional plan-ning agency, food access or security experts, such as hunger relief organizations or a food bank, and food production and distribution experts. Publicly available data was used to define each food system (e.g., the U.S. Census Bureau American Community Survey for demographic data, the United States Department of Agriculture Food Environment Atlas and Food Access Research Atlas and local data sources) as part of the assessment.
Figure 1: Resilience Timeline
Emergency Response Recovery
Time
Food
Acc
ess
and
Avai
labi
lity
Normal State
Shock

ICIC 5
INSIGHTS INTO URBAN FOOD SYSTEM VULNERABILITIESThe nature of each city’s food system and their experiences dealing with natural disasters surfaced several potential vul-nerabilities for American cities in terms of food availability and food access (Table 1). The potential vulnerabilities served as hypotheses that we tested in Boston and informed further refinements of the framework.
Food ProductionThere was insufficient data on the origination of food prod-ucts for the three cities to analyze potential vulnerabilities. However, the fact that the amount and origin of food supply-ing each city was not known creates vulnerability. Without this data, effective planning for potential disruptions due to natural disasters or climate change is difficult. We also found that urban agriculture, while growing in each city, represents a very small share of the local food supply.
Distribution and TransportationThe distribution of food was identified as a major vulnerabil-ity in all three cities. The concentration of fresh food distri-bution through large, centralized markets in each city made them especially sensitive to this issue. The transportation of
food from the point of production to the point of consumer purchase is a vast and complex system that relies on numer-ous agents, a range of distribution methods, and various distribution points (Figure 2). As food travels from numerous farms to a limited number of processing and packaging points and then back out to a vast number of retail outlets, it is at risk of being caught in many potential “choke points” (Figure 3). Some food products may experience a sequence of handoffs as they are shipped from production, to processing facilities, to warehouses and finally to retail outlets. Some products, including fresh food, may have more straightforward connec-tions between production points to retail. For some food, such as milk, producers use direct store distribution (DSD), which bypasses distribution centers.
For most food products, common distribution points include the following:
1) Manufacturing, Processing and Packaging: Typically, perishable food is shipped from the point of production to a mixing center, though it may be first shipped to a warehouse or aggregation point. Non-perishable food may follow this route as well, though some is stored and shipped as demand merits.
Figure 2. Food Distribution Process
Smaller Grocery Stores and Corner Stores
National Grocery Stores
Regional Grocery Stores
Vertically Integrated Mixing Centers
Vertically Integrated Regional Dist. Centers
Large Scale Chain Stores (e.g., Walmart)
Integrated Regional Dist. Centers
3rd Party Distribution with Distributors
3rd Party Mixing Centers
PROCESSING AND PACKAGING
MIXING CENTERS DISTRIBUTION CENTERS/WAREHOUSES
RETAIL
Direct Shipments
Direct or Local Shipments
1 432
Local Distributors

2) Mixing Centers: Mixing centers are operated both by third parties and retailers that manage vertically integrated distribution systems (e.g., Walmart). Mixing centers receive large quantities of individual products (i.e., at least a full pallet). The mixing centers then “mix” that product with many others into product bundles (i.e., mixed pallets) that are then shipped to distribution centers. The reason that mixing centers are necessary and mostly operated by third-parties is that few retail chains have the demand for a full pallet of a single product.
3) Distribution Centers or Warehouses: Distribution centers are typically the last stop for food products before reaching a store’s shelves. Large regional and national stores typically, but not always, own their own distribution centers. There are also regional and national distributors that manage their own centers and then distribute product to both regional and local retail chains. There is also a wide range of more local distributors, many of whom specialize in perishable food. Many cities have a large fresh food distribution center (also called a market) that serves both large grocery stores and corner stores.
While some retail stores have vertically integrated distribu-tion, most retail outlets, even large chains, rely on a mix of different entities to perform the roles as described above; as such, food products will follow different paths to their shelves. This changes during the calendar year as sourcing of fresh foods changes as the seasons change (i.e., distribution “follows the sun”). Additionally, there are generally different paths to market for dry, cold and frozen products as these products require different conditions. For highly perishable, refriger-ated products, the “cold chain” must be maintained at every point, meaning the food must remain below a specific tem-perature to avoid spoilage.
Fresh Food Distribution In Toronto, the 40-acre Ontario Food Terminal is the city’s primary fresh food distribution facility (produce, dairy, eggs, poultry and fish). It is the largest wholesale market in Canada with over one million tons of produce passing through this terminal annually. More than 5,000 businesses are registered as buyers at the Ontario Food Terminal, with the size of stores ranging from small corner stores to large retailers.10 Likewise, the San Francisco Wholesale Produce Market is also the city’s primary fresh food distribution site, although a smaller pro-duce market, the Golden Gate Produce Market, is located in nearby South San Francisco.11 The San Francisco Wholesale Produce Market is located on a 25-acre site.12 In New York City, Hunts Point Distribution Center is the main fresh food distribution facility. The 329-acre site, located on the Hunts Point Peninsula in the Bronx, is the largest food distribution
center in the world and is home to three major food markets: the Hunts Point Cooperative Market, the Hunts Point Termi-nal Market and the New Fulton Fish Market, which provide meat, produce, and fish, respectively.13 About 60 percent of the city’s produce and half of the city’s meat and fish passes through the Hunts Point Distribution Center.14
Warehouse VulnerabilitiesThe location of these markets in “at risk” areas and in old buildings with insufficient capacity also create vulnerabilities in the food system. For example, many of San Francisco’s Pro-duce Market buildings were built in the 1960s and are unlikely to withstand an earthquake.15 An expert noted that the Market has limited capacity. In 2014, a new building opened that meets current seismic building codes and stringent LEED-Gold energy efficiency standards in order to expand the capac-ity of the Market, but it is already near its limits.16 One expert noted that high construction and land costs prohibited the building from implementing resilient design measures, such as a redundant power supply, and suggested that state and federal investment could help offset the cost of implementing resilient designs.
Surrounded by the East and Bronx Rivers on three sides, Hunts Point is especially vulnerable to flooding and storm surges; 28 percent of the site is located in a floodplain.17 Additionally, Hunts Point suffers from capacity issues.
6 Resilient Food Systems, Resilient Cities: Recommendations for the City of Boston
Figure 3: Food Distribution Chokepoint
Agriculture Fishing
Non- agricultural ingredients
Food processing
Restaurants Institutions
Catering
Retail
Food Distribution and Wholesale

ICIC 7
At the Terminal Market, only about 50 percent of produce is stored inside the warehouse facility. The remainder is stored in several hundred diesel trucks on the property.18 Hunts Point was not compromised during Sandy, but future flooding could cause significant food supply disruptions. If Sandy had taken a different path or arrived during high tide, the Hunts Point area might have flooded, lost power and significant inventory, and suffered from major operational interruptions.19 Multiple experts suggested that Hunts Point was spared from damage as a matter of luck and recognized its location as a significant vulnerability.
Critical Transportation IssuesNearly all of the food in each of the three cities arrives at major retail and distribution points via trucks. In addition, the food is then distributed to retail points by truck. Road systems and the physical condition of roads, bridges and tunnels are, therefore, critical points of vulnerability. The experts we interviewed in Toronto, for example, noted that the roads in their city are old, deteriorating and unable to meet existing demand.20 Flooding during significant rain-fall events has sometimes led to road closures due to flood-ing or significant road damage. In San Francisco, multiple experts and reports recognized that if the Golden Gate Bridge was closed or damaged after an earthquake, the City would become disconnected from much of the Bay Area, effectively making it an island.
The Sandy storm highlighted many of New York City’s transportation vulnerabilities. Several tunnels and bridges, including the critical George Washington Bridge, were closed, disrupting food deliveries. Over 45 percent of deliveries to the Hunts Point Cooperative Market and Produce Terminal use the George Washington Bridge21 and it is believed that nearly 30 percent of the truck traffic over the George Washington Bridge is carrying food.22 After Sandy, food distributors coor-dinated with traffic enforcement officials to bypass bridge clo-sures. In addition to road vulnerabilities, vehicles are another area of risk. For example, City Harvest, a food rescue organi-zation that delivered more than seven million pounds of food in direct response to Sandy, sustained significant and perma-nent damage to its truck fleet and refrigeration compressors due to the flooding of its fleet parking facilities.23 It needed to rent a fleet of 19 trucks to continue critical food distribution operations immediately after the storm.
Retail Capacity, Diversification and LocationThe experts we interviewed in Toronto and New York City noted how retail capacity, diversification and location may impact resilience. Multiple experts interviewed in Toronto suggested that the concentration of grocery store ownership was a concern, with only four major chains located in the city. They felt that this concentration of ownership was making the
city’s food supply more vulnerable. A New York expert noted that food retail stores in New York are unique since people tend to shop at independent bodegas rather than large grocery stores. Having many and diverse grocery options was a factor in the continued functioning of food retail after Sandy. Only certain neighborhoods experienced disruption in food retail. Residents relied on additional grocery stores, sometimes a few miles away, for their food needs. On the other hand, smaller stores have limited storage capacity, and often have depleted stock in the days after a storm. It took one small store nearly two weeks to restore a working supply chain.24
Food Bank System Capacity and LocationIn all three cities, food banks and pantries already play a sig-nificant, and increasing, role in providing food to residents. In Toronto, member agencies of food banks (i.e., food pantries) logged over one million visits in 2013.25 In San Francisco, 196 food pantries serve 12 percent of the city’s residents.26 They are supported by a regional food bank and other coordinating organizations. In New York, the food bank provides food for approximately 1,000 programs.27 They are also supported by food coalitions and food rescue organizations. In the event of a natural disaster, food banks and pantries in these three cities may not have the capacity to meet increased demand.
Food Access IssuesAll three cities highlighted food deserts and food afford-ability as their primary food access vulnerabilities. The U.S. Department of Agriculture (USDA) defines food deserts as census tracts with a substantial share of residents who live in low-income areas that have limited access to a grocery store or other healthy, affordable food retail outlets.28 Within San Francisco, 30,772 people (3.8 percent) live in a food desert. In New York City, only 9,947 people (0.1 percent) live in a food desert (all located in Staten Island).29 An expert noted that many of Toronto’s food deserts are located in the inner sub-urbs because the high-rise buildings do not usually have gro-cery outlets in accessible locations due to residential zoning restrictions. Although these areas were originally designed for automobile transportation, today’s residents now rely on public transportation or walking to access grocery stores.30
Household food production has also gained increasing attention with the local food system movement. As with urban agriculture, this represents a very small share of food production and in the case of Toronto and New York City is limited by relatively short growing seasons. Toronto has 4,500 garden plots on just over 1,000 acres.31 In New York, there were 530 registered community gardens covering 70 acres of land.32 In San Francisco, there are just over 1,000 community garden plots covering nine acres of land.33 Data on household gardens was not available.

8 Resilient Food Systems, Resilient Cities: Recommendations for the City of Boston
Food Insecurity The experts we interviewed also highlighted the importance of food security, or access to adequate food, to a resilient food system. In Toronto, one in ten households cannot always provide food for their family.34 Many of these households rely on community organizations to supplement their daily food needs. To help expand the capacity of community organiza-tions to meet food demands, the City launched the Aggregated Food Procurement initiative, an online ordering system that allows organizations to coordinate food purchases.35 As one Toronto expert explained, many community organizations purchase a portion of their food on an ad hoc basis from retail stores, which is both inefficient and costly. The online tool, which is the result of a public-private partnership, enables small and medium organizations to pool their purchasing power and purchase high quality, nutritious food in bulk while saving up to 20 to 30 percent in costs.
In the San Francisco Bay Area, one in seven people are food insecure,36 due in part to the high cost of living.37 In 2013, almost 51,000 people in San Francisco received Supplemen-tal Nutrition Assistance Program (SNAP) benefits, a federal nutrition program for families and individuals that meet certain income criteria. An additional 15,600 people received Special Supplemental Nutrition Program for Women, Infants, and Children (WIC) benefits, a federal program that pro-vides supplemental foods, health care referrals, and nutrition education for women and children.38 Sixty-one percent of students receive free or reduced lunches in public schools.39 Disaster planners in San Francisco recognized that certain low-income neighborhoods susceptible to food insecurity would require more city services and emergency food provi-sions in the event of an earthquake. In these neighborhoods, there are concerns that current food assistance programs, such as SNAP, are underutilized and do not necessarily address the root causes of food insecurity.
In New York City, one in six residents—or 1.4 million people—are reported to be food insecure, approximately 1.8 million residents receive SNAP benefits, and 75 percent of public school students qualify for free or reduced price lunches.40 One expert in New York City noted significant problems that led to food insecurity after Sandy: There were relatively few sites, in inconvenient locations, distributing disaster SNAP benefits after Sandy. In a survey of citywide food pantries and soup kitchens one year after Sandy conducted by the New York City Coalition Against Hunger (NYCCAH), a majority (59.5 percent) responded that they were feeding more people at least partially due to Sandy.41 All agencies in Staten Island, one of the areas hardest hit by Sandy, reported feeding more people.
RESILIENCE PLANNINGThe three cities are using a variety of strategies to address, directly and indirectly, vulnerabilities in the food system and achieve greater food resilience. Strategies include a mix of short- and long-term responses to disasters or potential disas-ters. The planning efforts in each city show how long-term resilience planning is being used to complement short-term disaster planning to strengthen the food system along many dimensions.
The city government in each city has dedicated positions that manage food and resilience planning and collaboration. Coordination between resilience and food planning varies between cities. Toronto’s primary food planning strategies are in public health and economic development. Resilience plan-ning to natural disasters is led by the City of Toronto Envi-ronment and Energy Division. The Environment and Energy Division coordinates resilience planning across divisions, agencies, and partners. The Environment and Energy Division was responsible for forming the WeatherWise Partnership in 2011, an action group of more than 50 public, private and not-for-profit organizations from across the Toronto region that collaborates and plans for extreme weather resilience. Resilience planning, to date, has not included food planning, although food planners and resilience planners recognize the importance of food resilience planning.
San Francisco’s Chief Resilience Officer is responsible for coordinating and unifying the City’s resilience efforts in earthquake safety and hazard mitigation, climate change, and infrastructure across departments, groups and sectors.42 At the time of our interviews, it was unclear if food resilience planning would be included in the Chief Resilience Officer’s plans. In addition, regional organizations such as SPUR and the Association of Bay Area Governments Resilience Pro-gram are leaders in disseminating resilience information and research throughout the Bay Area. The City has also been on the leading edge of food planning with San Francisco Food, a Food Policy Council established in 2009 as part of an Execu-tive Directive for Healthy and Sustainable Food, and a Food Security Task Force established in 2005.
It’s all about logistics. The analogy I would give is air traffic control, getting something from point A to point B. Say there’s a huge storm. How do you get the trucks to a distribution center, then trucks from a distribution center to the retailer. Food may already be at the distri-bution center or en route. It’s like planes jamming up. — FOOD DISTRIBUTION EXPERT

ICIC 9
In New York City the main channels for resilience planning are the Office of Recovery and Resilience, established in 2014 and the Office of Long-Term Planning and Sustainabil-ity, established in 2006. Both offices are part of the New York City Mayor’s Office. The Mayor’s Office of Food Policy works on food access and security, while the Regional Planning Agency, serving the larger metro region, is addressing natural disaster resilience. The Office of Recovery, Mayor’s Office of Food Policy and New York City Economic Development Corporation, are responsible for implementing many of the food supply resilience initiatives outlined in Stronger, More Resilient New York, a comprehensive plan for rebuilding the communities impacted by Sandy and increasing the resilience of infrastructure and buildings citywide.43 In addition, $930 million in federal funds were made available through the Rebuild by Design competition, launched by the United States Department of Housing and Urban Development and Presi-dent Obama’s Hurricane Sandy Task Force.44 It generated ten designs for the Sandy-affected region, seven of which are now underway.
All three cities realized that they needed additional data and information to help inform their resilience planning. In San Francisco, for example, a recent research report explores food resilience and post-disaster food needs of community nonprofits.45 The report identified how disaster food resil-ience for low-income and vulnerable populations can be advanced through modest philanthropic funding. New York City has worked proactively to gather more data to improve resilience, as demonstrated by the extensive Stronger, More Resilient New York report. One of the report’s recommenda-tions was for further study of the food supply and expanding prior energy studies to explore options for cost-effective, continuous power for the Hunts Point Distribution Center. The Mayor’s Office of Recovery and Resilience, along with the New York City Economic Development Corporation, issued an RFP in May 2014 for a food supply resilience study to learn more about the origins of food arriving in the city and to better understand supply chains and their reactions to future disas-ter scenarios.46 The contract was awarded, but had not been initiated as of date of this publication.
RESILIENCE IMPLEMENTATIONVulnerable food infrastructure is being addressed in each city. As part of its 2008 Climate Change Adaptation Strat-egy, Toronto’s Energy and Environment Division developed a groundbreaking process and electronic tool known as the “Toronto Climate Risk Assessment Process and Tool” that allows City service and infrastructure providers to better identify and mitigate climate change-related risks. To date, assessments have been conducted in two City Divisions:
Transportation Services and Shelter, Support and Housing Administration. Other divisions will follow.47 To improve the road infrastructure, the City is beginning to adopt climate adaption measures such as permeable surface roads to mini-mize storm runoff.48 At the Ontario Food Terminal, climate adaptation and resilience features were implemented in the past decade.49
The City of San Francisco is carrying out a 20-year $100 mil-lion expansion and renovation project and new, 60-year lease that allow the San Francisco Wholesale Produce Market to make better use of existing space.50 As part of the project, a new 82,000 square foot facility opened on the site in fall of 2014, constructed in compliance with seismic building codes. Subsequent phases will improve the streets and roadways surrounding the Market and replace the Market’s existing warehouses with modern structures. San Francisco has been planning for more resilient energy, transportation, and water systems for many years. Over the past decade, Pacific Gas and Electric (PG&E), the primary electricity provider for the Bay Area, has completed disaster mitigation on much of its electri-cal infrastructure to be able to withstand future earthquakes, including buildings, transmission lines, and substations.51 The transportation authority CalTrans has continually updated Seismic Design Criteria to make bridges safer, and many major bridges have been retrofitted.52 San Francisco’s vulnerable water supply is also being improved. California adopted a $4.6 billion Water System Improvement Plan, which has provided funds to upgrade many of the system’s pipes, dams, and reservoirs.53
At Hunts Point in New York City, the Lifelines design project addresses many of the facility’s weaknesses. This project was chosen in the Rebuild by Design competition.54 The plan includes a flood levee and a greenway on the water-front for flood control and pier improvements that will allow food to be transported via ship during emergencies, adding redundancy to the food transportation system. It also includes a more reliable micro-grid generator and other updates to outdated energy infrastructure.55 On the retail side, the City created business emergency preparedness guidelines and is working with the State Legislature to pass legislation requir-ing that certain food retailers either install a transfer switch to enable quick connection to a generator, or to maintain a backup generator on site. The proposed law requires that backup power be capable of powering retailers’ basic systems, but does not require capacity to power refrigeration equip-ment. The law would apply to stores with 20,000 square feet or more of floor space, or those having 60 or more full- or part-time employees.56

10 Resilient Food Systems, Resilient Cities: Recommendations for the City of Boston
Table 1: Food Availability and Food Access Resilience Factors
Resilience Factors Description Potential Vulnerabilities in Urban Areas
Food Availability
Production, processing & packaging Facilities that grow and transform food into products that are sold or distributed to consumers
• Insufficient data on food origination
• Local food production is growing but limited
• Concentration of food production and processing in just a few companies and geographic locations
Distribution & transportation systems
Pathways (transportation routes, facility nodes) that food products travel from processing or packaging to retail or distribution
• Complex distribution system with many potential “choke points”
• Centralized fresh food distribution
• Distributors with limited capacity to serve growing populations, outdated buildings and locations in “at risk” areas
• Transportation of most food by truck makes road, bridge and tunnel conditions and capacity a significant issue
• Lack of contingency delivery routes
• Vehicle fleet parking in “at risk” locations
• Local gas supplies
Retail capacity Number and square feet of grocery stores and corner stores and ability to meet demand
• Numerous and diverse retail outlets create resilient food supply for consumers
• Individual corner stores (e.g., bodegas) have limited capacity and storage
• Corner stores unlikely to have contingency plans in place or backup power
• Food availability will vary by neighborhood depending on retail outlet profile
Diversification of retail outlets Diversity of grocery store and corner stores and numbers of different owners
• Large national chains have more resources to recover from disruptions
• Concentration of grocery stores in a few national chains creates risk
Location of retail outlets Physical location of retail outlets • Grocery stores may be located in “at risk” areas
Food bank system capacity Number and square feet of food bank and food pantries and ability to meet demand
• A strong food bank and efficient system is essential
• Increasing dependence on food bank system in normal state leads to capacity issues
Food bank system location Physical location of food bank and food pantries
• Food bank may be located in “at risk” areas
Food Access
Household food production Household’s ability to grow food • Limited potential, especially in four-season climates
Distance to retail outlets and food pantries
Number of retail outlets and food pantries within 1-mile radius
• Food deserts in normal state
• Public transportation needs associated with access to food outlets
Food affordability Ability to purchase food, with and without subsidies
• Increasing issue in major urban areas and root cause of food access
Reliance on food pantries Number of people who rely on food pantries for daily food needs
• Increasing dependence on food pantries in normal state and after disruptions
• Food pantry supply chain is inefficient
• Public schools provide breakfast and lunch to a large population of children

ICIC 11
An Assessment of the Resilience of Boston’s Food SystemA refined resilience framework and food system vulnerability hypotheses derived from our research on Toronto, San Fran-cisco and New York City guided our analysis of the resilience of Boston’s food system (Table 1). The findings that follow were informed by interviews with 35 key experts from public and private sectors (see Appendix) and a thorough review of secondary sources of information, including food system planning initiatives, climate action, resilience and environ-mental plans, and food system reports and articles. We also analyzed proprietary and publicly available data.
A comprehensive resilience study should trace the produc-tion points of all food products. Given the limited scope of our study, and data limitations, we focused on the supply chain from processing and packaging to retail outlets. To more fully analyze vulnerabilities associated with this segment of the food system, we traced the source of six food items back to their processing or packaging points: bread (white, commer-cially produced), milk (fresh, whole), lettuce, chicken breast, chicken noodle soup (canned), and infant formula. These items were chosen because they represent nutrition catego-ries (i.e., protein, dairy, grain, vegetables) that most house-holds in Boston consume as well as infant formula, which is a specialized product. The food items also represent products along the continuum of fresh to shelf-stable. Albeit limited, our study elucidates some important vulnerabilities to a natu-ral disaster in Boston and suggests issues that may cut across other food products.
Our focus on resilience, and not the immediate aftermath of a natural disaster, justifies the exclusion of analyzing food that is supplied through institutions (e.g., K-12 public schools, hospitals and prisons), which are admittedly an important component of any urban food system. Most institutions are supplied by national food service providers such as Aramark that would not be vulnerable to a natural disaster in Boston. Once the institutions are back to normal operations it is highly likely that the food service providers would be able to supply them as normal, assuming no transportation barriers. Further, hospital and prison populations would be moved to other facilities in the event of a major natural disaster. The closure of public schools would increase food demand from other sources and, therefore, impact the food system. We included this assumption in the discussion that follows.
FOOD AVAILABILITY VULNERABILITIESAs with the other cities we studied, there was insufficient data on the origination of food products into Boston. It is estimated that 90 percent of the food consumed in New England is pro-duced outside of the region. New England produces about half
of the dairy products consumed in the region, less than half of the vegetables, and only a fraction of most other foods.57 Massachusetts has approximately 7,755 farms in production, covering over 523,000 acres, and an annual market value of $492 million dollars.58 The primary agricultural sectors in Massachusetts are greenhouses and nurseries, cranberries, vegetables, other livestock and poultry, milk, and aquaculture.
We also found that urban agriculture, while growing, still represents a very small share of the local food supply. There are currently six commercial urban farms in Boston operating on 14 plots throughout the City: Allandale Farm, City Grow-ers, Corner Stalk, The Food Project, Katsiroubas Brothers Fruit and Produce, and ReVision Urban Farms.59 One expert noted that the Food Project also supports 50 community garden beds a year, with on-site space for community garden-ing. However, there is significant interest in Boston to expand local food production and processing in the city and New England. For example, the New England Food Vision hopes that 50 percent of the food consumed in New England will be produced in New England by 2060. While this outcome may mitigate some climate change risks (e.g., by decreasing depen-dence on California), it may increase risks associated with local natural disasters. In addition, policies and organizations focused on increasing the number of local food manufac-turing companies in Boston in an effort to create local jobs, especially for residents of the inner city, are unintentionally increasing the city’s exposure to food availability risks in the event of a natural disaster.
Initiatives focused on expanding local food production and processing create new food availability vulnerabilities. A lack of sufficient information on the origination of Boston’s food supply impedes the development of effective policies.
Processing and Packaging We expect that a natural disaster, such as a hurricane or blizzard, will impact components of Boston’s food system outside of the City’s limits, such as processing and packaging facilities and distribution. To assess locational vulnerabili-ties of these components, we looked at facilities in a 75-mile radius of Boston. The 75-mile radius roughly corresponds with the typical extent of hurricane force winds.60 This radius gives us a starting point for assessing locational vulner-abilities and expected areas of damage; however, the actual impacted area will vary by natural disaster type, path, magnitude and location.
Milk: Milk is highly perishable and has to be transported from farm to consumer relatively quickly. Therefore, like other cities, Boston’s milk is supplied and processed by

regional dairy farms and processing facilities. Most of the milk consumed in Boston is supplied by Northeast dairy farms and processed in Massachusetts.61 There are nine raw or pasteurized fluid milk processing facilities in Massachu-setts certified by the State Health Department.62 Five of the certified fluid processing facilities in Massachusetts are located within 75 miles of Boston. In addition, seven process-ing facilities permitted to ship milk into Massachusetts are within 75 miles of Boston, including one in Connecticut, three in New Hampshire, and three in Rhode Island.63
The majority of milk consumed in Boston is supplied and processed by two large dairy corporations: Suiza and Hood. Suiza, which owns Dean Foods and Garelick Farms, supplies 63.7 percent of all grocery milk in New England, including private label. It also supplies nearly all of the private label milk in Boston.64 Hood supplies 20.1 percent of all grocery milk in New England, including private label milk.65 Hood has one facility in Massachusetts, located in Agawam, approxi-mately 95 miles from Boston.66 Garelick Farms operates four major processing facilities in New England, with two facili-ties less than 75 miles from Boston and the closest located in Lynn.67 Garelick should be well positioned to respond effectively if any one plant has to stop operations, but the record snow events in early 2015 surfaced some potential vulnerabilities. In particular, with road traffic delayed by weather, federal Hours of Service (HOS) regulations signifi-cantly curtailed Garelick’s overall distribution capacity. A representative from Garelick estimates that it took Garelick a full month to return to full capacity in terms of filling delivery orders to Boston following the initial major snow event and that 20 percent of Boston’s grocery stores were out of milk for at least 24 hours at some point during this event.
Chicken: Chicken production and processing in the U.S. is highly concentrated in the South68 often in integrated produc-tion complexes.69 Fifty-three percent of chicken is produced by four firms: Tyson, Pilgrim’s Pride, Sanderson Farms, and Perdue.70 Together, they have approximately 95 chicken slaughterhouses and processing facilities in 18 states, with the majority in Arkansas, Georgia and Texas.71 The closest facili-ties of these four companies are in the Mid-Atlantic, with two facilities in Delaware (Perdue), one in Maryland (Perdue) and
one in Pennsylvania (Tyson). Seven chicken processing plants operated by smaller companies operate within a 75-mile radius of Boston.72
Lettuce: Lettuce production and packaging in the U.S. is highly concentrated in California and Arizona, which account for about 98 percent of commercial domestic output, although it is supplemented seasonally by local production.73
White bread: Commercially available white bread is manu-factured either through private label brands (i.e., store brands) or name brands. Private label brands, in aggregate, account for 27 percent of all fresh bread sales in the U.S. Anecdotal evidence from a food buyer suggests that the majority of commercial white bread sold in Boston is private label. The food buyer estimated that over 75 percent of households in the Boston area purchased private label bread at least once in 2014. Due to insufficient data, we were not able to deter-mine the leading private label brands in Boson. Three brands, Bimbo Bakeries USA (a subsidiary of Grupo Bimbo), Flowers Foods, and Pepperidge Farm are the primary national branded bread manufacturers, controlling over half of the fresh bread market.74 Private label bread is often produced by leading bread manufacturers. For instance, Flowers Foods produces 15 percent of all private label bread sold in the United States.75
Commercial bread production tends to take place closer to urban centers to be near the customer base, although ingredients are produced elsewhere (e.g., wheat is produced in the Upper Midwest and Canada). Bimbo Bakeries, for example, which produces Arnold, Freihofer’s and Sara Lee brands among others, has three locations in Massachusetts (Pittsfield, Yarmouth, and Millbury).76 Flowers Foods, whose brands include Nature’s Own, Sunbeam and Wonder, has five bakeries located in Maine, Vermont and Pennsylvania.77 However, most of the regional supply of commercial white bread is produced outside of the 75-mile radius of Boston. In total, there are only two major commercial bread bakeries and two private label/regional brand bakeries operating within a 75-mile radius of Boston.
Chicken noodle soup: There are several brands of chicken noodle soup being sold and distributed in Boston, based on anecdotal evidence, although Campbell’s Soup and Progresso, which is owned by General Mills, are the market leaders. Campbell’s Soup controls more than 60 percent of the market,78 while Progresso controls 13.5 percent.79 We did not trace all of the ingredients for chicken noodle soup although our findings for wheat and chicken are relevant. Neither Campbell’s Soup nor Progresso have soup facilities operating within a 75-mile radius of Boston.
12 Resilient Food Systems, Resilient Cities: Recommendations for the City of Boston
Let’s say you send out a hundred drivers on a given day. If 10 work 14 hour days because of the conditions, then they can’t work the next day: too many hours. Then I only have 90 drivers. If that happens again and again, I won’t have enough people. — FOOD DISTRIBUTION EXPERT

Infant formula: This is a very concentrated market with three major manufacturers (Mead Johnson, Nestle, and Abbott) controlling 98 percent of the market. Mead Johnson (Enfamil Infant) is the only WIC-approved provider of stan-dard infant formula in Massachusetts. The company’s manu-facturing plants are located in Michigan and Indiana.
The supply of milk in Boston is vulnerable to longer-term disruptions caused by a natural disaster in the greater Boston area. Twelve processing plants are located within a 75-mile radius of Boston and milk supply is dominated by two corpora-tions. The concentration of chicken, lettuce and infant formula supply in the hands of few companies and geographic loca-tions creates a different set of risks for Boston’s food supply that should be addressed in future resilience planning efforts.
Distribution and TransportationBoston food stores and institutions are supplied by a robust mix of integrated retail distribution systems and national, regional and local distributors, with key distribution points spread across the region. As one industry expert explained, the city’s large grocery stores, and national retailers that sell food, such as Target, rely on a mix of vertically integrated and third-party distribution centers (e.g., C&S Wholesale Grocers or Bozzuto’s) for both fresh and shelf-stable food products. The city’s local fresh food distributors cater to both large grocery stores and corner stores in different capacities. The larger stores may rely on local fresh food distributors (e.g., vendors in Newmarket, Chelsea or Everett), directly or indirectly for certain products or at certain times of the year. The city’s corner stores rely on a mix of third-party distribu-tion centers or direct access (i.e., buying product directly from local or regional distributors).
Local fresh food distributors have smaller, specialized ware-houses that are often clustered in several locations in and around Boston. For example, the distributors located in Chelsea and Everett predominantly sell produce. The New England Produce Center (in Chelsea) was built in 1968 and contains 128 store units. It is the largest privately held produce market in the country. Next door to the New England Produce Center is the Boston Market Terminal (in Everett). The two markets are near capacity serving a growing population.80 In Boston, Newmarket distributors primarily sell meat and seafood, although they also sell produce and baked goods. The Port of Boston plays an important role in importing some food commodities by boat (e.g., frozen fish), which are then distributed locally via truck.81
While the decentralized nature of the distribution system in Boston limits some risks associated with natural disasters, their location in or near floodplains creates other risks. The
New England Produce Center is located in a FEMA desig-nated “low- to moderate-risk” flood zone. Forty-five percent of Boston, Chelsea and Everett wholesalers would likely flood if a 7.5-foot storm surge, another flood marker designated by The Boston Harbor Association, hit Boston during high tide.82
As with the other cities we studied, the majority of Boston’s food (94 percent) arrives by truck. Many of Boston’s main road-ways are at capacity and deteriorating. Congestion impacts for both passenger and freight vehicles are projected to increase significantly in the metropolitan Boston region and statewide. Forty-nine percent of Boston area roads are in substandard condition.83 There are only two state and federal designated truck routes in Boston, I-90 and I-93. In Boston, nearly all of I-93, the critical North-South route that includes the Central Artery tunnel system in downtown Boston, is projected to be vulnerable to coastal flooding via coastal storms and sea level rise.84 One industry expert noted that most distribution points are located outside of the city. Shaw’s distribution center is 30 miles to the north in Methuen. Stop and Shop’s distribu-tion center is approximately 50 miles to the south in Freetown. Trader Joe’s distribution center is 40 miles to the south in Middleborough. Whole Foods has kitchen and distribution facilities in Everett.85 Since these distribution centers are located either north or south of Boston, I-93 would likely be the primary transportation route into the city.
Boston’s old and narrow secondary streets pose another source of risk in the food distribution system. The feeder roads to some distributors were not designed to handle the traffic volume and are deteriorating, creating traffic conges-tion issues.86 Streets that were further narrowed due to snow build-up during the 2015 winter storms also made it difficult for trucks to pass, causing delivery delays. Many of the more local, specialized distributors (e.g., Newmarket) and grocery stores lacked the resources to remove snow from their lots. Slow snow removal limited access to loading bays, delay-ing deliveries. A review of the Mayor’s 24 Hour Hotline data revealed that snow build-up prevented or delayed food organizations, such as food pantries, the food bank and grocery stores, from receiving food deliveries.
Boston’s North-South truck route (I-93) poses the greatest vulnerability for the delivery of food, followed by the city’s narrow, secondary streets, due to location of distributors, and risk of flooding and closures. Secondary streets to some distributors are deficient and deteriorating. The fresh food distributors serving Boston’s smaller retail outlets have limited capacity to serve a growing population, limited storage capacity (including cold storage) and are clustered in three proximate locations that are vulnerable to flooding.
ICIC 13

Retail Capacity, Diversification and LocationBoston’s food retail outlets comprise a mix of large national, regional, and local grocery stores as well as many corner stores (Figure 4). Grocery stores are defined as offering a full-range of food items and are 7,000 square feet or larger. Corner stores are convenience stores or food marts that pri-marily offer a limited line of food items. There are currently 40 grocery stores, with at least four more in development, and 240 corner stores in Boston.87 The grocery stores are owned by 16 unique companies although 53 percent of the stores are owned by three large chains: Shaw’s (which owns Star Market), Stop & Shop, and Whole Foods.88
Because of their larger size, grocery stores offer a greater number of different products than corner stores, especially within produce, meat and other fresh food. A quick comparison of the availability of the six food products highlighted above in corner stores and grocery stores, found that only three (milk, chicken soup and bread) were found in the corner store in Back Bay that we surveyed and only two (milk and chicken soup) in the Roxbury corner store. Lettuce, chicken breast and infant formula were not available in the corner stores in either neighborhood. In addition, bread was not available at the corner store in Roxbury.89 Residents of inner city neighborhoods such as Roxbury that are served by a disproportionate number of corner stores, versus grocery stores, are likely to face limited food options under normal circumstances.
In addition to having fewer options for consumers, corner stores and smaller grocery stores may face longer periods of closure after a natural disaster because they do not have access to national resources to help them tap into other supply chains. Most of Boston’s food retail outlets are located in areas that are not at risk of flooding; no grocery stores are located in a FEMA floodplain or five-foot storm surge zone. Twenty-three percent of the grocery stores, however, could flood if a 7.5-foot storm surge hit during high tide. This includes one grocery store in Allston, two grocery stores in Dorchester, one in East Boston, two in Fenway and three in the South End. Only two corner stores are located in the FEMA floodplain, one in East Boston and one Downtown, but nearly a quarter of the corner stores, in 13 neighborhoods, could flood if a 7.5 foot storm surge hit during high tide (Table 2).
Based on feedback from experts, the majority of grocery stores are likely to have short-term contingency plans in place in preparation for a natural disaster, but they are not prepared to respond long-term to major supply chain disruptions and may vary by organization. While we were unable to analyze the preparedness of corner stores, anecdotes suggest that they are unlikely to have any contingency plans in place. It appears that very few, if any, grocery stores have backup generation
due to the prohibitive cost of these systems. As one local grocery store representative told us, “We thought we were installing a proper backup system, but it turned it was only enough to keep the lights on for a few hours.” It is likely that corner stores would simply stay closed until supply chains returned to normal.
Although the decentralized, robust food retail and distri-bution network in Boston makes the food system innately resilient, it poses challenges for planning and coordination. While a number of organizations and associations exist that represent the food retail and distribution network, their coordination with each other and City agencies remains infor-mal. The Massachusetts Food Association, a nonprofit trade association for the state’s supermarket and grocery industry, has membership that includes large chain supermarkets and wholesalers in and near Boston; however, their membership does not include some of the independent grocery stores in the City. The Latin American Grocers Association represents some of the smaller corner stores in Boston. The Newmarket Business Association represents the wholesalers, as well as other businesses, in the Newmarket area. While these asso-ciations interact with the City in various capacities, no known formal resilience coordination is in place. For example, the Massachusetts Food Association is well connected with the state government, and coordinates with the Massachusetts Emergency Management Agency during disasters; however, no coordination takes place between the Massachusetts Food Association and the City of Boston’s Office of Emergency Management. No formal coordination has taken place with these associations and city agencies responsible for resilience or climate change planning, such as the Boston Transporta-tion Department, Boston Redevelopment Authority or Office of Environment, Energy, and Open Spaces.
One potential issue that stronger public-private coordina-tion could solve is an increase in demand from neighborhood stores due to a natural disaster. For example, a long-term closure of public schools would likely increase demand for food from retail outlets in certain neighborhoods. One school, Mario Umana School in East Boston, is located in a FEMA floodplain, while 28 more schools would likely flood if a 7.5-foot storm surge hit Boston during high tide.90 There are 128 K-12 Public Schools in Boston that serve breakfast and lunch to 57,000 students.91 Seventy-eight percent of students qualify for free or reduced lunch and breakfast.92 Most K-12 students are located in the following neighborhoods: Dorchester (29.7 percent), Roxbury (11.5 percent), Hyde Park (8.5 percent), East Boston (7.7 percent) and Mattapan (6.2 percent).93 The percentage of neighborhood residents aged 5 to 17 years old for Boston on average is 11.3 percent; the percentage exceeds the city average in the same neighborhoods listed above.
14 Resilient Food Systems, Resilient Cities: Recommendations for the City of Boston

ICIC 15
Source: Boston Redevelopment Authority (BRA), 2014, Boston Neighborhood Shapefiles, http://bit.ly/1cbHcoF; BRA, 2013, Grocery Stores in Boston, http://bit.ly/1BdgJ1M; BRA, 2014, Neighborhood Profiles: City of Boston, http://bit.ly/1oDrmEw; Mayor’s Office of Food Initiatives, 2013, Corner Stores, http://bit.ly/1NSxxF6;
Figure 4: Boston Grocery Stores and Corner Stores by Neighborhood
Dorchester(114,235)
Hyde Park(30,637)
Roxbury(48,454)
West Roxbury(30,446)
East Boston(40,508)
Brighton(45,801)
Jamaica Plain(37,468)
Roslindale(28,680)
Mattapan(22,600)
Allston(29,196)
South Boston(33,311)
Fenway(33,796)
Charlestown(16,439)
South End(24,577)
Downtown (11,215)
Back Bay(18,088)
Mission Hill(16,305)
South Boston Waterfront
(1,889)
Beacon Hill(9,023)
North End(10,131)
West End(4,080)
Longwood Medical Area
(3,785)
Chinatown (4,444)
Bay Village(1,312)
Leather District(639)
CITY OF BOSTONmedian
household income
$52K BACK BAY
median household income
$86K
ROXBURYmedian
household income
$28K
Grocery Store Corner Store
(Neighborhood Population)
Median Household Income
≤ $35,000
> $35,000 - $50,000
> $50,000 - $75,000
> $75,000MILES
0 0.5 1 2

16 Resilient Food Systems, Resilient Cities: Recommendations for the City of Boston
Table 2: Food Availability Resilience Characteristics for Boston Neighborhoods
Neighborhood Population Percentage of Neighborhood Population That is School-Aged (Aged 5 to 17)
Number of Grocery Stores
Grocery Stores Per 1,000
Number of Grocery Stores in 7.5 Foot Storm Surge
Number of Corner Stores
Corner Stores Per 1,000
Number of Corner Stores in Floodplain
Number of Corner Stores in 7.5 Foot Storm Surge
Allston 29,196 2.5% 3 0.10 0 12 0.41 0 1
Back Bay 18,088 3.4% 2 0.11 0 5 0.28 0 3
Beacon Hill 9,023 4.9% 0 0.00 0 3 0.33 0 1
Brighton 45,801 4.4% 2 0.04 1 15 0.33 0 0
Charlestown 16,439 10.6% 1 0.06 0 6 0.36 0 3
Dorchester 114,235 17.4% 5 0.04 2 47 0.41 0 2
Downtown 11,215 3.1% 0 0.00 0 23 2.05 1 8
East Boston 40,508 13.0% 1 0.02 1 28 0.69 1 12
Fenway 33,796 1.3% 2 0.06 2 14 0.41 0 10
Hyde Park 30,637 17.6% 5 0.16 0 9 0.29 0 0
Jamaica Plain
37,468 10.5% 3 0.08 0 9 0.24 0 0
Longwood Medical Area
3,785 2.1% 0 0.00 0 0 0.00 0 0
Mattapan 22,600 18.7% 2 0.09 0 8 0.35 0 0
Mission Hill 16,305 8.2% 1 0.06 0 2 0.12 0 0
North End 10,131 1.5% 0 0.00 0 7 0.69 0 2
Roslindale 28,680 12.7% 2 0.07 0 5 0.17 0 0
Roxbury 48,454 17.4% 2 0.04 0 20 0.41 0 4
South Boston
33,311 10.2% 2 0.06 0 10 0.30 0 3
South Boston Waterfront
1,889 1.2% 0 0.00 0 2 1.06 0 1
South End 24,577 8.1% 4 0.16 3 10 0.41 0 9
West End 4,080 1.4% 1 0.25 0 1 0.25 0 0
West Roxbury
30,446 13.8% 2 0.07 0 4 0.13 0 0
City of Boston
617,594 11.3% 40 0.06 9 240 0.39 2 59
Notes: Population, grocery stores per 1,000 and corner stores per 1,000 figures use population data from the 2010 U.S. Census Bureau’s Decennial Census provided by the Boston Redevelopment Authority. Grocery store analysis excludes two grocery stores that closed (Shaw’s and Kam Man in Dorchester) and includes one grocery store that opened (Whole Foods Market in the South End) since grocery store data was published. The Harbor Islands are excluded from neighborhood analysis.
Sources: Boston Redevelopment Authority. “2010 Census Tracts & Neighborhoods.” Boston, MA: Boston Redevelopment Authority, n.d.; Boston Redevelopment Authority. “Boston Neighborhood Shapefiles.” Data Boston. Last modified January 24, 2014. https://data.cityofboston.gov/City-Services/Boston-Neighborhood-Shapefiles/af56-j7tb; City of Boston Mayor’s Office of Food Initiatives. “Corner Stores.” Data Boston. Last modified January 30, 2013. https://data.cityofboston.gov/dataset/Corner-Stores/4vcu-nshu; Federal Emergency Management Agency. “National Flood Hazard Layer.” MassGIS. Last modified 2014. http://www.mass.gov/anf/research-and-tech/it-serv-and-support/application-serv/office-of-geographic-information-massgis/datalayers/nfhl.html; Kirshen, Paul, Ellen Douglas, and Chris Watson. “Boston Harbor Sea Level Rise Maps.” The Boston Harbor Association., 2013 http://www.tbha.org/boston-harbor-sea-level-rise-maps; Lima Alvaro, Mark Melnik, Kelly Dowd, and Joanne Wong. Grocery Stores in Boston. Boston, MA: Boston Redevelopment Authority, 2013.; U.S. Census Bureau 2013 American Community Survey 5-Year Estimates; ICIC Analysis.

Overall, Boston has a robust retail network, although Dorches-ter, East Boston and Roxbury will be more at risk than others to localized store closures or diminished supplies due to a higher share of corner stores, a higher share of retail outlets in flood prone locations and a higher percentage of school-aged children. Throughout Boston, grocery stores may be vulnerable due to a lack of longer-term planning and lack of proper backup generation systems. There is also weak public-private coordination with suppliers, distributors and retail outlets to coordinate resilience plans.
Food Bank System Capacity and LocationFood banks are an essential, but often overlooked, component of urban food systems. In normal circumstances they play an important role in feeding food insecure households through a food pantry network. During natural disasters they also sup-port nonprofit organizations such as the American Red Cross with emergency provisions. The Greater Boston Food Bank (GBFB) is a member of Feeding America, a nationwide net-work of more than 200 food banks and 60,000 food pantries and meal programs and the largest hunger relief organization in the U.S.94 Feeding America plays an active role in recovery efforts following major disasters by providing local organi-zations with food, water and trained staff, while providing specialized disaster training for its food banks around the country. Feeding America can utilize its pre-staged emer-gency food supplies throughout the nation to quickly trans-port provisions to food banks, as they are needed. In 2005, Feeding America formalized its commitment to providing aid during times of disaster with FEMA and has played important roles during Hurricane Katrina and Sandy. Feeding America provided more than 83 million pounds of supplies to the Gulf Coast in the months after Katrina. Its disaster response efforts are funded through grants.95
The Greater Boston Food Bank is housed in a state-of-the-art, 117,000 square foot distribution center built in 2009.96 They have over 500 member agencies that serve 500,000 people annually across Eastern Massachusetts.97 Food is delivered daily to and from GBFB. A representative from GBFB esti-mates that approximately seventy-five percent of their mem-bers pick up food weekly at GBFB. The remainder is delivered by GBFB. The representative noted that currently GBFB does not have sufficient capacity or storage to meet demand and will sometimes need to use offsite freezer facilities. In 2014, The Greater Boston Food Bank distributed 50 million pounds of food, putting the new facility at full capacity well before it was estimated to reach that mark.98 The Greater Boston Food Bank has also seen an increase in demand for produce, creat-ing storage issues. When the new GBFB facility was built,
only two percent of food was expected to be produce. Today, produce accounts for 25 percent of GBFB’s food.
The unique role The Greater Boston Food Bank plays in sup-porting the broad food safety network in Boston poses its own set of vulnerabilities. For example, during the 2015 winter storms, GBFB closed for a number of days, resulting in missed or rescheduled deliveries. GBFB was closed primarily for safety reasons and public transportation closures, although it was prepared to operate during the storms. A manager at The Women’s Lunch Place, a soup kitchen and daytime shelter located on Newbury Street, noted that it was difficult to place food orders from GBFB and nonprofit food distributors during the storms due to the closures. The Women’s Lunch Place, like many similar organizations, purchases food from both the for-profit and nonprofit food sectors and relies on a number of sources for its food supply. As the manager explained to us, food purchased through the for-profit sector is at the market rate, although a group purchasing contract allows the soup kitchen to purchase from one of its distributors at a slightly reduced rate. Smaller food pantries and soup kitchens may not have the capacity to purchase a meaningful portion of their food from the for-profit sector, but rather rely on more affordable options at The Greater Boston Food Bank. Ninety-one percent of GBFB member agencies said a decrease in food received from The Greater Boston Food Bank would negatively impact their ability to serve clients.99 The reliance of many organizations on a single source (i.e., The Greater Boston Food Bank) for most of its food needs creates risks of supply disruptions.
The Greater Boston Food Bank is funded through a number of avenues, including gifts and grants, the Massachusetts Emer-gency Food Assistance Program (MEFAP), its Co-op program, shared maintenance fees and others.100 The largest revenue source is MEFAP, a statewide emergency food assistance program established in 1995 that helps fund the four food banks in Massachusetts.101 Through the Co-op program, GBFB’s second largest source of revenue, GBFB purchases food from wholesale distributors then sells it to agencies at no markup for food items and a small markup for non-food items. The third largest source of income is the shared maintenance program, where The Greater Boston Food Bank charges a handling fee of 19 cents per pound to the recipient agency for donated food.102 GBFB representatives we interviewed noted that they do not have a plan for obtaining sustained increases in funding that would be needed to support increased demand after a natural disaster. They also do not have the capacity, including storage, to sustain increased demand in the medium to long term.
The location of The Greater Boston Food Bank also presents significant transportation issues. Wedged between the South
ICIC 17

Bay House of Correction, the Mass Ave Connector and I-93, in Newmarket, there are few public roads providing access to GBFB. GBFB has to work with other Newmarket busi-ness owners to coordinate the use of private access roads by food delivery trucks. The 2015 winter storms revealed some additional vulnerabilities; snow buildup on the narrow feeder roads made it difficult for food delivery trucks and member agencies to get to GBFB.
The Greater Boston Food Bank’s strong coordination with grocery stores and their supply chains positions it to be a linchpin in resilience plans. The Greater Boston Food Bank has a Vice President of Food Acquisition and Supply Chain with previous private supply chain management experience for a major grocery store that oversees GBFB’s food acquisi-tions. The position works with grocers and suppliers to both purchase food and secure large food donations. The cur-rent coordination with the private sector positions GBFB to coordinate with grocery stores during disasters. The Greater Boston Food Bank also coordinates with the Massachusetts Emergency Management Agency and is a member of the Massachusetts Voluntary Organizations Active in Disaster (MAVOAD), a forum where organizations share knowledge and resources before, throughout, and after a disaster.103 The Greater Boston Food Bank has a formal disaster response plan in place, which outlines the steps needed to ensure con-tinuity of services and how it will serve the community, but it was not activated during the 2015 winter snow events.
The Greater Boston Food Bank does not have capacity, or financial resources, to meet increased demand for longer peri-ods of time. The location of GBFB is vulnerable to transportation barriers, especially during significant flood or snow events. GBFB cannot meet current demand from food pantries and has limited excess storage capacity. At the same time, the pivotal role GBFB plays supplying food to safety-net organizations cre-ates additional risks due to lack of redundancy.
FOOD ACCESS VULNERABILITIES
Household Food ProductionAgain, as with the other cities we studied, household food production is limited. There are over 150 community gardens located across the city, covering nearly 50 acres in total, with an additional 125 school gardens.104 They can supplement fresh produce for some of Boston’s households during summer months. In 2013, the City adopted Article 89 into zoning code, expanding commercial ground-level and roof-top farming, bee-keeping, chicken-keeping, aquaponics, and hydroponics.105
Distance to Food OutletsMost residential neighborhoods in Boston have at least one grocery store, with the exception of Downtown and the com-pact neighborhoods that surround it (Bay Village, Chinatown, North End and the Leather District), the rapidly developing South Boston Waterfront, and the Longwood Medical Area, which is predominantly nonresidential (Figure 4). On average, there are 1.6 grocery stores per neighborhood. Dorchester and Hyde Park have the most, with five in each neighborhood. Per capita, the West End has the most grocery stores (0.25) while East Boston has the lowest (0.02) of neighborhoods with at least one grocery store. On average, there are 0.06 grocery stores per capita in Boston.106
Most residential Boston neighborhoods have at least one corner store, with the exceptions being Bay Village, China-town, Leather District, and Longwood Medical Area. There are 9.6 corner stores per neighborhood on average. With 47 corner stores, Dorchester has the most. Per capita, of the neighborhoods with at least one corner store, Downtown has the most corner stores (2.05) while Mission Hill has the lowest (0.12). On average, there are 0.39 corner stores per capita in Boston.107
Nearly all Boston residents (93 percent) live within one mile of a grocery store. Over seventy percent of residents live within one mile of more than one grocery store option (Figure 5).108 Residents are also well served by corner stores. Nearly all Boston residents (99 percent) live within a half mile of a corner store.109 There are only two census tracts within Boston city limits that officially qualify as food des-erts—one in West Roxbury and one in East Boston. In total, 9,196 people (1.5 percent) live in a food desert in Boston.110
Food AffordabilityFood access varies significantly across Boston’s neighbor-hoods (Figure 4). In Boston, just over 18 percent of the popula-tion is living at or below poverty level and just over 18 percent of households receive SNAP benefits.111 Eight neighborhoods have poverty rates higher than the city average: Roxbury (34.9 percent), Mission Hill (28.8 percent), Dorchester (22.6 percent), Mattapan (21.5 percent), Downtown (20.3 percent), South End (19.6 percent), Fenway (19.7%) and Charlestown (19.4 percent).112 Six neighborhoods have household SNAP participation rates higher than the average: Roxbury (40.0 percent), Dorchester (29.3 percent), Mattapan (28.8 percent), Mission Hill (22.5 percent), East Boston (22.1 percent) and Longwood Medical Area (20.1 percent).113 A natural disaster may also push more people into SNAP eligibility income thresholds, long-term, due to potential decreases in income (e.g., job loss).
18 Resilient Food Systems, Resilient Cities: Recommendations for the City of Boston
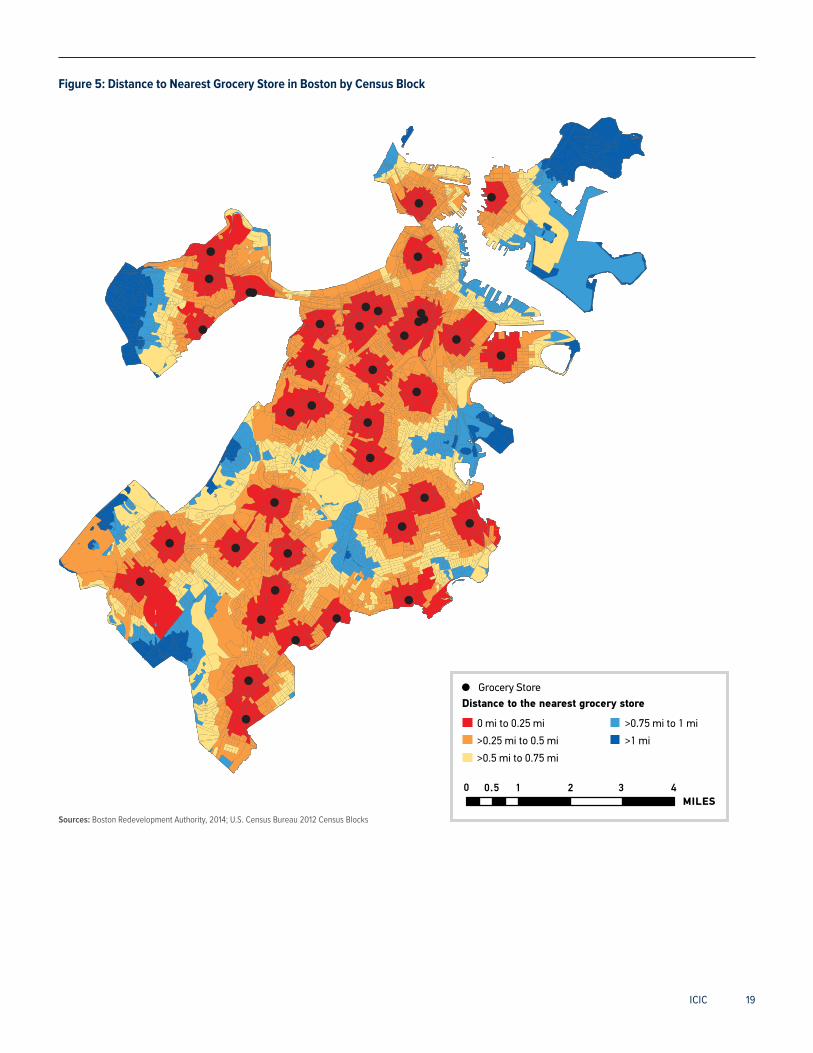
ICIC 19
Figure 5: Distance to Nearest Grocery Store in Boston by Census Block
Sources: Boston Redevelopment Authority, 2014; U.S. Census Bureau 2012 Census Blocks
!
!
!!!
!
!
!!
!
!
!
!
!
!!
!
!
!
!
!
!!
!!
!
!
!
!!
!
!
!
!
!
!
!
!!
!
! Grocery Store
Distance to nearest grocery store
0 mi to 0.25 mi
>0.25 mi to 0.5 mi
>.5 mi to 0.75 mi
>.75 mi to 1 mi
>1 mi
0 1 2 3 40.5
Miles
Grocery StoreDistance to the nearest grocery store
0 mi to 0.25 mi
>0.25 mi to 0.5 mi
>0.5 mi to 0.75 mi
>0.75 mi to 1 mi
>1 mi
MILES0.5 1 2 3 40

20 Resilient Food Systems, Resilient Cities: Recommendations for the City of Boston
Table 3: Food Access Resilience Characteristics for Boston Neighborhoods
Neighborhood Population Poverty Rate
SNAP Rate
Number of Grocery Stores
Grocery Stores Per 1,000
Number of Grocery Stores in 7.5 Foot Storm Surge
Number of Corner Stores
Corner Stores Per 1,000
Number of Corner Stores in Flood- plain
Number of Corner Stores in 7.5 Foot Storm Surge
Average Distance to Closest SNAP Outlet
(Miles)
Average Distance to Closest Grocery Store
(Miles)
Allston 29,196 17.7% 8.1% 3 0.10 0 12 0.41 0 1 0.16 0.37
Back Bay 18,088 7.1% 4.1% 2 0.11 0 5 0.28 0 3 0.14 0.23
Beacon Hill 9,023 5.8% 2.5% 0 0.00 0 3 0.33 0 1 0.14 0.24
Brighton 45,801 13.3% 11.4% 2 0.04 1 15 0.33 0 0 0.19 0.73
Charlestown 16,439 19.4% 17.0% 1 0.06 0 6 0.36 0 3 0.10 0.37
Dorchester 114,235 22.6% 29.3% 5 0.04 2 47 0.41 0 2 0.13 0.58
Downtown 11,215 20.3% 12.8% 0 0.00 0 23 2.05 1 8 0.10 0.38
East Boston 40,508 16.5% 22.1% 1 0.02 1 28 0.69 1 12 0.11 0.82
Fenway 33,796 19.7% 11.8% 2 0.06 2 14 0.41 0 10 0.15 0.28
Hyde Park 30,637 9.4% 15.2% 5 0.16 0 9 0.29 0 0 0.29 0.48
Jamaica Plain
37,468 16.9% 13.8% 3 0.08 0 9 0.24 0 0 0.19 0.45
Longwood Medical Area
3,785 7.0% 20.1% 0 0.00 0 0 0.00 0 0 0.27 0.29
Mattapan 22,600 21.5% 28.8% 2 0.09 0 8 0.35 0 0 0.28 0.60
Mission Hill 16,305 28.8% 22.5% 1 0.06 0 2 0.12 0 0 0.16 0.29
North End 10,131 4.2% 1.6% 0 0.00 0 7 0.69 0 2 0.05 0.64
Roslindale 28,680 11.4% 15.3% 2 0.07 0 5 0.17 0 0 0.18 0.46
Roxbury 48,454 34.9% 40.0% 2 0.04 0 20 0.41 0 4 0.14 0.37
South Boston
33,311 17.9% 13.4% 2 0.06 0 10 0.30 0 3 0.16 0.35
South Boston Waterfront
1,889 3.7% 8.4% 0 0.00 0 2 1.06 0 1 0.55 0.56
South End 24,577 19.6% 17.9% 4 0.16 3 10 0.41 0 9 0.08 0.25
West End 4,080 10.3% 6.4% 1 0.25 0 1 0.25 0 0 0.18 0.21
West Roxbury
30,446 5.8% 7.5% 2 0.07 0 4 0.13 0 0 0.33 0.68
City of Boston
617,594 18.1% 18.2% 40 0.06 9 240 0.39 2 59 0.17 0.48
Notes: Population, grocery stores per 1,000 and corner stores per 1,000 figures use population data from the 2010 U.S. Census Bureau’s Decennial Census provided by the Boston Redevelopment Authority. Poverty rate excludes currently enrolled undergraduate and graduate students. Grocery store analysis excludes two grocery stores that closed (Shaw’s and Kam Man in Dorchester) and includes one grocery store that opened (Whole Foods Market in the South End) since grocery store data was published. SNAP outlets are defined as retail locations in Boston that accept SNAP benefits and may include grocery stores, corner stores, and other retail locations. Distances to closest SNAP outlets and grocery stores are estimated by distance from the population center of each census tract to the closest SNAP outlet or grocery store. Sources: Boston Redevelopment Authority. “2010 Census Tracts & Neighborhoods.” Boston, MA: Boston Redevelopment Authority, n.d.; Boston Redevelopment Authority. “Boston Neighborhood Shapefiles.” Data Boston. Last modified January 24, 2014. https://data.cityofboston.gov/City-Services/Boston-Neighborhood-Shapefiles/af56-j7tb; City of Boston Mayor’s Office of Food Initiatives. “Corner Stores.” Data Boston. Last modified January 30, 2013. https://data.cityofboston.gov/dataset/Corner-Stores/4vcu-nshu; Federal Emergency Management Agency. “National Flood Hazard Layer.” MassGIS. Last modified 2014. http://www.mass.gov/anf/research-and-tech/it-serv-and-support/application-serv/office-of-geographic-information-massgis/datalayers/nfhl.html; Kirshen, Paul, Ellen Douglas, and Chris Watson. “Boston Harbor Sea Level Rise Maps.” The Boston Harbor Association., 2013 http://www.tbha.org/boston-harbor-sea-level-rise-maps; Lima Alvaro, Mark Melnik, Kelly Dowd, and Joanne Wong. Grocery Stores in Boston. Boston, MA: Boston Redevelopment Authority, 2013.; U.S. Census Bureau 2013 American Community Survey 5-Year Estimates; ICIC Analysis.

ICIC 21
Dorchester, Mattapan and Roxbury have been identified by previous studies as neighborhoods with significant food access issues.114 In February we interviewed a random sample of 30 individuals in these neighborhoods to better understand food access challenges.115 The majority of individuals identi-fied multiple food retailers from which they buy food, with their choices dictated by a combination of price and geogra-phy. Residents primarily shopped at grocery stores, relying only on corner stores for a small proportion of their food. Roughly one-third of the participants utilized a food pantry at least some of the time. Individuals thought that there were sufficient food options within their neighborhoods but stated that price plays an important role in what they purchase and where they choose to shop. One third of the individuals agreed with the statement that they didn’t have money to purchase sufficient food at least some of the time. Individuals traveled to a grocery store a number of ways, including walking, driving and using public transportation. Interviews were conducted during a period of strong winter storms. Individuals men-tioned that the storm was an inconvenience, but they were still able to obtain food.
To provide some additional insights into affordability, we compared income levels to food prices at select grocery stores and corner stores in Back Bay and Roxbury, two neighbor-hoods that represent different ends of the income spectrum. Roxbury is an inner city neighborhood with a median house-hold income of $28,000, well below the median household income of $52,000 for Boston as a whole. Back Bay, in con-trast, is a high-income neighborhood with a median house-hold income of $86,000.
We compared prices and availability of our six food products at a grocery store and corner store in Back Bay and Roxbury.116 Our study of food prices was admittedly superficial, but it high-lights some issues worthy of additional study. We found that overall there were no significant differences in prices for the basket of goods and no clear trend in terms of higher prices in one location over another. However, the difference in house-hold incomes in Roxbury and Back Bay creates access dispari-ties. Clearly, food that is the same price in Roxbury as in Back Bay will be less affordable for most residents in Roxbury.
Residents in Charlestown, Dorchester, East Boston, Mattapan, Mission Hill and Roxbury currently experience food access issues due to food affordability and relatively few grocery and corner stores. A comprehensive study is needed to better understand neighborhood food access issues.
Reliance on Food PantriesAn estimated 15.8 percent of individuals are food insecure in Suffolk County, the highest rate in Massachusetts.117 Many of these individuals rely on food pantries and other feeding organizations for a portion of their food needs. There are 79 food pantries in Boston that are members of The Greater Boston Food Bank. Over half (58 percent) are located in Roxbury, Dorchester, and Mattapan. Many food pantries are at capacity when it comes to feeding people during normal periods. For example, Rosie’s Place, a women’s shelter in Roxbury, is at capacity serving meals and providing food pantry services. Rosie’s only allows people to receive food from the pantry once a month.
During the 2015 winter storm, one expert noted that many food pantries closed during the storm. Wide-spread closures during a storm may result in increased food insecurity for the most vulnerable populations. In addition, Lovin’ Spoonfuls, a non-profit organization that rescues food from major grocery stores and distributes it to organizations that provide food directly to individuals, also closed for much of the storm due to safety reasons. At the same time, one expert noted, no food donations were available from grocery stores because shelves were empty.
Finally, while food pantries provide a robust safety net in the short-term, they do not address the inherent solutions to food insecurity, such as job creation and access to education and training. Project Bread, a statewide anti-hunger organiza-tion located in Boston, for example, is working to bring fresh approaches to ending hunger through education, thought leadership and program funding opportunities.
Food pantries and soup kitchens struggle to meet an increas-ing demand for the products and may experience supply chain disruptions due to GBFB vulnerabilities.
FOOD SYSTEM RESILIENCE PLANNING IN BOSTONEstablished short-term emergency response protocols are in place at various geographic levels and organizations in Boston in the event of a natural disaster. For example, the City of Boston’s Office of Emergency Management (OEM) and the Massachusetts Emergency Management Agency (MEMA) are the agencies that are primarily responsible for emergency response in Boston and the surrounding region, with assis-tance available from the Federal Emergency Management Agency (FEMA). Boston OEM is responsible for providing local emergency support functions for obtaining and distrib-uting food and water to those in need during a disaster. Boston OEM would work with the Boston Public Health Commis-sion’s Office of Public Health Preparedness to identify the agencies or organizations with food needs during a disaster.

Boston OEM has a formalized Local Emergency Support Function (LESF 11) to provide guidance for identifying food, potable water, and ice during and following an emergency in the City of Boston. The distribution of emergency food provi-sions in the immediate aftermath of a natural disaster are provided through the American Red Cross and The Greater Boston Food Bank and other organizations often in coordina-tion with local or federal emergency management agencies. The Boston Public Health Commission provides workshops and resources to promote social and emergency resilience prior to a natural disaster.
A review of current resilience planning efforts in Boston is shown in Table 2. Long-term resilience planning for the city is coordinated through the City of Boston Office of Environ-ment, Energy, and Open Space and the Boston Green Ribbon Commission. The Office of Environment, Energy, and Open
Space is responsible for preparing the City’s Climate Action Plan. Formed in 2011, the Boston Green Ribbon Commission is a working group of businesses, institutional and civic lead-ers co-chaired by the Mayor that develops shared strategies for fighting climate change in coordination with the City’s Climate Action Plan. In 2013, the Commission released a report on applying resilience design adaptation strategies for existing buildings. The Boston Redevelopment Authority, in 2013, adopted climate resilience guidelines for all develop-ment projects subject to Boston Zoning Article 80, which include projects that meet certain size criteria. Other busi-nesses, nonprofit organizations, and foundations are also key players in resilience planning.
Boston was selected by the Rockefeller Foundation to join 100 Resilient Cities in 2014. The 100 Resilient Cities initiative provides member cities with financial and logistical guidance
22 Resilient Food Systems, Resilient Cities: Recommendations for the City of Boston
Table 4: Overview of Current Resilience and Food Planning Efforts by Organization
Organization Description of Planning Efforts
The Barr Foundation
Private, Boston-based foundation, with program priorities in Arts & Culture, Climate, and Education founded in 1997. The Foundation has funded multiple climate adaptation and resilience initiatives in Boston including the Boston Living with Water competition, the City of Boston’s Climate Action Plan and the Boston Green Ribbon Commission.
Boston Green Ribbon Commission
Formed in 2011, the Boston Green Ribbon Commission is a working group of business, institutional and civic leaders co-chaired by the Mayor that develops shared strategies for fighting climate change in coordination with the City’s Climate Action Plan. Its Climate Preparedness working group provides recommendations that businesses and institutions can take to reduce their vulnerability to climate change hazards and identifies ways for the City to support these actions.
The Boston Harbor Association (TBHA)
Established in 1973, TBHA is a nonprofit organization that works with businesses, residents, public agencies, and nonprofits to enhance the Boston waterfront while protecting the city from extreme weather events. TBHA prepares and promotes climate adaptation strategies through the Preparing for the Rising Tide series.
Boston Public Health Commission
The Boston Public Health Commission is an independent public agency providing a wide range of health services and programs. It coordinates with public health agencies to identify food and other public health needs during a natural disaster. It also works with the community to promote community resilience and emergency preparedness. Its resilience focus is primarily for public health.
Boston Redevelopment Authority
The Boston Redevelopment Authority is the urban planning and economic development agency for the City of Boston. In 2013, the BRA adopted climate change preparedness and resilience guidelines for all development projects subject to Boston Zoning Article 80 project review. The BRA also lead the Article 89 rezoning initiative, enabling the expansion of urban agriculture within the City.
City of Boston, Chief Resilience Officer
The Chief Resilience Officer is a new two-year position that begins in 2015, funded by the Rockefeller Foundation’s 100 Resilient Cities Campaign. The Chief Resilience Officer will coordinate the City’s resilience efforts, but primarily work on social resilience issues, such as income inequality.
City of Boston, Office of Emergency Management
The Office of Emergency Management coordinates emergency management, emergency preparedness and homeland security programming for the City of Boston. As part of its role, the Office is responsible for providing local emergency support functions for obtaining and distributing food and water to those in need during a disaster.
City of Boston, Office of Environment, Energy, and Open Space
The Office of Environment, Energy, and Open Space is responsible for preparing City’s Climate Action Plan, which serves as Boston’s blueprint for reaching its climate goals, include climate preparedness efforts. The first two climate action plans (2007, 2011) focused on climate change mitigation and reducing greenhouse gas emissions. The 2014 plan focuses on climate adaptation and resilience across the City. The plan identifies the need to expand access to healthy and local food.
City of Boston, Mayor’s Office of Food Initiatives
Established in 2010, the Mayor’s Office of Food Initiatives operates under four directives: 1) increasing access to healthy and affordable foods, 2) expanding Boston’s capacity to produce, distribute, and consume food through urban agriculture, 3) buildings a strong local food economy, and 4) expanding private and public partnerships to advance the food agenda. The Office is leading the City’s food resilience planning efforts.

for the establishment of a Chief Resilience Officer who will lead the city’s resilience efforts. Through funding from the program, Boston will hire its first Chief Resilience Officer. The Chief Resilience Officer’s focus with focus primarily on social issues and identify ways for the City to become more equitable.
Boston’s food system planning is currently spearheaded by the Mayor’s Office of Food Initiatives. Established in 2010, the Office operates under four directives: 1) increasing access to healthy and affordable foods, 2) expanding Boston’s capac-ity to produce, distribute, and consume food through urban agriculture, 3) building a strong local food economy, and 4) expanding private and public partnerships to advance the food agenda. As part of its work, the Office leads the Boston Food Policy Council and engages other city departments. The Boston Food Council was formed in 2009. Meeting quarterly, this group has provided information sharing and educational
opportunities for people who work on all aspects of Boston’s food system. The group consists of city departments, research organizations, institutions, businesses, funders, nonprofits, citizens and students. In 2015, the Boston Food Policy Council began a re-visioning process that will help determine specific areas of work going forward. The Office, working with the Boston Redevelopment Authority, was able to expand urban agriculture through the Article 89 rezoning initiative. State-wide planning for the Massachusetts food system is happen-ing through the Massachusetts Food Policy Council, led by the Metropolitan Area Planning Council and partner agencies. Foundations and universities aid in food system planning, such as the Kendall P. Foundation, which has a goal of creat-ing a resilient and healthy food system in New England, and food system programs at Tufts University and Northeastern University.
ICIC 23
Organization Description of Planning Efforts
Eversource (formerly NStar)
Eversource is a leading provider of electricity in Boston and the Northeast. In recent years, Eversource has invested in transmission reliability projects and resilience measures, including working to improving storm response plans, focusing on storm restoration and communication with customers, local leaders and state officials.
Food Solutions New England
Food Solutions New England is a regional, collaborative network organized to transform the New England food system into a resilient, equitable, and sustainable food system. It identified opportunities for a sustainable regional food system in A New England Food Vision.
Greater Boston Federal Executive Board
The Greater Boston Federal Executive Board is responsible for coordinating federal emergency preparedness efforts and services in the Greater Boston region.
Henry P. Kendall Foundation
The Henry P. Kendall Foundation launched new programing in 2011 to provide support in creating a resilient and healthy food system in New England that increase the production and consumption of local, sustainably produced food.
Massachusetts Food Policy Council
The Massachusetts Food Policy Council is a 17-member entity established in 2011, comprising of state agency, legislative, and industry representatives. Along with the Metropolitan Area Planning Council and local partners it is overseeing the Massachusetts Food System plan, the first comprehensive food system plan since 1974. The goals of the plan are to increase food production, create jobs, protect the land and water, reduce food insecurity and increase food access.
Metropolitan Area Planning Council (MAPC)
MAPC is a regional planning agency, serving 101 cities and towns in Metro Boston. It guides the region’s climate change adaptation strategy, by providing recommendations for local, regional, and state action to reduce vulnerability to the anticipated impacts of climate change. It is also a lead partner on the Massachusetts Food System Plan.
Northeastern University School of Public Policy and Urban Affairs
Faculty at Northeastern University provide research and knowledge leadership on food systems and city resilience, through the Consortium on Food Systems Sustainability, Health and Equity and the Resilient Cities Lab.
Urban Land Institute Boston/New England
ULI Boston/New England provides leadership in the responsible and sustainable use of land through convening and sharing best practices in the region.
Tufts University Friedman School of Nutrition Science and Policy
Tufts University Friedman School of Nutrition Science and Policy provides research and knowledge leadership on Northeast local and regional food systems. Faculty members are part of the Enhancing Food Security in the Northeast through Regional Food Systems project, a USDA-funded Agriculture and Food Research Initiative.
Table 4: Overview of Current Resilience and Food Planning Efforts by Organization continued

This study exposed vulnerabilities in urban food systems in the event of a natural disaster. A resilient food system —the production, processing and distribution of food—would be able to withstand and recover from the natural disaster and quickly return to normal operations. A resilient food system includes individuals and organizations with the capacity to monitor and manage risks and vulnerabilities to shocks. City governments play an essential leadership and coordinating role.
With this study, the City of Boston took a significant step toward creating a more resilient food system. The framework, insights, public-private network and momentum created by
the project form a solid foundation for additional planning. The following set of seven recommendations address gaps in information and provide direction to the City for build-ing on this foundation. It will require strong public-private partnerships and coordination across various City agencies, including the Mayor’s Office of Food Initiatives, the Office of Emergency Management, the Boston Redevelopment Author-ity, the Boston Transportation Department, the Mayor’s Office of New Urban Mechanics, and others. Leveraging its role as a facilitator of climate adaptation initiatives, the City can strengthen its local and regional food system and become a model for other cities to follow.
24 Resilient Food Systems, Resilient Cities: Recommendations for the City of Boston
Strategies and Actions for Creating a Resilient Food System in Boston
FOOD AVAILABILITY
Vulnerability: Local food system initiatives are not incorporated into relisience planning Lead agency or organization: Office of Food Initiatives
1.0 Incorporate a resilience perspective into the City’s efforts to expand local food production, processing and distribution.
1.1: Establish a food system resilience committee as part of the Food Policy Council to strengthen coordination between local food system initiatives and resilience planning efforts.
Vulnerability: The supply of milk in Boston is vulnerable to longer-term disruptions due to supply concentration and processing plant locations Lead agency or organization: Massachusetts Food Association, Office of Food Initiatives and MA Dept. of Agricultural Resources
2.0 Diversify milk supply to retail outlets.
2.1: Review existing contingency plans at Suiza and Hood to assess the significance of milk processing vulnerabilities.2.2: Convene grocery and corner store owners to promote awareness of alternative regional milk suppliers. 2.3: Encourage the growth of smaller milk suppliers in New England through technical assistance and other resources.2.4: Identify regulations and other barriers to the addition of new milk processing facilities that could serve Boston in the event of a major supply chain disruption.
continued
Vulnerability: I-93 and secondary streets are vulnerable to flooding and closure Lead agency or organization: Boston Transportation Department
3.0 Identify road network vulnerabilities to natural disasters.
3.1: Develop a climate change risk assessment tool and process to better identify and mitigate climate change-related risks to key transportation routes (e.g., City of Toronto’s Climate Change Risk Assessment Tool).3.2: Work with the Massachusetts Department of Transportation and other state, regional and federal authorities to incorporate resilience measures for I-93 and other key transportation routes outside of the City’s jurisdiction.
4.0 Identify contingency delivery methods (e.g., using the port) and alternate routes for major food products.
4.1: Assess alternative transportation methods and routes for stores, distributors and food providers when secondary streets are closed or impassible, especially for stores in high risk locations.4.2: Establish a task force to study the impacts of recent weather disruption and then identify who should be convened in the event of a disaster to resolve impacts of road closures on food availability/deliveries.4.3: Develop a contingency plan to reroute traffic and the flow of goods in the event of a significant disruption (e.g., flooding or extreme snow).

ICIC 25
Vulnerability: Secondary streets to distributors and The Greater Boston Food Bank are deficient and deteriorating Lead agency or organization: Boston Transportation Department in partnership with surrounding cities
5.0 Invest in improving and expanding secondary streets to distributors and The Greater Boston Food Bank across the Greater Boston area.
5.1: Review conditions of feeder roads to distributors and GBFB, including interviewing distributors and GBFB operational teams, to inform priorities.5.2: Incorporate food distribution flows and limitations in future traffic and road studies.
Vulnerability: Fresh food distributors are clustered in locations vulnerable to flooding Lead agency or organization: Boston Redevelopment Authority in partnership with the Office of Environment, Energy and Open Space
6.0 Mitigate flooding risks for distributors in flood hazard zones.
6.1: Launch a Rebuild by Design competition for Boston in partnership with the U.S. Department of Housing and Urban Development (HUD) or leverage the existing Living with Water design competition to address this issue.6.2: Explore the application of current resilient designs (e.g., Hunts Point Lifelines, Rebuild by Design) for key food distributors located in flood hazard zones.6.3: Guide private-sector food distributor expansion and relocation plans to ensure resilience objectives are being met.
Vulnerability: Fresh food distributors and The Greater Boston Food Bank have limited capacity to serve an increasing population and limited storage capacity Lead agency or organization: Boston Redevelopment Authority
7.0 Expand storage capacity for food in Boston, including cold storage.
7.1: Inventory available industrial warehouse space that could be used for additional food storage capacity.7.2: Review future development plans for Boston to assess potential impact on critical food distribution and retail centers in Boston.7.3: Evaluate policies to incentivize the increase of private-sector food storage in Boston, including subsidies or tax incentives.7.4: Guide, target and invest in priority development and expansion facilities in low-risk areas.
continued
Vulnerability: Weak public-private coordination with suppliers, distributors, and retail outlets in the food system Lead agency or organization: Boston Office of Emergency Management
8.0 Strengthen formal coordination across public and private food system organizations.
8.1: Establish a public-private action group to collaborate and identify key risks to the food system associated with natural disasters and to develop a strategic plan to protect local infrastructure, businesses, and organizations. The WeatherWise Partnership in Toronto could serve as a useful model.8.2: Form a working group to assess public-private emergency food coordination mechanisms currently in place, identify strategies for improvement and where necessary establish new coordinating bodies to ensure proper planning and communication to handle major disruptions (e.g., the New York City Food and Water Distribution Task Force and Action Plan).8.3: Identify potential restrictions or “bottlenecks” in food distribution triggered by disasters (e.g., hours of services regulations, road closures) and work with the appropriate agencies to explore feasible solutions.
FOOD AVAILABILITY continued

26 Resilient Food Systems, Resilient Cities: Recommendations for the City of Boston
Vulnerability: Dorchester, East Boston and Roxbury are vulnerable to localized store closures or diminished food supplies due to “at risk” locations, high share of corner stores and high percentage of school age children Lead agency or organization: Office of Food Initiatives in partnership with the Boston Public Health Commission, The Greater Boston Food Bank and Project Bread
9.0 Develop a food availability action plan for each neighborhood.
9.1: Review current food availability and projections for food availability after a natural disaster to identify gaps in food supply. 9.2: Provide incentives to attract regional or national grocery store chains to the neighborhoods.9.3: Target corner stores in these neighborhoods as part of resilience planning education and technical assistance.9.4: Assess feasibility of providing direct “recovery” support to independent stores to speed their rebound and close funding or timing gaps (e.g., insurance companies are slow to evaluate claims).
FOOD AVAILABILITY continued
Vulnerability: Throughout Boston some grocery stores and corner stores may be vulnerable due to a lack of longer-term planning and lack of proper backup generation systems Lead agency or organization: Boston Redevelopment Authority in partnership with the Office of Business Development and the Massachusetts Food Association
10.0 Develop new resources and initiatives that incorporate best practices for contingency planning and strategies to return to normal operations quickly.
10.1: Convene large retailers and institutions in the food system (e.g., Shaw’s, Stop & Shop, and Whole Foods; Boston Public Schools; Hospitals; The Greater Boston Food Bank) to educate them about the importance of resilience planning, to review resilience plans and to identify best practices and gaps. 10.2: Develop a “playbook” of best practices in contingency planning that can be used throughout the food system but especially for corner stores. The playbook should address both short and longer-term disruptions in order to build resilience for multiple scenarios. 10.3: Develop emergency preparedness guidelines for food retailers that includes backup power, staffing and supplier plans (e.g., the New York City Office of Emergency Management Emergency Preparedness Guidelines For Food Retailers). 10.4: Consider new regulations requiring electric power generators for food retailers (e.g., New York City’s proposed electric generator law).10.5: Review the City’s permitting requirements for food establishments and identify opportunities to streamline the process of reopening after a disaster (e.g., New York City’s streamlined re-permitting process for food establishments after Sandy).
11.0 Provide technical assistance to support food resilience planning for corner stores.
11.1: Create an inventory of resources available for disaster assistance recovery (e.g., SBA Hurricane Recovery loans) that can be readily disseminated after a storm (e.g., New York State Recovery Resources Center).11.2: Develop a plan for providing resources to corner stores to accelerate recovery after a natural disaster.
Vulnerability: The Greater Boston Food Bank does not have capacity, or financial resources, to meet increased demand for longer periods of time Lead agency or organization: Office of Food Initiatives in partnership with the Massachusetts Department of Agricultural Resources, The Greater Boston Food Bank and Massachusetts Food Association
12.0 Clarify private and nonprofit sector reliance on The Greater Boston Food Bank for resilience plans.
12.1: Inventory all food relief organizations and the populations and neighborhoods they serve in Boston. This includes organizations in the Greater Boston Area.12.2: Identify inefficiencies in existing ecosystem (e.g., sourcing of product) and develop recommendations for improving effectiveness and reach of GBFB’s network of organizations.12.3: Develop and disseminate “storm action plan” guidelines for food safety net organizations.
13.0 Establish longer-term funding plans or sources to support The Greater Boston Food Bank in the event of natural disaster.
13.1: Expand the Massachusetts Emergency Food Assistance Program (MEFAP) to include “safety net” funding for Massachusetts food banks after disasters.
continued

ICIC 27
Vulnerability: Insufficient data and information to effectively address food availability issues Lead agency or organization: Office of Food Initiatives in partnership with the Metropolitan Area Planning Council
14.0 Identify optimal mix of local, regional and national food production.
14.1: Commission research on the production origin of a broad array of food items consumed in Boston and the impact of climate change, local and non-local natural disasters to the supply of these products (e.g., New York City’s food supply chain resilience study). 14.2: Assess the associated resilience vulnerabilities of the existing and potential new local food production goals. 14.3: Commission a study on the costs and benefits associated with relocating food distributors to “no-risk” areas, including whether relocating entire “clusters” is necessary.
Vulnerability: Many residents in Charlestown, Dorchester, East Boston, Mattapan, Mission Hill and Roxbury currently experience food access issues Lead agency or organization: Office of Food Initiatives in partnership with the Boston Public Health Commission, The Greater Boston Food Bank and Project Bread
1.0 Develop a food security action plan for targeted neighborhoods in Boston.
1.1: Convene The Greater Boston Food Bank, Project Bread, Boston Public Health Commission and community organizations to inform action plans.1.2: Partner with advocates to develop strategies to increase utilization of SNAP benefits.1.3: Review SNAP and other food assistance benefits to assess the capacity to meet normal and increased demand, including contingency plans for the aftermath of a disaster.
Vulnerability: Insufficient data and information to effectively address food access issues Lead agency or organization: Office of Food Initiatives
3.0 Identify strategies and best practices to increase food access in Boston.
3.1: Commission a study (e.g., a comprehensive survey of residents) to better understand neighborhood food consumption patterns to identify the types of food people eat, where and how they access food, and what barriers exist for food access.3.2: Commission a study that revisits the one-mile radius to assess access to food retail outlets, pantries and soup kitchens after major weather events.
FOOD ACCESS
2.0 Increase the capacity of food pantries and soup kitchens to handle sustained increased demand.
2.1: Work with food relief organizations and the private sector to develop a platform to aggregate food purchasing by community organizations, and leverage the increased purchasing power to improve accessibility and decrease costs (e.g., Toronto Food Strategy’s Aggregated Food Procurement project). Consider creating an innovative competition for design of the platform.2.2: Collaborate with food pantry and soup kitchens to identify natural disaster risks, expand community-based preparedness efforts, and explore opportunities for funding actions.2.3: Establish an efficient clearinghouse for potential food waste to decrease waste and increase food passing through secondary market.2.4: Create competitive grants or awards to nonprofit organizations that serve at risk populations to increase their capacity.
FOOD AVAILABILITY continued

28 Resilient Food Systems, Resilient Cities: Recommendations for the City of Boston
NAME TITLE ORGANIZATION
Boston, Massachusetts
Lauren Abda Managing Director The Food Loft
Kevin Begin General Manager Dean Foods (Garelick)
Kendra Bird Director of Distribution Services & Nutrition The Greater Boston Food Bank
Joshua Birdsall Food Program Manager Women's Lunch Place
Jeff Cole Executive Director Mass Farmers Markets
John DePriest Director of Planning and Development City of Chelsea, Department of Planning and Development
Tiffani Emig Market Manager Boston Public Market
Rene Fielding Director City of Boston, Office of Emergency Management
Chris Flynn President Massachusetts Food Association
Ronn Garry Co-Owner Tropical Foods
Kim Greenfield Founder Campo Verde Solutions
Jim Griffin Former President Coolfish, a Division of Slade Gorton
Tim Griffin Associate Professor Tufts University, Friedman School of Nutrition Science and Policy
Billy Grubbs Equipment and Facilities Coordinator Boston Public Schools, Food & Nutrition Services
Vineet Gupta Director of Planning Boston Transportation Department
Brian Houghton Vice President Massachusetts Food Association
Sutton Kiplinger Greater Boston Regional Director The Food Project
Kathryn Law SNAP Research and Analysis Director United States Department of Agriculture, Food and Nutrition Service, Office of Policy Support
Alvaro Lima Director of Research Boston Redevelopment Authority
Sue Marsh Executive Director Rosie's Place
Atyia Martin Director Boston Public Health Commission, Office of Public Health Preparedness
Marcus Moench Founder ISET International
Heidi Morgan Vice President, Business Needs, Specialty Services and Supplier Inclusion
Compass Group
Edith Murnane Former Director City of Boston, Mayor's Office of Food Initiatives
Sarah Myers Former Process Engineer C&S Wholesale Grocers
Frank Martinez Nocito Assistant Director, SNAP Nutrition Education MA Department of Transitional Assistance
Scott Richardson Director of Research and Strategic Initiatives Project Bread
Bonita Oehlke Marketing Specialist Massachusetts Department of Agriculture (MDAR)
Lauren Polumbo Chief Operating Officer Lovin' Spoonfuls
Cheryl Schondek Vice President of Acquisition The Greater Boston Food Bank
Ashley Stanley Founder / Executive Director Lovin' Spoonfuls
Sue Sullivan Executive Director Newmarket Business Association
Carol Tienken Chief Operating Officer The Greater Boston Food Bank
Stephen Tyler Associate International Institute for Sustainable Development
Deborah Ventricelli Deputy Director Boston Public Schools, Food & Nutrition Services
Appendix: Interview Subjects and ContributorsThe following list includes the individuals we interviewed in Boston, New York City, San Francisco and Toronto. All interviews were conducted between September 2014 and April 2015.

ICIC 29
NAME TITLE ORGANIZATION
New York City, New York
Leslie Gordon Senior Director, Program Operations City Harvest
Myra Gordon Manager Hunts Point Produce Terminal
Kim Kessler Policy and Special Programs Director of the Resnick Program for Food Law and Policy
University of California, Los Angeles School of Law
Joe Musso Program Manager – Agency Resiliency Mayor's Office of Recovery and Resiliency
Richard Roark Partner OLIN Studios
Julie Stein Vice President, Development New York City Economic Development Corporation
Laura Tolkoff Senior Planner for Energy and Environment Regional Plan Association
Barbara Turk Director of Food Policy Office of the Deputy Mayor for Health and Human Services
Jim Wengler Director of Benefits Access New York City Coalition Against Hunger
Joseph Whitney Logistics Coordinator/Distribution Program Manager
New York City Office of Emergency Management
Toronto, Ontario
Lauren Baker Coordinator Toronto Food Policy Council
Barbara Emanuel Manager Toronto Food Strategy, Toronto Public Health
Debbie Field Executive Director Toronto FoodShare
Alec Hay Director Center for the Resilience of Critical Infrastructure, University of Toronto
David Macleod Senior Environmental Specialist City of Toronto Energy and Environment Division
Jennifer Smysnuik Coordinator City of Toronto Office of Emergency Management
Michael Wolfson Senior Advisor, Food & Beverage Sector City of Toronto
San Francisco, California
Ben Amyes Emergency Response Coordinator City and County of San Francisco Human Services Department
Cissie Bonini Chair/Consultant Tenderloin Hunger Task Force
Michael Braude Chief Financial Officer SF Marin Food Bank
Andrea Brock Program Manager SF Wholesale Produce
Daniel Homsey Director of Neighborhood Resilience City Administrator’s Office of the City and County of San Francisco
Michael Janis General Manager SF Wholesale Produce
Paula Jones Manager City and County of San Francisco Department of Public Health, Food Policy Council
Stephanie Rapp Senior Program Officer Walter and Elise Haas Fund
Diana Sokolove Food System Policy Manager City and County of San Francisco Planning Department
Robert Stengel Planner City and County of San Francisco Department of Emergency Management
Eli Zigas Program Manager, Food Systems and Urban Agriculture
SPUR

30 Resilient Food Systems, Resilient Cities: Recommendations for the City of Boston
1 See U.S. Department of State, United States Climate Action Report 2014 (2014). M. Weir, N. Pindus, H. Wial and H. Wolman (Eds.), Building Resilient Regions, volume four of Urban and Regional Policy and Its Effects (Washington: Brookings, 2012). “Community Responses to Disaster,” Special Issue, Community Development 43, no. 5 (December 2012).
2 “Resilience,” U.S. Department of Homeland Security, accessed April 3, 2015. http://www.dhs.gov/topic/resilience.
3 Boston was ranked the seventh most resilient city in the world by the Grosvener Group in 2014. For more details, see Richard Barkham, Resilient Cities: A Grosvenor Research Report (Grosvenor, 2014).
4 See the back cover for a description of ICIC and Next Street. This project continues work from ICIC and Next Street over the past six years that has mapped Boston’s food system and identified opportunities for economic development within the food system.
5 Shenggen Fan, Rajul Pandya-Lorch, & Silvan Yosef (Eds.), Resilience for Food and Nutrition Security (Washington: International Food Policy Research Institute, 2014).
6 Stephen Tyler et al., Climate Resilience and Food Security: A framework for planning and monitoring (Winnepeg: The International Institute for Sustainable Development, 2013).
7 Richard Barkham, Resilient Cities: A Grosvenor Research Report (Grosvenor Group Limited, 2014).
8 Rockefeller Foundation’s 100 Resilient Cities initiative is dedicated to helping cities around the world become more resilient to the physical, social, and economic challenges that are a growing part of the 21st century: http://www.100resilientcities.org/. As part of this initiative, they provide a member city with financial and logistical guidance for the establishment of a Chief Resilience Officer who will lead the city’s resilience efforts, providing expert support for the development of a resilience strategy, and access to partner agencies and member cities in the 100 Resilient Cities network.
9 PlaNYC, A Stronger, More Resilient New York (New York, 2013), 11-12.10 Samantha Coutu et al., Fresh Thinking: New Directions for the Ontario
Food Terminal (Toronto: University of Toronto, 2012).11 Greg Grajewski et al., The Green Book: Produce Market Information
Directory (National Association of Produce Market Managers, n.d.).12 “San Francisco Wholesale Produce Market,” SF Produce, accessed April
12, 2015. http://www.sfproduce.org/home.html.13 Thomas P. DiNapoli and Kenneth B. Bleiwas, An Economic Snapshot
of the Hunts Point Food Distribution Center (New York State Office of the State Comptroller, New York City Public Information Office, December 2008).
14 PlaNYC, A Stronger, More Resilient New York (New York, 2013), 222.15 Assessment of locational hazards was conducted using the Association
of Bay Area Government’s interactive Earthquake and Hazards Program map (http://gis.abag.ca.gov/website/Hazards/).
16 “Mayor Lee Announces Completion of First Phase of Wholesale Produce Market Expansion with Good Eggs Relocation to Bayview,” City and County of San Francisco Office of the Mayor press release (December 15, 2014).
17 PlaNYC, A Stronger, More Resilient New York (New York, 2013), 222. 18 Sarah Brannan, FoodWorks: A Vision to Improve NYC’s Food System
(New York: The New York City Council, 2010), 3.19 PlaNYC, A Stronger, More Resilient New York (New York, 2013), 226.
20 Canadian Society for Civil Engineering, Canadian Public Works Administration, Canadian Construction Association, and Federation of Canadian Municipalities, Canadian Infrastructure Report Card 2012 Highlights (2012).
21 URS and Goodkind & O’Dea, Inc., Hunts Point Truck Study (New York, n.d.).
22 PlaNYC, A Stronger, More Resilient New York (New York, 2013).23 City Harvest, Hurricane Sandy Relief: A Report on City Harvest’s
Response to the Storm (New York: 2013), 2.24 Siddharta Mahanta, “New York’s Looming Food Disaster,” Citylab,
October 21, 2013, accessed April 18, 2015. http://www.citylab.com/politics/2013/10/new-yorks-looming-food-disaster/7294/.
25 Daily Bread Food Bank, Who’s Hungry?: A Tale of Three Cities. 2013 Profile of Hunger in the GTA (Toronto, 2013), 6.
26 San Francisco Food Security Task Force, Assessment of Food Security in San Francisco (San Francisco, 2013), 6.
27 “About Food Bank,” Food Bank NYC, accessed April 14, 2015. http://www.foodbanknyc.org/about-food-bank.
28 “Food Deserts,” United States Department of Agriculture, accessed March 16, 2015. http://apps.ams.usda.gov/fooddeserts/fooddeserts.aspx.
29 “Food Access Research Atlas,” United States Department of Agriculture, acessed April 13, 2015. http://www.ers.usda.gov/data-products/food-access-research-atlas/go-to-the-atlas.aspx.
30 Martin Prosperity Institute, Food Deserts and Priority Neighborhoods in Toronto (Toronto: University of Toronto Rotman School of Management, n.d), 1.
31 Rod MacRae et al., “Could Toronto provide 10 percent of its fresh vegetable requirements from within its own borders?” Journal of Agriculture, Food Systems, and Community Development 1, no. 2 (2010): 108-109.
32 Mayor’s Office of Food Policy and Mayor’s Office of Long-term Planning and Sustainability, New York City Food Policy: 2013 Food Metrics Report (New York, 2013), 4.
33 San Francisco Recreation and Parks Department, Community Gardens Program 2014 Annual Report (San Francisco, 2014), 5.
34 Toronto Public Health, Cultivating Food Connections (Toronto, 2010), 7.35 “Projects,” Toronto Food Strategy, accessed April 15, 2015. http://www1.
toronto.ca/wps/portal/contentonly?vgnextoid=80ca044e17e32410VgnVCM10000071d60f89RCRD.
36 Eli Zigas and Sarah Dominguez, Locally Nourished: How a Stronger Regional Food System Improves the Bay Area (San Francisco: SPUR, 2013), 4.
37 San Francisco Food Security Task Force, Assessment of Food Security in San Francisco (San Francisco, 2013), 18.
38 San Francisco Food Security Task Force, Assessment of Food Security in San Francisco (San Francisco, 2013), 6.
39 San Francisco Food Security Task Force, Assessment of Food Security in San Francisco (San Francisco, 2013), 6.
40 Mayor’s Office of Food Policy, New York City Food Policy: 2013 Food Metrics Report (New York, 2013), 24-25.
41 New York City Coalition Against Hunger, Superstorm of Hunger (New York: 2013), 2-7.
42 “Q&A With the World’s First Chief Resilience Officer,” Rockefeller Foundation, accessed April 18, 2015. http://www.rockefellerfoundation.org/blog/q-with-worlds-first-chief-resilience/.
Endnotes

ICIC 31
43 PlaNYC, A Stronger, More Resilient New York (New York, 2013).44 Rebuild by Design is a $930 million design competition sponsored by
Department of Housing and Urban Development and President Obama’s Hurricane Sandy Task Force. http://www.rebuildbydesign.org.
45 Cissie Bonini, San Francisco Disaster Food System Report: Analysis and Recommendations to Advance Food Resiliency for Low-Income and Vulnerable Populations (San Francisco: Walter and Elise Haas Foundation, 2014).
46 “Mayor’s Office Of Recovery And Resiliency Announces Request For Proposals To Study Resiliency Of City’s Food Supply System,” New York City Economic Development Corporation press release (May 13, 2014).
47 “Climate Change Adaptation: Towards a Resilient City,” Toronto Energy and Environment Division, accessed April 8, 2015. http://www1.toronto.ca/wps/portal/contentonly?vgnextoid=78cfa84c9f6e1410VgnVCM10000071d60f89RCRD.
48 “Climate Change Adaptation: Towards a Resilient City,” City of Toronto Environment and Energy Division, accessed April 8, 2015. http://www1.toronto.ca/wps/portal/contentonly?vgnextoid=78cfa84c9f6e1410VgnVCM10000071d60f89RCRD.
49 Toronto and Region Conservation Authority, Food (Toronto, 2008), 10.50 “Mayor Lee & Supervisor Cohen Celebrate Completion of First Phase
of Wholesale Produce Market Expansion,” City and County of San Francisco Office of the Mayor press release (October 22, 2014).
51 Jeanne B. Perkins and Danielle Hutchings, Taming Natural Hazards (San Francisco: Association of Bay Area Governments, 2010), D-6.
52 “Seismic Design Criteria,” California Department of Transportation, accessed January 21, 2005. http://www.dot.ca.gov/hq/esc/earthquake_engineering/sdc/.
53 San Francisco Public Utilities Commission, City and County of San Francisco Public Utilities Commission Adopted Budget 2010-11 & 2011-12 (San Francisco, 2010).
54 Rebuild by Design is a $930 million design competition sponsored by Department of Housing and Urban Development and President Obama’s Hurricane Sandy Task Force. http://www.rebuildbydesign.org.
55 “Hunts Point / Lifelines,” Rebuild by Design, accessed February 26, 2014. http://www.rebuildbydesign.org/project/hunts-point-lifelines/.
56 PlaNYC, A Stronger, More Resilient New York (New York, 2013), 228.57 Brian Donahue et al., A New England Food Vision (Durham: Food
Solutions New England, University of New Hampshire, 2014), 4-6 . 58 Catherine de Ronde, “Snapshot of Massachusetts Agriculture” in
Massachusetts Department of Agricultural Resources 2014 Annual Report (Boston: Massachusetts Department of Agricultural Resources, 2014), 9-15.
59 Allendale Farm is located on one site; City Growers operates on five sites, including on a City established and owned Pilot Urban Agriculture Overlay District; Corner Stalk operates on one site; The Food Project operates on four sites; Katsiroubas Brothers Fruit and Produce operates on one site. ReVision Urban Farms operates on two sites, including one site on a Pilot Urban Agriculture Overlay District. List of commercial urban farms excludes Boston Latin School’s urban freight farm, which is primarily used for non-commercial farming (education and awareness). Source: City of Boston Mayor’s Office of Food Initiatives.
60 “Strike,” in Glossary of NHC Terms, National Weather Service National Hurricane Center, accessed April 11, 2015. http://www.nhc.noaa.gov/aboutgloss.shtml.
61 Nine percent of the milk processed in Massachusetts is supplied from Massachusetts dairy farms, 64 percent is from another New England state and 27 percent is from outside of New England. Source: Richard P. Horwitz, “Massachusetts Workshop on FMD Vulnerability and Preparedness” (presentation, 2011).
62 Milk processing facilities only include facilities that receive or ship milk interstate. Dairy farms with no processing facilities are excluded from analysis. Food and Drug Administration, IMS List: Sanitation and Compliance Enforcement Ratings of Interstate Milk Shippers January 2015 (2015), 31-32.
63 Food and Drug Administration, IMS List: Sanitation and Compliance Enforcement Ratings of Interstate Milk Shippers January 2015 (2015).; ICIC Analysis.
64 Ronald W. Cotterill and Andrew W. Frankin, The Public Interest and Private Economic Power: A Case Study of the Northeast Dairy Compact (Storrs: Food Marketing Policy Center, Department of Agricultural and Resource Economics, University of Connecticut, 2001), 44, 69.
65 Ronald W. Cotterill and Andrew W. Frankin, The Public Interest and Private Economic Power: A Case Study of the Northeast Dairy Compact (Storrs,: Food Marketing Policy Center, Department of Agricultural and Resource Economics, University of Connecticut, 2001), 69.
66 Food and Drug Administration, IMS List: Sanitation and Compliance Enforcement Ratings of Interstate Milk Shippers January 2015 (2015).; ICIC Analysis.
67 Food and Drug Administration, IMS List: Sanitation and Compliance Enforcement Ratings of Interstate Milk Shippers January 2015 (2015).; ICIC Analysis.
68 “Top Broiler Producing States,” National Chicken Council, accessed April 14, 2015. http://www.nationalchickencouncil.org/about-the-industry/statistics/top-broiler-producing-states/.
69 James M. MacDonald, Technology, Organization, and Financial Performance in U.S. Broiler Production, EIB-126 (United States Department of Agriculture, Economic Research Service, 2014), 4.
70 “USA’s Top Broiler Companies,” Watt PoultryUSA, accessed April 15, 2015. http://www.wattagnet.com/Marketdata/topcompanies/uspoultry/.
71 “Meat, Poultry and Egg Product Inspection Directory,” United States Department of Agriculture Food Safety and Inspection Service, accessed April 10, 2015. http://www.fsis.usda.gov/wps/portal/fsis/topics/inspection/mpi-directory. Number of facilities excludes Tyson’s non-poultry (Tyson’s Fresh Meats, Inc.) and prepared food (Tyson Prepared Foods, Inc.) facilities.
72 “Poultry Processing Businesses,” infoUSA, 2015. 73 Gary Lucier and Alberto Jerardo, Vegetables and Melons Outlook
VGS-315 (United States Department of Agriculture, Economic Research Service, 2006), 23.
74 IRI. Flowers Food Investor Fact Sheet (Flowers Foods, 2015). 75 IRI. Flowers Food Investor Fact Sheet (Flowers Foods, 2015).76 IRI. Flowers Food Investor Fact Sheet (Flowers Foods, 2015).77 Jeff Gelski, “Flowers names senior v.p. for Northeast region,”
Baking Business, July 22, 2014, accessed April 9, 2015. http://www.bakingbusiness.com/articles/news_home/People/2014/07/Flowers_names_senior_vp_for_No.aspx?ID=%7BD9D99503-87E1-4309-9172-24C11CF553F5%7D.
78 “About Us,” Campbell Soup Company. http://www.campbellsoup.com/Resources/AboutUs.

32 Resilient Food Systems, Resilient Cities: Recommendations for the City of Boston
79 Sarah Ellison, “Campbell’s Big Bet: Heating Up Condensed Soup, Battling Progresso,” The Wall Street Journal, July 31, 2013, accessed April 12, 2015. http://www.wsj.com/articles/SB105959895913831100.
80 Andy Nelson, “Wholesalers happy with terminal markets,” The Packer, March 22, 2012, accessed April 12, 2015. http://www.thepacker.com/fruit-vegetable-news/know-your-market/Wholesalers-happy-with-terminal-markets-143833566.html.
81 Massachusetts Department of Transportation, Massachusetts Department of Transportation Freight Plan (Boston, 2010), 2-105.
82 Federal Emergency Management Agency, “National Flood Hazard Layer,” MassGIS, last modified 2014. Initiative for a Competitive Inner City, Next Street, and Karp Resources, “Designing an Inner City Food Cluster Strategy” (2012). Paul Kirshen, Ellen Douglas, and Chris Watson, “Boston Harbor Sea Level Rise Maps” (The Boston Harbor Association, 2013); ICIC Analysis
83 Massachusetts Department of Transportation, Massachusetts Department of Transportation Freight Plan (Boston, 2010).
84 Carl Spector and Leah Bamberger, Climate Ready Boston (Boston: Greenovate Boston, 2013), 21.
85 Massachusetts Department of Public Health Bureau of Environmental Health, “Food Manufacturers and Distributors” (Boston: 2015).
86 Andy Nelson, “Wholesalers happy with terminal markets,” The Packer, March 22, 2012, accessed April 12, 2015. http://www.thepacker.com/fruit-vegetable-news/know-your-market/Wholesalers-happy-with-terminal-markets-143833566.html
87 Alvaro Lima, Mark Melnik, Kelly Dowd, and Joanne Wong, Grocery Stores in Boston (Boston: Boston Redevelopment Authority, 2013). Note: Excludes two grocery stores that closed (Shaw’s and Kam Man in Dorchester) and one grocery store that opened (Whole Foods Market in the South End) since the report was published. “Corner Stores,” City of Boston Mayor’s Office of Food Initiatives, Data Boston, accessed April 18, 2015. https://data.cityofboston.gov/dataset/Corner-Stores/4vcu-nshu.
88 Alvaro Lima, Mark Melnik, Kelly Dowd, and Joanne Wong, Grocery Stores in Boston (Boston: Boston Redevelopment Authority, 2013).; ICIC Analysis.
89 ICIC survey of grocery and corner stores in Back Bay and Roxbury on February 18 and 19, 2015. The grocery stores we surveyed were Tropical Foods (Roxbury) and Star Market (Back Bay), and the corner stores were Bohio Grocery and Snacks (Roxbury) and Tedeschi Food Shops (Back Bay).
90 Carl Spector, and Leah Bamberger, Climate Ready Boston (Boston: Greenovate Boston, 2013).
91 “Facts, Figures and Reports,” Boston Public Schools, accessed April 14, 2015. http://bostonpublicschools.org/site/default.aspx?PageType=3&DomainID=4&ModuleInstanceID=14&ViewID=047E6BE3-6D87-4130-8424-D8E4E9ED6C2A&RenderLoc=0&FlexDataID=3160&PageID=1&GroupByField=DisplayDate&GroupYear=2013&GroupMonth=12&Tag=.
92 “BPS offers universal free meals for every child,” Boston Public Schools, accessed April 14, 2015. http://www.bostonpublicschools.org/domain/238.
93 U.S. Census Bureau 2013 American Community Survey 5-Year Estimates; ICIC Analysis
94 “Food Bank Network,” Feeding America, accessed April 11, 2015. http://www.feedingamerica.org/our-response/how-we-work/food-bank-network/.
95 “Feeding America Prepares For Hurricane Sandy,” Feeding America, last modified October 29, 2012, accessed April 11, 2015. http://www.feedingamerica.org/hunger-in-america/news-and-updates/press-room/press-releases/feeding-america-prepares-for-hurricane-sandy.html.
96 “About GBFB,” The Greater Boston Food Bank, accessed April 14, 2015. http://www.gbfb.org/our-mission/about-gbfb.php.
97 The Greater Boston Food Bank, Hunger in Eastern Massachusetts 2014 (Boston: 2014).
98 “The Greater Boston Food Bank Completes $35 Million Fighting Hunger, Feeding Hope Capital Campaign,” The Greater Boston Food Bank press release, February 11, 2011.
99 “Hunger Study,” The Greater Boston Food Bank, accessed April 12, 2015. http://www.gbfb.org/our-mission/hunger.php.
100 The Greater Boston Food Bank, Consolidated Financial Statements (With Supplementary Information) and Independent Auditor’s Report (Boston: The Greater Boston Food Bank, Inc. and Subsidiary, September 30, 2014).
101 “Massachusetts Emergency Food Assistance Program (MEFAP),” Massachusetts Executive Office Energy and Environmental Affairs, accessed April 13, 2015. http://www.mass.gov/eea/agencies/agr/about/divisions/mefap.html.
102 The Greater Boston Food Bank, Consolidated Financial Statements (With Supplementary Information) and Independent Auditor’s Report (Boston: The Greater Boston Food Bank, Inc. and Subsidiary: September 30, 2014).
103 “About VOAD,” Massachusetts Voluntary Organizations Active in Disaster, accessed April 13, 2015. http://massvoad.org/news/?page_id=55.
104 “Community Projects & Initiatives,” City of Boston Mayor’s Office of Food Initiatives, accessed April 13, 2015. http://www.cityofboston.gov/food/urbanag/community.asp.
105 “Urban Agriculture Rezoning Initiative,” Boston Redevelopment Authority, accessed April 13, 2015. http://www.bostonredevelopmentau-thority.org/planning/planning-initiatives/urban-agriculture-rezoning.
106 “Boston Neighborhood Shapefiles,” Boston Redevelopment Authority, Data Boston, last modified January 24, 2014. https://data.cityofboston.gov/City-Services/Boston-Neighborhood-Shapefiles/af56-j7tb.; Boston Redevelopment Authority Research Division, Neighborhood Profiles: City of Boston (Boston: Boston Redevelopment Authority, 2014). Alvaro Lima, Mark Melnik, Kelly Dowd, and Joanne Wong, Grocery Stores in Boston. (Boston: Boston Redevelopment Authority, 2013).; ICIC Analysis.
107 “Boston Neighborhood Shapefiles,” Boston Redevelopment Authority, Data Boston, last modified January 24, 2014. https://data.cityofboston.gov/City-Services/Boston-Neighborhood-Shapefiles/af56-j7tb.; Boston Redevelopment Authority Research Division, Neighborhood Profiles: City of Boston (Boston: Boston Redevelopment Authority, 2014). “Corner Stores,” City of Boston Mayor’s Office of Food Initiatives, Data Boston, last modified January 30, 2013. https://data.cityofboston.gov/dataset/Corner-Stores/4vcu-nshu.; ICIC Analysis.
108 Alvaro Lima, Mark Melnik, Kelly Dowd, and Joanne Wong, Grocery Stores in Boston (Boston: Boston Redevelopment Authority, 2013).; U.S. Census Bureau 2013 American Community Survey 5-Year Estimates; ICIC Analysis.
Endnotes continued

ICIC 33
109 “Corner Stores,” City of Boston Mayor’s Office of Food Initiatives, Data Boston, last modified January 30, 2013. https://data.cityofboston.gov/dataset/Corner-Stores/4vcu-nshu.; U.S. Census Bureau 2013 American Community Survey 5-Year Estimates; ICIC Analysis.
110 “Food Access Research Atlas,” United States Department of Agriculture, accessed April 13, 2015. http://www.ers.usda.gov/data-products/food-access-research-atlas/go-to-the-atlas.aspx.
111 U.S. Census Bureau 2013 American Community Survey 5-Year Estimates; ICIC Analysis. Note: Poverty rate estimates exclude currently enrolled undergraduate and graduate students. We exclude students because they skew poverty rate estimates and students are likely to leave the city in the event of a disaster-related school closure.
112 Boston Redevelopment Authority, “2010 Census Tracts & Neighbor-hoods” (Boston: Boston Redevelopment Authority, 2014).; U.S. Census Bureau 2013 American Community Survey 5-Year Estimates; ICIC Analysis.
113 Boston Redevelopment Authority, “2010 Census Tracts & Neighbor-hoods” (Boston: Boston Redevelopment Authority, 2014).; U.S. Census Bureau 2013 American Community Survey 5-Year Estimates; ICIC Analysis.
114 Atyia S. Martin, “A framework to understand the relationship between social factors that reduce resilience in cities: Application to the City of Boston,” International Journal of Disaster Risk Reduction 12 (June 2015): 53-80. doi:10.1016/j.ijdrr.2014.12.001.
115 This study was completed by Kira Watson during February and March 2015. Semi-structured interviews with 30 individuals were conducted in Boston Public Library locations and other community locations in Dorchester, Mattapan and Roxbury.
116 The grocery stores we surveyed were Tropical Foods (Roxbury) and Star Market (Back Bay), and the corner stores were Bohio Grocery and Snacks (Roxbury) and Tedeschi Food Shops (Back Bay). Prices were recorded on February 18th and 19th, 2015. For food item comparisons, we identified the same brand and package size. The same brand of white bread and iceberg lettuce was not available across all stores, so a comparable substitute was used. For instances where food items were not the same size, we used unit prices.
117 C. Gunderson et al., Map the Meal Gap 2015: Overall Food Insecurity in Massachusetts by County in 2013 (Chicago: Feeding America, 2015).

34 Resilient Food Systems, Resilient Cities: Recommendations for the City of Boston
Boston Food Resilience Steering Committee Members, 2014-2015
The Boston Harbor AssociationJulie Wormser, Executive Director
Boston Public Health CommissionAtyia Martin, Director, Office of Public Health Preparedness
Boston Redevelopment AuthorityJonathan Greeley, Senior Infrastructure and Public Realm Planner II
Boston Transportation DepartmentVineet Gupta, Director of Policy and Planning
City of Boston, Office of Emergency ManagementRene Fielding, Director
City of Boston, Office of Environment, Energy, and Open SpaceAustin Blackmon, ChiefBrian Swett, former Chief
City of Boston, Mayor’s Office of Food InitiativesEdith Murnane, former Director
City of Chelsea, Department of Planning and DevelopmentJohn DePriest, Director of Planning and Development
Eversource EnergyJames Cater, Utility Program LiaisonJohn Hoey, City of Boston Community Relations Representative
Greater Boston Federal Executive BoardKim Ainsworth, Executive Director
The Greater Boston Food BankCarol Tienken, Chief Operating Officer
Henry P. Kendall FoundationAndy Kendall, Executive Director
Massachusetts Department of Agricultural ResourcesBonita Oehlke, Marketing Specialist
Massachusetts Food AssociationChris Flynn, PresidentBrian Houghton, Vice President
Metropolitan Area Planning Council (MAPC)Julie Conroy, Senior Regional Planner, Environmental DivisionHeidi Stucker, Food System Planner
New Urban MechanicsChris Osgood, Co-Chair
Northeastern University School of Public Policy and Urban AffairsChristopher Bosso, Professor
Project BreadScott Richardson, Director of Research and Strategic Initiatives

ICIC 35
The Project TeamThe City of Boston’s Food System Resilience Study was com-missioned by the City of Boston’s Office of Food Initiatives. The study was led by Kim Zeuli and Austin Nijhuis at ICIC, in partnership with Pete Murphy in the City of Boston’s Office of Food Initiatives. The study was supported by Adina Astor and Brian Cope from Next Street.
For more information about the study or this report, please contact: Kim Zeuli, Senior Vice President, ICIC at [email protected] or 617.238.3012.
About ICICFounded in 1994 by Harvard Business School Profes-sor Michael Porter, the Initiative for a Competitive Inner City (ICIC) is the leading authority on inner city economic development with a reputation for effectively helping cities to develop strategies that capitalize on a community’s unique competitive advantages. ICIC’s mission is to promote eco-nomic prosperity in America’s inner cities through private sector engagement that leads to jobs, income, and wealth creation for local residents.
For more information about ICIC, please visit www.icic.org.
Follow us at:
@icicorg
Facebook.com/icicorg
icicorg
About Next StreetNext Street was founded in 2005 to advise high-potential small enterprises in urban markets across the country, catalyze economic development, and spur the revitalization of America’s cities. The firm’s professionals are drawn from backgrounds in business, social enterprise and economics and work across the economic development ecosystem, including small businesses, nonprofits, anchor institutions, government agencies, foundations, and impact investors. Next Street has deep experience in the food sector, shaping food policy and strategy in cities and regions, advising educational institu-tions and workforce agencies, and serving individual busi-nesses in food production, manufacturing, distribution, food service and retail.
AcknowledgementsThe Boston Food System Resilience Study was generously funded by the Henry P. Kendall Foundation and the Local Sustainability Matching Fund, a project of the Funders’ Network for Smart Growth and Livable Cities and the Urban Sustainability Directors Network. We are grateful for the valuable contributions provided by Kimberly Etingoff and Kira Watson who served as consultants to the project. We also thank the numerous leaders from both public and private sectors of Boston who shared their knowledge with us through interviews and meetings, including those that served on the project’s steering committee. The strength of the report is due to the contributions of our partners and the authors claim responsibility for all errors and omissions.

Copyright 2015 ICIC. All rights reserved.