reserving for segregated fund contracts - menu – … · reserving for segregated fund contracts...
TRANSCRIPT

Reserving for Segregated Fund Contracts
Mary R Hardy Heriot-Watt University, Edinburgh EH14 4AS, UK
Abstract
Segregated funds, under which the insurer invests the policyholder premiums in a separate fund with specified assets, comprise an increasing proportion of life insur- ance contracts written. In many areas it is common to offer guarantees with these contracts with respect to minimum benefits payable on maturity. These guarantees must be provisioned for, either internally or by purchasing suitable options in the market. In this paper we consider some issues that arise if the insurer chooses to hold reserves for these contracts. First we consider a method to determine the ini- tial reserve for these contracts, taking (prudent) consideration of the future random cash flows from the segregated fund to the insurer's fund through annual manage- ment charges. We also consider the implications for the valuation of business in force, and the release of reserves back to the insurer over the term of the contract provided experience is favourable. The method used is stochastic simulation, and the results are compared with the alternative approach of using option pricing and hedging.
KEYWORDS: Segregated Funds; guarantees, asset-liability modelling, reserves; hedging
This research was supported by Standard Life Assurance Company. The author is solely responsible for the conclusions. The author thanks Claire Bilodeau for her diligent re- search assistance and Standard Life for their support.

1 Introduction
In a segregated fund contract the policyholder's premiums (sometimes after deduction of an expense charge) are invested in the assets of a fund; when the policy matures the benefit amount is equal to the market value of the accumulated premiums. The term segregated fund comes from the fact that the assets are held separate from the other assets of the insurance company. The investments of the fund may consist of traditional investments, such as bonds, or in the stocks underlying a stock index, or in a 'managed fund' comprising a mixture of asset types. A distinguishing feature of the segregated fund contract in Canada is that there is generally a minimum benefit of either 75% or 100% of the total premiums paid under the policy. For example, under a ten year contract where the policyholder pays a single premium of $100,000, the guaranteed maturity amount might be equal to $75,000. If the market value of the policy happened to be $70,000 a t maturity the policyholder would receive a total of $75,000, with $5,000 coming from the guarantee. In most cases the guarantee applies to the gross premium, before deduction of expense charges. Contracts may be single premium, level annual premium or variable annual premium.
In order for the guarantee to have no value, and therefore no reserve requirement, it must be the case that the possibility of the investment fund being worth less than the initial investment is negligible. For funds invested in, say, the stocks underlying the TSE3OO or S&P500 indices, history does not appear to support the idea that a very low retrun over a 5 or 10 year period is impossible. Figures 1 and 2 show the annual yield on a single 5 year or 10 year investment in the TSE300 or S&P 500. The figures assume that dividends are reinvested and Canadian dollar investment in the US index funds (CIA,1996).
A single premium contract offering a guarantee of 100% of the premium paid, and charging an annual management fee of 2% of the fund would have to earn a t least 2% per annum over the period of the contract for the guarantee to have zero cost; a fund offering the same guarantee with no annual management fee would have to earn a t least 0% per annum over the period of the contract for the guarantee to have zero cost. The figures show that, although very low returns may be unusual on (say) a 10 year single premium investment, they are certainly not impossible.
Segregated fund guarantees are financial guarantees and cannot be dealt with adequately using traditional actuarial approaches. Two methods that have been used in the past are stochastic simulation (for example, see the report of the Maturity Guarantees Working Party, 1980) and option pricing.
Using stochastic simulation, we simulate the future performance of the fund using a stochastic model of investment returns. These simulations can be used to generate a sample of the accumulated premiums a t maturity, using the random (and equally likely) projected investment conditions. From this we can estimate the distribution of the claims under the guarantee. This distribution can then be used to estimate quantities of interest

1940 1960 1980 Year
Figure 1: Yield p.a. on a 5 year investment in TSEJOO or S&P500
such as the expected cost of the guarantee and the amount of initial reserve such that the provision will be adequate, say 99% of the time. To determine the appropriate rate to discount the future claim we need to make an assumption concerning the investment of these reserves. Often it is assumed they are invested in some safe account, such as fixed interest investments.
The distribution of claims under the guarantee will generally be very highly skewed. Most of the time there will be no cost under the guarantee as the accumulated premiums will exceed the guarantee, but if the investment performance is very poor in the last year or two of the simulation then the claim can be significant.
Segregated fund guarantees can also be viewed in terms of put options. A put option is a contract which gives its owner the right to sell a particular asset at a prespecified price a t specified future times. The policyholder has an embedded put option under a maturity guaranteed contract since she can sell the contract to the insurance company for the guaranteed amount. Perhaps the earliest formulation of the guarantee as a put option was by Eduardo Schwartz in his doctoral thesis at the University of British Columbia in 1975. Papers which describe this approach include Boyle and Schwartz(l977), Brennan and Schwartz(l976), (1979) and Bacinello and Ortu(1993).
Under the option pricing approach it is assumed that the guarantee is met by employing a dynamic investment strategy. The assets of the portfolio are adjusted on an ongoing

- TSEBOO . . . . . . . . . S&P500
1930 1940 1950 1960 1970 1980 Year
Figure 2: Yield p.a. on a 10 year investment in TSEJOO or S&P500
basis so that at maturity the fund provides the minimum guaranteed amount when the guarantee is operative and the value of the assets otherwise. While the option pricing approach and the stochastic simulation approach produce comparable numbers for the expected cost of the guarantees they differ in their approaches to the reserving strategies. In Boyle and Hardy(1996) both methods are applied to Canadian-style contracts; one conclusion was that both methods may be useful. In this paper we consider reserving under the stochastic simulation method.
2 Stochastic Simulation Methods
The stochastic simulation approach uses a stochastic model of future investment expe- rience to generate a number of scenarios of stock price movements over the term of the segregated fund policies. We then assess the cost of the guarantee under each of these scenarios.
The reserving standard is the required probability of having sufficient funds to meet the cost of the guarantee. This means that, if reserves of Vo are established at time 0 with the intention that no further funds will be called upon, and we decide a reserving standard

of p, then
P r [ ( ~ u n d at Maturity + &. e6.") > guarantee] 2 p
where 6 is the assumed force of interest at which the reserve is invested, and n is the term to maturity for the contract.
We have used reserving standards of 99% and 95%. This means we use the stochastically generated scenarios as a sample from the underlying distribution of the (random) guar- antee cost, from which we estimate the 99th and 95th percentiles. We have also used a force of interest of 6% per annum for reserves, which are assumed to be invested in risk free bonds.
Hence, for a reserving standard of 99%, for example, and for a 5-year annual premium contract, with premiums of $100 per annum and a guarantee of 100% of premiums paid in, we find Vo such that:
P r [ ( ~ u n d at Maturity + &. e5') > 5001 = 0.99
The approach we have taken is similar to that of the Maturity Guarantees Working Party (1980), but they based their calculations on an aggregate approach, simulating the results for an entire portfolio of policies. The reserve standard which they used was a 99% standard for the entire portfolio, which consisted of policies of different sizes and terms to maturity. The 99% standard, for which surrenders were not taken into consideration, was deemed to be approximately equivalent to a 99.9% reserving standard when surrenders were taken into consideration. We have taken an individual policy approach - which is equivalent to considering reserves separately for each cohort of business. Using this approach with a reserving standard of p implies that the aggregate security of the fund is greater than p, assuming that, in the event of a serious market crash, reserve requirements for non-maturing cohorts may be relaxed slightly to release reserves for the guarantee liability on maturing contracts. The value of p therefore does not give an overall figure for the probability that reserves in aggregate are sufficient to meet the guarantee costs of all policies in the portfolio - a separate exercise would be needed to identify this probability. However the policy or cohort approach gives more direct information for pricing contracts, since the capital requirements for each contract do not depend on the existing portfolio, and also allows for the gradual release of the reserves over the term of the contract, assuming that returns are favourable, while maintaining the probability that the cohort guarantee costs are met by the cohort reserves. More detail on an approach to releasing reserves is given in Section 4.
We have used the Wilkie investment model (Wilkie(1986),(1995)) to project the stock price dynamics for all the reported results. The parameters used are those fitted to Canadian data, from Wilkie(1995). For comparison, some figures for single premium contracts are also given assuming that the annual rolled up asset returns are independent and lognormally distributed.

2.1 Simulating the Cost of the Guarantee
To estimate the distribution of the liability under the guarantee we proceed as follows. Assume we have a single premium contract with the premium equal to $100. Assume also that the contract matures in 10 years, and that the guaranteed amount is 100% of the initial premium. We simulate the maturity value of the initial investment a large number of times using the Wilkie model. For each run we can find the cost of the guarantee a t the date that the guarantee operates - for many simulations the accumulated premiums will exceed the guarantee and the cost will be zero. Where the cost is greater than zero we convert it into amounts in terms of today's dollars by discounting. The discount rate depends on our assumptions concerning the investment of reserves and surplus. We have assumed that the reserves are invested in fixed interest securities and have used a force of interest of 6% per annum to discount the liabilities.
The annual premium case is very similar. We have assumed a level annual premium of $100. We use the simulated investment conditions from the time of investment to the maturity date, and compare the accumulated premiums with the guarantee of 75% or 100% of premiums.
The main results in Section 3, are based on 45,000 identical simulations of the investment conditions. Using identical (or repeated) simulations allows a more direct comparison be- tween the different contracts investigated, without having to allow for random differences in simulated conditions.
In both the single and annual premium case the simulated values of the cost of the guar- antee are treated as a sample from the unknown, underlying distribution of the random cost of the guarantee. From this sample we can estimate the expected cost of the guaran- tee, and the initial reserve required to achieve a given probability that the accumulated reserve is sufficient to pay the cost of the guarantee at maturity. We have calculated reserves allowing for (a) a 95% probability of meeting the cost of the guarantee and (b) a 99% probability of meeting the cost of the guarantee.
The expected value and reserve calculations are estimates of true, unknown values from the underlying distribution. We can quantify how good these estimates are by calculating standard errors or confidence intervals. In calculating standard errors and confidence intervals we do not need to know anything about the true underlying distribution of the accumulated premiums (as we can use the fact that for any distribution, the number of simulations below the true 1% (say) point of the distribution is binomially distributed, with the first parameter equal to the number of simulations and the second equal to 1%).
The confidence intervals quoted below for the reserve estimates are 95% confidence iu- tervals - that is, the probability that the true (unknown) value of the reserve lies in the interval quoted is 95%. The quoted reserve value is the best estimate of the true reserve within that interval.

The confidence intervals allow only for random variation in the stochastic simulations (that is, the possibility that by chance we have an unusually high or low set of simulations). They do not allow for any model mis-specification.
In the simple, single premium case, we can compare the results of simulation with the reserve required assuming independent lognormal annual returns - that is, if it is the rate of interest earned on the funds (rolled up) in the year t - 1 to t , (1 + i t ) are assumed to independent, and identically distributed with lognormal distribution. The parameters of the lognormal distribution are chosen to be consistent with the returns from the Wilkie simulations, and with the historic data, that is p = ,081, u = 0.17.
3 Expected costs and initial reserves
In this section the results of the stochastic simulation are given for funds assumed invested in the stocks underlying the TSE300 index. We quote the expected value of the guarantee cost (that is, the mean cost over the 45,000 simulations) and the initial reserve required for a reserve standard of 95% and 99%, assuming that the guarantee reserve is established in full at the start of the contract, and that this reserve is invested in assets earning a risk free force of interest of 6%pa.
The expense deductions for the Canadian segregated fund contracts vary. A common design is a deduction of 1% or 2% of the accumulated fund a t the start of each policy year. The guarantee is generally either 100% or 75% of the total premium paid, before the expense deductions.
The results show that, even where the expected cost of the guarantee is relatively small, the reserve required to meet the reserving standard may be substantial - at , for example, a quarter of the single premium for the 10 year contract with 100% guarantee, and with a 1% annual charge. To hold no reserve for, say, a 10 year contract is to ignore a 5% chance of requiring a t least $12% of the premium to meet the guarantee. This would seem a perilous decision.
As we would expect the 100% guarantee is substantially more expensive a t all terms than the 75% guarantee, and the reserves required are also very much greater. I t is also clear from these tables that the cost of and reserve for the guarantee decreases as the term increases. This is because by the end of (say) the 15 year term, the premiums have generally accumulated sufficiently to absorb quite substantial market value fluctuations without falling below the guarantee level.
The annual management charge increases the guarantee cost and reserves, as only 99% or 98% of premium is invested, while the guarantee is 100% of the premium. However, the mangement charge provides a means of paying for the reserve during the course of the contract, so the full amount would not need to be found a t the start of the contract.

5 Years 1 2.377 1 17.942 (17.5, 18.4) 1 30.531 (30.0, 31.2) I I I
Term
10 Years 1 0.946 ( 7.906 (7.5, 8.4) 1 20.991 (20.4, 21.6) I I I
Expected Cost
15 Years 1 0.379 1 0.000 (0.0, 0.0) 1 12.938 (12.5, 13.5)
Guarantee 100% of the single premium
115Years1 0.0801 0.000 (0.0,0.0)1 2.774 (2.3,3.3)1
Guarantee 75% of the single premium
95% Confidence Reserve Interval
10 Years
Table 1: $100 single premium, 1% annual management charge
99% Confidence Reserve Interval
Term 95% Confidence Reserve Interval
Expected Cost
0.175
5 Years 1 3.020 1 20.721 (20.3, 21.1) 1 32.687 (32.2, 33.3)
99% Confidence Reserve Interval
Term
0.000 (0.0, 0.0) 7.270 (6.7, 7.9)
Expected Cost
10 Years
5 Years 1 0.486 1 2.201 (1.8, 2.6) 1 14.166 (13.7, 14.8)
( 15 Years 1 0.683 1 5.103 (4.7, 5.5) 1 16.854 (16.4, 17.3) 1 Guarantee 100% of the single premium
95% Confidence Reserve Interval
1.436
Term
I15Years1 0.1601 0.000 (0.0,O.O)) 6.689 (6.3,7.2)1
Guarantee 75% of the single premium
99% Confidence Reserve Interval
10 Years
Table 2: $100 single premium, 2% annual management charge ($)
12.441 (12.1, 12.9)
Expected Cost
24.263 (23.7, 24.8)
0.300
95% Confidence Reserve Interval
99% Confidence Reserve Interval
0.000 (0.0, 0.0) 10.542 (10.0, 11.1)

The zero entries in the reserve columns above indicate contracts where the probability that the guarantee has zero cost (that is, that the accumulated premiums exceed the guarantee) is greater than the reserving standard probability. This means that, without holding any reserve a t all, the reserving standard is met.
The annual premium results are shown in Tables 3 and 4. The annual premium is assumed to be $100, so the figures may be interpreted as the reserve required per cent of annual premium.
Expected costs and initial reserves are given for annual contracts under which the fund (accumulated premiums) is subject to an annual fee or management charge of 1% or 2%.
The tables show that the reserve required first increases and then decreases with the term. There are two effects here; for the longer contracts the accumulated early premiums help to counter the risk of loss from a fall in market values near maturity. The effect of discounting also reduces the liability in respect of longer contracts. On the other hand, the guarantee is, in absolute terms, greater for longer terms, so that the potential shortfall in the accumulated premiums is also greater.
Term
15 Years I 8.99 1 73.79 (69.6, 78.1) 1 202.8 (197.8, 208.4) I I I
5 Years
10 Years
Expected Cost
I cost 1 Reserve Interval 1 Reserve Interval
12.19
12.57
20 Years
5 years I 1 .09 ) 0.000 (0.0,0.0)1 40.03 (38.3,42.2) I 1 I
95% Confidence Reserve Interval
99% Confidence Reserve Interval
83.82 (82.2, 85.3)
105.5 (102.4, 108.1)
Guarantee 100% of Total Annual Premiums I Term 1 Expected 1 95% Confidence 1 99% Confidence 1
5.57
132.6 (130.9, 134.8)
198.6 (195.1, 202.8)
10 Years
15 Years
Table 3: Annual premium policy, 1% annual management charge
13.26 (6.8, 18.6)
20 Years
173.3 (166.3, 179.5)
1.55
1.21
Guarantee 75% of Total Annual Premiums 0.81
0.000 (0.0,O.O)
0.000 (0.0,O.O)
61.43 (57.9,65.6)
50.34 (45.4,56.0)
0.000 (0.0,O.O) 22.74 (15.8,28.9)

5 Years
1 10 Years 1 16.83 / 129.5 1126.9. 132.5)
1 15 Years 1 13.51 1 116.9 (112.9. 120.31
20 Years 9.37 75.38 (69.4, 80.7)
Guarantee 100% of Total Annual
99% Confidence Reserve Interval
139.3 (138, 142)
217.5 (214, 221)
233.3 (229, 239)
215.9 (210, 223)
remiums 1 5 Years 1 0.000 (0.0,1.2)i 46.72 (45.1,49.2)
10 Years 0.000 (0.0, 0.0) 80.29 (76.8, 84.1)
15 Years 0.000 (0.0, 0.0) 80.85 (76.1, 86.2)
20 Years I 1.571 0.000 (0.0,0.0)1 65.30 (59.7,72.0)
Guarantee 75% of Total Annual Premiums
99% Confidence Reserve Interval
Term
Table 4: $100 per annum premium, 2% annual management fee
Expected Cost
95% Confidence Reserve Interval

3.1 Lognormal returns
For the single premium contracts it is straightforward to calculate the equivalent figures using the independent lognormal assumption. This gives an interesting comparison with the Wilkie model, and illustrates the extent to which the results depend on the particular investment model.
Let the annual management charge be denoted m , and let A ( n ) denote the random acu- mulation factor over n years; we assume that (1 + it) are independent and lognormally distributed with parameters p and u2, so that A ( n ) is also lognormally distributed, with parameters n p and nu2, and A ( n ) ( l - m)" is lognormally distributed, with parameters n ( p + ln(1- m)) and nu2. For the 100% guarantee, for example, we set the initial reserve Vo such that
where P is the single premium and p is the reserving standard (0.95 or 0.99). This gives a reserve per $100 single premium of
% = max (0,100 (1 - e-Zpfi"+5" ( 1 - m)") e-.06")
where @(z,) = p.
The expected cost of the guarantee is (for a guarantee of g), discounting a t the risk free force of interest of 6%:
The expected cost and reserves calculated using the lognormal assumption for stock re- turns are given in Table 5 below. The reserve figures and expected costs correspond closely to the Wilkie simulated figures for both the 100% and the 75% guarantee.

Guarantee 100% of the single premium
Guarantee 75% of the single premium
Table 5: $100 single premium, lognormal model
4 Reserving Principles
4.1 The Initial Reserve
The reserves in Section 3 are calculated to be the amounts required at the inception of the contract in order to maintain a sufficiently high probability that the reserves a t maturity exceed the cost of the guarantee. The initial reserve was calculated such that , when interest a t the risk-free rate is added for the period from inception to maturity, the amount is sufficient to meet the guarantee cost with the given probability. -
However, it is not necessary to provide all the reserve funding a t the inception of the contract, either for the annual or the single premium contract, provided that regular management charges are collected, from which some contribution to the reserves can be deducted.
One approach to the establishment of reserves is to fund an initial reserve, oV, such that

together with the subsequent management charges, all compounded a t the assumed risk- free force of interest, the amount available at maturity is equal to the required maturity reserve, ,V, say, for an n-year contract.
Typically, the management charge may be, say 1% of the accumulated fund a t the start of each year. This means that the amount, and therefore the amount available for reserves, is a random variable. Let Mt be the management charge a t time t .
Then if reserves are established in advance at the policy anniversaries, and assuming for simplicity that (if necessary) the whole of the management charge is availablr for thr reserves, then the non-fund income and outgo of, for example, a 5 year single pre~niuni contract with premium $100, guarantee g, and 1% management charge is given in Table 6.
Table 6: Non-fund income and outgo for 5-year single premium contract
Time t 0 1 2 3 4 5
It is necessary for prudent management to maintain a low probability that additional funds will be required to fund the reserves during the term of the contract. In terms of this table, that means that it is prudent to maintain a low probability that the profit available in any year is negative. Indeed, that is exactly the principle that we have adopted in calculating the reserve a t maturity, s V , which is calculated such that
In the example of Table 1, using a 5-year term and a 100% guarantee, the time 5 reserve was estimated to be 17.942. eS6 = 24.219. The figure of 17.942 assumes that the entire reserve is established at the inception of the policy; here we are considering a possible alternative.
Income
M o = l MI +o V e 6 M2 +I V e 6 M3 +z V e 6 M4 +3 V e 6 4 ~ e 6 =S V
A reserve of 24.219 a t time 5 corresponds to a reserve a t time 4 of 4V = 22.809 (man- agement charges are assumed to be payable in advance; there is no income available after the charge a t time 4).
Outgo
ov 1 v 2V 3 v 4v
max(g- Fund, 0)
Profit
1-OV MI +O V e : I V M ~ + I V ~ -2V M3 +2 v e6 -3 V M4 +3 v e6 -4 V
sV- max(g- Fund, 0)
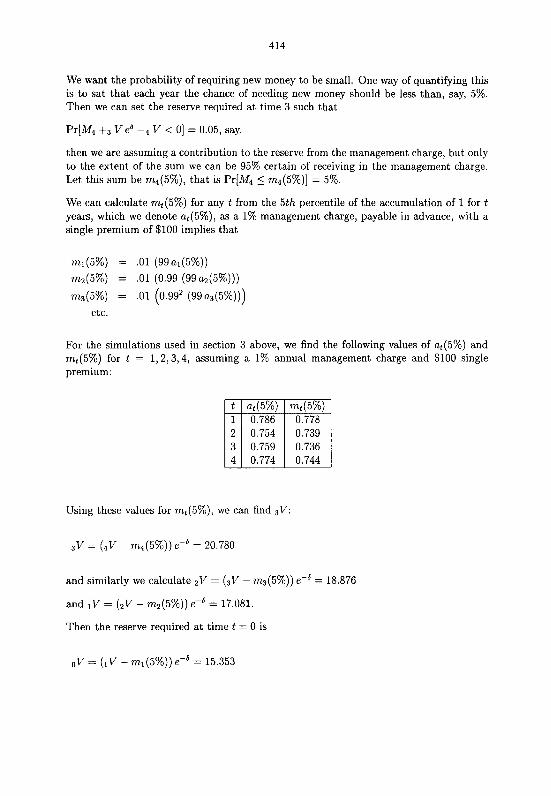
We want the probability of requiring new money to be small. One way of quantifying this is to sat that each year the chance of needing new money should be less than, say, 5%. Then we can set the reserve required a t time 3 such that
Pr[M4 +a V eL4 V < 01 = 0.05, say.
then we are assuming a contribution to the reserve from the management charge, but only to the extent of the sum we can be 95% certain of receiving in the management charge. Let this sum be m4(5%), that is Pr[M4 5 m 4 ( 5 % ) ] = 5%.
We can calculate mt(5%) for any t from the 5th percentile of the accumulation of 1 for t years, which we denote at(5%), as a 1% management charge, payable in advance, with a single premium of $100 implies that
m1(5%) = .O1 (99al (5%))
m2(5%) = .O1 (0.99 (99a2(5%)))
m3(5%) = .O1 (0.99' (99a3(5%)))
etc.
For the simulations used in section 3 above, we find the following values of ~ ~ ( 5 % ) and mt(5%) for t = 1 , 2 , 3 , 4 , assuming a 1% annual management charge and $100 single premium:
Using these values for mt(5%) , we can find SV:
and similarly we calculate 2V = (aV - m 3 ( 5 % ) ) e-* = 18.876
and 1V = (2V - m 2 ( 5 % ) ) e-* = 17.081.
Then the reserve required a t time t = 0 is

I 1% Management Charge I 2% Management Charge Term I No MC I Full MC I No MC I Full MC
I contribution I contribution I contribution I contribution 5 1
Years
I years I 0.000 1 0.000 1 5.103 1 0.000 1
I
years 1 7.906 1 2.705
Table 7: $100 single premium, 95% reserves, allowing for contribution from management charge.
10 1 17.942
So, using the simulated stock returns t o calculate the (approximate) values of mt(5%) gives for the 5 year single premium contract an initial reserve requirement of oV = 15.353 allowing for the contribution from the management charges, compared with the original figure of 17.942 when we assumed no further contribution after the inception of the policy.
15 1 12.441
In general, for an n-year single premium contract, the reserve required at the inception of the contract, given a final reserve requirement of .V, and allowing for the 5th percentile management charge, is:
15.353
2.518
The first term here (,V e-n6) is just the reserve calculated in Section 3, denoted there Vo. The calculation does not include the first management charge which is available to offset the initial capital requirement.
The results for 95% reserves for the single premium contracts are given in Table 7, where the contribution from the management charge is allowed a t the 5th percentile for each year. The figures in the 2nd and fourth columns are taken from Table 1 and Table 2 in Section 3.
20.721
Even allowing only for the 5th percentile of the future management charge has a significant effect on the initial funding required. The extra costs associated with the guarantee when the annual charge is 2% are eliminated when the charges contribute. Clearly, the effect on reserves is more marked for the longer contracts.
15.669
Annual premium contracts may be dealt with in the same way. The equation above for the initial reserve, oV, is the same for annual premium contracts, except that the calculation of the management charge differs.

Years 83.82 73.83 92.39 72.58
Years 105.5 74.23 129.5 68.21
Years 73.79 15.65 116.9
Term
Table 8: $100pa annual premium, 95% reserves, allowing for contribution from manage- ment charge.
The fund a t time t of an n-year annual premium contract, before the deduction of the management charge then due, is, for a $100 premium:
where a,,t is the accumulation factor from time r to time t ; the management charge received a t t is m.Ft, and we are interested in the 5th percentile of this variable at each year end. The management charge percentiles have been found by simulation.
1% Management Charge
It is simple to adapt these principles to allow for the contribution of the management charge to reserves after allowing for other calls on the charge, for example the risk premium for mortality guarantees.
No MC contribution
2% Management Charge
4.2 Reserves For In-Force Contracts
Full MC contribution
NoMC contribution
Just as, for traditional insurance contracts, the actual reserves held for the in-force con- tracts would allow for the actual experienced rates of mortality, lapse, etc, so for the guarantee reserves the amount held for a contract should allow for the actual investment experience, and the consequent changing probability of the severity of the guarantee cost.
FullMC contribution
One way to do this would be a t to allow a t each successive duration for the same pre- determined acceptable probabilities of requiring new money a t maturity (and a t earlier reserving dates if allowance is made for contribution from the management charge).
For example, suppose a $100 single premium contract with a 15 year term has been in force for 10 years. The annual management charge is 0% and the guarantee level is 100% of the initial premium. The reserve standard is 95%, that is the insurer maintains reserves such that the probability that the reserve exceeds the guarantee cost a t maturity is 95%.

Suppose also that the current fund value is $120. Then the reserve required is such that
where A(5) is the (random) accumulation factor for the fund from the valuation date to the maturity date. We assume for simplicity here that this is independent of the past returns on the policy.
The estimate by simulation of the 5th percentile of A(5) is a5(5%) = 0.797. Thus
In fact if the fund exceeds 125.5 at time 10, then no reserve is required at the 95% standard. Also, even if the fund is less than 125.5, in practice there would ba a mangement charge, and allowing for subsequent management charge contributions (at 5th percentile values, say) would eliminate the reserve requirement a t time 10.
In practice the percentiles of the A(t) distributions would depend on current conditions; we have assumed neutral starting conditions.
4.3 Profit Testing
The implication of re-assessing each year the reserve necessary for maintaining a suitably high probability of meeting any claim under the guarantee is that on average reserves will be released back to the company gradually over the term of a contract. One useful exercise is to estimate the expected value of the profit emerging each year from a given contract, considering only the non-segregated fund income and outgo. Non-fund income from the policyholder comes from the expense or management charges and surrender charges, if any. Non-fund outgo to the policyholder arises from guarantee costs on death or maturity. In addition there are costs arising from the reserve requirements.

- Time
t -
0
1
2
3
4
5 -
E[Management Charge]
1.00
E[Reserve brought forward]
0.00
E[Reserve carried forward]
15.35
12.79
8.93
3.10
0.00
0.00
Table 9: Profit Test of Expected Values, 5 year, $100 single premium, 100% guaranteed, 1% pp.. management charge.
Consider the 5-year single premium contract, with guarantee of 100% of premium before charges, premium $100 and annual charges of 1% of the fund, payable in advance. In Section 4.1 above we calculated an initial reserve requirement of $15.35. A profit tes t of expected values will show what the pattern of capital requirements would be for a policy which earns the mean rates of return each year, and re-calculates reserves a t the start of each year to maintain a 95% probability of meeting the guarantee costs.
In the calculations above, the average return each year is approximately 10%. Assume for simplicity that returns in successive years are independent, and using the values of ~ ~ ( 5 % ) already calculated, we get the profit test based on expected values in Table 9.
The reserves in Table 9 are calculated using the method described in Section 4.2 above, except that we have allowed at each duration for a contribution to the reserves from sub- sequent management charges, a t the 5th percentile. That is, the reserve carried forward a t t, given a fund value of Ft a t t , is tV where:
The profit test shows how reserves may be released back to the company, under 'average' conditions - but it is important to remember that this is an average over different years, not over policies.
Other profit tests may be run using more pessimistic assumptions; also, it is easy to adapt the profit test to allow for mortality and surrenders.

4.4 Equalization Reserves
In the reserving for traditional actuarial contracts, we normally allow a t the outset for the income and outgo at their expected values. That is considered a reasonable approach for traditional contracts as the risks from mortality are independent over the different contracts. The investment risks here are not independent; the best way of diversifying to reduce the investment risk for the guarantees is to maintain a portfolio which is diversified by term to maturity.
If many contracts mature a t the same time, the risk of a major loss to the insurer is substantial. This loss is balanced by expected profits from management charges in years when the guarantee cost is zero or very small. This kind of aggregated risk could be covered by a 'catastrophe' or 'equalization' reserve, which would not be allocated a t an individual policy level, but could be determined by a multiple cohort simulation study.
The multiple cohort approach is suggested in the excellent paper by the Maturity Guar- antees Working Party (MGWP)of the Institute and Faculty of Actuaries (MGWP, 1980). In their study the working party considered a hypothetical portfolio of policies, and esti- mated the reserves required as a proportion of the total funds guaranteed. The working party used the simulation approach, and used a very similar probabilistic approach to reserves as described in this section. However they did not calculate individual policy reserves, and they did not consider any contribution to reserves from the annual charges on the policy.
The approach of the MGWP to choosing an appropriate level for the reserving standard was more flexible than the approach described above. The initial reserving standard was chosen a t 99% (with no allowance for surrenders, this was thought to be close to the desired standard of 99.9%), but once reserves were established, they were added to if the probability of meeting the guarantees fell below 98%, and were released if the probability of meeting the guarantees rose above 99.9%.
5 Comparison with option pricing approach
The cost of the guarantee from an option pricing approach depends on whether the insurer writing the segregated fund contract chooses to follow a dynamic hedging strategy itself, or to purchase the put option in the market.
Internal hedging may be difficult, as there are statutory restrictions on the investment of the fund - for example, it may be difficult to short the assets of the segregated fund.
Purchasing the option on the market may be rather costly; the terms involved are rela- tively long. This adds risk for the option seller, who will charge both for this risk and for their profit. The option price paid to the seller is lost; if the insurer chooses to reserve
using the simulation techniques described above, the reserves will generally be released back to the insurer over the term of the contract, and will only rarely be required to meet the guarantee cost.
Further discussion of these issues, together with some examples of the hedging techniques and costs involved are given in Boyle and Hardy(1996).
References
Bacinello A.R. and F. Ortu (1993). Pricing Equity-Linked Life Insurance with Endoge- nous Minimum Guarantees, Insurance Mathematics and Economics 12 245-257.
Boyle P. P. (1994). Options and the Management of Financial Risk, Society of Actuaries, 475 Martingale Road, Suite 800, Schaumburg, Illinois USA.
Boyle P.P. and Hardy M.R. (1996). Reserving for Maturity Guarantees. Institute for Insurance and Pensions Research 96-, University of Waterloo.
Boyle P. P. and E. S. Schwartz (1977). Equilibrium Prices of Guarantees under Equity- Linked Contracts, Journal of Risk and Insurance, 44 , 4, 639-660.
Boyle P. P. and Emanuel D. (1980). Discretely Adjusted Option Hedges, Journal of Financial Economics, 8, 259-282.
Brennan M. J. and E. S. Schwartz (1976). The Pricing of Equity-Linked Life Insurance Policies with an Asset Value Guarantee, Journal of Financial Economics, 3, 195-213.
Brennan M. J., and E. S. Schwartz (1979). Pricing and Investment Strategies for Guar- anteed Equity-Linked Life Insurance, Monograph no 7, The S.S. Huebner Foundation for Insurance Education, Wharton School, University of Pennsylvania, Philadelphia,PA.
Canadian Institute of Actuaries (CIA) (1996).Report on Canadian Economic Statistics, 1924-1995, Canadian Institute of Actuaries.
Henrotte, P. (1993). Transactions Cost and Duplication Strategies, Working Paper, Grad- uate School of Business, Stanford University, Stanford,CA.
Maturity Guarantees Working Party (MGWP) (1980). Journal of the Institute of Actu- aries, 107, 103-209.
Wilkie A. D.(1986). A Stochastic Investment Model for Actuarial Use, Transactions of the Faculty of Actuaries, 39, 341-381.
Wilkie A. D.(1995) More on a Stochastic Asset Model for Actuarial Use, British Actuarial Journal, 1, V,777-964.