research report - healtheffects.org · synopsis of research report 126 statement this statement,...
TRANSCRIPT
Charlestown Navy Yard
120 Second Avenue
Boston MA 02129-4533 USA
+1-617-886-9330
www.healtheffects.org
R E S E A R C HR E P O R T
H E A L T HE F F E CTSINSTITUTE
Janu
ary 2004
R E S E A R C H R E P O R T
H E A L T HE F F E CTSINSTITUTE
Includes a Commentary by the Institute’s Health Review Committee
Number 126
December 2004
Decem
ber 2004
Number 126December 2004
Effects of Exposure to Ultrafine Carbon Particles in Healthy Subjects and Subjects with AsthmaMark W Frampton, Mark J Utell, Wojciech Zareba, Günter Oberdörster, Christopher Cox, Li-Shan Huang, Paul E Morrow, F Eun-Hyung Lee, David Chalupa, Lauren M Frasier, Donna M Speers, and Judith Stewart
Departments of Medicine, Environmental Medicine, and Biostatistics, University of Rochester School of Medicine, Rochester, New York; Division of Epidemiology, Statistics and Prevention, National Institute of Child Health and Human Development, National Institutes of Health, Bethesda, Maryland
Ultrafin
e Carb
on
Particles in
Health
y and
Asth
matic Su
bjects
REPO
RT 126

H E A L T HE F F E C T SINSTITUTE
The Health Effects Institute was chartered in 1980 as an
independent and unbiased research organization to provide
high quality, impartial, and relevant science on the health
effects of emissions from motor vehicles, fuels, and other
environmental sources. All results are provided to industry
and government sponsors, other key decisionmakers, the
scientific community, and the public. HEI funds research
on all major pollutants, including air toxics, diesel exhaust,
nitrogen oxides, ozone, and particulate matter. The Institute
periodically engages in special review and evaluation of key
questions in science that are highly relevant to the regulatory
process. To date, HEI has supported more than 220 projects
at institutions in North America, Europe, and Asia and has
published over 160 Research Reports and Special Reports.
Typically, HEI receives half of its core funds from the
US Environmental Protection Agency and half from 28
worldwide manufacturers and marketers of motor vehicles
and engines who do business in the United States. Other
public and private organizations periodically support special
projects or certain research programs. Regardless of funding
sources, HEI exercises complete autonomy in setting its
research priorities and in reaching its conclusions.
An independent Board of Directors governs HEI. The
Institute’s Health Research Committee develops HEI’s five-
year Strategic Plan and initiates and oversees HEI-funded
research. The Health Review Committee independently
reviews all HEI research and provides a Commentary
on the work’s scientific quality and regulatory relevance.
Both Committees draw distinguished scientists who
are independent of sponsors and bring wide-ranging
multidisciplinary expertise.
The results of each project and its Commentary are
communicated widely through HEI’s home page, Annual
Conference, publications, and presentations to professional
societies, legislative bodies, and public agencies.
OFFICERS & STAFFDaniel S Greenbaum President
Robert M O’Keefe Vice President
Jane Warren Director of Science
Sally Edwards Director of Publications
Jacqueline C Rutledge Director of Finance and Administration
Deneen Howell Corporate Secretary
Cristina I Cann Staff Scientist
Aaron J Cohen Principal Scientist
Maria G Costantini Principal Scientist
Wei Huang Staff Scientist
Debra A Kaden Principal Scientist
Sumi Mehta Staff Scientist
Geoffrey H Sunshine Senior Scientist
Annemoon MM van Erp Staff Scientist
Terésa Fasulo Science Administration Manager
L Virgi Hepner Senior Science Editor
Jenny Lamont Science Editor
Francine Marmenout Senior Executive Assistant
Teresina McGuire Accounting Assistant
Kasey L Oliver Administrative Assistant
Robert A Shavers Operations Manager
Mark J Utell ChairProfessor of Medicine and Environmental Medicine, University of Rochester
Melvyn C BranchJoseph Negler Professor of Engineering, Mechanical Engineering Department, University of Colorado
Kenneth L DemerjianProfessor and Director, Atmospheric Sciences Research Center, Universityat Albany, State University of New York
Peter B FarmerProfessor and Section Head, Medical Research Council Toxicology Unit,University of Leicester
Helmut GreimProfessor, Institute of Toxicology and Environmental Hygiene, Technical University of Munich
Rogene HendersonSenior Scientist Emeritus, Lovelace Respiratory Research Institute
Stephen I RennardLarson Professor, Department of Internal Medicine, University of Nebraska Medical Center
Howard RocketteProfessor and Chair, Department of Biostatistics, Graduate School of Public Health, University of Pittsburgh
Jonathan M SametProfessor and Chairman, Department of Epidemiology, Bloomberg School of Public Health, Johns Hopkins University
Ira TagerProfessor of Epidemiology, School of Public Health, University of California, Berkeley
HEALTH RESEARCH COMMITTEE
BOARD OF DIRECTORSRichard F Celeste ChairPresident, Colorado College
Purnell W ChoppinPresident Emeritus, Howard Hughes Medical Institute
Jared L CohonPresident, Carnegie Mellon University
Alice HuangSenior Councilor for External Relations, California Institute of Technology
Gowher RizviDirector, Ash Institute for Democratic Governance and Innovations, Harvard University
Richard B StewartUniversity Professor, New York University School of Law, and Director, New York University Center on Environmental and Land Use Law
Robert M WhitePresident (Emeritus), National Academy of Engineering, and Senior Fellow, University Corporation for Atmospheric Research
Archibald Cox Founding Chair, 1980-2001
Donald Kennedy Vice Chair EmeritusEditor-in-Chief, Science; President (Emeritus) and Bing Professor of Biological Sciences, Stanford University
HEALTH REVIEW COMMITTEEDaniel C Tosteson ChairProfessor of Cell Biology, Dean Emeritus, Harvard Medical School
Ross AndersonProfessor and Head, Department of Public Health Sciences, St George’s Hospital Medical School, London University
John R HoidalProfessor of Medicine and Chief of Pulmonary/Critical Medicine, University of Utah
Thomas W KenslerProfessor, Division of Toxicological Sciences, Department of Environmental Sciences, Johns Hopkins University
Brian LeadererProfessor, Department of Epidemiology and Public Health, Yale University School of Medicine
Thomas A LouisProfessor, Department of Biostatistics, Bloomberg School of Public Health, Johns Hopkins University
Edo D PellizzariVice President for Analytical and Chemical Sciences, Research Triangle Institute
Nancy ReidProfessor and Chair, Department of Statistics, University of Toronto
William N RomProfessor of Medicine and Environmental Medicine and Chief of Pulmonary and Critical Care Medicine, New York University Medical Center
Sverre VedalProfessor, Department of Environmental and Occupational Health Sciences, University of Washington

Synopsis of Research Report 126S T A T E M E N T
This Statement, prepared by the Health Effects Institute, summarizes a research project funded by HEI and conducted by Dr Mark WFrampton at the University of Rochester, Rochester NY. The following Research Report contains both the detailed Investigators’ Report and aCommentary on the study prepared by the Institute’s Health Review Committee.
Effects of Controlled Exposure to Ultrafine Carbon Particles in Healthy and Asthmatic People
Ambient particles are a complex mixture whosesize, chemical composition, and other physical andbiological properties vary with location and time.Regardless of the characteristics at a single site,however, epidemiologic studies have reported thatshort-term increases in low levels of particles areassociated with short-term increases in illness anddeath. Remaining questions about the health effectsof particles include the specific characteristics ofparticles—especially size and chemical composi-tion—and the biological mechanisms that mayexplain the reported associations.
To address some of these critical issues, HealthEffects Institute issued Request for Applications(RFA) 98-1, "Characterization of Exposure to andHealth Effects of Particulate Matter” in 1998. Acomponent of the RFA was to promote evaluationof health effects of controlled exposure to particlesin animals and healthy people as well as in thosewho might be more susceptible to particle expo-sure. People with asthma are one of the groups con-sidered particularly susceptible to the effects ofairborne particles.
HEI funded two studies to address this issue inhuman volunteers who were either healthy or hadmild asthma. One was the current study, led by DrMark Frampton, University of Rochester School ofMedicine and Dentistry, Rochester, New York, toevaluate the effects of inhalation exposure toultrafine (<0.1 µm diameter) carbon particles,which some scientists believe are more effectivethan larger particles in causing health effects (theultrafine hypothesis of particle toxicity). Thesecond study, led by Dr Henry Gong of Los AmigosResearch and Education Institute, Downey, Cali-fornia, investigated the effects of exposure to fine(0.1–2.5 µm in diameter) concentrated ambient par-ticles (CAPs) derived from the Los Angeles area.
As one of the consequences of an HEI-sponsoredworkshop held before the studies began, Frampton
and Gong developed exposure and study protocolsthat were similar to those being used in CAPsstudies underway at the US Environmental Protec-tion Agency research facility in Chapel Hill, NorthCarolina. In this way, results of the studies couldmore easily be compared with each other. HEI pub-lished the results of the Gong study in 2003.
APPROACH
Healthy and mildly asthmatic men and womenwere exposed via a mouthpiece over 2 hours to lab-oratory-generated ultrafine carbon particles(average diameter approximately 0.025 µm) and ona different occasion to filtered air as follows:
• 12 healthy participants were exposed at rest to 10 µg/m3 particles or air;
• 12 healthy participants were exposed to parti-cles (10 and 25 µg/m3) or air during intermit-tent exercise on a stationary bicycle (15-minutecycles of rest and exercise over 2 hours); and
• 16 asthmatic volunteers were exposed to either 10 µg/m3 particles or air using the same inter-mittent exercise protocol used for the healthy exercising volunteers.
Frampton and colleagues hypothesized thatultrafine particle exposure would activate leukocytes(white blood cells) and endothelial cells (cells liningblood vessels to form part of the interface betweenblood and tissue cells) and lead to an inflammatoryresponse in the airways and in the blood. The investi-gators further hypothesized that effects would begreater in people with asthma than in healthy people.Their proposed study also anticipated that particleexposure might affect respiration and cardiac electro-physiologic function. The investigators therefore mea-sured multiple indices of pulmonary and cardiacfunction as well as blood parameters at different timesbefore, during, and up to 21 hours (45 hours for asth-matics) after exposure to particles or filtered air. To

Research Report 126
© 2004 Health Effects Institute, Boston MA USA. Cameographics, Union ME, Compositor. Printed at Capital City Press, Montpelier VT.Library of Congress Catalog Number for the HEI Report Series: WA 754 R432.The paper in this publication meets the minimum standard requirements of the ANSI Standard Z39.48-1984 (Permanence of Paper) effectivewith Report 21 in December 1988; and effective with Report 92 in 1999 the paper is recycled from at least 30% postconsumer waste withReports 25, 26, 32, 51, 65 Parts IV, VIII, and IX, 91, 105, and 117 excepted. These excepted Reports are printed on acid-free coated paper.
measure inflammatory responses in the airways,Frampton and colleagues collected sputum at screeningand 22 hours after exposure. In addition, they calculatedthe number and mass of inhaled particles that depositedin the lungs of asthmatic and healthy participants.
RESULTS AND INTERPRETATION
Healthy resting people had no detectable changes inairway, systemic, or cardiac electrophysiologic end-points at any time measured during or after inhalationexposure to 10 µg/m3 particles. In exercising healthyand asthmatic participants, Frampton and colleaguesdid not detect changes in any airway inflammatoryendpoint during or after exposure to 10 or 25 µg/m3
particles. These findings are noteworthy in the light ofthe investigators’ novel finding that, at the sameinhaled concentration of particles, about 50% moreparticles deposited in lungs of asthmatic people thanin healthy people. In addition, these researchers calcu-lated that over 4 times as many particles were depos-ited in the lungs of exercising participants as in thelungs of resting participants. Thus, even though thedose of particles delivered to the lungs of exercisingasthmatic people may have been approximately 6times the dose delivered to the lungs of resting healthypeople, ultrafine particles had no effects on the air-ways. Further, the concentration of particles of the sizeused in this study was 10 to 100 times higher thanaverage concentrations of ultrafine particles reportedin urban air.
Some systemic and cardiovascular changes wereassociated with particle exposure in healthy and asth-matic exercising volunteers. The pattern and magni-tude of these changes were similar in the two groups,differing from the investigators’ prediction of greaterresponses in the asthmatic participants.
Exposure to ultrafine particles was associated withchanges in numbers of certain leukocytes in the bloodof healthy and asthmatic exercising volunteers. Thenumbers of some types of leukocytes decreased butthe total number of leukocytes did not change.Expression of some adhesion molecules on the sur-face of leukocytes, a characteristic of cell activation,was also changed. The significance of these observa-tions is not clear. The investigators speculate thatexposure to particles mildly constricts pulmonaryblood vessels, activating vascular endothelial cells
and preventing outflow of activated leukocytes fromthe lungs into the circulation. An alternative possi-bility to explain the findings is that the particles areselectively toxic to activated cells. In addition, as theinvestigators appropriately note, the changes detectedmay also have been chance findings that can occur atrandom and are more likely to be seen when evalu-ating multiple endpoints.
The investigators also found small changes in car-diac repolarization, the time taken between the elec-trical stimuli governing contraction and relaxation ofthe heart. Again, the biological or clinical significanceof these small changes in healthy and asthmatic indi-viduals is unclear.
CONCLUSIONS
This innovative and technically complex study usedstate-of-the-art measurements to assess responses toinhaled ultrafine particles in healthy and asthmaticvolunteers. The particles were generated in a labora-tory and did not contain toxicologically importantcomponents such as metals and organic compounds,but they were relevant to real world exposures becausecarbon is a major component of airborne particles fromurban settings. The concentration of ultrafine particlesused, however, was 10 to 100 times higher than theaverage concentrations reported in urban air.
Frampton and colleagues found few airway, sys-temic, or cardiac electrophysiologic changes associ-ated with ultrafine particle exposure. The clinicalsignificance of any of the changes is not clear. Thus,in this limited set of healthy and mildly asthmaticparticipants, the effects of exposure to ultrafinecarbon particles did not support the hypothesis thatultrafine particles are more toxic than larger compo-nents of the particle mix. This paucity of effects isconsistent with the results of studies conducted inNorth America with human exposures to concen-trated fine particles.
Future controlled exposures should include parti-cles of different sizes and composition, different sus-cept ib le popula t ions ( such as those wi thcardiovascular disease), a larger number of partici-pants, longer exposure durations and higher concen-trations; and different endpoints to increase thestatistical and scientific strength and thus provide astronger test of the ultrafine hypothesis.

CONTENTSResearch Report 126
Effects of Exposure to Ultrafine Carbon Particles in Healthy Subjects and Subjects with AsthmaMark W Frampton, Mark J Utell, Wojciech Zareba, Günter Oberdörster, Christopher Cox, Li-Shan Huang, Paul E Morrow, F Eun-Hyung Lee, David Chalupa, Lauren M Frasier, Donna M Speers, and Judith Stewart
Departments of Medicine, Environmental Medicine, and Biostatistics, University of Rochester School of Medicine, Rochester, New York; Division of Epidemiology, Statistics and Prevention, National Institute of Child Health and Human Development, National Institutes of Health, Bethesda, Maryland
HEI STATEMENT This Statement is a nontechnical summary of the Investigators’ Report and the Health Review Committee’s Commentary.
INVESTIGATORS’ REPORTWhen an HEI-funded study is completed, the investigators submit a final report. The Investigators’ Report is first examined by three ouside technical reviewers and a biostatistician. The report and the reviewers’ comments are then evaluated by members of the HEI Health Review Committee, who had no role in selecting or managing the project. During the review process, the investigators have an opportunity to exchange comments with the Review Committee and, if necessary, revise the report.
Abstract . . . . . . . . . . . . . . . . . . . . . . . . . . . . . . . . . . . . . . 1Introduction. . . . . . . . . . . . . . . . . . . . . . . . . . . . . . . . . . 2
Setting Air Quality Standards . . . . . . . . . . . . . . . . . 2Effects on Cardiovascular System . . . . . . . . . . . . . 3Contributing Effect of Asthma . . . . . . . . . . . . . . . . 3
Specific Aims . . . . . . . . . . . . . . . . . . . . . . . . . . . . . . . . . 4Methods and Study Design . . . . . . . . . . . . . . . . . . . . . 4
Subject Criteria . . . . . . . . . . . . . . . . . . . . . . . . . . . . . 4Study Design . . . . . . . . . . . . . . . . . . . . . . . . . . . . . . . 5
Exposure Groups . . . . . . . . . . . . . . . . . . . . . . . . . 5Screening Visit . . . . . . . . . . . . . . . . . . . . . . . . . . . 5Exposure Visits . . . . . . . . . . . . . . . . . . . . . . . . . . . 5
Exposure System. . . . . . . . . . . . . . . . . . . . . . . . . . . . 6Particle Deposition. . . . . . . . . . . . . . . . . . . . . . . . . . 8Pulmonary Function . . . . . . . . . . . . . . . . . . . . . . . . 8Airway Nitric Oxide . . . . . . . . . . . . . . . . . . . . . . . . . 8Blood Markers of Coagulation
and Inflammation . . . . . . . . . . . . . . . . . . . . . . . . . 9Immunofluorescence Analysis . . . . . . . . . . . . . . . 9Lymphocyte Cytokine Profile . . . . . . . . . . . . . . . . 10Sputum Induction . . . . . . . . . . . . . . . . . . . . . . . . . 11Cardiac Monitoring . . . . . . . . . . . . . . . . . . . . . . . . 11ECG Analyses. . . . . . . . . . . . . . . . . . . . . . . . . . . . . . 11Data Handling and Statistical Methods . . . . . . . 12 UPREST and UPASTHMA. . . . . . . . . . . . . . . . . 12
UPDOSE . . . . . . . . . . . . . . . . . . . . . . . . . . . . . . . 12Results . . . . . . . . . . . . . . . . . . . . . . . . . . . . . . . . . . . . . . 13
Particle Composition . . . . . . . . . . . . . . . . . . . . . . . 13Subject Characteristics . . . . . . . . . . . . . . . . . . . . . 13Particle Deposition. . . . . . . . . . . . . . . . . . . . . . . . . 13Respiratory Symptoms and
Pulmonary Function . . . . . . . . . . . . . . . . . . . . . . 16Vital Signs and Oxygen Saturation . . . . . . . . . . . 17Markers of Local Airway Inflammation . . . . . . . 17Markers of Systemic Inflammation . . . . . . . . . . 19Blood Leukocytes . . . . . . . . . . . . . . . . . . . . . . . . . . 20Lymphocyte Subsets and Activation . . . . . . . . . 22Lymphocyte Cytokine Profile. . . . . . . . . . . . . . . . 23Blood Leukocyte Expression of Adhesion
Molecules and Fc Receptors . . . . . . . . . . . . . . . 23Markers of Blood Coagulation . . . . . . . . . . . . . . . 27Cardiac Monitoring . . . . . . . . . . . . . . . . . . . . . . . . 27
UPREST . . . . . . . . . . . . . . . . . . . . . . . . . . . . . . . . 27UPDOSE. . . . . . . . . . . . . . . . . . . . . . . . . . . . . . . . 30UPASTHMA . . . . . . . . . . . . . . . . . . . . . . . . . . . . . 32
Discussion . . . . . . . . . . . . . . . . . . . . . . . . . . . . . . . . . . 34UFP Deposition . . . . . . . . . . . . . . . . . . . . . . . . . . . 34Blood Leukocyte Effects . . . . . . . . . . . . . . . . . . . . 34Cardiac Effects. . . . . . . . . . . . . . . . . . . . . . . . . . . . . 36Gender Differences . . . . . . . . . . . . . . . . . . . . . . . . 37
Continued

Research Report 126
Comparisons with Other Human Studies of PM . . . . . . . . . . . . . . . . . . . . . . . . . . . . 37
References . . . . . . . . . . . . . . . . . . . . . . . . . . . . . . . . . . 39Appendix A. HEI Quality Assurance
Audit Statement . . . . . . . . . . . . . . . . . . . . . . . . . . . . 45
About the Authors . . . . . . . . . . . . . . . . . . . . . . . . . . . 45 Other Publications Resulting from
This Research . . . . . . . . . . . . . . . . . . . . . . . . . . . . . . 46Abbreviations and Other Terms . . . . . . . . . . . . . . . 47
COMMENTARY Health Review CommitteeThe Commentary about the Investigators’ Report is prepared by the HEI Health Review Committee and staff. Its purpose is to place the study into a broader scientific context, to point out its strengths and limitations, and to discuss remaining uncertainties and implications of the findings for public health.
Scientific Background . . . . . . . . . . . . . . . . . . . . . . . . 50PM and Cardiovascular Responses. . . . . . . . . . . 50Toxicity of Ultrafine Particles. . . . . . . . . . . . . . . . 50
Objectives. . . . . . . . . . . . . . . . . . . . . . . . . . . . . . . . . . . 52Study Design . . . . . . . . . . . . . . . . . . . . . . . . . . . . . . . . 52
Exposure Protocols . . . . . . . . . . . . . . . . . . . . . . . . 52Particle Generation and Exposure System . . . . 53Particle Deposition . . . . . . . . . . . . . . . . . . . . . . . . 53Measurement of Biological Function. . . . . . . . . 53
Pulmonary Function . . . . . . . . . . . . . . . . . . . . . 53Airway Nitric Oxide . . . . . . . . . . . . . . . . . . . . . . 53Blood Markers of Coagulation,
Inflammation, and the Immune Response. . . . . . . . . . . . . . . . . . . . . .53
Sputum Induction . . . . . . . . . . . . . . . . . . . . . . .54 Cardiac Monitoring . . . . . . . . . . . . . . . . . . . . . . 54
Data Management and Statistical Methods . . . 54
UPREST and UPASTHMA . . . . . . . . . . . . . . . . 54UPDOSE. . . . . . . . . . . . . . . . . . . . . . . . . . . . . . . . 54
Results. . . . . . . . . . . . . . . . . . . . . . . . . . . . . . . . . . . . . . 55Deposition of Ultrafine Particles . . . . . . . . . . . . 55Health Effects Associated with Exposure
to Ultrafine Particles . . . . . . . . . . . . . . . . . . . . . . 55 Airway Inflammation. . . . . . . . . . . . . . . . . . . 55 Systemic Inflammation, Coagulation, and Cardiovascular Measures . . . . . . . . . . . 55
Discussion . . . . . . . . . . . . . . . . . . . . . . . . . . . . . . . . . . 58Particle Deposition . . . . . . . . . . . . . . . . . . . . . . . . 60Comparison with Results of the Gong
Study and Other Controlled Human Exposure Studies . . . . . . . . . . . . . . . . . . . . . . . . . 60
Conclusion. . . . . . . . . . . . . . . . . . . . . . . . . . . . . . . . . . 62Acknowledgments . . . . . . . . . . . . . . . . . . . . . . . . . . . 62References . . . . . . . . . . . . . . . . . . . . . . . . . . . . . . . . . . 62
RELATED HEI PUBLICATIONS
Publishing History: This document was posted as a preprint on www.healtheffects.org and then finalized for print.
Citation for whole document:
Frampton MW, Utell MJ, Zareba W, Oberdörster G, Cox C, Huang LS, Morrow PE, Lee, David Chalupa FEH, Frasier LM, SpeersDM, Stewart J. December 2004. Effects of Exposure to Ultrafine Carbon Particles in Healthy Subjects and Subjects with Asthma.
Research Report 126. Health Effects Institute, Boston MA.
When citing a section of this report, specify it as a chapter of the whole document.

Health Effects Institute Research Report 126 © 2004 1
INVESTIGATORS’ REPORT
Effects of Exposure to Ultrafine Carbon Particles in Healthy Subjectsand Subjects with Asthma
Mark W Frampton, Mark J Utell, Wojciech Zareba, Günter Oberdörster, Christopher Cox, Li-Shan Huang, Paul E Morrow, F Eun-Hyung Lee, David Chalupa, Lauren M Frasier, Donna M Speers, and Judith Stewart
ABSTRACT
Increased levels of particulate air pollution are associ-ated with increased respiratory and cardiovascular mor-tality and morbidity as well as worsening of asthma.Ultrafine particles (UFP*; less than 0.1 µm in aerodynamicdiameter) may contribute to the health effects of particu-late matter (PM) for a number of reasons. Compared withlarger particles on a mass basis, UFP have a higher pre-dicted pulmonary deposition, greater potential to inducepulmonary inflammation, larger surface area, andenhanced oxidant capacity. UFP also have the potential tocross the epithelium and enter the systemic circulation.We hypothesized that exposure to UFP causes airwayinflammation in susceptible humans with activation of cir-culating leukocytes and vascular endothelium, a systemicacute phase response, and transient hypercoagulability.We further hypothesized that in people with asthma, UFPdeposition would be increased and underlying airwayinflammation enhanced. Our objectives were:
• to develop a system for controlled exposures of humans to UFP;
• to measure the pulmonary fractional deposition of UFP;
• to assess the effects of UFP exposure on blood leukocyte and endothelial adhesion molecule expression and acti-vation, on airway nitric oxide (NO) production, on the
systemic acute phase response, on blood coagulability, and on cardiac electrical activity and repolarization; and
• to evaluate these responses in both healthy subjects and people with asthma.
We developed and validated a mouthpiece exposuresystem for human studies of carbon UFP and then con-ducted three clinical exposure studies: healthy subjectsbreathing filtered air and UFP (10 µg/m3) at rest (UPREST);healthy subjects breathing air and UFP (10 and 25 µg/m3)with intermittent exercise (UPDOSE); and subjects withmild asthma breathing air and UFP (10 µg/m3) with inter-mittent exercise (UPASTHMA). All exposures were for 2hours on the mouthpiece system. Exposures were separatedby at least 2 (UPREST and UPDOSE) or 3 (UPASTHMA)weeks. Prior to and at intervals after each exposure, weassessed symptoms, pulmonary function, blood markers ofinflammation and coagulation, and airway NO production.Sputum inflammatory cells were assessed 21 hours afterexposure. Continuous 12-lead electrocardiography (ECG)recordings were analyzed for changes in heart rate vari-ability, repolarization, and arrhythmias.
For healthy subjects, the fractional deposition of UFP atrest was 0.66 ± 0.11 (mean ± SD) by particle number, con-firming the high deposition for UFP predicted by models.Deposition further increased during exercise (0.83 ± 0.04).Asthmatic subjects showed higher UFP deposition thandid healthy subjects when breathing at rest (0.76 ± 0.05).
During the UPREST protocol, there were no convincingeffects for any outcome measures. Breathing 25 µg/m3 UFPwith exercise (UPDOSE) was associated with reductions inblood monocytes and activation of T lymphocytes inhealthy females. In asthmatic subjects (UPASTHMA),breathing 10 µg/m3 UFP was associated with reducednumbers of blood eosinophils and CD4+ T lymphocytes. Inthe UPDOSE group, monocyte expression of intercellularadhesion molecule-1 (ICAM-1) was reduced in a concen-tration-related manner (P = 0.001). In the UPASTHMAgroup, CD11b expression was reduced on monocytes and
*A list of abbreviations and other terms appears at the end of the Investiga-tors’ Report.
This Investigators’ Report is one part of Health Effects Institute ResearchReport 126, which also includes a Commentary by the Health Review Com-mittee and an HEI Statement about the research project. Correspondence con-cerning the Investigators’ Report may be addressed to Dr Mark W Frampton,University of Rochester Medical Center, 601 Elmwood Ave, Box 692, Roch-ester NY 14642-8692, [email protected].
Although this document was produced with partial funding by the UnitedStates Environmental Protection Agency under Assistance AwardR82811201 to the Health Effects Institute, it has not been subjected to theAgency’s peer and administrative review and therefore may not necessarilyreflect the views of the Agency, and no official endorsement by it should beinferred. The contents of this document also have not been reviewed by pri-vate party institutions, including those that support the Health Effects Insti-tute; therefore, it may not reflect the views or policies of these parties, andno endorsement by them should be inferred.

2
Ultrafine Carbon Particles in Healthy and Asthmatic Subjects
eosinophils, and ICAM-1 expression was reduced on poly-morphonuclear leukocytes (PMNs). ECG analyses ofUPDOSE subjects showed transient reductions in parasym-pathetic influence on heart rate variability and a reducedrepolarization (QT) interval. In UPASTHMA subjects, ECGanalyses showed decreased QT variability, but no effect onthe QT interval. There were no significant effects in any ofthe studies on symptoms, pulmonary function, or markersof airway inflammation. We found no increases in solublemarkers of systemic inflammation or coagulation.
Our hypothesis that inhalation of carbon UFP causespulmonary inflammation and an acute phase response wasnot confirmed. However, the observed subtle changes inleukocyte subsets and adhesion molecule expression areconsistent with effects on vascular endothelial function.We also found effects on heart rate variability and on car-diac repolarization in healthy subjects. If confirmed, thefinding that very low mass concentrations of particles havecardiovascular effects would have important implicationsfor future PM regulatory strategies.
INTRODUCTION
A strong and consistent association has been observedbetween ambient particle concentrations and adjustedmortality rates. An increase of 50 µg/m3 in the concentra-tion of PM less than 10 µm in aerodynamic diameter(PM10) is associated with a 3% to 8% increase in the rela-tive risk of death (US Environmental Protection Agency[EPA] 1996). The strongest associations are seen for respi-ratory and cardiac deaths, particularly among the elderly.Associations with increased mortality have been observedat mean PM10 concentrations well below the US NationalAmbient Air Quality Standard (NAAQS) of 150 µg/m3 as a24-hour average (Dockery and Pope 1996; EPA 1996). TheHealth Effects Institute (HEI)–funded National Morbidity,Mortality, and Air Pollution Study confirmed these associ-ations (Samet et al 2000a,b). After a methodologic flaw inthe original analysis was discovered and original estimateswere revised, the study reported an approximately 0.21%increase in total mortality (HEI 2003).
Increased levels of particulate air pollution are also asso-ciated with asthma exacerbations, increased respiratorysymptoms, decreased lung function, increased medicationuse, and increased hospital admissions (EPA 1996). There isalso strong evidence for long-term health consequences ofexposure to PM. Using data collected on 1.2 million adultsin the US from 1982 to 1998, Pope and colleagues (2004)found that a 10 µg/m3 increase in fine PM was associatedwith an 8% to 18% increase in cardiovascular causes of
death. PM-related mortality was chiefly due to ischemicheart disease, dysrhythmias, heart failure, and cardiacarrest.
Because of concerns about the potential public healthimplications of these findings, the EPA promulgated a newstandard for fine particles in 1997. Nevertheless, the mech-anisms by which particulate pollution at such low concen-trations induce health effects remain unclear. Determiningthe biological mechanisms involved was identified in1998 as a high priority research need by the EPA and theUS National Academy of Sciences (National ResearchCouncil). Data from human clinical studies are alsoneeded to determine the link between exposure andresponse in both healthy and susceptible populations(Utell and Drew 1998).
Hypotheses proposed to explain the characteristics ofparticles responsible for the adverse effects of PM havefocused on particle acidity (Chen et al 1992), particle con-tent of transition metals (Pritchard et al 1996), bioaerosols(Rylander and Snella 1983), and UFP (Oberdörster et al1995; Seaton et al 1995). We suggest that ambient UFP arerelevant for several reasons.
• UFP induce pulmonary inflammation at lower mass concentrations than larger particles (Oberdörster et al 1995; Li et al 1999).
• Ambient UFP have a much higher number concentra-tion and surface area than larger particles at the same mass concentration. For example, in order to achieve an airborne concentration of 10 µg/m3, 2.4 � 106 20-nm particles/cm3 are needed; in contrast, only one 2.5-µm particle/cm3 is needed (Oberdörster et al 1995).
• Inhaled UFP have a high deposition efficiency predicted for the pulmonary region. For example, 20nm particles have up to 50% deposition efficiency (International Committee for Radiological Protection [ICRP] 1994).
• UFP have enhanced oxidant capacity when compared on a mass basis with larger particles (Brown et al 2001; Li et al 2003).
• UFP can easily cross the epithelium and reach intersti-tial sites (Stearns et al 1994). In humans, they may even enter the systemic circulation (Nemmar et al 2002).
SETTING AIR QUALITY STANDARDS
Although few studies have measured UFP in ambientair, one panel study of asthmatic subjects (Peters et al1997b) found that peak flow varied more closely with the5-day mean of UFP number than with fine particle massconcentration. This finding suggests that the UFP compo-nent of fine particle pollution contributes to airway effectsin people with asthma. A recent HEI-funded study in

MW Frampton et al
3
Erfurt, Germany, also found associations between ambientUFP and mortality (Wichmann et al 2000).
Determining the health effects of UFP exposure has con-siderable importance in setting appropriate air qualitystandards. The Committee on Research Priorities for Air-borne PM of the US National Research Council has statedthat “Present knowledge…strongly suggests that mass doseis not a sufficient metric for understanding health effects”(National Research Council 1998). Further, more stringentregulation of fine particle mass may, paradoxically,increase the number of ambient UFP, as was found inErfurt, Germany (Ebelt et al 2001). This paradoxicalincrease occurs because reducing the number of particlesin the accumulation mode reduces the agglomeration ofUFP, thereby increasing ambient UFP number, despite anoverall reduction in PM2.5 mass. Human studies of thehealth effects of exposure to UFP are needed to help iden-tify the appropriate dose measure (particle number, sur-face area, or mass) for regulatory purposes.
EFFECTS ON CARDIOVASCULAR SYSTEM
Plausible mechanisms explaining the relation betweenparticle exposure and changes in cardiovascular mortalityhave not been clearly defined (Utell et al 2002). Somestudies have provided evidence that PM exposure has car-diovascular effects and have offered clues as to possiblemechanisms. For example, PM exposure is associated withchanges in heart rate and heart rate variability (Peters et al1999; Pope et al 1999a,b; Gold et al 2000; Creason et al2001); with increased systolic blood pressure (Ibald-Mulliet al 2001); with increased plasma viscosity (Peters et al1997a), C-reactive protein (Peters et al 2001b), and fibrin-ogen (Pekkanen et al 2000); with reductions in hemoglobinconcentration and packed red blood cell (RBC) volume(Seaton et al 1999); with increases in cardiac arrhythmia(Peters et al 2000); and with triggering of acute myocardialinfarction (Peters et al 2001a). Seaton et al (1995) hypothe-sized that airway inflammation induced by UFP triggerscardiovascular events. Inflammation is accompanied by asystemic acute phase response, with increased plasma vis-cosity and increased propensity for blood coagulation,which could induce coronary artery thrombosis in peoplewith atherosclerosis.
A few studies have specifically assessed the cardiovas-cular effects of UFP. In a recent study of patients withstable coronary artery disease (Pekkanen et al 2002), inves-tigators performed repeated exercise tests concurrent withmonitoring of ambient particle mass and number. Signifi-cant independent effects were found for both fine and UFPon the degree of ST segment depression during exercise.
For example, exposure to UFP (0.01 to 0.1 µm) was associ-ated with an increased risk for greater than 0.1 mV of STdepression (odds ratio, 3.14; confidence interval, 1.56–6.32).
We proposed the following sequence of events in whichPM exposure induces airway inflammation and cardiovas-cular effects:
1. Initial PM injury to epithelial cells is caused by the gen-eration of reactive oxygen species. This event is accom-panied by activation of nuclear regulatory factors, whichlead to elaboration of proinflammatory cytokines(including interleukin [IL]-8 and IL-6) and increasedexpression of NO synthase (NOS) and result in increasedNO in exhaled air.
2. These processes activate vascular endothelial and circu-lating PMNs, eosinophils, lymphocytes, and monocytes.Emigration of inflammatory cells from blood to tissueinvolves an increase in adhesion molecules on vascularendothelium (E-selectin, P-selectin, ICAM-1, and vas-cular cell adhesion molecules [VCAM]-1) and on circu-lating leukocytes (L-selectin, leukocyte function antigen-1 [LFA-1], Mac-1 [CD11b/CD18], very late activationantigen [VLA]-4 and ICAM-1) [Lukacs et al 1995]). Theevents in the process of leukocyte-endothelium bindinginclude increased expression followed by shedding ofadhesion molecules, as cells tether and roll. This is fol-lowed by cell activation, stable adhesion, and transmigra-tion through the epithelium (Salmi and Jalkanen 1997).Endothelial activation may further contribute to theincrease in exhaled NO concentrations associated withairway inflammation.
3. Increased release of IL-6 and tissue factor activatesblood mononuclear cells. IL-6 initiates hepatic syn-thesis of acute phase proteins, including C-reactive pro-tein serum amyloid A, and fibrinogen. Monocyte tissuefactor and endothelial cell activation initiate the coagu-lation cascade.
The combined effects of these processes on endothelialfunction, vascular inflammation, cardiac rate control andrepolarization, and blood coagulation may precipitate anacute coronary event or arrhythmia in susceptible individ-uals with critical coronary artery disease.
CONTRIBUTING EFFECT OF ASTHMA
People with asthma are at risk for health effects from air-borne PM, which has been associated with increased emer-gency room visits for asthma in children and adults(Lipsett et al 1997; Tolbert et al 2000; Atkinson et al 2001).Further, PM exposure increases dyspnea and bronchodi-lator use in people with asthma (Hiltermann et al 1998).

4
Ultrafine Carbon Particles in Healthy and Asthmatic Subjects
Asthma is a disease characterized by airway inflamma-tion. There is evidence for activation of lung leukocytesand pulmonary vascular endothelium, particularly duringexacerbations (Ohkawara et al 1995). Soluble ICAM-1 andsoluble E-selectin are increased in sera from asthmaticsubjects during exacerbations, compared with stable asth-matics and healthy subjects (Montefort et al 1994); solubleICAM-1 is increased in the serum of asthmatics afterallergen challenge (Lee et al 1997). Activation of T lym-phocytes with production of type 2 (IL-4, -5, -13) inflam-matory cytokines drives the recruitment and retention ofeosinophils in the airway (Corrigan and Kay 1990; Wilsonet al 1992). Treatment with inhaled corticosteroids reducesexpression of activation markers CD25 and HLA-DR inlymphocytes from bronchoalveolar lavage fluid and alsoreduces HLA-DR expression in blood lymphocytes(Wilson et al 1994). In asthma, blood CD4+ T cells expressincreased mRNA for IL-4, IL-5, and granulocyte-mac-rophage colony-stimulating factor (GM-CSF). IL-5 mRNAexpression correlates with asthma severity and eosino-philia (Corrigan et al 1995). Allergen challenge in asth-matics causes a reduction in blood CD4+ T cells (Walker etal 1992) and an increase in airway CD4+ cells (Virchow etal 1995). Lymphocytes may play a role in regulating induc-ible NOS activity through release of interferon (IFN)-�,which stimulates monocytes and macrophages to releasecytokines such as tumor necrosis factor and IL-1, which inturn stimulate increased inducible NOS mRNA transcrip-tion in airway epithelium (Robbins et al 1994). Airwayinflammation in asthma is associated with increased NO inthe exhaled air (Barnes and Kharitonov 1996). Exhaled NOconcentrations increase with asthma exacerbations anddecrease with inhalation of corticosteroids (Kharitonov et al1996) or inhibitors of NOS (Yates et al 1995).
UFP exposure may worsen asthma by further shiftinglymphocyte responses to the type 2 phenotype, by furtheractivating resident lymphocytes, by increasing the likeli-hood that lymphocytes will encounter antigen, and/or byincreasing penetration of allergen through an injured epi-thelium. Anderson and colleagues (1990) demonstratedincreased deposition of ultrafine sebacate particles in theairways of asthmatics compared with healthy subjects.
SPECIFIC AIMS
We hypothesized that exposure to UFP causes airwayinflammation in susceptible humans. The mechanismsinvolve activation of circulating leukocytes and vascularendothelium, and the consequences include a systemic
acute phase response with transient hypercoagulability.We further hypothesized that, in people with asthma, UFPdeposition and underlying airway inflammation would beincreased.
These hypotheses were tested in a series of studies withspecific aims:
1. Develop a system for controlled exposure of humans toUFP.
2. Measure the pulmonary fractional deposition of UFP inboth healthy and asthmatic humans.
3. Assess the effect of inhalation of carbon UFP on leuko-cyte and endothelial adhesion molecule expression andactivation.
4. Evaluate airway NO production as a marker for airwayinflammation after carbon UFP exposure.
5. Measure the effects of carbon UFP exposure on markersof the systemic acute phase response and blood coagula-bility.
6. Document any effects of carbon UFP exposure on car-diac electrical activity and repolarization.
7. Assess subjective responses to UFP inhalation in bothhealthy and asthmatic subjects.
METHODS AND STUDY DESIGN
SUBJECT CRITERIA
The study was approved by the Institutional ReviewBoard for Research Subjects of the University of RochesterMedical Center. Forty subjects were to be chosen to partic-ipate and paid a stipend. All were to be lifetime non-smokers, aged 18 to 40 years. Additional exclusion criteriawere: regular marijuana use within the past five years,pregnancy, ischemic heart disease, active psychiatric dis-order, occupation involving chronic exposure to heavydust or PM, inability to complete the required exercise,inability to produce sputum with sputum induction, orcurrent drug or alcohol abuse. Subjects were required toavoid the following medications for the indicated intervalbefore and during the study: systemic steroids (1 month)and nonsteroidal antiinflammatory drugs (1 week,including aspirin, vitamins C and E, and antihistamines).Subjects with atopy or allergic rhinitis were not excludedas long as they did not require regular treatment with anti-histamines or systemic steroids. Subjects were not studiedwithin 6 weeks of a respiratory infection.
Healthy subjects were required to have normal spirometry(forced expiratory volume in 1 second [FEV1] and forced

MW Frampton et al
5
vital capacity [FVC] � 80% predicted, forced expiratoryflow rate from 25% to 75% of FVC [FEF25–75] � 60% pre-dicted), a normal 12-lead ECG, and no history of chronicrespiratory disease.
Subjects were considered to have asthma if they had:(1) a history of repetitive symptoms characteristic of inter-mittent bronchoconstriction (wheezing, shortness ofbreath), and (2) either improvement in FEV1 of 12% ormore with the administration of inhaled albuterol (ifabnormally low values were obtained compared to pre-dicted for airway conductance, FEV1, or FEV1/FVC)(Morris et al 1971) or airway hyperresponsiveness withmethacholine challenge. For methacholine challenge,increasing concentrations of methacholine (0.00, 0.08,0.16, 0.31, 0.63, 1.25, 2.50, 5.00, 10.00 mg/mL) in normalsaline were administered at 4-minute intervals using anebulizer (model 646, DeVilbiss Company, Somerset PA)with a dosimeter (Rosenthal-French model D-2A, Labora-tory for Applied Immunology, Fairfax VA) calibrated todeliver 0.01 mL/breath. Subjects were instructed to take 5breaths (each lasting 6 seconds), and FEV1 was measured30 seconds after the last breath. The concentration of meth-acholine that produced a 20% decrease in FEV1 (PD20) wasdetermined by interpolation using the regression line of themethacholine dose response. Subjects with a PD20 greaterthan 10 mg/mL were excluded from the study.
The severity of asthma in the study subjects recruitedwas to be consistent with mild intermittent, mild persis-tent, or moderate persistent asthma, according to USNational Institutes of Health guidelines (National Insti-tutes of Health 1997). Subjects with FEV1 < 70% of pre-dicted at baseline screening or with > 20% reduction inFEV1 after the screening exercise were excluded. Subjectswere considered atopic if they gave a history of environ-mental allergies or seasonal rhinitis or if the serum immu-noglobulin E (IgE) level, obtained at the time of screening,was elevated.
STUDY DESIGN
Exposure Groups
This project involved three clinical studies of exposureto carbon UFP. All studies used a crossover design inwhich each subject was exposed to filtered air and to UFP.Exposure orders were randomized, and the randomizationwas blocked by order of presentation and gender. Expo-sures were blinded to both subjects and investigators.
The first study, UPREST, involved 12 subjects (6 female)who were exposed to filtered air and UFP (10 µg/m3) atrest for 2 hours. Each subject had both exposures, which
were separated by at least 2 weeks. Followup extended for21 hours after exposure.
The second study, UPDOSE, involved 12 subjects (6female) with 3 exposures for each subject. Exposures wereseparated by at least 2 weeks: filtered air and UFP (10 and25 µg/m3). For safety reasons, the random order of expo-sure was restricted so that each subject received the10 µg/m3 UFP exposure before the 25 µg/m3 UFP expo-sure. To simulate outdoor activities, subjects exercised ona bicycle ergometer for 15 minutes of each 30-minuteperiod at an intensity adjusted to increase the minute ven-tilation (VE) to approximately 20 L/min/m2 body surfacearea. Thus there was a total of 1 hour of rest and 1 hour ofexercise per exposure. Followup extended for 21 hoursafter exposure.
The third study, UPASTHMA, involved 16 (8 female)subjects with asthma exposed to filtered air or 10 µg/m3
UFP for 2 hours with intermittent exercise (as describedfor UPDOSE subjects) for a total of 2 exposures. Each expo-sure was separated by at least 3 weeks. Followup extendedfor 48 hours after exposure.
The experimental protocols for the three studies aresummarized in Figure 1. The studies required 5 to 7 visitsfor each subject.
Screening Visit
At the screening visit, informed consent was obtained,and subjects completed a standardized screening question-naire for assessment of respiratory symptoms, medical his-tory, and smoking history. A physical examination wasfollowed by routine pulmonary function tests: spirometry,diffusing capacity, and measurement of lung volumes.Subjects exercised on the bicycle ergometer for 15 minutesto determine the intensity necessary to achieve a minuteventilation of 20 L/min/m2. For females, pregnancy testingwas performed. Finally, subjects underwent sputuminduction by inhaling nebulized saline.
Exposure Visits
On Day 1, at least 1 week after the screening visit, sub-jects arrived at 7:15 AM for the following procedures: mea-surement of blood pressure and heart rate; pulse oximetry;symptom questionnaire; attachment of a 12-lead Holterheart monitor (Mortara Instruments, Milwaukee WI) with aresting recording for 10 minutes; phlebotomy; measure-ment of exhaled NO; and spirometry. These procedurestook about 2 hours.
For the symptom questionnaire, subjects ranked theseverity of each symptom on a scale from 0 (“not present”)

6
Ultrafine Carbon Particles in Healthy and Asthmatic Subjects
to 5 (“incapacitating”). Subjects breathed room air on themouthpiece system for 5 minutes before the exposure wasstarted. They were then exposed by mouthpiece for 2 hoursto either filtered air or UFP. After 1 hour of exposure, sub-jects were given a 10-minute break off the mouthpiece.
Immediately after the exposure, the measurementstaken before exposure were repeated. The subjects weregiven lunch and remained in the Clinical Research Center.Measurements were taken again 3.5 hours after exposure.The subjects were then sent home with activity diaries.
For Day 2, subjects returned the next morning at 8:00 AM
(21 hours after exposure). The same series of measure-ments was performed and sputum was induced. TheHolter heart monitor was removed. For UPREST andUPDOSE subjects, this was the end of one exposure.
On Day 3 (48 hours after exposure), UPASTHMA sub-jects returned for an additional set of measurements,including a 10-minute digital ECG recording.
All subjects returned for subsequent exposures at least 2weeks (UPREST and UPDOSE) or 3 weeks (UPASTHMA)after exposure, using an identical exposure protocol.
EXPOSURE SYSTEM
The exposure system was designed to meet severalrequirements.
• UFP had to be generated in real time during exposure to minimize agglomeration and diffusion losses.
• Simultaneous measurements of particle number, mass, and size distribution were necessary to characterize inhaled UFP.
• Determinations of particle characteristics were required at inspiration and expiration to determine deposition.
• Sufficient UFP aerosol was needed to meet the range of inspiratory flow demands during rest and exercise.
While typical minute ventilation at rest is 6 to 8 L/min,this measure increases several fold with exercise. Instanta-neous or peak flow rates can reach 100 L/min. In order tomeet peak demands of the subject, the flow rate into themixing chamber on the inspiration side of the system was120 L/min.
The exposures took place in an environmental chamberin the General Clinical Research Center at the University of
Figure 1. Protocols for screening visit and for Days 1 through 3 per exposure. Exercise lasted for 15 minutes of each half hour of the 2-hour exposure,yielding 1 hour total of exercise and 1 hour of rest. All exposures were 2 hours in duration. Only UPASTHMA subjects returned for Day 3.

MW Frampton et al
7
Rochester Medical Center. We chose a mouthpiece expo-sure system to facilitate accurate measurement of respira-tory deposition. Details of particle generation and themouthpiece exposure system have been described else-where (Chalupa et al 2002). The design is a one-pass,dynamic flow exposure system. Carbon UFP were gener-ated from pure graphite electrodes by spark discharge inanhydrous argon, using a commercial generator (Palas Co,Karlsruhe, Germany). The use of argon served to excludeoxygen, water vapor, and other gases to minimize the for-mation of organic compounds and oxidation products. Theparticle size distribution was controlled by varying boththe gap between the electrodes and the spark frequency.The generator continually adjusted the electrode positionto keep the gap, and therefore the particle size, constantduring particle generation. A constant flow (6 L/min) ofargon through the spark chamber during generation mini-mized particle agglomeration. The generator settings wereadjusted to provide a nominal particle count median diam-eter of 26 nm with a lognormal volume median diameter of54 nm and geometric standard deviation of 1.6 nm. Themass and number concentrations of UFP emitted from thePalas generator were found to be stable over time (Table 4).
Particles were continuously generated, and the concen-tration was monitored and regulated during the exposure.Particles were passed through a charge neutralizer aftergeneration to achieve the Boltzman equilibrium. Alltubing was electrically conductive with lengths mini-mized to avoid particle loss. The ionized particles thenentered a 28.4-L mixing reservoir. Particles in the reservoirentered the circuitry to the mouthpiece according to thedemands of the subject. An overflow line removed theexcess aerosol. Nonrebreathing valves (Hans Rudolph,Kansas City MO) at the mouthpiece insured one-way pas-sage of the particles and allowed aerosol concentrations tobe analyzed in real time on both the inspiratory and expi-ratory sides of the subject. The subject inhaled from amouthpiece and wore a nose clip.
A resilient reservoir was placed on the expiratory side ofthe subject, loosely coupled to a dedicated filter andexhaust system. The system was designed to keep bothsides of the nonrebreathing valves at atmospheric pres-sure, unaffected by the subject’s respiration. Tubing on theexpiratory side was heated to approximately ~37�C toavoid condensation. The intake supply flow rate was mon-itored with a differential pressure gauge (Magnehelic,Dwyer Instruments, Michigan City IN) calibrated using adry test meter (Singer American Meter Company Division,Wellesley MA).
Particle characterization was accomplished by determi-nation of particle mass concentration, number concentra-tion, and size distribution. Condensation particle counters(TSI, St Paul MN) and an electrical detection mobility ana-lyzer (TSI) determined particulate number, surface area,and volume concentrations of the inspired and expiredaerosols. The target mass concentrations for exposureswere 10 and 25 µg/m3. The mass concentrations were mea-sured with a tapered element oscillating microbalance(TEOM, Rupprecht and Patachnick, Albany NY). TheTEOM provided mass concentrations in micrograms percubic meter at averaging times of 1 minute to 24 hours,with lower limits of mass determination on the order of5 µg/m3. The TEOM mass balance is sensitive to pressurechanges within the system; these were controlled by thesystem design. At the low mass concentrations in thesestudies of UFP (10 to 25 µg/m3), relatively long averagingtimes of several hours were required to provide accuratemass determinations. For this reason, we determined astandard curve of particle mass versus number concentra-tion to validate TEOM mass measurements with estimatesbased on particle number. The mass concentration wasmonitored continuously on the inspired side of thesystem, but we relied on real-time monitoring of particlenumber to assure constant levels of particle generationduring exposures.
Electronic integration (HPChem Integrating Software,Hewlett-Packard, Gaithersburg MD) of a pneumotacho-graphic airflow transducer (E for M Co, White Plains NY) onthe expiratory limb provided continuous measurements oftidal volume (VT), respiratory rate, and minute ventilation.
To determine particle losses, a reciprocal pump was usedto simulate respiration. A resting minute ventilation of10 L/min was simulated using a volume of 800 mL at12.5 cycles/min. Mild exercise (22 L/min) was simulatedusing a volume of 1200 mL at 18.3 cycles/min. Continuousupstream and downstream measurements of particlenumber and volume were determined for the whole systemand for a respiratory valve alone. Mass losses were calcu-lated using particle volume determined by the electrostaticclassifier. During exercise simulation, losses were 0% forparticles of 23.7-nm midpoint diameter and larger; max-imum losses were 3.9% for 7.5-nm particles. At resting con-ditions, maximum losses were 13.2% for 7.5-nm particles.
Dilution air and air used in control exposures was filteredthrough charcoal and high efficiency particle air filters. Par-ticle mass in the intake diluting air was undetectable, andparticle numbers ranged from 0 to 10 particles/cm3. Theenvironmental chamber in which the exposures took placewas maintained at a temperature of 21.8 ± 1.0 (SD) �C and a

8
Ultrafine Carbon Particles in Healthy and Asthmatic Subjects
relative humidity of 28.7% ± 10.5%. During both UFP andcontrol air exposures, the inspired air temperature andhumidity were ~22�C and ~12%, respectively.
PARTICLE DEPOSITION
The total respiratory deposition fraction (DF) was calcu-lated for both particle number and mass concentrations(Daigle et al 2003). Inspiratory and expiratory UFP numberconcentrations were measured continuously and recordedevery 5 seconds during the exposure. Particle number con-centration was then averaged for the periods at rest andexercise. Particle size distribution from the inspiratory cir-cuit was determined before and just after each exposure.Particle size distribution from the expiratory circuit wasmeasured during one rest period and one exercise periodeach hour. For computational simplicity, data on particlesize distribution from the electrical detection mobilityanalyzer were grouped into 8 particle size bins with mid-point count median diameter from 8.7 to 64.9 nm (particlecount median diameter ranging from 7.5 to 75.0 nm),which included more than 98% of the particles. The meansize-specific inspiratory particle concentration was deter-mined by multiplying the average inspiratory number con-centration by the percentage of particles in each size bin inthe inspiratory circuit. The mean size-specific expiratoryparticle concentration was determined by multiplying theaverage expiratory number concentration by the per-centage of particles in each size bin in the expiratory cir-cuit. The correction factors for system losses weresubtracted from the measured inspired concentrations andadded to the measured expired concentrations. The particlenumber DF was then calculated by subtracting the correctedexpiratory number concentration from the correctedinspiratory number concentration and dividing the differ-ence by the corrected inspiratory number concentration.
The particle mass DF was calculated as follows (Chalupaet al 2002): inspired and expired particle volume (mass)concentrations were determined for each size bin from thescanning mobility particle sizer data. The percentage ofinspired and expired particles by volume per bin wasdetermined by dividing each bin volume concentration bythe total volume concentration (sum of individual bins).The mean expired mass concentration was calculated bymultiplying the ratio of the total expired volume concen-tration to the total inspired volume concentration by themeasured (TEOM) inspired mass concentration. Theinspired mass concentration for each bin was calculated asthe product of the inspired volume percentage of particlesin each bin and the mean inspired mass concentrationfrom the TEOM. The expired mass concentration for eachbin was calculated as the product of the expired volume
percentage for each bin and the calculated overall expiredmass concentration. These mass data were corrected forsystem losses by multiplying each bin by the loss correc-tion factor for that bin, then subtracting that product fromthe inspired data and adding to the expired data. Finally, aloss-corrected DF was calculated as the loss-correctedinspired mass concentration minus the loss-correctedexpired mass concentration, divided by the loss-correctedinspired mass concentration.
Theoretical total respiratory DFs were calculated usingthree models: (1) ICRP (1994), (2) US National Council onRadiation Protection and Measurements (NCRP; 1997),and (3) the Multiple Path Particle Deposition Model(MPPDep, Version 1.11, July 1999, Chemical IndustryInstitute of Toxicology) (Cassee et al 2002). For theMPPDep model, predictions were calculated for each sub-ject using measured functional residual capacity, respira-tory frequency, and VT at rest and during exercise. Thefollowing values were used for all subjects: upper respira-tory tract volume, 50 mL; inspiratory:expiratory ratio, 1:2;and nominal particle density, 1.5 g/cm3. Mouth breathingwas assumed for all test subjects.
PULMONARY FUNCTION
Spirometric measurements of FVC and FEV1 were per-formed with a pneumotachograph interfaced with a micro-computer (model CPF-S, Medical Graphics, St Paul MN).Lung volumes (by plethysmography) and diffusingcapacity for carbon monoxide (DLCO) were measured in theclinical pulmonary function laboratory, using equipmentfrom Morgan Scientific (Haverhill MA).
AIRWAY NITRIC OXIDE
Measurement of airway NO production provides a nonin-vasive method for assessing airway inflammation (AmericanThoracic Society 1999). We have developed methods forseparately measuring NO production in the conducting (orupper) airways (VUNO), and in the alveolar (or lower) airways(VLNO) (Hyde et al 1997; Pietropaoli et al 1999). The tech-nique involves determination of the single-breath diffusingcapacity for NO (DLNO) (Perillo et al 2001) and measurementof the partial pressure of exhaled NO (PE) at differing con-stant expiratory flow rates. During all measurements, exha-lation against positive pressure closed the nasopharyngealvelum and thus prevented contamination of the expiredairway gases with NO from the nasopharynx.
DLNO was measured by inhaling 10 ppm NO from a bag-in-box apparatus. After holding breath for 2 seconds, thesubject exhaled at a constant flow rate of 0.5 L/sec into therecording spirometer. Expiratory flow was kept constant

MW Frampton et al
9
by applying fixed expiratory resistance and asking the sub-ject to maintain a constant expiratory pressure by watchinga manometer. The rate of change of NO concentration atincrements of exhaled volume provided the data to calcu-late DLNO (Perillo et al 2001).
For determination of VUNO and VLNO, subjects inhaledNO-free air to total lung capacity from the bag-in-box appa-ratus, held breath for 10 seconds, and then exhaled at eachof six different constant expiratory flow rates from 6 to1300 mL/sec. These flow rates were achieved by changingthe level of expiratory resistance before individual exhala-tions. During each exhalation, the subject maintained thesame constant expiratory pressure of 10 cm H2O. Constantexpiratory pressure applied against different, fixed expira-tory resistances during individual exhalations resulted ina variety of constant expiratory flow rates. Exhalations ateach flow rate were performed in duplicate and averaged.The partial pressure of NO in the alveoli PA and VUNO weredetermined by plotting the inverse of the more rapid flowrates on the x-axis versus the corresponding exhaled NOmeasurements on the y-axis. PA was determined as the y-intercept (infinite flow rate) of this plot, and VUNO was cal-culated from its slope. VLNO was determined as follows(Pietropaoli et al 1999):
VLNO = DLNO (PA).
NO concentrations in the exhaled breath were measuredwith a rapidly responding chemiluminescence NO analyzer(model 270B, Sievers, Boulder CO) operating at a samplingrate of 250 mL/min. The analyzer was calibrated daily usingserial dilutions of a gas containing 229 ppb NO. Referencegas samples of NO-free air were obtained by passing com-pressed air from a cylinder containing less than 2 ppb of NO(Scott Specialty Gases, Plumsteadville PA) through a filterpacked with potassium permanganate (Purafil, Thermoen-vironmental Instruments, Franklin MA). To correct forinstrument drift, all measurements were corrected by sub-tracting the average of NO-free air readings taken immedi-ately before and after each NO determination.
BLOOD MARKERS OF COAGULATION AND INFLAMMATION
The soluble markers of inflammation, coagulation, andleukocytes measured in this study are shown in Table 1.Venous blood was collected in sodium citrate. Plasma wasseparated, divided into aliquots, and stored at �80�C priorto analysis. Fibrinogen, factor VII, and von Willebrandfactor (vWf) were analyzed in the laboratory of the VascularMedicine Program (Dr Victor Marder, Orthopedic Hospital,Los Angeles CA). The principle for the fibrinogen assay is
the relation of thrombin clotting time to fibrinogen con-centration. This assay is based on a modification of thetechnique of Ellis and Stransky (1961). An STA CompactAnalyzer (Diagnostica Stago, Paris, France) or AMAXCS190 Analyzer (Sigma, St Louis MO) was used to performthe assay. The principle for the factor VII activity assay isthe degree of correction of a prothrombin time–based assayof an unknown sample for factor VII–deficient plasma.This assay is based on a modification of the technique ofOwen and Aas (1951) and performed on the equipmentused for the fibrinogen assay. The principle for the vWfantigen assay is the degree of agglutination of anti-vWf–coated latex particles by plasma containing vWf (Furlan,Perret et al 1985). The vWf antigen assay was performed onthe same equipment used for the fibrinogen and factor VIIassays.
IL-6, serum amyloid A, soluble ICAM-1, soluble L-selectin,P-selectin, and E-selectin were determined using commer-cial enzyme-linked immunosorbent assays (ELISAs) thatwere validated using dilution and add-back experiments.For these assays, venous blood was collected in heparinanticoagulant. Aliquots of plasma were stored at �80°Cprior to analysis.
IMMUNOFLUORESCENCE ANALYSIS
Flow cytometry provided a sensitive method for evalu-ating changes in cell differential counts and for assessingchanges in phenotype and expression of activation markersand adhesion molecules on blood leukocytes. The cell sur-face molecules studied were chosen to delineate changes inlymphocyte subsets, cell activation, and expression of adhe-sion molecules, all of which may reflect responses toinflammation and endothelial activation (Table 1).
Fresh heparinized whole blood was stained with fluoro-chrome-labeled monoclonal antibodies (Becton Dickinson,Mountain View CA). Leukocytes were stained with theappropriate monoclonal antibody conjugated to fluores-cein isothiocyanate (FITC), and simultaneously stainedwith both CD14-phycoerythrin (PE) and CD45-peridininchlorophyll protein (PerCp, a Becton Dickinson fluoro-chrome with minimal wavelength overlap with FITC orPE). This staining procedure permitted determination ofthe relative expression of adhesion molecules and othermarkers separately on PMNs, eosinophils, lymphocytes,and monocytes.
Lymphocyte subsets were characterized using combina-tion gating and selective markers: CD3+4+ (T-helper),CD3+CD8+ (T-cytotoxic-suppressor), CD3+��TCR+
(T-null), CD3�CD19+ (B cells), and CD3�CD16+/56+ (nat-ural killer cells).

10
Ultrafine Carbon Particles in Healthy and Asthmatic Subjects
RBCs were lysed and remaining cells were analyzed ona flow cytometer (FACScan, Becton Dickinson) equippedwith a 15-mW argon ion laser at 488 nm. Ten thousandevents were collected from each sample in list mode usingCell Quest software (Becton Dickinson). Forward scatter,90� side scatter, and 3-color fluorescence (FITC, 530/30 nmband pass; PE, 585/42 nm band pass; and PerCP, 650 nmlong pass filter) were measured. The appropriate isotypecontrol antibodies were run with each experiment to deter-mine appropriate gate settings. Each leukocyte subset wasdetermined as a percentage of gated cells; then that per-centage was multiplied by the concentration of leukocytesfrom the complete blood count to express each subset as aconcentration of cells. Standardized fluorescent micro-beads (Quantium 24P and 25P, Bangs Laboratories, FishersIN) were run with each experiment. These data were fittedwith an exponential curve: f(x) = AeBx where x was the
channel number and A and B were constants determinedfrom the regression fit. This standard curve was then used toconvert mean channel numbers for the various markers tomolecules of equivalent soluble fluorochrome (MESF)(Gavras et al 1994). This provided a correction for minorday-to-day instrument variations in fluorescence detection.
LYMPHOCYTE CYTOKINE PROFILE
Blood samples were collected from asthmatic subjects(UPASTHMA group) before exposure and at 21 and 45 hoursafter exposure. Peripheral blood mononuclear cells (PBMCs)were isolated from whole blood by Ficoll-Hypaque gradientcentrifugation (Cellgro, Herndon VA) and were frozen inliquid nitrogen. The cells were assayed for expression ofIFN-� and IL-4 using the enzyme-linked immunospot assay(ELISPOT) (Karulin et al 2000) in 96-well plates (MAIP
Table 1. Markers of Inflammation and Coagulation
Abbreviation Name
Soluble Markers DescriptionIL-6 Interleukin 6 Inflammatory cytokineSAA Serum amyloid A Acute phase protein
sICAM-1 Soluble intercellular adhesion molecule-1 Shed adhesion moleculesCD40L Soluble CD40 ligand Marker of inflammation and cardiovascular risksVCAM-1 Soluble vascular cell adhesion molecule-1 Shed adhesion molecule
sE-Selectin Soluble E-selectin Shed adhesion moleculesL-Selectin Soluble L-selectin Shed adhesion moleculesP-Selectin Soluble P-selectin Shed adhesion molecule
Factor VII Coagulation factorFibrinogen Coagulation factor and acute phase protein
vWf von Willebrand factor Coagulation factor and marker of endothelial activation
Leukocyte Markers Cellular ExpressionCD3 T lymphocytesCD4 T-helper lymphocytesCD8 T-cytotoxic lymphocytesCD11a Part of lymphocyte function-associated
antigen-1 (LFA-1)Part of adhesion molecule
CD11b Part of Mac-1 Part of adhesion molecule (subunit of complement receptor 3)CD16 Fc�RIII Low-affinity receptor for IgGCD18 Part of adhesion molecule, complexed with CD11a or CD11bCD19 B lymphocytesCD23 Fc�RII Low-affinity IgE receptor
CD25 Tac �-chain of IL-2 receptor, activation marker on lymphocytesCD32 Fc�RII Low-affinity receptor for IgGCD45RO Memory T lymphocytesCD49d Part of VLA-4 Part of adhesion molecule
CD54 Intercellular adhesion molecule-1 (ICAM-1) Adhesion moleculeCD62L L-selectin Adhesion moleculeCD64 Fc�RI High-affinity receptor for IgGCD154 CD40 ligand Marker of activation and inflammation

MW Frampton et al
11
S4510, Millipore, Bedford MA); the plates were coated for2 hours at room temperature with 50 µL of antibodies spe-cific for either IFN-� (10 µg/mL, 1-D1K, Mabtech, Nacka,Sweden) or IL-4 (5 µg/mL, 8D4, BD PharMingen, San DiegoCA). After 2 hours at room temperature, the plates werewashed with RPMI 1640 medium with 8% fetal bovineserum. Dilutions of previously frozen human PBMCs(thawed using a rapid-sequence method yielding 70–80%recovery of cells) were added to each well and stimulatedwith 20 µg/mL of phytohemagglutin A (PHA-p; Sigma).
After 36 to 40 hours at 37�C and 5% carbon dioxide, theplates were washed with phosphate-buffered saline (PBS)with 0.1% Tween 20 (PBST) (EM Science, Gibbstown NJ).The biotinylated second antibodies (IFN-�, biotinylated7-B6-1 [Mabtech] at 1 µg/mL; for IL-4, biotinylated 25D2[BD Pharmingen] at 2 µg/mL) were added in PBST with 1%bovine serum albumin (PBSTB), and left for 1 to 2 hours atroom temperature. The plates were washed in PBST, andalkaline phosphatase–conjugated streptavidin (JacksonImmunoResearch Laboratories, West Grove PA) in PBSTBwas added at a 1:1000 dilution. After washing with PBST,the plates were developed using an alkaline phosphatasesubstrate (kit III SK-5300, Vector Laboratories, BurlingameCA). Plates were dried and counted using the autocountblue setting on the automated Immunospot Reader (Cel-lular Technology, Cleveland OH). ELISPOTs were cor-rected for background and control standards. Only wellswith 30 to 250 ELISPOTs were included in the analysis.
SPUTUM INDUCTION
The cells obtained in induced sputum are representativeof those cells found in the lower airways and can be used tomeasure airway inflammation noninvasively. Sputum wasinduced as part of the baseline determinations on theScreening Day. Subjects unable to produce an adequatesample (> 0.7 � 106 cells with � 70% nonepithelial cells)were excluded from the study. Sputum was also induced22 hours after each exposure. Only one sputum inductionwas performed after each exposure because sputum induc-tion itself induces a transient airway inflammatory responsethat influences repeated measurements (Holz et al 1998;Nightingale et al 1998).
Inhalations of increasing concentrations (3%, 4%, and5%) of nebulized hypertonic saline (Devilbiss Ultra-Neb 99Ultrasonic Nebulizer, Somerset PA) induced sputum pro-duction, using a method modified from Pizzichini and col-leagues (1996). Spirometry was used before and during theprocedure to detect any bronchoconstriction.
The sputum was processed on ice using the plug selec-tion technique (Pizzichini et al 1996). This technique allowsseparation of lower airway cells and associated fluids from
contaminating saliva and squamous epithelial cells from theupper airway. A portion of the sputum was incubated withdithiothreitol to disperse the cells and filtered through a48-µm nylon mesh. The cells were then counted in ahemocytometer in the presence of trypan blue. Cytospinslides were prepared for microscopic differential counts(~500 cells counted). The cell-free supernatant wasdivided into aliquots and stored at �80�C for subsequentanalysis of IL-6 and IL-8 using ELISA.
CARDIAC MONITORING
Each subject had a continuous digital 12-lead ECGrecording that was started prior to exposure and ended thefollowing morning. During the continuous ECG recordings,5-minute supine resting ECG recording sessions were per-formed to evaluate ECG parameters in a controlled settingunaffected by physical activity or body position. These5-minute sessions occurred before exposure, immediatelyafter exposure, and 3.5 hours and 21 hours after exposure.In the UPASTHMA group, subjects returned 45 hours afterexposure for an additional ECG session. Each 5-minutesegment was preceded by a 2-minute resting period.
In addition, a 5-minute ECG segment was identifiedduring the final 15 minutes of exposure as well as during thenight (systematically at 2 AM). For UPDOSE andUPASTHMA subjects, the monitoring segment was chosenfrom the last 15 minutes of exposure during the last exerciseperiod and a 5-minute ECG session was identified duringthe night (2 AM) after exposure.
ECG ANALYSES
The 24-hour ECG recordings were analyzed using theH-Scribe Mortara System (Mortara Instruments, Mil-waukee WI). After automatic beat annotation, verified by atechnician, the ECG analysis was completed using MISHA,a research version of Mortara’s program, yielding quantita-tive measures of several ECG parameters, including beat-to-beat (RR) intervals, lead-specific and beat-to-beat STsegment levels, T wave amplitude, and T wave complexity.The QT interval was measured as the longest interval foreach beat. Then an 8-beat–segment average was computedfor QTc, corrected for heart rate with the Bazett formula(Bazett 1920). Subsequently, the means of 8-beat averagesfrom a 5-minute period were calculated. The measurementsof QTc interval durations were also performed manually inlead II. For measurements of T wave amplitude, originalECG leads I, II, and V1 to V6 were used, and the medianvalue from these 8 original ECG leads was taken for eachbeat and averaged over 5 minutes. T wave complexity,describing the morphology of the T wave, was measured ineach beat by principal component analysis based on all

12
Ultrafine Carbon Particles in Healthy and Asthmatic Subjects
12 leads and averaged over the 5-minute period (Priori etal 1997). Variability of T wave complexity was measuredas a standard deviation over the 5-minute period and didnot require correction for heart rate. ST segment analysiswas focused on leads II, V2, and V5, and the median STsegment level over the 5-minute period was used.
The time-domain parameters of heart rate variability,SDNN (standard deviation of normal-to-normal (sinus beatintervals) and rMSSD (root mean square of successive dif-ferences in NN intervals), were calculated for each 5-minutesegment of interest and for a 16-hour period starting3.5 hours after exposure. The following frequency-domainparameters of heart rate variability were computed for each5-minute segment using fast Fourier technique: high fre-quency power (0.15–0.40 Hz), low frequency power (0.04–0.15 Hz)—both expressed in normalized units—and theratio of the two (Malik and Camm 1995).
This combination of analyses yielded informationregarding autonomic nervous system effects (which mightoccur via direct reflexes from airways and/or inflamma-tory responses), myocardial vulnerability to arrhythmia,and the underlying health of the myocardial substrate(Zareba et al 2001). In addition, arrhythmias were quanti-tated as the total of atrial premature contractions and ven-tricular premature contractions for the entire recordingperiod in each protocol.
DATA HANDLING AND STATISTICAL METHODS
UPREST and UPASTHMA
These studies utilized a standard, two-period crossoverdesign in which each subject was exposed to both particlesand filtered air. Equal numbers of males and females wereincluded because some effects of particle exposure mightdepend on gender. The order of presentation was randomizedseparately for each gender, with half of each group of subjectsreceiving each of the two possible orders first (ie, UFP or air).The time between the two exposures (the washout period)was sufficiently long to expect carryover effects from the pre-vious exposure to be minimal or nonexistent.
The standard analysis for continuous endpoints is arepeated-measures analysis of variance (ANOVA). In thisanalysis, order of presentation and gender are between-subject factors, while exposure substance, period (eg, firstvisit, second visit), and time (when there are repeated mea-surements after each exposure) are within-subject factors.The analyses addressed study period and carryover effectsalthough the latter were expected to be minimal (becauseof the nature of the exposures and the length of thewashout period). In subjects whose carryover effects were
highly significant, first exposure data were examined sep-arately (Jones and Kenward 1989).
For some endpoints, repeated measurements were madeat uniform intervals after each exposure. In these cases, theANOVA included tests for the effect of time as well asinteractions with other effects in the model. The ANOVAmodel and its interpretation have been discussed by Wal-lenstein and Fisher (1977). Each ANOVA included anexamination of residuals as a check on the requiredassumptions of normally distributed errors with constantvariance. If these assumptions were not satisfied, datatransformations (for example, square-root transformationfor cell counts) were considered. In the special case thatonly one measurement was made in each exposure period,the ANOVA simplifies to three different t tests, for expo-sure substance, period, and carryover effects (Jones andKenward 1989). In this case nonparametric tests, such asthe Wilcoxon rank sum test, can be used if the observationsare not normally distributed.
UPDOSE
The study utilized a three-period crossover design inwhich each subject had exposures to low (10 µg/m3) andhigh (25 µg/m3) concentrations of particles, as well as air.For safety considerations, each subject received the10 µg/m3 UFP exposure before the 25 µg/m3 UFP expo-sure. There were then three possible exposure sequencesdepending on the place of air exposure in the sequence.Equal numbers of subjects were randomly assigned to eachexposure sequence. The statistical analysis was based onthe usual ANOVA model for crossover designs (Jones andKenward 1989). That is, the ANOVA included effects forexposure substance (3 levels) and period (3 levels).Because of the nature of the design, carryover effects werelimited to an effect for having been previously (in theperiod just before the present one) exposed to 10 µg/m3 UFP(all subjects) and to 25 µg/m3 UFP (4 subjects). A randomsubject effect was included in the model. Interactionsbetween subjects and both substance and period wereincluded as random effects. Because the data were not bal-anced for this model, parameters for the model were esti-mated by the method of maximum likelihood (Searle et al1992). Residuals were examined as a check on the assump-tions, and when necessary, data transformations were con-sidered. In some cases a logarithmic or square roottransformation was necessary to stabilize the variance.
A P value of <0.05 was required for statistical signifi-cance. Because of the multifaceted nature of these studies,a fairly large number of significance tests were performed.Our strategy for interpretation was to rely on the pattern of

MW Frampton et al
13
the significance tests, and specifically on concordanteffects among biologically related variables, rather thanindividual P values. Data are shown as mean ± SE unlessotherwise indicated.
In terms of the statistical formalities of the ANOVA, acarryover effect is the same as (is confounded with) a treat-ment by period interaction, which allows the treatmenteffect to differ between the two periods; it is the interpreta-tion that differs. Specifically, a carryover effect representsa residual effect of the treatment in the first period that isstill present in the second period of observation. Carryovereffects are the bane of crossover designs because their pres-ence makes it impossible for treatment effects to beassessed using within-subject comparisons.
In designing a crossover study, it is important to choosea washout period of sufficient length that residual treat-ment effects from the first period will not be present in thesecond; this requires the use of treatments whose effectswill indeed disappear with time. These considerations areessential in planning the study because the ability of thecrossover design to detect such residual treatment effectscan be limited. In the present studies the a priori hypoth-esis was that any effects of exposure to UFP would be tran-sient and that the washout period was long enough thatany residual effects of particle exposure would disappearwell before subjects returned for the second visit.
An ANOVA indicates that such carryover effects areeither present or not on a group basis. The interpretation ofsuch effects depends primarily on the particular endpointand well as the presence of such effects for related end-points. In the present studies the pattern of carryovereffects did not indicate any systematic persistence in thesecond period.
RESULTS
PARTICLE COMPOSITION
To confirm that the UFP were composed predominantlyof elemental carbon, UFP were collected on Teflon filtersand sent to the laboratory of Dr Glen Cass for analysis. Theparticles collected in this manner showed a surprisinglyhigh content of organic carbon—approximately 22%.Others have also found organic compounds in particles pro-duced by the Palas generator (McDonald et al 2001). Forpossible sources of the organic carbon, we considered thePalas generator itself. To eliminate any sources of organicmaterial within the generator, all plastic parts, including theinternal combustion chamber, the collars holding the
graphite electrodes, and the tubing were replaced with eitherTeflon, ceramic, or stainless steel materials. UFP from thisrebuilt generator were again submitted to Dr Cass’s labora-tory for analysis, but the organic content was still high—approximately 24%.
We then considered whether the organic content was anartifact of collecting UFP on the filters. UFP have a greatdeal of surface area and thus can adsorb materials fromambient air. Possibly the handling and transport of filtersfacilitated adsorption of organic materials from ambient air.
To test this possibility, we utilized a new technique forsingle particle analysis of composition developed byDr Kim Prather and colleagues (Su et al 2004), usingaerosol time of flight mass spectrometry (ATOFMS). DrPrather found that UFP analyzed immediately after emis-sion from the rebuilt generator were predominantly ele-mental carbon. The single-particle mass spectra of the UFPwere nearly identical to elemental carbon particles fromgasoline- and diesel-powered emission sources measuredpreviously: 82% of the particles showed short-chain frag-ment patterns of C1, C2, and C3; 14% showed longer chainfragmented peaks. Thus, 96% of the particles consisted ofelemental carbon (Dr K Prather, personal communication).We therefore concluded that our subjects inhaled particlesconsisting of elemental carbon and that these were similarin composition to ambient elemental carbon particles.
SUBJECT CHARACTERISTICS
A total of 40 subjects were studied, 20 male and20 female. Subjects were 18 to 40 years of age except for twosubjects in the UPREST group, aged 42 and 52 years. Threesubjects were Asian, one African American, and the restwhite. Sixteen subjects met the criteria for mild asthma. Allsubjects provided written, informed consent. Table 2 showsthe subject characteristics and baseline pulmonary function(at screening) for each of the three clinical studies. Table 3provides further characterization of the asthmatic subjects.Most of the asthmatic subjects were atopic (15 of 16), andmost (11 of 16) did not use inhaled steroids, long-actingbronchodilators, or leukotriene inhibitors.
PARTICLE DEPOSITION
Table 4 shows the actual average particle number andmass concentration for each 2-hour exposure. Figure 2shows the particle size distribution for inspired and expiredaerosols from one subject from each exposure protocol.
Table 5 shows the deposition data for all three studygroups. In the UPREST group, the individual total DF byparticle number ranged from 0.46 to 0.79. The highest DF

14
Ultrafine Carbon Particles in Healthy and Asthmatic Subjects
was seen with the smallest particles. The DF decreased forparticle sizes up to 48.7 nm and then leveled off (Table 5).The expired aerosol showed a very slight increase in countmean diameter, most likely as a result of the more efficientdeposition of the smaller particles.
In the initial exposures in the UPDOSE group, usable datawere available for 7 of the 12 subjects. We found in the firstfew subjects that measurements of expiratory particle con-centrations were inaccurate because of pressure changesassociated with the subject’s breathing during exercise.Repositioning the expiratory sampling port resolved thisproblem. No significant differences in DF were measured at10 µg/m3 UFP or 25 µg/m3 UFP; therefore, these data wereaveraged. The individual total DF by particle numberranged from 0.55 to 0.66 at rest and 0.76 to 0.88 during exer-cise. The at-rest results were similar to those found in theUPREST study, and DF increased with exercise in all sizebins. Figure 3 shows the DF for the 12 subjects in theUPREST group and the 7 subjects from the UPDOSE groupwith usable deposition data while breathing at rest. The DFduring exercise also reached a plateau in the larger size bins(Table 5 and Figure 3).
Table 2. Subject Characteristics and Baseline Pulmonary Function
UPREST UPDOSE UPASTHMA
Age (yr)a 30.1 ± 8.9 26.9 ± 5.8 23.0 ± 2.7M/F 6/6 6/6 8/8Oral contraceptive use (females only) 6/6 4/6 5/8Height (cm)a 167 ± 8 173 ± 10 170 ± 8Weight (kg)a 70 ± 13 79 ± 11 80 ± 15
FEV1 (% predicted)a 103.8 ± 8.0 106.3 ± 16.6 97.6 ± 20.2FVC (% predicted)a 99.9 ± 8.3 103.5 ± 15.6 106.2 ± 14.5FEV1/FVC (%)a 87.9 ± 4.2 86.8 ± 5.2 77.8 ± 6.9FEF25–75 (% predicted)a 113.9 ± 24.2 106.3 ± 22.0 77.6 ± 29.7DLCO (% predicted)a 90.9 ± 11.5 89.8 ± 18.2 99.7 ± 12.5
a Data are mean ± SD.
Table 3. Subjects with Asthma
CharacteristicNumber of Subjects
(n = 16)
Environmental allergies 12Increased IgE 11Atopic (allergies or increased IgE) 15
MedicationsAlbuterol only 12Inhaled steroid 4Long-acting -agonist 2Leukotriene inhibitor 2
FEV1 PD20 (mg/mL) (n = 11)a 4.3 ± 5.5Bronchodilator response (% increase in FEV1) (n = 5)a
19 ± 4
a Data are mean ± SD. PD20 = 20% decrease in FEV1.
Table 4. Particle Characterizationa
UPREST UPDOSE (Low) UPDOSE (High) UPASTHMA
Target mass (µg/m3) 10 10 25 10Measured mass (µg/m3) 10.0 ± 2.1 14.0 ± 4.0 28.5 ± 5.1 11.1 ± 3.1Number (� 106/cm3) 1.88 ± 0.08 2.04 ± 0.06 6.96 ± 0.10 2.20 ± 0.10Count median diameter (nm) 27.3 ± 2.5 25.2 ± 1.7 26.5 ± 1.5 23.1 ± 1.6Geometric standard deviation 1.6 ± 0.0 1.6 ± 0.0 1.6 ± 0.0 1.6 ± 0.0
a Data are mean ± SD.

MW Frampton et al
15
No significant gender differences were found. InUPREST, the particle number DF was 0.68 ± 0.13 (mean ±SD) for men (n = 6) and 0.65 ± 0.12 for women (n = 6) (P =0.70). The corresponding mass DFs were 0.60 ± 0.13 and0.59 ± 0.14, respectively (P = 0.89). There were not enoughsubjects with usable data in the UPDOSE group to makegender comparisons. Analysis of all 19 exposures at restfrom both UPREST and UPDOSE groups also showed nosignificant gender difference.
The predicted overall DF was determined using threemodels. For the ICRP and NCRP models, input data werechosen to match our exposure conditions as closely as modelparameters would allow. For the MPPDep model, respiratoryand lung function data (including functional residualcapacity, tidal volume, and respiratory frequency) wereentered for each of the subjects in these studies. Figure 3compares the experimental DFs with predictions using theMPPDep model. Overall, the models predicted very littleincrease in DF with exercise, and the experimental data sig-nificantly exceeded model predictions during exercise(Figure 3). For example, using the MPPDep model for 26 nmparticles, breathing at 18 breaths/min with a VT of 722 mL,the predicted total DF is 0.624. With 25 breaths/min and VTof 1680 mL, the predicted DF increases slightly to 0.650. Thetracheobronchial DF decreases from 0.232 to 0.170, and thealveolar DF increases from 0.333 to 0.428.
Table 6 shows the rest and exercise values for the numberDF and total particle number deposition over a 1 hour. Thecombined effect of increased minute ventilation and an
Figure 2. Inspiratory and expiratory particle size distributions for onesubject each in the low UFP exposures (UPREST, UPDOSE, andUPASTHMA) and high UFP exposure (UPDOSE).
Table 5. Mean Particle DF by Particle Size in Three Protocolsa
MidpointDiameter(range, nm)
UPREST(12 subjects)
UPDOSEb
(7 subjects)UPASTHMA(16 subjects)
Rest Rest Exercise Rest Exercise
8.7 (7.5–10.0) 0.80 ± 0.09 0.74 ± 0.07 0.94 ± 0.02 0.84 ± 0.03 0.93 ± 0.0211.6 (10.0–13.3) 0.78 ± 0.08 0.74 ± 0.06 0.91 ± 0.02 0.83 ± 0.04 0.91 ± 0.0315.4 (13.3–17.8) 0.74 ± 0.09 0.68 ± 0.05 0.89 ± 0.03 0.80 ± 0.04 0.89 ± 0.0320.5 (17.8–23.7) 0.70 ± 0.12 0.63 ± 0.05 0.84 ± 0.04 0.77 ± 0.06 0.86 ± 0.0427.4 (23.7–31.6) 0.66 ± 0.13 0.60 ± 0.05 0.79 ± 0.05 0.72 ± 0.07 0.82 ± 0.05
36.5 (31.6–42.2) 0.59 ± 0.13 0.58 ± 0.05 0.75 ± 0.05 0.68 ± 0.08 0.77 ± 0.0648.7 (42.2–56.2) 0.55 ± 0.14 0.58 ± 0.05 0.72 ± 0.07 0.66 ± 0.08 0.75 ± 0.0664.9 (56.2–75.0) 0.55 ± 0.13 0.67 ± 0.07 0.72 ± 0.09 0.65 ± 0.09 0.73 ± 0.07Total DF by particle number 0.66 ± 0.12 0.63 ± 0.03 0.84 ± 0.04 0.76 ± 0.05 0.86 ± 0.04Total DF by particle mass 0.59 ± 0.13 0.60 ± 0.04 0.76 ± 0.06 0.69 ± 0.07 0.79 ± 0.06
a Data are mean ± SD.b DFs were usable for only 7 of the 12 subjects. Because they were similar, the DFs for 10 and 25 µg/m3 were averaged together.

16
Ultrafine Carbon Particles in Healthy and Asthmatic Subjects
increase in DF with exercise increased particle numberdeposition more than fourfold for the healthy subjects overthose with asthma.
For asthmatic subjects at rest, DF was significantlygreater than for healthy subjects at rest, and DF increasedfurther with exercise (Table 5). The number DF duringbreathing at rest was 0.76 ± 0.05 for subjects with asthmaand 0.63 ± 0.03 for healthy subjects (P < 0.001). With exer-cise, DF was not significantly different between healthyand asthmatic subjects.
RESPIRATORY SYMPTOMS AND PULMONARY FUNCTION
There was no evidence for significant or meaningfuleffects on pulmonary function in these studies, even in
subjects with asthma. Figure 4 shows the changes frombaseline for FEV1 in UPDOSE and UPASTHMA subjects.ANOVA showed marginal significance (P = 0.04) for aninteraction between exposure and gender for FEV1 in theUPDOSE study; however, the changes were small and noconcentration response was evident.
Exposure to UFP appeared to cause a small but statisti-cally significant reduction in minute ventilation under cer-tain conditions (Table 7). In UPDOSE subjects, the minuteventilation decreased with UFP exposure only during exer-cise, with a greater effect in males (UFP main effect, P =0.030; exposure � gender interaction, P = 0.025). InUPASTHMA subjects, minute ventilation decreased withUFP during breathing at rest (main effect, P = 0.007) with nogender difference. A small mean decrease was seen during
Figure 3. Observed and predicted total respiratory deposition of UFP (10 µg/m3) in 19 healthy subjects at rest (UPREST and UPDOSE) and in 7 healthysubjects during moderate exercise (UPDOSE). Particle deposition was calculated separately for 8 particle size bins. At rest. Actual experimental datashown are the mean ± SD. The predicted deposition for these subjects was calculated from the MPPDep (Chemical Industry Institute of Toxicology 1999).Total ICRP models (1994) were based on habitual mouth-breathing reference workers breathing at 1.2 m3/hr (Table F.1, page 416); NCRP models (1997)were based on the sum of naso-oro-pharyngo-laryngeal, tracheobronchial, and pulmonary deposition, (VT 770 cm3, breathing frequency 13; Table 5.2, page68). At exercise. ICRP predictions (1994) were based on habitual mouth-breathing reference workers breathing at 1.7 m3/hr (Table F.1, page 417); NCRPpredictions (1997) based on a VT of 2400 cm3 and breathing frequency of 25.
Table 6. Comparison of Number DF and Total Particles Deposited in Healthy (UPDOSE) and Asthmatic (UPASTHMA) Subjects Exposed to 10 µg/m3 of UFP for 2 Hoursa
UPDOSE UPASTHMA
Rest Exercise Rest Exercise
Number DF 0.63 ± 0.03 0.84 ± 0.04 0.76 ± 0.05 0.86 ± 0.04Mass DF 0.59 ± 0.03 0.77 ± 0.05 0.69 ± 0.07 0.79 ± 0.06Total number deposited (� 1012) 0.79 ± 0.24 3.35 ± 0.90 1.22 ± 0.23 4.79 ± 1.19Total mass deposited (µg) 3.83 ± 0.39 15.31 ± 0.84 5.83 ± 2.37 22.56 ± 8.96
a Mean ± SD.

MW Frampton et al
17
exercise as well, but was not statistically significant. Forsubjects with asthma, this reduction in minute ventilationwas accounted for by a small but significant reduction intidal volume (P = 0.01) with no change in respiratory rate.These findings suggest the possibility of very mild irritanteffects of the UFP exposures.
UFP exposure had no measurable effect on respiratorysymptoms. Total symptom scores and individual sums ofscores for respiratory symptoms were similar with air andUFP exposures. Subjects were not able to identify theexposure atmosphere more often than expected by chance.
VITAL SIGNS AND OXYGEN SATURATION
No significant effects on systolic or diastolic blood pres-sure or heart rate were found in any of the studies. TheUPREST data showed a marginally significant interactionof time, exposure, and gender on oxygen saturation(P = 0.047), with saturation slightly increased after UFPexposure relative to air in males. In the UPDOSE group, asignificant exposure-gender interaction was apparent foran effect on oxygen saturation (P = 0.02) with oxygen satu-ration decreasing slightly in females at 21 hours after expo-sure (only with the higher concentration of UFP)(Figure 5). Oxygen saturation had no significant effect inthe UPASTHMA group. We concluded that no convincingeffects on oxygen saturation occurred with exposure toUFP at these concentrations.
MARKERS OF LOCAL AIRWAY INFLAMMATION
Airway inflammation was assessed using markers foundin induced sputum and measurements of airway produc-tion of NO. Tables 8 and 9 compare markers of airwayinflammation and airway NO production in healthy sub-jects and asthmatic subjects prior to exposure (baseline).As expected, sputum from subjects with asthma contained
Figure 4. Change in FEV1 between baseline and end of monitoring period(UPDOSE and UPASTHMA). Data represent means ± SE.
Table 7. Respiratory Measurements During Exposurea
UPDOSE UPASTHMA
Air 10 µg/m3 UFP 25 µg/m3 UFP Air 10 µg/m3 UFP
Rest Exercise Rest Exercise Rest Exercise Rest Exercise Rest Exercise
VE (L/min) 11.9±3.3 39.1±5.1 11.3±2.0 34.2±8.5 10.9±2.1 34.5±10.0 13.8±2.3 43.4±9.5 12.8±1.8 41.9±9.0
VT (L) 0.71±0.25 1.54±0.63 0.71±0.25 1.42±0.50 0.63±0.14 1.34±0.38 0.76±0.13 1.74±0.44 0.74±0.12 1.71±0.46
Respirationb 17.3±3.9 26.6±6.3 17.0±3.7 25.4±5.7 17.7±3.9 26.7±6.8 18.1±1.9 25.3±3.3 17.4±2.3 25.1±3.7
a Data are mean ± SD.b Breaths per minute.

18
Ultrafine Carbon Particles in Healthy and Asthmatic Subjects
a higher percentage of eosinophils. In addition, VUNO wasmore than fivefold higher in asthmatic subjects comparedwith healthy subjects (P = 0.014). In contrast, PA was morethan 50% lower in subjects with asthma (P = 0.004), andDLNO was also reduced (P = 0.031).
No convincing evidence was found to suggest a signifi-cant airway inflammatory response to carbon UFP expo-sure in any of the three groups. UFP exposure had no effecton total sputum cell recovery (Figure 6). UFP exposurewas associated with a small, but statistically significant,
Figure 5. Blood oxygen saturation, UPDOSE. Actual values for all subjectsand differences from baseline for females and males. Baseline values: air,97.42% ± 0.36; 10 µg/m3, 97.42% ± 0.31; 25 µg/m3, 97.17% ± 0.49. Datarepresent mean ± SE.
Table 8. Cell Differential Counts from Sputum of Healthy Subjects (UPDOSE) and Asthmatic Subjects (UPASTHMA) at Screeninga
UPDOSE UPASTHMA P Value
Alveolar macrophages
49.3± 6.3 48.9 ± 6.3 0.73
Lymphocytes 1.7± 0.5 1.4 ± 0.4 0.406PMNs 40.5± 8.0 19.0 ± 4.8 0.019Eosinophils 0.4± 0.3 10.2 ± 4.6 0.047Epithelial cells 8.1± 3.7 20.5 ± 4.5 0.019
a Data are percent of total cells (mean ± SE).
Table 9. Airway NO Production Before Exposure in Healthy Subjects (UPDOSE) and Asthmatic Subjects (UPASTHMA)a
UPDOSE UPASTHMA P Value
PA (mm Hg�10�6) 1.6 ± 0.2 0.74 ± 0.24 0.004
VUNO (µL/min) 0.06 ± 0.01 0.32 ± 0.09 0.014
DLNO (mL/min�mmHg)
166.3 ± 9.5 191.6 ± 19.0 0.246
VLNO (µL/min) 0.26 ± 0.02 0.14 ± 0.05 0.031
a Data are mean ± SE.
Figure 6. Sputum cell differential counts (21 hours after exposure ended)expressed as percentage of total cells. Data represent means ± SE. * UFPexposure was associated with a significant increase in percentage of alve-olar macrophages in subjects with asthma (P = 0.019). MAC = macroph-ages, LYM = lymphocytes, PMN = polymorphonuclear leukocytes, EPITH= epithelial cells, and EOS = eosinophils.

MW Frampton et al
19
increase in the percentage of alveolar macrophages in sub-jects with asthma (P = 0.019). UFP exposure was not asso-ciated with significant changes in other cell types. In all 3groups, concentrations of inflammatory cytokines IL-6 andIL-8 in the sputum sol were unaffected by UFP exposure.There were no convincing UFP effects on alveolar or con-ducting airway NO production in any group. In theUPDOSE group, the ANOVA suggested a significant inter-action between UFP exposure and gender for VLNO
(P = 0.009) with a slight reduction in males 3.5 hours afterexposure to 25 µg/m3 UFP compared with air and 10 µg/m3
UFP. DLNO increased slightly with exposure to 25 µg/m3
UFP, compared with exposure to air (P = 0.022). Therewere no significant differences in NO production inUPASTHMA subjects. Overall, there was no evidence forincreased airway inflammation in response to UFP expo-sure in either healthy subjects or subjects with asthma.
MARKERS OF SYSTEMIC INFLAMMATION
Plasma concentrations of the inflammatory cytokine IL-6, CD40 ligand, plasma nitrite/nitrate (NO2/NO3) levels,and the soluble adhesion molecules E-, P-, and L-selectin,VCAM-1, and ICAM-1 were measured as indicators of sys-temic or vascular inflammation. Serum amyloid A concen-tration assessed the presence of an acute phase response.At baseline, subjects with asthma showed higher concen-trations of soluble VCAM-1 and L -selectin only, comparedwith healthy subjects (Table 10).
In UPDOSE subjects, IL-6, soluble ICAM-1, and solubleVCAM-1 showed significant changes over time, possiblyrelated to the effects of exercise during exposure and/ordiurnal factors. IL-6 showed a marginally significant expo-sure-gender interaction (P = 0.036, Figure 7), similar to thatseen with fibrinogen and vWf. IL-6 increased after UFPexposure in both males and females, likely in response toexercise. This IL-6 increase was blunted in association withUFP exposure (in males only) in a concentration-responsefashion. A statistically significant main effect of UFP onsoluble VCAM-1 concentrations was indicated by theANOVA (P = 0.032); however, the change was small,without a concentration-related response (Figure 8). Sol-uble CD40 ligand also showed significant changes relatedto UFP exposure (Figure 9), with a UFP concentration-related decrease UFP 21 hours after exposure. However,
Figure 7. Plasma concentrations of IL-6, UPDOSE. Differences from base-line for all subjects, females, and males. Baseline values: air, 1.52 ± 0.44pg/mL; 10 µg/m3, 1.13 ± 0.19 pg/mL; 25 µg/m3, 1.33 ± 0.21 pg/mL. Datarepresent means ± SE.
Table 10. Markers of Systemic and Vascular Inflammation in Healthy Subjects (UPDOSE) and Asthmatic Subjects (UPASTHMA) Before Exposurea
UPDOSE UPASTHMAP
Value
IL-6 (pg/mL) 1.3±0.2 1.6 ± 0.2 0.263sICAM-1 (ng/mL)b 201.2±19.6 158.8 ± 6.6 0.06sCD40L (ng/mL)b 0.89±0.3 3.9 ± 1.6 0.086sVCAM-1 (ng/mL)b 297.2±24.0 367.6 ± 14.9 0.022
sE-Selectin (ng/mL)b 43.8±4.4 44.9 ± 4.5 0.868sL-Selectin (ng/mL)b 830.3±60.0 1123.3 ± 46.5 0.001sP-Selectin (ng/mL)b 51.2±5.1 49.1 ± 3.5 0.74NO2/NO3 (µM) 29.8±3.6 21.1 ± 2.6 0.065
SAA (ng/mL � 103) 23.9±13.7 8.1 ± 3.7 0.287Factor VII(% of normal)
104.1±13.4 97.3 ± 3.9 0.637
Fibrinogen (mg/dL) 256.2±25.0 250.1 ± 9.0 0.824vWf (% of normal) 95.8±13.5 117.4 ± 16.7 0.324
a Data are mean ± SE. SAA = serum amyloid A.b Soluble molecules.

20
Ultrafine Carbon Particles in Healthy and Asthmatic Subjects
small differences among exposures were also seen at base-line, raising the possibility that the statistical findingswere a chance occurrence. There were no significantchanges in plasma NO2/NO3 concentrations.
In the UPASTHMA group, there were no significantUFP-related changes in IL-6 or serum amyloid A. SolubleE-selectin decreased (P = 0.027) in association with UFPexposure relative to air exposure (Figure 10). Overall, noevidence was found that UFP exposure increased bloodcytokines or soluble adhesion molecules. However, thedifference between air and UFP exposure was significantfor plasma NO2/NO3 concentrations in the UPASTHMAgroup, with concentrations decreasing after air exposurewith exercise and slightly increasing after UFP exposure inmales (Figure 11).
BLOOD LEUKOCYTES
Cell distribution, phenotype, and adhesion moleculeexpression in blood were measured as indirect indicatorsof change in endothelial function and systemic inflamma-tion. The complete blood count and differential leukocytecounts were measured using standard automated methodsin the clinical laboratory of Strong Memorial Hospital.Lymphocyte differential counts were also measured usingimmunofluorescence labeling and flow cytometry (seeMethods). In UPDOSE and UPASTHMA groups, therewere significant time-related changes in white blood cells(WBCs), RBCs, hematocrit, and hemoglobin, likely relatedto exercise, diurnal effects, and repeated phlebotomy.Hemoglobin, hematocrit, percentage of eosinophils, andRBC counts were higher in subjects with asthma than inhealthy subjects (Table 11).
Figure 8. Plasma concentrations of soluble VCAM-1, UPDOSE. Actualvalues and difference from baseline. Data represent means ± SE.
Figure 9. Plasma concentrations of soluble CD40 ligand, UPDOSE.Actual value and difference from baseline. Data represent means ± SE.

MW Frampton et al
21
In healthy subjects at rest, UFP exposure did not altertotal WBCs, differential counts, hemoglobin, or hemat-ocrit. A significant interaction between time and UFPexposure was seen for hemoglobin, but there was no clearconcentration response and no significant changes inRBCs, hematocrit, or RBC indices.
In the UPDOSE group, WBCs increased significantlyafter all exposures (time effect, P < 0.001) with a slightlysmaller increase after exposure to 25 µg/m3 UFP that wasnot statistically significant (UFP effect, P = 0.08). PMN per-centage increased after all exposures, whereas other leuko-cytes decreased. There was evidence for a concentration-related effect of UFP exposure on the percentage of bloodmonocytes, with the response differing by gender(Figure 12). With all exposures, monocyte percentagedecreased after exposure, and then increased the followingmorning. In females, after exposure to 25 µg/m3 UFP,monocytes showed a greater reduction and did not return
Figure 10. Plasma concentrations of soluble E-selectin, UPASTHMA.Actual values and difference from baseline. Data represent means ± SE.
Figure 11. Plasma concentrations of NO2/NO3, UPASTHMA, Differencesfrom baseline. All subjects, females, and males. Baseline values: air, 23.59± 3.28 µM; UFP, 20.05 ± 2.12 µM. Data represent means ± SE.
Table 11. Complete Blood Cell Counts Before Exposure in Healthy Subjects (UPDOSE) and Asthmatic Subjects (UPASTHMA)a
UPDOSE UPASTHMA P Value
WBC (� 103/µL) 5.75 ± 0.4 6.0 ± 0.3 0.57RBC (� 106/µL) 4.4 ± 0.1 4.7 ± 0.1 0.028Hemoglobin (g/dL) 13.1 ± 0.3 14.1 ± 0.3 0.026Hematocrit (%) 38.1 ± 0.9 41.9 ± 1.0 0.009Platelet count(� 103/µL)
223.3 ± 9.2 210.1 ± 9.5 0.329
Neutrophils (%) 49.3 ± 2.6 51.5 ± 1.8 0.487Lymphocytes (%) 38.1 ± 2.5 33.5 ± 1.8 0.144Monocytes (%) 8.3 ± 0.5 8.3 ± 0.5 1.00Eosinophils (%) 3.7 ± 0.5 5.9 ± 0.7 0.013Basophils (%) 0.9 ± 0.1 0.9 ± 0.2 0.831
a Data are mean ± SE.

22
Ultrafine Carbon Particles in Healthy and Asthmatic Subjects
to baseline values 21 hours after exposure (Figure 12). TheANOVA indicated a significant exposure-gender interac-tion (P = 0.002). A similar reduction was seen when mono-cyte numbers were analyzed by flow cytometry (maineffect, P = 0.035; exposure-gender interaction, P = 0.002). Infemales only, a significant decrease in blood basophils wasseen with both UFP concentrations (exposure-gender inter-action P = 0.015, Figure 13). These changes were accompa-nied by small, nonsignificant enhanced increases in thepercentage of PMNs.
In the UPASTHMA group, UFP exposure had no signifi-cant effect on WBCs, RBCs, hemoglobin, or hematocrit.Time-related changes were seen as expected. A significantinteraction of exposure and time was seen for basophils(P = 0.02; Figure 14), which decreased at 0 and 3.5 hoursafter UFP exposure compared with air exposure without asignificant gender difference. The percentage of blood eosi-nophils was sufficient for enumeration both in the clinical
laboratory and by flow cytometry. Both methods showedreductions in eosinophil percentage at 0 and 3.5 hoursafter exposure, with greater reductions after UFP exposurethan after air exposure. However, the differences were sig-nificant by ANOVA only for the flow cytometry measure-ments (P = 0.049, Figure 15). These data suggest thatexposure to UFP causes reductions in blood monocytes inhealthy females and reductions in basophils in both healthyand asthmatic subjects.
LYMPHOCYTE SUBSETS AND ACTIVATION
The percentage of T lymphocytes expressing the activa-tion marker CD25 was higher in asthmatic subjects than inhealthy subjects prior to exposure (UPDOSE: 27.0 ± 2.5%vs UPASTHMA: 33.0 ± 3.3%, P = 0.04). For UPREST andUPDOSE subjects, there were no main UFP effects on lym-phocyte subsets, expression of the activation marker CD25,
Figure 12. Percentage of monocytes, UPDOSE. Differences from baseline. Allsubjects, females, and males. Baseline values: air, 8.42 ± 0.48%; 10 µg/m3,8.33 ± 0.40%; 25 µg/m3, 8.50 ± 0.40%. Data represent means ± SE.
Figure 13. Percentage of basophils, UPDOSE. Differences from baseline. Allsubjects, females, and males. Baseline values: air, 0.92 ± 0.15%; 10 µg/m3,1.00 ± 0.00%; 25 µg/m3, 1.08 ± 0.08%. Data represent means ± SE.

MW Frampton et al
23
or memory T cells (CD45RO+). UPREST subjects showed astatistically significant time-exposure interaction for thepercentage of T lymphocytes expressing neither CD4 norCD8 (null T cells), but no other T lymphocyte subsetchanges were found. No effect on null T cells was seen inUPDOSE subjects. Also in the UPDOSE group, significantinteractions were evident between UFP exposure andgender for CD25 expression on CD3+ T cells (P = 0.002,Figure 16) and for memory T cells (P = 0.018, data notshown). Expression of CD25 increased early after exposureto 25 µg/m3 UFP in females only. Changes in memory Tcells lacked clear relation to concentration in both malesand females.
In the UPASTHMA group, the percentage of CD4+ T cellsdecreased immediately after exposure to UFP, comparedwith air (exposure–time interaction, P = 0.021; Figure 17).No significant effects were evident on other lymphocytesubsets or on CD25 expression. Overall, the data suggestthat UFP exposure induced T-lymphocyte activation inhealthy females and sequestration in asthmatic subjects.
LYMPHOCYTE CYTOKINE PROFILE
As shown in Table 12, approximately 0.1% of cells werepositive for IFN-�, and approximately 0.015% of cellswere positive for IL-4 with no significant differencesbetween air and UFP exposures.
BLOOD LEUKOCYTE EXPRESSION OF ADHESION MOLECULES AND Fc RECEPTORS
Cell surface expression of adhesion molecules on bloodleukocytes reflects influences that are both direct and indi-rect. As noted in our original hypothesis, direct leukocyteactivation by proinflammatory cytokines or other media-tors, generated as part of an airway inflammatory responseto UFP exposure, was expected to increase expression.Alternatively, activation of vascular endothelium may alterthe apparent expression of adhesion molecules in venousblood leukocytes because cells with a higher density oraffinity of surface adhesion molecules are more likely to beslowed or retained within the activated vascular bed.
Figure 14. Percentage of basophils, UPASTHMA. Actual values and dif-ference from baseline. Data represent means ± SE.
Figure 15. Percentage of eosinophils, UPASTHMA. Actual values anddifference from baseline. Data represent means ± SE.

24
Ultrafine Carbon Particles in Healthy and Asthmatic Subjects
Figure 16. Percentage of blood T lymphocytes expressing CD3+CD25+,UPDOSE. Differences from baseline. All subjects, females, and males.Baseline values: air, 27.9 ± 2.7%; 10 µg/m3, 26.6 ± 3.1%; 25 µg/m3,26.2 ± 2.6%. Data represent means ± SE.
Figure 17. CD4+ as a percentage of total T lymphocytes, UPASTHMA. Dif-ferences from baseline. Baseline values: air, 46.3 ± 2.2%; UFP,46.2 ± 2.8%. Data represent means ± SE.
Table 13. Blood Leukocyte Markers Before Exposure in Both Healthy and Asthmatic Subjects
UPDOSE UPASTHMA P Value
LymphocytesCD11a 41,710± 1844 14,575± 4161 < 0.001CD11b 1460± 67 1784± 107 0.017CD16 1538± 115 1740± 123 0.242
CD23 1580± 62 2850± 615 0.057CD32 1594± 74 1986± 122 0.011CD49d 8168± 335 10,486± 324 < 0.001
CD54 2381± 69 2964± 155 0.003CD62L 21,468± 1246 25,003± 1497 0.081CD64 1419± 42 1780± 78 < 0.001
MonocytesCD11a 64,155± 4041 26,220± 5260 < .001CD11b 17,944± 915 25,047± 2751 0.025CD16 3238± 162 4237± 222 0.001
CD23 3095± 117 4525± 556 0.023CD32 55,199± 5314 87,051± 2675 < 0.001CD49d 13,556± 915 17,089± 642 0.005
CD54 12,314± 401 17,942± 1065 < 0.001CD62L 41,358± 3326 50,244± 5307 0.169CD64 61,391± 2481 62,735± 4043 0.779
PMNsCD11a 28,358± 904 12,753± 2276 < 0.001CD11b 16,868± 1055 24,178± 2705 0.021CD16 330,263± 35,151 466,724± 31,525 0.008
CD23 4212± 313 5291± 437 0.056CD32 65,813± 8320 111,986± 3953 < 0.001CD49d 7189± 545 5292± 282 0.007
CD54 5045± 296 5661± 283 0.146CD62L 63,591± 4614 80,656± 5954 0.032CD64 8902± 593 8668± 522 0.769
Table 12. Lymphocyte Cytokine Expressiona
Exposure
IFN-� IL-4
Air UFP Air UFP
Before 973 ± 117 967 ± 120 176 ± 27 153 ± 26After
21 hours 942 ± 151 911 ± 154 175 ± 31 139 ± 1545 hours 1186 ± 230 916 ± 119 233 ± 44 187 ± 36
a Positive cells/106 mononuclear cells (mean ± SE).

MW Frampton et al
25
As expected, we found differences between healthy andasthmatic subjects in leukocyte expression of surfacemarkers at baseline (Table 13). For example, in subjectswith asthma, monocyte CD54 (ICAM-1) expression washigher (P = 0.003) and CD11a expression lower (P < 0.001)than in healthy subjects.
In the UPREST group, there were few main changes afterUFP exposure. Blood monocytes showed a small increasein expression of CD54 in females (P = 0.028; exposure �gender, P = 0.032). Lymphocytes showed a small increasein expression of CD49d (P = 0.013) and CD11b in females(exposure � gender, P = 0.002). Overall, significance levelsfor the surface marker endpoints were relatively modest.The data did not suggest a consistent biological responseor a convincing gender difference in the overall response.
For the UPDOSE group, the ANOVA showed severalgender-related differences in leukocyte surface markerexpression. These differences suggest that the exercise in theUPDOSE protocol may have affected leukocytes differently
in men and women. For example, Figure 18 compares malesand females in the UPDOSE group for the change from base-line in expression of CD11a and CD62L on PMNs, andCD49d and CD54 on monocytes. In general, females showeda reduction in expression of these markers after air exposurewith exercise, compared with males.
UFP exposure led to a significant effect on PMN expres-sion of Fc receptors for IgE (CD23, P = 0.01) and immunoglo-bulin G (IgG) (CD32, P = 0.017; CD64, P = 0.001) (Figure 19).Expression of CD32 and CD49d on PMNs showed signifi-cant exposure–gender interactions. CD32 expressionshowed a slight reduction after UFP exposure comparedwith air exposure, and CD64 expression also showed aslight reduction after exposure to 25 µg/m3 UFP. Lympho-cyte CD23 expression showed significant differences amongthe 3 exposures (P = 0.007), but there was no clear concen-tration response. Monocyte expression of CD54 (ICAM-1)decreased after exposure in a concentration-response pat-tern (P = 0.001) with the greatest effect occurring at 0 and 3.5
Figure 18. Expression of adhesion molecules after air exposure, UPDOSE. Data represent means ± SE after air exposure only.

26
Ultrafine Carbon Particles in Healthy and Asthmatic Subjects
hours after exposure and the differences resolved by21 hours after exposure (Figure 20). CD32 expressiondecreased slightly in a concentration-related manner (P =0.048). Expression of CD62L (L-selectin) showed a signifi-cant exposure–gender interaction (P = 0.006, data notshown) with expression increasing in females but decreasingin males relative to air exposure. However, these findingslacked a clear concentration response.
Overall, the findings in the UPDOSE group appeared toprovide evidence for modest effects of UFP exposure, withexercise, on blood monocyte number and leukocyteexpression of surface markers. In general, surface markerexpression decreased in association with UFP exposure;this change was consistent with retention of higherexpressing cells within the capillary bed.
In the UPASTHMA group, blood monocytes showed asignificant reduction in CD11b expression after exposure(P = 0.029, Figure 21). Expression of CD54 on PMNsdecreased in a time-related fashion with the greatest differ-ence between air and UFP exposures at 45 hours after
exposure; the related time–exposure interaction was sig-nificant (P = 0.031, Figure 22). Expression of CD62L onPMNs showed a significant exposure–gender interactionwith an increase in expression of CD62L in males only(Figure 23). No convincing evidence was found for signifi-cant effects on blood lymphocyte adhesion moleculeexpression. Lymphocyte CD16 expression showed a signif-icant main effect of UFP (P = 0.017, data not shown), butthe data suggest a small difference at baseline with regres-sion toward the mean.
The most significant effect on leukocyte surface moleculeexpression in asthmatic subjects appeared to be on eosino-phils. As noted previously, a small exposure-related reduc-tion was found in eosinophil percentage from the blood
Figure 19. PMN expression of Fc receptors for IgG (CD64 and CD32) andIgE (CD23), UPDOSE. Difference from baseline. Data representmeans ± SE.
Figure 21. Monocyte expression of CD11b, UPASTHMA. Differences frombaseline. Baseline values: air, 21.8 ± 2.4 � 103 MESF ; UFP, 23.9 ± 3.1 �103 MESF . Data represent means ± SE.
Figure 20. Monocyte expression of CD54 (ICAM-1), UPDOSE. Differencesfrom baseline. Baseline values: air, 12.2 ± 0.3 � 103 MESF; 10 µg/m3,12.5 ± 0.5 � 103 MESF; 25 µg/m3, 13.7 ± 0.7 � 103 MESF. Data representmeans ± SE.

MW Frampton et al
27
leukocyte differential count. In addition to this early reduc-tion in eosinophil number, eosinophil expression of CD32(time-exposure interaction, P = 0.015) and CD11b (maineffect, P = 0.015, Figure 24) showed a delayed reduction.
In summary, data on leukocyte expression of adhesionmolecules in UPASTHMA subjects were similar to thefindings for healthy subjects and suggested modest effectsof UFP exposure with exercise. In general, the effectappears to be a reduction in expression, or a blunting ofthe postexposure increase seen after air exposure.
MARKERS OF BLOOD COAGULATION
UFP exposure had no main effects in any of the studies.In the UPDOSE group, the ANOVA for both fibrinogen andvWf yielded significant interactions between UFP expo-sure and gender (P = 0.001 and P = 0.005, respectively). Asshown in Figure 25, both fibrinogen and vWf decreased, inmales only, after exposure to 25 µg/m3 UFP, comparedwith air and 10 µg/m3 UFP. In the UPASTHMA group,there were no significant effects on coagulation factors.These data do not provide evidence for activation of thecoagulation cascade by UFP exposure.
CARDIAC MONITORING
UPREST
Few significant changes in ECG parameters were observedafter UFP exposure in young healthy subjects under restingconditions. Heart rate variability and repolarizationparameters are shown in Tables 14 and 15. SDNN and
rMSSD showed somewhat increased values during,immediately after, and 3 hours after UFP exposure than afterair, but the differences for SDNN were not significant(Figure 26). PNN50 and rMSSD showed significantexposure-time interactions (P = 0.039 and P = 0.032,respectively), but the differences were small. For rMSSD, a
Figure 22. PMN expression of CD54 (ICAM-1), UPASTHMA. Differencesfrom baseline. Baseline values: air, 56.8 ± 2.3 � 102 MESF; UFP, 63.2 ± 4.5� 102 MESF. Data represent means ± SE.
Figure 23. PMN expression of CD62L (L-selectin), UPASTHMA. Differ-ences from baseline. Baseline values: air, 78.3 ± 3.7 � 103 MESF; UFP,78.1 ± 6.3 � 103 MESF. Data represent means ± SE.
Figure 24. Eosinophil expression of CD11b, UPASTHMA. Differencesfrom baseline. Baseline values: air, 59.8 ± 3.5 � 103 MESF; UFP, 57.8 ±2.8 � 103 MESF. Data represent means ± SE.

28
Ultrafine Carbon Particles in Healthy and Asthmatic Subjects
Figure 25. Plasma concentrations of fibrinogen and vWf, UPDOSE. Differences from baseline. Data represent means ± SE.
Figure 26. Time domain HRV, UPREST. Differences from baseline. SDNN and rMSSD. Data represent mean ± SE.

MW Frampton et al
29
Table 14. Heart Rate Variability in UPREST, Differences from Baselinea
ECG Parameter/Exposure
DuringExposure
Hours After Exposure Ended
0 3.5 15 21
RR (msec)Air 20 ± 42 169 ± 35 �4 ± 25 80 ± 48 �34 ± 39UFP 16 ± 40 140 ± 31 �37 ± 45 71 ± 28 0.6 ± 21
SDNN (msec)Air 29 ± 12 16 ± 17 �7 ± 8 0 ± 9 �6 ± 11UFP 35 ± 13 26 ± 8 13 ± 12 2 ± 17 33 ± 12
rMSSD (msec)Air 19 ± 15 20 ± 21 �10 ± 9 8 ± 10 �13 ± 12UFP 31 ± 19 27 ± 9 2 ± 11 9 ± 22 25 ± 12
Low frequency (Hz)Air 1411 ± 707 1213 ± 1435 �402 ± 511 367 ± 529 �228 ± 791UFP 1692 ± 449 693 ± 336 508 ± 321 486 ± 635 833 ± 482
High frequency (Hz)Air 2022 ± 1706 672 ± 1665 �917 ± 680 686 ± 537 �1188 ± 925UFP 2566 ± 1459 1315 ± 696 44 ± 779 1022 ± 1655 2407 ± 1261
Low frequency/high frequencyAir 0.68 ± 0.45 �0.46 ± 0.29 0.15 ± 0.25 0.12 ± 0.59 0.42 ± 0.42UFP 0.30 ± 0.23 �0.28 ± 0.24 0.31 ± 0.58 0.10 ± 0.31 �0.03 ± 0.17
a Data are mean ± SE.
Table 15. Cardiac Repolarization Parameters in UPREST Group, Differences from Baseline
ECG Parameter/Exposure
DuringExposure
Hours After Exposure Ended
0 3.5 15 21
QTc (msec)Air �8 ± 5 �11 ± 5 1 ± 3 �7 ± 12 3 ± 4UFP �3 ± 4 �4 ± 4 �0.4 ± 7 �6 ± 11 0.8 ± 5
T wave amplitude (µV)Air 26 ± 19 43 ± 21 �44 ± 24 �44 ± 21 2 ± 18UFP 31 ± 17 23 ± 16 �50 ± 18 �37 ± 16 24 ± 12
PCAAir �3 ± 1 �0.7 ± 0.9 �0.06 ± 1.9 1.5 ± 1 �1 ± 1UFP �3 ± 0.7 �0.4 ± 0.7 0.9 ± 0.5 0.5 ± 1 �0.8 ± 0.9
PCA variabilityAir 0.21 ± 0.14 0.02 ± 0.16 0.07 ± 0.13 0.15 ± 0.10 0.04 ± 0.08UFP 0.37 ± 0.13 0.13 ± 0.08 0.61 ± 0.42 0.08 ± 0.11 0.37 ± 0.10
ST in L2 (µV)Air 8 ± 5 �1 ± 3 �12 ± 4 3 ± 4 �1 ± 5UFP 10 ± 5 2 ± 3 �12 ± 2 10 ± 4 6 ± 4
ST in V2 (µV)Air �4 ± 2 �3 ± 3 �6 ± 4 �10 ± 5 �9 ± 4UFP �2 ± 2 0 ± 2 �3 ± 2 �10 ± 4 �7 ± 4
ST in V5 (µV)Air �2 ± 4 �4 ± 3 �16 ± 6 �7 ± 6 �12 ± 7UFP 7 ± 2 4 ± 2 �7 ± 3 4 ± 3 0.3 ± 3

30
Ultrafine Carbon Particles in Healthy and Asthmatic Subjects
Table 16. Heart Rate Variability, Differences from Baseline, UPDOSE Protocol
ECG Parameter/Exposure
DuringExposure
Hours After Exposure Ended
0 3.5 15 21
RR (msec)Air �300 ± 40 �110 ± 35 �117 ± 37 63 ± 53 �22.8 ± 3010 µg/m3 UFP �275 ± 26 �84 ± 26 �91 ± 28 77 ± 35 27 ± 1925 µg/m3 UFP �333 ± 50 �70 ± 44 �101 ± 30 37 ± 54 �72 ± 29
SDNN (msec)Air �12 ± 12 3 ± 6 �7 ± 12 �9 ± 13 7 ± 710 µg/m3 UFP 15 ± 10 5 ± 4 7 ± 8 3 ± 5 12 ± 725 µg/m3 UFP �17 ± 15 4 ± 17 �18 ± 13 �11 ± 15 �6 ± 7
rMSSD (msec)Air �33 ± 13 11 ± 15 �20 ± 17 �5 ± 18 5 ± 710 µg/m3 UFP �8 ± 7 �3 ± 4 �2 ± 10 12 ± 7 14 ± 1025 µg/m3 UFP �33 ± 19 �3 ± 23 �30 ± 18 �9 ± 20 �12 ± 6
Low frequency (Hz)Air �622 ± 249 �583 ± 438 �354 ± 499 �272 ± 531 �41 ± 30310 µg/m3 UFP 380 ± 388 480 ± 329 534 ± 416 345 ± 287 389 ± 21925 µg/m3 UFP �1734 ± 1030 147 ± 1657 �1264 ± 1134 �961 ± 1153 �436 ± 695
High frequency (Hz)Air �1835 ± 1223 �997 ± 1132 �1610 ± 1273 �1025 ± 1375 518 ± 50610 µg/m3 UFP �383 ± 151 175 ± 197 �32 ± 221 470 ± 323 1418 ± 105625 µg/m3 UFP �2295 ± 1644 100 ± 2071 �1864 ± 1662 �1314 ± 1665 �111 ± 252
Low frequency/high frequencyAir 3 ± 1 �0.4 ± 0.6 0.1 ± 1.0 �0.5 ± 0.9 �1.3 ± 0.910 µg/m3 UFP 3 ± 0.6 0.5 ± 0.3 1 ± 0.4 0 ± 0.3 �0.3 ± 0.225 µg/m3 UFP 2 ± 1 �0.5 ± 1 �0.1 ± 1.0 �0.9 ± 0.8 �0.2 ± 0.4
difference in the preexposure values may have influencedthe analysis results. Repolarization duration, measured bythe QTc corrected using the Bazett formula, did not change.T-wave amplitude and complexity and ST segment positiondid not change. We concluded from these data that therewere no significant effects of the resting UFP exposures onheart rate, heart rate variability, repolarization, or the STsegment in young, healthy subjects.
UPDOSE
Similar analyses were performed for the ECG recordingsobtained in young, healthy subjects during the UPDOSE pro-tocol with exercise. The results are shown in Tables 16 and 17for parameters of heart rate variability and repolarization.
Exercise had profound effects on the ECG parametersrecorded during exposure to air or either UFP concentration.The ANOVA showed highly significant time-related effectsfor most ECG parameters.
Similar to observations for the UPREST group, SDNNand rMSSD showed higher values with exposure to
10 µg/m3 UFP than with air exposure. Frequency domainparameters of heart rate variability showed a similar pat-tern, but this effect was not observed during exposure to 25µg/m3 UFP. When analyzing these parameters using nor-malized units, we observed that the response of the para-sympathetic system (measured by normalized units of HFcomponents) was blunted during recovery from exerciseimmediately after UFP exposure in comparison to airexposure (Figure 27). This diminished vagal response wasnot evident 3.5 hours later.
Analysis of the QT interval duration also showed ablunted response after UFP exposure in comparison to airexposure. Figure 28 shows that the QT and QTc shortenedduring exercise but shortened more substantially duringUFP exposure than during air exposure. Further, the QTand QTc intervals remained shortened for several hoursafter UFP exposure compared with air exposure. Simulta-neously, T wave amplitude was slightly higher after exer-cise with UFP exposure than after exercise with airexposure (P = 0.026, data not shown).

MW Frampton et al
31
Table 17. Cardiac Repolarization Parameters in UPDOSE Group, Differences from Baseline
ECG Parameter/Exposure
DuringExposure
Hours After Exposure Ended
0 3.5 15 21
QTc (msec)Air 37 ± 10 19 ± 9 21 ± 7 10 ± 5 23 ± 910 µg/m3 UFP 23 ± 7 6 ± 5 5 ± 5 �3 ± 10 1 ± 525 µg/m3 UFP 27 ± 11 0.1 ± 4 5 ± 3 �5 ± 9 7 ± 4
T wave amplitude (µV)Air �75 ± 42 74 ± 26 �41 ± 36 �42 ± 22 6 ± 2210 µg/m3 UFP �41 ± 38 106 ± 24 3 ± 25 �13 ± 22 38 ± 1825 µg/m3 UFP �66 ± 40 86 ± 34 �9 ± 21 �18 ± 26 28 ± 18
PCAAir �1 ± 2 �2 ± 2 1 ± 2 �1 ± 0.8 �1 ± 110 µg/m3 UFP �2 ± 1 �3 ± 1 �0.1 ± 0.8 1 ± 2 �0.3 ± 0.825 µg/m3 UFP 0 ± 2 �2 ± 0.6 0.3 ± 1 �0.4 ± 0.9 �1 ± 1
PCA variabilityAir 3 ± 1 �0.01 ± 0.48 0.7 ± 0.6 �0.2 ± 0.4 �0.1 ± 0.510 µg/m3 UFP 4 ± 1 �0.6 ± 0.4 �0.4 ± 0.5 0.2 ± 0.9 �0.03 ± 0.7225 µg/m3 UFP 4 ± 0.7 0.1 ± 0.4 0.5 ± 0.7 �0.1 ± 0.3 0.4 ± 0.5
ST in L2 (µV)Air �20 ± 8 �0.3 ± 4 0.7 ± 6 0.8 ± 3 0 ± 510 µg/m3 UFP �18 ± 12 0.7 ± 5 2 ± 4 �1 ± 3 �3 ± 525 µg/m3 UFP �17 ± 7 2 ± 5 1 ± 4 �0.7 ± 2 0.5 ± 2
ST in V2 (µV)Air �19 ± 7 �7 ± 4 �5 ± 4 �12 ± 5 �11 ± 510 µg/m3 UFP �19 ± 5 �4 ± 4 �2 ± 2 �10 ± 5 �4 ± 525 µg/m3 UFP �25 ± 6 �6 ± 4 �3 ± 3 �8 ± 5 �6 ± 3
ST in V5 (µV)Air �10 ± 5 �3 ± 3 �2 ± 4 7 ± 5 �0.6 ± 410 µg/m3 UFP �14 ± 7 �3 ± 4 �2 ± 3 11 ± 4 2 ± 425 µg/m3 UFP �16 ± 5 �4 ± 4 �5 ± 3 7 ± 4 2 ± 2
Figure 27. HRV, UPDOSE. Differences from baseline. SDNN and high-frequency HRV in normalized units. Data represent mean ± SE.

32
Ultrafine Carbon Particles in Healthy and Asthmatic Subjects
UPASTHMA
Tables 18 and 19 show the results of ECG analyses forUPASTHMA subjects. In the heart rate variability analyses,there were trends toward a decreased SDNN, total power,and very low frequency power with UFP exposure in com-parison with air exposure (P values 0.120, 0.098, and 0.073,respectively). A similar trend was observed at high fre-quency expressed in normalized units. Interestingly, thesedifferences were mostly observed in males, despite absenceof gender-related changes in mean heart rate.
Repolarization parameters revealed a marginally signifi-cant interaction of UFP, gender, and time (P = 0.045) for
effects on QTc duration, with males showing slight short-ening of QTc the night and following morning after UFPexposure. Decreased QT variability after UFP exposurewhen compared to air exposure was shown by the standarddeviation of the QT duration and of the QT peak duration(Figure 29). Females mainly contributed to this observa-tion. Although the ANOVA indicated a statistically signif-icant main effect of UFP on T wave complexity (P = 0.049,data not shown), the difference occurred at only one timepoint and appeared to be driven by an outlier value. STsegment analysis in leads II and V5 showed an UFP-associ-ated, nonsignificant trend toward ST depression duringthe entire 24-hour recording (Figure 30).
Figure 28. Cardiac repolarization, UPDOSE. Differences from baseline. QT interval and QT corrected with the Bazett formula. Data represent mean ± SE.
Table 18. HRV in UPASTHMA Group, Differences from Baseline
ECG Parameter/Exposure
DuringExposure
Hours After Exposure Ended
0 3.5 15 21 45
RR (msec)Air �309 ± 45 �2 ± 25 �86 ± 20 74 ± 23 �26 ± 24 �24 ± 26UFP �261 ± 40 �7 ± 21 �92 ± 15 86 ± 33 7 ± 21 �13 ± 18
SDNN (msec)Air �33 ± 11 6 ± 7 �13 ± 5 13 ± 9 1 ± 6 6 ± 7UFP �24 ± 10 �3 ± 8 �19 ± 7 �1 ± 7 �14 ± 6 �3 ± 7
rMSSD (msec)AIR �32 ± 9 7 ± 6 �18 ± 6 14 ± 7 �4 ± 6 �11 ± 8UFP �27 ± 7 2 ± 7 �22 ± 4 11 ± 8 �5 ± 5 �8 ± 4
Low frequency (Hz)AIR �510 ± 256 494 ± 416 �120 ± 313 804 ± 537 315 ± 221 17 ± 191UFP �469 ± 273 78 ± 263 �390 ± 233 1412 ± 627 �166 ± 133 33 ± 251
High frequency (Hz)AIR �1556 ± 491 257 ± 412 �960 ± 315 105 ± 418 �394 ± 424 �904 ± 485UFP �1006 ± 342 124 ± 357 �934 ± 265 169 ± 416 �260 ± 346 �565 ± 276
Low frequency/high frequencyAIR 3 ± 0.6 0.4 ± 0.4 1 ± 0.6 0 ± 0.3 0 ± 0.3 0.4 ± 0.5UFP 3 ± 0.6 �0.4 ± 0.5 0.5 ± 0.5 1 ± 0.3 �0.6 ± 0.6 0.3 ± 0.7

MW Frampton et al
33
Figure 29. Standard deviations of the QT interval and QT peak duration.UPASTHMA. Differences from baseline. Data represent mean ± SE.
Table 19. Cardiac Repolarization Parameters in UPASTHMA Group, Differences from Baseline
ECG Parameter/Exposure
DuringExposure
Hours After Exposure Ended
0 3.5 15 21 45
QTc (msec)Air 28 ± 9 1 ± 3 10 ± 3 4 ± 8 5 ± 5 5 ± 4UFP 36 ± 11 5 ± 4 10 ± 4 3 ± 4 4 ± 5 4 ± 6
T amp (µV)Air �77 ± 49 108 ± 15 �16 ± 19 �26 ± 23 �12 ± 12 31 ± 22UFP �28 ± 33 93 ± 24 �31 ± 18 �31 ± 27 13 ± 20 �1 ± 26
PCAAir 1.5 ± 2.4 �2.5 ± 0.8 7.9 ± 8.7 2.7 ± 2.8 0.2 ± 1.3 �2.6 ± 0.7UFP 2.4 ± 2.7 �0.8 ± 1.3 1.0 ± 1.3 3.5 ± 1.9 0.6 ± 1.3 �4.4 ± 3.6
PCA variabilityAir 3.3 ± 0.8 �0.4 ± 0.1 39.4 ± 39.2 1.3 ± 0.8 0.2 ± 0.3 0.1 ± 0.3UFP 4.0 ± 1.1 0.0 ± 0.5 �0.1 ± 0.2 0.1 ± 0.3 �0.3 ± 0.2 �0.3 ± 0.3
ST in L2 (µV)Air �21 ± 8 6 ± 2 3 ± 3 7 ± 3 1 ± 3 2 ± 4UFP �23 ± 9 1 ± 3 �5 ± 3 2 ± 3 0 ± 3 �4 ± 5
ST in V2 (µV)Air �12 ± 4 �1 ± 2 �3 ± 3 �20 ± 6 �9 ± 2 �1 ± 2UFP �10 ± 5 2 ± 2 1 ± 3 �13 ± 7 �10 ± 4 �1 ± 5
ST in V5 (µV)Air �15 ± 5 2 ± 3 �5 ± 4 6 ± 4 �3 ± 3 6 ± 3UFP �15 ± 7 �3 ± 2 �8 ± 4 �4 ± 5 �4 ± 4 2 ± 6
Figure 30. ST segment voltage lead II and ST segment voltage lead V5,UPASTHMA. Differences from baseline. Data represent mean ± SE.

34
Ultrafine Carbon Particles in Healthy and Asthmatic Subjects
DISCUSSION
These are the first human clinical studies of the respira-tory and cardiovascular effects of UFP inhalation. Ourchoices of particle and exposure system were based onseveral considerations. First, exposure in a laboratory set-ting permitted careful and reproducible control of expo-sure conditions and particle concentrations. Second,elemental carbon is a universal component of ambientcombustion particles, and carbon content is often consid-ered a signature of combustion-related particles. Third,because these were the first health studies of UFP expo-sure, we chose a relatively inert particle composition forsafety reasons. Fourth, mouthpiece exposures permitteddirect quantitation of respiratory fractional deposition ofUFP at rest and during exercise, in both healthy and asth-matic subjects. Fifth, identifying cardiovascular effectsresulting from inhalation of a relatively inert particle suchas elemental carbon has important implications for under-standing potential mechanisms of PM effects.
These carbon UFP studies were undertaken before thetechnological development of an ambient UFP concen-trator. There is no definitive evidence, however, that theconcentrated ambient UFP aerosol (with its known vari-ability in size, concentration, and composition) offers abetter model for examining possible UFP-induced effectsthan does a well-controlled single-component UFP aerosolknown to be indigenous to urban air pollution (eg, carbon).Collection and resuspension of ambient UFP was not anoption because particle collection results in agglomerationwith irreversible changes in particle size and surface area.
The key findings of these studies are in three areas: par-ticle deposition, blood leukocytes, and heart rate vari-ability and repolarization.
UFP DEPOSITION
Our data confirm the relatively high predicted respira-tory deposition of UFP during breathing at rest, and thefindings were in general agreement with results obtainedpreviously (Jaques and Kim 2000; Wilson et al 1985). Withexercise, the total respiratory number DF increased about33% over resting measurements (Table 5), and measuredvalues exceeded predicted values by about 22% for 26-nmparticles (Figure 3). One possible explanation for thedivergence of these experimental data from model predic-tions is turbulence. The increased flow demands duringexercise move the turbulence-to-laminar flow transitionpoint distally, to smaller-generation airways, enhancingdeposition in those airways where laminar flow becomes
turbulent. Prediction models do not account for the effectsof increased turbulence in the airways during exercise.Further studies are needed to determine the effects of exer-cise on regional deposition of UFP, and the effects ofvarying exercise intensity.
To estimate UFP dose, total particle deposition was cal-culated using the DF, minute ventilation, and exposuretime. For the seven subjects studied at both rest and exer-cise, minute ventilation during exercise increased 3.3-fold.When combined with the increase in DF, total particlenumber deposition increased more than fourfold (Table 6).These findings indicate that lung deposition of particles inthe ultrafine size range during exercise is greater thanexpected from changes in minute ventilation, and exceedsestimations using model predictions of deposition. Exer-cise enhancement of deposition was greatest for thesmallest particles.
Predictive models indicate that the regional deposition ofUFP in the size range used in this study is predominantlyalveolar. Thus, exercise would be expected to substantiallyincrease UFP dose in the alveolar region of the lung throughincreased intake of particles, increased total DF, and shiftingof deposition toward the alveolar region. Exercise maytherefore increase the likelihood of alveolar epithelialeffects or translocation of particles to the lung interstitiumor capillary blood (Nemmar et al 2001, 2002).
We found that subjects with asthma had increased UFPfractional deposition compared with healthy subjects.Patients with chronic obstructive lung disease also haveenhanced deposition of fine and ultrafine particles(Anderson et al 1990; Svartengren et al 1991; Brown et al2002). This is the first study to show enhanced depositionof UFP in subjects with mild asthma. We speculate that thehyperinflation characteristic of even mild asthma mayenhance diffusional deposition of UFP in the distal air-ways and alveoli. These findings indicate an increasedairway burden of UFP in asthma and thus may provide apartial explanation for the increased susceptibility ofpeople with asthma to the health effects of PM.
BLOOD LEUKOCYTE EFFECTS
We initially hypothesized that UFP exposure wouldinduce airway inflammation and that this inflammationwould be accompanied by increases in expression of sur-face adhesion molecules on leukocytes. Our findings didnot confirm this hypothesis. In contrast, the findingsshowed reductions in specific leukocyte subsets and adhe-sion molecule expression associated with UFP exposurewhen accompanied by exercise. In the UPDOSE group, we

MW Frampton et al
35
observed small (less than 2%) reductions in the percentageof peripheral blood monocytes in females with exposure to25 µg/m3 UFP (Figure 12). We also saw reductions in thepercentage of basophils in females with both 10 and25 µg/m3 UFP concentrations (Figure 13). These reduc-tions were accompanied by nonsignificant increases in thepercentage of PMNs. There were significant reductions inexpression of the IgG receptors CD64 and CD32 on bloodPMNs. On monocytes, a highly significant, dose-relateddecrease in ICAM-1 expression was measured immedi-ately after exposure but had resolved by 21 hours afterexposure (Figure 20). The percentage of activated lympho-cytes (CD25+) increased in females with exposure to25 µg/m3 UFP (Figure 16).
In the UPASTHMA group, with a single UFP exposureconcentration of 10 µg/m3, we observed reductions inblood basophils (Figure 14), eosinophils (Figure 15), andCD4+ T-lymphocytes (Figure 17). Monocytes showed sig-nificant reduction in CD11b expression (Figure 21), andPMNs showed reductions in ICAM-1 expression (Figure22). Eosinophils showed reductions in expression of bothCD11b (Figure 24) and CD32.
Thus in both protocols involving exercise (UPDOSE andUPASTHMA), we found effects on blood leukocyte distri-bution and surface marker expression. These smallchanges were not generally in the direction consistentwith a generalized inflammatory response, in which onewould expect an increase in the total leukocyte count andan increase in expression of specific surface markers. Forexample, proinflammatory cytokines such as tumornecrosis factor and IFN-� are known to increase theexpression of ICAM-1 (Rothlein et al 1988). Indeed, mono-cytes from the subjects with asthma in these studiesshowed increased expression of ICAM-1 compared withhealthy subjects, a finding consistent with a generalizedinflammatory response related to the asthma itself.
Other findings from this study suggest the absence of aninflammatory response to the UFP. No symptoms wereassociated with UFP exposure, inflammatory cells ininduced sputum did not increase, and airway NO produc-tion did not increase. In addition, soluble markers ofinflammation and leukocyte activation did not increasesignificantly. Thus, we feel it is unlikely that the leukocytechanges were a response to pulmonary inflammation.
The blood leukocyte changes we observed could resultfrom pulmonary vasoconstriction in response to UFPexposure. The pulmonary capillary bed contains a largepopulation of marginated leukocytes. Reduction in thesize of the pulmonary capillaries prolongs the circulationtime for leukocytes and thus results in reduced leukocyte
counts in the peripheral blood (Doerschuk 2003). In con-trast, exercise increases pulmonary capillary bloodvolume, washing out marginated leukocytes and resultingin an increase in the peripheral leukocyte count. In 1999van Eeden and colleagues reported that exercise increasedthe expression of CD11b on circulating PMNs, presumablyby flushing from the marginated pool those cells withhigher surface expression of CD11b. If UFP inhalationcaused subtle reductions in pulmonary capillary bloodflow, one would expect to see reductions in peripheralblood leukocyte subsets. The cells with the longest transittime through the pulmonary capillary bed are likely to bethose expressing the highest density of adhesion mole-cules involved in margination and sequestration (ie,ICAM-1 and CD11b/CD18). In addition, activated leuko-cytes undergo actin rearrangement with reduced deform-ability, further increasing transit time through thecapillaries. Therefore, we propose that UFP inhalationcauses mild pulmonary vasoconstriction with retention ofspecific leukocyte subsets expressing higher densities ofsurface adhesion molecules.
If cells are being retained longer in the lung, why did wenot see reductions in PMN counts in the peripheral blood? Itis possible that retention of PMNs in the lung was partiallyoffset by increases in release of PM from the bone marrow,as has been reported in other studies (Tan et al 2000).
UFP exposure could reduce leukocyte activation andexpression of adhesion molecules by three other mecha-nisms. First, UFP interaction with the endothelium couldenhance NO release by endothelial cells. NO has antiin-flammatory properties (Lefer 1997): it reduces endothelialexpression of adhesion molecules via inhibition of nuclearfactor-B (NFB) activation and reduces monocyte adhe-sion to the endothelium (De Caterina et al 1995). Indeed,we observed a late increase in plasma NO2/NO3 levels inthe UPASTHMA study (Figure 11), but we did not see sucha change in the other two studies. Further, increased NOproduction would not explain the decreases observed inmonocytes, basophils, and eosinophils.
Second, if UFP gain access to the pulmonary capillaryblood, modulation of cellular functions could result fromsequestering soluble cytokines, such as transforminggrowth factor , on the surface of the particles, reducinginflammatory effects. Kim and colleagues found thatcarbon black inhibited fibroblast-mediated collagen gelcontraction by binding transforming growth factor invitro (Kim et al 2003). Consistent with this possibility, wefound marginally significant UFP-associated reductions inplasma IL-6, soluble VCAM-1, and soluble CD40 ligand inhealthy subjects, and reductions in soluble E-selectin in

36
Ultrafine Carbon Particles in Healthy and Asthmatic Subjects
asthmatic subjects. Again, however, this mechanism doesnot explain the reduction in leukocyte subsets observed inour studies. A third possibility is that circulating UFPwere selectively toxic to activated blood leukocytes andinduced apoptosis of specific cell subsets.
We observed effects of UFP exposure on lymphocytesubsets. The data confirmed previous observations thatpeople with asthma have a higher percentage of circulatingactivated T lymphocytes (Corrigan et al 1988; Corrigan andKay 1990). Lymphocyte expression of CD25 was increased at3.5 hours after exposure to 25 µg/m3 UFP in healthy females.CD25 is the � chain of the IL-2 receptor; IL-2 promotes lym-phocyte proliferation. IL-2 receptor expression is tran-scriptionally regulated, and the gene promoter containsseveral regulatory sequences, including an NFB bindingsite (Weiss and Samelson 2003). Activation of NFBappears to play a critical role in IL-2 receptor expression.Our data are consistent with activation of IL-2 receptorgene expression in healthy females. Mechanisms couldinclude UFP interaction with the plasma membrane andactivation of intracellular signaling pathways, responses tocytokines released by other cells, or activation of NFB byoxidants carried on the surface of the particle. No effect onCD25 expression was detected in the UPASTHMA group,possibly because only the lower concentration (10 µg/m3)of UFP was used.
In the UPASTHMA group, blood CD4+ T lymphocytesdecreased immediately after UFP exposure (Figure 17).Previous studies have shown that allergen challengedecreases CD4+ lymphocytes in the blood, accompaniedby increases in bronchoalveolar lavage fluid (Gerblich et al1984), indicating a translocation of T lymphocytes fromthe blood to the lung. It is tempting to speculate that UFPexposure may have provided a nonspecific stimulus thatenhanced allergen processing or presentation in theairway. However, we did not assess alveolar lymphocytepopulations with bronchoalveolar lavage and thereforecannot conclude that the observed decrease in CD4+ cellsrepresented translocation. Furthermore, we did not see asignificant decrease in total lymphocyte numbers in theblood, which argues against translocation.
CARDIAC EFFECTS
This is the first study describing the effects of controlledexposure to UFP on a comprehensive set of ECG parame-ters related to autonomic regulation of the heart, myocar-dial substrate, and vulnerability. As expected, younghealthy subjects did not show dramatic changes in ECGparameters, but some interesting trends were observed.
Exposure to 10 µg/m3 UFP at rest was associated withsome (not significant) changes in ECG parameters. Thesechanges indicate an increase in parasympathetic tone,which most likely is responsible for a trend toward STelevation and blunted QTc shortening. Increased vari-ability of T wave complexity after UFP exposure couldalso be attributed to enhanced parasympathetic response.Heavy breathing, as with exercise, physiologicallyincreases parasympathetic modulation of the heart, andthis response seem to be exaggerated by UFP exposure.
In the UPDOSE and UPASTHMA groups, the impact ofexercise was seen on most of the ECG variables. As withexposures at rest, the parasympathetic measures of heartrate variability increased during exposure at the lower UFPlevel (10 µg/m3), but not at the higher UFP level (25 µg/m3).This finding may indicate that a threshold response to lowlevel UFP triggers some increase of parasympathetic tone,while higher concentrations might lead to a comparableeffect on both the sympathetic and parasympathetic sys-tems. Recovery from exercise showed a blunted response ofthe parasympathetic system (measured by normalized unitsof high-frequency components) after exposure to UFP incomparison to exposure to air. This diminished vagalresponse was not observed 3.5 hours later. An effect ofexposure to PM on parasympathetic modulation of theheart was observed by Gold and colleagues (2000), whofound reductions in parasympathetic (vagal) tone associ-ated with PM2.5 exposure in elderly subjects. Pope andcolleagues (1999b) found that elevations of PM10 wereassociated with increased heart rate and decreased heartrate variability. Animal studies also indicate that concen-trated ambient particles (CAPs) induce changes in heartrate variability consistent with increased sympathetic ner-vous system activity (Godleski et al 2000). Our observa-tions indicate that some effect of UFP on parameters ofheart rate variability reflecting control of the heart by theautonomic nervous system is present in healthy subjectsalthough an exact mechanism of these changes is not yetunderstood.
The repolarization changes in response to UFP exposurewith exercise could have a complex mechanism, whichremains to be elucidated. Blunted response of vagal modu-lation on the sinus node does not fully explain theobserved blunted response of QTc duration after UFPexposure. It is known that heart rate (sinus node functionunder the influence of autonomic nervous system) pro-vides only a partial explanation for changes in QT dura-tion (Merri et al 1993). Possibly UFP have an additionaleffect on repolarization either through a direct effect of theautonomic nervous system on ventricular myocardium

MW Frampton et al
37
(apart from that on the sinus node) (Merri et al 1993) or bydirectly affecting ion channel function in the ventricularmyocardium through a yet unknown mechanism.
The reduction in QT duration with concomitantincrease in T wave amplitude after UFP exposure pro-vides, for the first time, evidence that repolarization isaffected by air pollution. These preliminary findingsrequire confirmation in further studies in groups likely todemonstrate more pronounced effects (for example, theelderly and coronary disease patients).
Lengthening of the QTc interval increases the potentialfor arrhythmias. However, shortening of repolarization isknown to be caused by hypoxia and ischemia and to bearrhythmogenic. Calcium, potassium, and chloride chan-nels may contribute significantly to shortening of theaction potential duration. For example, the action poten-tial shortening by chloride current activation may perpet-uate reentry by shortening the refractory period (Ruiz et al1996). The other possible explanation for observed QTshortening may be cardiac myocyte functional responsesto subtle changes in systemic vascular tone. Thesechanges, in turn, may be related to increased endothelinproduction and/or reduced NO release by the endotheliumin response to particles. Alternatively, UFP may gainaccess to pulmonary capillary blood, where they could betransported to the heart and cause direct effects on mem-brane ion channel function.
Exposure of subjects with mild asthma to low-level UFPexposure (10 µg/m3) shows trends toward decreased heartrate variability, with the changes predominantly in males.There are known gender differences in variety of ECGparameters. For example, heart rate variability is lowerand the duration of myocardial repolarization is longer infemales than in males. It is interesting that in our study theeffect of UFP on these parameters was observed mostly inmen, and decreased QT variability was seen mostly inwomen. These findings further indicate that females andmales respond differently to various factors and agents (ashas been seen for drugs that affect myocardial repolariza-tion). There is no clear explanation for these patterns inour study, but it is plausible that UFP, even in low concen-trations, may decrease autonomic regulation of the heart.In these studies of UFP exposure in healthy subjects, smallchanges in the ST segment should not be considered indi-cators of ischemia but rather additional evidence forchanges in repolarization morphology.
GENDER DIFFERENCES
Our findings suggest that some effects of UFP maydiffer by gender. Detecting gender differences was not aprimary goal of these studies. However, subject groupsincluded equal numbers of men and women, and theANOVA included an analysis for gender interactions. Inthe UPDOSE group, several UFP effects were seen only infemales: decrease in oxygen saturation (Figure 5),decrease in blood monocytes (Figure 12) and basophils(Figure 13), and increase in lymphocyte CD25 expression(Figure 16). There were also apparent differences in heartrate variability and cardiac repolarization responses. TheUPASTHMA group had fewer gender differences. PlasmaNO2/NO3 concentration showed a relative increase withUFP in males only (Figure 11). Expression of L-selectin(CD62L) on PMNs was increased in males (Figure 23). TheQTc interval, which did not show a main effect of UFP, didshow marginally significant gender-related interactions.
Some known gender differences in leukocyte functionand cardiovascular responses are based in part on hormonalinfluences. For example, females have a higher percentageof CD4+ T cells and a higher CD4+/CD8+ ratio than males.Stimulated blood monocytes from females produce moreprostaglandin E2 (Leslie and Dubey 1994) and less TNF-�and IL-6 (Schwarz et al 2000) than those from males. Thereare also gender differences in endothelial function (Chow-ienczyk and Ritter 2001; Kneale et al 2000; Lieberman et al1994; Sader and Celemajer 2002), NO production (Best et al1998; Cicinelli et al 1998; Miller 1999), antioxidant defenses(Massafra et al 2002; Strehlow et al 2003), and risks for car-diovascular disease (Hayward et al 2000). We do not feelthese studies have convincingly established or excludedsignificant gender differences in response to carbon UFP.The female subjects were premenopausal, menstrual phaseswere not determined, and most were on hormonal contra-ceptives, which may have affected the responses. The statis-tically significant gender differences seen in the UPDOSEstudy did not suggest a consistent physiologic response toUFP and were generally not confirmed in the UPASTHMAstudy. Future studies of vascular responses to UFP and PMexposure should explore the roles of gender and hormonalinfluences in determining susceptibility.
COMPARISONS WITH OTHER HUMAN STUDIES OF PM
Evidence from other human studies indicates that expo-sure to CAPs induces lung inflammation, systemic inflam-matory responses, and vascular effects. Human studies ofexposure to diesel exhaust have not shown acute effects on

38
Ultrafine Carbon Particles in Healthy and Asthmatic Subjects
lung function but have shown distal airway inflammationand systemic hematologic effects with increased WBC andplatelet counts (Salvi et al 1999). In addition, expression ofICAM-1 was increased in vascular endothelium from bron-chial biopsy specimens. Ghio and colleagues (2000) foundmodest increases in PMNs recovered in bronchoalveolarlavage fluid 24 hours after 2-hour exposures to CAPs (atconcentrations up to 311 µg/m3). These investigators foundan increased blood fibrinogen concentration in associationwith CAPs exposure, but no effects on symptoms, lungfunction, or blood leukocyte differential counts. A separatereport (Harder et al 2001) indicated no effects of these expo-sures on the immune phenotype of cells from bronchoalve-olar lavage fluid or on blood lymphocyte subsets.Measurements in this study were done at only one timepoint (18 hours) after exposure however, and early ordelayed changes may have been missed. Gong and col-leagues (2003) studied both healthy and asthmatic subjectsexposed to CAPs at a concentration of 174 µg/m3 with inter-mittent exercise. There were no effects on lung function andno evidence for airway inflammation in induced sputum.They did observe small increases in soluble ICAM-1 at 4and 24 hours after exposure and changes in heart rate vari-ability consistent with enhanced parasympathetic influenceon the heart. They observed no changes in blood leukocytedifferential counts, fibrinogen, factor VII, or serum amyloidA. Finally, Brook and colleagues (2002) found that restingexposures to a combination of CAPs and ozone resulted in areduced diameter of the brachial artery, indicating systemicvasoconstriction in response to the exposures.
It is difficult to compare the findings from these studieswith our own, in part because of differences in the expo-sure atmospheres and in the endpoints being measured.The ambient particle concentrators used in these humanstudies do not concentrate ambient UFP; thus the expo-sures consisted of concentrated fine particles and ambient(unconcentrated) UFP. In addition, ambient PM representsa complex mixture of chemical species, including organiccompounds and metals, which have been hypothesized tobe key mediators of PM effects (Ghio et al 1999; Nel et al2001; Huang et al 2003). In our own studies, mass concen-trations were approximately an order of magnitude lowerthan in the CAPs studies, but particle number and surfacearea were likely higher. Our particles consisted of ele-mental carbon without significant content of organic spe-cies, metals, oxides, or sulfates. However, even elementalcarbon UFP, by virtue of their large surface area, may carryan increased burden of reactive oxygen species in compar-ison with an equal mass of larger (Li et al 2003). Ambient
UFP have been shown to be potent inducers of heme oxy-genase in vitro (Li et al 2000).
In our study, asthmatic subjects did not experience res-piratory symptoms or bronchoconstriction after exposureto 10 µg/m3 UFP. This is not surprising because the sub-jects generally had mild asthma and the exposure concen-tration was relatively low. It is unlikely that medicationsmasked UFP effects. Subjects did not use bronchodilatorsduring the exposure and observation periods, and mostwere not on inhaled corticosteroids or long-acting bron-chodilators. Possibly a higher exposure concentrationwould elicit effects or subjects with more severe asthmawould show airway effects at this concentration. Compari-sons of our effects between the healthy and asthmatic sub-jects should be interpreted with caution because thegroups were not studied concurrently. At the same time,these studies do not provide evidence for increased sus-ceptibility of asthmatic subjects to carbon UFP exposure.
Issues of cost and practicality limited the scope of thesestudies. Effect sizes were generally small, and the limitedsample sizes were likely inadequate to detect significanteffects for some endpoints. This is particularly true for thegender comparisons. The subjects were young adults, gen-erally healthy and nonsmokers. The findings may differ forchildren, the elderly, or people with more severe asthma orother diseases.
In summary, we have developed and validated an expo-sure system for human studies of inhalation of UFP. Wehave demonstrated that the total respiratory deposition ofUFP is relatively high, consistent with prediction models.However, UFP deposition increased further with exerciseand in the presence of mild asthma. Table 20 provides asummary of the findings in these studies. Inhalation ofcarbon UFP at concentrations up to 25 µg/m3 caused nosymptoms, changes in lung function, or evidence forairway inflammation in healthy subjects. Blood leukocytesubsets and adhesion molecule expression did show subtlechanges that suggest there may be effects on endothelialfunction. We also found evidence for effects on heart ratevariability and on cardiac repolarization in healthy subjects.Our hypotheses that inhalation of carbon UFP would causepulmonary inflammation and an acute phase response werenot confirmed. If confirmed, however, the finding that thesevery low mass concentrations of particles have vasculareffects will have important implications for future PM regu-latory strategies. Further studies are needed to confirm ourobservations and to determine the role of particle size andsurface area in mediating these effects.

MW Frampton et al
39
REFERENCES
American Thoracic Society. 1999. Recommendations forstandardized procedures for the online and offline mea-surement of exhaled lower respiratory nitric oxide andnasal nitric oxide in adults and children: 1999. Am JRespir Crit Care Med 160:2104–2117.
Anderson PJ, Wilson JD, Hiller FC. 1990. Respiratory tractdeposition of ultrafine particles in subjects with obstruc-tive or restrictive lung disease. Chest 97:1115–1120.
Atkinson RW, Anderson HR, Sunyer J, Ayres J, Baccini M,Vonk JM, Boumghar A, Forastiere F, Forsberg B, TouloumiG, Schwartz J, Katsouyanni K. 2001. Acute effects of par-ticulate air pollution on respiratory admissions: Resultsfrom APHEA 2 project. Am J Respir Crit Care Med164:1860–1866.
Barnes PJ, Kharitonov SA. 1996. Exhaled nitric oxide: Anew lung function test. Thorax 51:233–237.
Bazett HC. 1920. An analysis of time relations of electro-cardiograms. Heart 7:353–367.
Best PJM, Berger PB, Miller VM, Lerman A. 1998. Theeffect of estrogen replacement therapy on plasma nitricoxide and endothelin-1 levels in postmenopausal women.Ann Intern Med 128:285–288.
Brook RD, Brook JR, Urch B, Vincent R, Rajagopalan S, Sil-verman F. 2002. Inhalation of fine particulate air pollutionand ozone causes acute arterial vasoconstriction in healthyadults. Circulation 105:1534–1536.
Brown DM, Wilson MR, MacNee W, Stone V, Donaldson K.2001. Size-dependent proinflammatory effects of ultrafinepolystyrene particles: A role for surface area and oxidativestress in the enhanced activity of ultrafines. Toxicol ApplPharmacol 175:191–199.
Brown JS, Zeman KL, Bennett WD. 2002. Ultrafine particledeposition and clearance in the healthy and obstructedlung. Am J Respir Crit Care Med 166:1240–1247.
Cassee FR, Muijser H, Duistermaat E, Freijer JJ, Geerse KB,Marijnissen JC, Arts JH. 2002. Particle size-dependent totalmass deposition in lungs determines inhalation toxicity ofcadmium chloride aerosols in rats: Application of a mul-tiple path dosimetry model. Arch Toxicol 76:277–286.
Table 20. Summary of UFP Exposure Effects
UPREST UPDOSE UPASTHMA
Respiratory symptoms and pulmonary function
No effects Decreased VE during exercise Decreased VE at rest
Vital signs and oxygen saturation
No effects Decreased oxygen saturation in females
No effects
Airway inflammation No effects No effects No effectsSystemic inflammation No effects Decreased soluble CD40 ligand
and IL-6 (males)Decreased L-selectin; increased NO2/NO3 concentration (males)
Blood leukocytes No effects Decreased monocytes and basophils (females)
Decreased eosinophils and basophils
Lymphocyte subsets and activation
No effects Increased CD25+ T cells (females)
Decreased CD4+ T cells
Blood leukocyte expression of Fc receptors
Increased CD32 (females) on PMNs
Decreased CD23, CD32, CD64 on PMNs; decreased CD32 on monocytes
Decreased CD16 on PMNs; increased CD16 on lymphocytes
Blood leukocyte expression of adhesion molecules
Increased CD54 on monocytes; increased CD49d and CD11a (females) on lymphocytes
Decreased CD49d on PMNs; decreased CD54, CD62L (males), CD49d (females) on monocytes
Decreased CD54 and increased CD62L (males) on PMNs; decreased CD11b and CD54 on monocytes
Markers of blood coagulation No effects Decreased fibrinogen (males) and vWf (males)
No effects
Cardiac monitoring No effects Decreased QTc interval Decreased QTc (males), SD of QT interval, and SD of QT peak duration (females)

40
Ultrafine Carbon Particles in Healthy and Asthmatic Subjects
Chalupa DF, Gibb FR, Morrow PE, Oberdörster G, Riesen-feld E, Gelein R, Utell MJ, Frampton MW. 2002. A facilityfor controlled human exposures to ultrafine particles. In:Crucial Issues in Inhalation Research: Mechanistic, Clin-ical and Epidemiologic (Heinrich U, Mohr U, eds), pp 241–253. International Life Sciences Institute Press, Wash-ington DC.
Chen LC, Miller PD, Amdur MO, Gordon T. 1992. Airwayhyperresponsiveness in guinea pigs exposed to acid-coated ultrafine particles. J Toxicol Environ Health35:165–174.
Chowienczyk P, Ritter J. 2001. Gender differences in vas-cular function: Time to look beyond oestrogen and NO?Clin Sci 100:471–472.
Cicinelli E, Ignarro LJ, Schönauer LM, Matteo MG, Galan-tino P, Balzano G. 1998. Effects of short-term transdermalestradiol administration on plasma levels of nitric oxide inpostmenopausal women. Fertil Steril 69:58–61.
Corrigan CJ, Hartnell A, Kay AB. 1988. T lymphocyte acti-vation in acute severe asthma. Lancet 1:1129–1132.
Corrigan CJ, Kay AB. 1990. CD4 T lymphocyte activationin acute severe asthma: Relationship to disease severityand atopic status. Am Rev Respir Dis 141:970–977.
Corrigan CJ, Hamid Q, North J, Barkans J, Moqbel R,Durham S, Gemou-Engesaeth V, Kay AB. Peripheral bloodCD4 but not CD8 T lymphocytes in patients with exacerba-tion of asthma transcribe and translate messenger RNAencoding cytokines which prolong eosinophil survival inthe context of a Th2-type pattern: effect of glucocorticoidtherapy. Am J Respir Cell Mol Biol 12:567-578.
Creason J, Neas L, Walsh D, Williams R, Sheldon L, Liao D,Shy C. 2001. Particulate matter and heart rate variabilityamong elderly retirees: The Baltimore 1998 PM study. JExpos Anal Environ Epidemiol 11:116–122.
Daigle CC, Chalupa DC, Gibb FR, Morrow PE, OberdörsterG, Utell MJ, Frampton MW. 2003. Ultrafine particle depo-sition in humans during rest and exercise. Inhalation Tox-icol 15:539–552.
De Caterina R, Libby P, Peng HB, Thannickal VJ, Rajavash-isth TB, Gimbrone MA Jr, Shin WS, Liao JK. 1995. Nitricoxide decreases cytokine-induced endothelial activation.Nitric oxide selectively reduces endothelial expression ofadhesion molecules and proinflammatory cytokines. J ClinInvest 96:60–68.
Dockery D, Pope A. 1996. Epidemiology of acute healtheffects: Summary of time-series studies. In: Particles in
Our Air: Concentrations and Health Effects (Wilson R,Spengler JD, eds), pp 123–147. Harvard University Press,Cambridge MA.
Doerschuk CM. 2003. Neutrophil emigration in the lungs.In: Lung Biology in Health and Disease. Vol 177, Thera-peutic Targets in Airway Inflammation (Eissa NT, HustonDP, eds), pp 249–280. Marcel Dekker, New York NY.
Ellis BC, Stransky A. 1961. A quick and accurate methodfor the determination of fibrinogen in plasma. J Lab ClinMed 58:477–488.
Environmental Protection Agency (US). 1996. Air QualityCriteria for Particulate Matter, vol III. Office of Researchand Development, Washington DC.
Environmental Protection Agency (US). 1998. Executivesummary. In: Particulate Matter Research Needs forHuman Health Risk Assessment to Support FutureReviews of the National Ambient Air Quality Standardsfor Particulate Matter. EPA/600/R-97/132F. NationalCenter for Environmental Assessment, Research TrianglePark NC.
Furlan M, Perret BA, Beck EA. 1985. Reactivity of smallmolecular forms of human factor VIII/von Willebrandfactor with botrocetin and anti-factor VIII-coated latex par-ticles. Thromb Haemost 54:463–465.
Gavras JB, Frampton MW, Ryan DH, Levy PC, Looney RJ,Cox C, Morrow PE, Utell MJ. 1994. Expression of mem-brane antigens on human alveolar macrophages after expo-sure to nitrogen dioxide. Inhalation Toxicol 6:633–646.
Gerblich AA, Campbell AE, Schuyler MR. 1984. Changesin T-lymphocyte subpopulations after antigenic bronchialprovocation in asthmatics. N Engl J Med 310:1349–1352.
Ghio AJ, Kim C, Devlin RB. 2000. Concentrated ambientair particles induce mild pulmonary inflammation inhealthy human volunteers. Am J Respir Crit Care Med162:981–988.
Ghio AJ, Stoneheurner J, Dailey LA, Carter JD. 1999.Metals associated with both the water-soluble and insol-uble fractions of an ambient air pollution particle catalyzean oxidative stress. Inhalation Toxicol 11:37–49.
Godleski JJ, Verrier RL, Koutrakis P, Catalano P. 2000.Mechanisms of Morbidity and Mortality from Exposure toAmbient Air Particles. Research Report 91. Health EffectsInstitute, Boston MA.
Gold DR, Litonjua A, Schwartz J, Lovett E, Larson A,Nearing B, Allen G, Verrier M, Cherry R, Verrier R. 2000.

MW Frampton et al
41
Ambient pollution and heart rate variability. Circulation101:1267–1273.
Gong H Jr, Linn WS, Sioutas C, Terrell SL, Clark KW,Anderson KR, Terrell LL. 2003. Controlled exposures ofhealthy and asthmatic volunteers to concentrated ambientfine particles in Los Angeles. Inhalation Toxicol 15:305–325.
Harder SD, Soukup JM, Ghio AJ, Devlin RB, Becker S.2001. Inhalation of PM2.5 does not modulate host defenseor immune parameters in blood or lung of normal humansubjects. Environ Health Perspect 109(Suppl 4):599–604.
Hayward CS, Kelly RP, Collins P. 2000. The roles of gender,the menopause and hormone replacement on cardiovas-cular function. Cardiovasc Res 46:28–49.
Health Effects Institute. 2003. Revised Analyses of Time-Series Studies of Air Pollution and Health. Special Report.Health Effects Institute, Boston MA.
Hiltermann TJ, Stolk J, van der Zee SC, Brunekreef B, deBruijne CR, Fischer PH, Ameling CB, Sterk PJ, HiemstraPS, van Bree L. 1998. Asthma severity and susceptibility toair pollution. Eur Respir J 11:686–693.
Holz O, Richter K, Jorres RA, Speckin P, Mucke M, Mag-nussen H. 1998. Changes in sputum composition betweentwo inductions performed on consecutive days. Thorax53:83–86.
Huang Y-CT, Ghio AJ, Stonehuerner J, McGee J, Carter JD.2003. The role of soluble components in ambient fine par-ticles-induced changes in human lungs and blood. Inhala-tion Toxicol 15:327–342.
Hyde RW, Geigel EJ, Olszowka AJ, Krasney JA, Forster REII, Utell MJ, Frampton MW. 1997. Determination of pro-duction of nitric oxide by the lower airways of humans:Theory. J Appl Physiol 82:1290–1296.
Ibald-Mulli A, Stieber J, Wichmann H-E, Koenig W, PetersA. 2001. Effects of air pollution on blood pressure: A pop-ulation-based approach. Am J Public Health 91:571–577.
International Commission on Radiological Protection, ed.1994. ICRP Publication 66: Human Respiratory TractModel for Radiological Protection. Ann ICRP, vol 24.Elsevier Science Publishing Co, New York NY.
Jaques PA, Kim CS. 2000. Measurement of total lung depo-sition of inhaled ultrafine particles in healthy men andwomen. Inhalation Toxicol 12:715–731.
Jones B, Kenward MG. 1989. Design and Analysis of Cross-Over Trials, 2nd edition. Chapman & Hall, New York NY.
Karulin AY, Hesse MD, Tary-Lehmann M, Lehmann PV.2000. Single-cytokine-producing CD4 memory cells pre-dominate in type 1 and type 2 immunity. J Immunol164:1862–1872.
Kharitonov SA, Yates DH, Barnes PJ. 1996. Inhaled gluco-corticoids decrease nitric oxide in exhaled air of asthmaticpatients. Am J Respir Crit Care Med 153:454–457.
Kim H, Liu X, Kobayashi T, Kohyama T, Wen F-Q, Rom-berger DJ, Conner H, Gilmour PS, Donaldson K, MacNeeW, Rennard SI. 2003. Ultrafine carbon black particlesinhibit human lung fibroblast-mediated collagen gel con-traction. Am J Respir Cell Mol Biol 28:111–121.
Kneale BJ, Chowienczyk PJ, Brett SE, Coltart DJ, Ritter JM.2000. Gender differences in sensitivity to adrenergic ago-nists of forearm resistance vasculature. J Am Coll Cardiol36:1233–1238.
Lee YC, Cheon KT, Rhee YK. 1997. Changes of solubleICAM-1 levels in serum and bronchoalveolar lavage fluidfrom patients with atopic bronchial asthma after allergenchallenge. J Asthma 34:405–412.
Lefer AM. 1997. Nitric oxide: Nature's naturally occurringleukocyte inhibitor. Circulation 95:553–554.
Leslie CA, Dubey DP. 1994. Increased PGE2 from humanmonocytes isolated in the luteal phase of the menstrualcycle: Implications for immunity? Prostaglandins 47:41–54.
Li N, Sioutas C, Cho A, Schmitz D, Misra C, Sempf J, WangM, Oberley T, Froines J, Nel A. 2003. Ultrafine particulatepollutants induce oxidative stress and mitochondrialdamage. Environ Health Perspect 111:455–460.
Li N, Venkatesan MI, Miguel A, Kaplan R, Gujuluva C,Alam J, Nel A. 2000. Induction of heme oxygenase-1expression in macrophages by diesel exhaust particlechemicals and quinones via the antioxidant-responsiveelement. J Immunol 165:3393–3401.
Li XY, Brown D, Smith S, MacNee W, Donaldson K. 1999.Short-term inflammatory responses following intratra-cheal instillation of fine and ultrafine carbon black in rats.Inhalation Toxicol 11:709–731.
Lieberman EH, Gerhard MD, Uehata A, Walsh BW, SelwynAP, Ganz P, Yeung AC, Creager MA. 1994. Estrogenimproves endothelium-dependent, flow-mediated vasodi-lation in postmenopausal women. Ann Intern Med121:936–941.

42
Ultrafine Carbon Particles in Healthy and Asthmatic Subjects
Lipsett M, Hurley S, Ostro B. 1997. Air pollution andemergency room visits for asthma in Santa Clara County,California. Environ Health Perspect 105:216–222.
Lukacs NW, Strieter RM, Kunkel SL. 1995. Leukocyte infil-tration in allergic airway inflammation. Am J Respir CellMol Biol 13:1–6.
Malik M, Camm AJ, eds. 1995. Heart Rate Variability.Futura Publishing Co, Armonk NY.
Massafra C, Gioia D, De Felice C, Muscettola M, Longini M,Buonocore G. 2002. Gender-related differences in erythro-cyte glutathione peroxidase activity in healthy subjects.Clin Endocrinol (Oxf) 57:663–667.
McDonald JD, Powell QH, Bowen LE, Mauderly JL. 2001.Organic carbon content of aerosols produced from a Palascarbon gneration system (abstract). Toxicologist 60:430.
Merri M, Alberti M, Moss AJ. 1993. Dynamic analysis ofventricular repolarization duration from 24-hour Holterrecordings. IEEE Trans Biomed Eng 40:1219–1225.
Miller VM. 1999. Gender, estrogen, and NOS: Cautionsabout generalizations. Circ Res 85:979–981.
Montefort S, Lai CKW, Kapahi P, Leung J, Lai KN, Chan HS,Haskard DO, Howarth PH, Holgate ST. 1994. Circulatingadhesion molecules in asthma. Am J Respir Crit Care Med149:1149–1152.
Morris JF, Koski A, Johnson LC. 1971. Spirometric stan-dards for healthy nonsmoking adults. Am Rev Respir Dis103:57–61.
National Council on Radiation Protection and Measure-ments (US). 1997. Deposition, Retention, and Dosimetry ofInhaled Radioactive Substances: Recommendations of theNational Council on Radiation Protection and Measure-ments. NCRP Report No 125. NCRP, Bethesda MD.
National Institutes of Health (US). 1997. Expert PanelReport 2: Guidelines for the Diagnosis and Management ofAsthma. NIH Publication No 97-4051. National Heart,Lung, and Blood Institute, Bethesda MD.
National Research Council (US). 1998. Research Prioritiesfor Airborne Particulate Matter: I. Immediate Priorities anda Long-Range Research Portfolio. National Academy Press,Washington DC.
Nel AE, Diaz-Sanchez D, Li N. 2001. The role of particulatepollutants in pulmonary inflammation and asthma: Evi-dence for the involvement of organic chemicals and oxida-tive stress. Curr Opin Pulm Med 7:20–26.
Nemmar A, Hoet PH, Vanquickenborne B, Dinsdale D,Thomeer M, Hoylaerts MF, Vanbilloen H, Mortelmans L,Nemery B. 2002. Passage of inhaled particles into theblood circulation in humans. Circulation 105:411–414.
Nemmar A, Vanbilloen H, Hoylaerts MF, Hoet PHM, Ver-bruggen A, Nemery B. 2001. Passage of intratracheallyinstilled ultrafine particles from the lung into the systemiccirculation in hamster. Am J Respir Crit Care Med164:1665–1668.
Nightingale JA, Rogers DF, Barnes PJ. 1998. Effect ofrepeated sputum induction on cell counts in normal vol-unteers. Thorax 53:87–90.
Oberdörster G, Gelein RM, Ferin J, Weiss B. 1995. Associa-tion of particulate air pollution and acute mortality:Involvement of ultrafine particles? Inhalation Toxicol7:111–124.
Ohkawara Y, Yamauchi K, Maruyama N, Hoshi H, Ohno I,Honma M, Tanno Y, Tamura G, Shirato K, Ohtani H. 1995.In situ expression of the cell adhesion molecules in bron-chial tissues from asthmatics with air flow limitation: Invivo evidence of VCAM-1/VLA-4 interaction in selectiveeosinophil infiltration. Am J Respir Cell Mol Biol 12:4–12.
Owen PA, Aas K. 1951. The control of Dicumarol therapyand the quantitative determination of prothrombin andproconvertin. Scand J Clin Lab Invest 3:201.
Pekkanen J, Brunner EJ, Anderson HR, Tiittanen P,Atkinson RW. 2000. Daily concentrations of air pollutionand plasma fibrinogen in London. Occup Environ Med57:818–822.
Pekkanen J, Peters A, Hoek G, Tiittanen P, Brunekreef B, deHartog J, Heinrich J, Ibald-Mulli A, Kreyling WG, Lanki T,Timonen KL, Vanninen E. 2002. Particulate air pollutionand risk of ST-segment depression during repeated sub-maximal exercise tests among subjects with coronary heartdisease: The Exposure and Risk Assessment for Fine andUltrafine Particles in Ambient Air (ULTRA) Study. Circu-lation 106:933–938.
Perillo IB, Hyde RW, Olszowka AJ, Pietropaoli AP, FrasierLM, Torres A, Perkins PT, Forster RE II, Utell MJ, FramptonMW. 2001. Chemiluminescent measurements of nitricoxide pulmonary diffusing capacity and alveolar produc-tion in humans. J Appl Physiol 91:1931–1940.
Peters A, Dockery DW, Muller JE, Mittleman MA. 2001a.Increased particulate air pollution and the triggering ofmyocardial infarction. Circulation 103:2810–2815.

MW Frampton et al
43
Peters A, Döring A, Wichmann H-E, Koenig W. 1997a.Increased plasma viscosity during an air pollution epi-sode: A link to mortality? Lancet 349:1582–1587.
Peters A, Fröhlich M, Döring A, Immervoll T, WichmannH-E, Hutchinson WL, Pepys MB, Koenig W. 2001b. Partic-ulate air pollution is associated with an acute phaseresponse in men: Results from the MONICA–AugsburgStudy. Eur Heart J 22:1198–1204.
Peters A, Liu E, Verrier RL, Schwartz J, Gold DR, Mit-tleman M, Baliff J, Oh JA, Allen G, Monahan K, DockeryDW. 2000. Air pollution and incidence of cardiacarrhythmia. Epidemiology 11:11–17.
Peters A, Perz S, Doring A, Stieber J, Koenig W, WichmannH-E. 1999. Increases in heart rate during an air pollutionepisode. Am J Epidemiol 150:1094–1098.
Peters A, Wichmann H-E, Tuch T, Heinrich J, Heyder J.1997b. Respiratory effects are associated with the numberof ultrafine particles. Am J Respir Crit Care Med 155:1376–1383.
Pietropaoli AP, Perillo IB, Torres A, Perkins PT, FrasierLM, Utell MJ, Frampton MW, Hyde RW. 1999. Simulta-neous measurement of nitric oxide production by con-ducting and alveolar airways of humans. J Appl Physiol87:1532–1542.
Pizzichini E, Pizzichini MM, Efthimiadis A, Hargreave FE,Dolovich J. 1996. Measurement of inflammatory indices ininduced sputum: Effects of selection of sputum to mini-mize salivary contamination. Eur Respir J 9:1174–1180.
Pope CA III, Burnett RT, Thurston GD, Thun MJ, Calle EE,Krewski D, Godleski JJ. 2004. Cardiovascular mortality andlong-term exposure to particulate air pollution: Epidemio-logical evidence of general pathophysiological pathwaysof disease. Circulation 109:71–77.
Pope CA III, Dockery DW, Kanner RE, Villegas GM,Schwartz J. 1999a. Oxygen saturation, pulse rate, and par-ticulate air pollution: A daily time-series panel study. AmJ Respir Crit Care Med 159:365–372.
Pope CA III, Verrier RL, Lovett EG, Larson AC, RaizenneME, Kanner RE, Schwartz J, Villegas GM, Gold DR,Dockery DW. 1999b. Heart rate variability associated withparticulate air pollution. Am Heart J 138:890–899.
Priori SG, Mortara DW, Napolitano C, Diehl L, Paganini V,Cantù F, Cantù G, Schwartz PJ. 1997. Evaluation of the spa-tial aspects of T-wave complexity in the long-QT syn-drome. Circulation 96:3006–3012.
Pritchard RJ, Ghio AJ, Lehmann JR, Winsett DW, Tepper JS,Park P, Gilmour MI, Dreher KL, Costa DL. 1996. Oxidantgeneration and lung injury after particulate air pollutantexposure increase with the concentrations of associatedmetals. Inhalation Toxicol 8:457–477.
Robbins RA, Springall DR, Warren JB, Kwon OJ, ButteryLD, Wilson AJ, Adcock IM, Riveros-Moreno V, Moncada S,Polak J. 1994. Inducible nitric oxide synthase is increasedin murine lung epithelial cells by cytokine stimulation.Biochem Biophys Res Commun 198:835–843.
Rothlein RM, Czajkowski M, O'Neill MM, Marlin SD,Mainolfi E, Merluzzi VJ. 1988. Induction of intercellularadhesion molecule 1 on primary and continuous cell linesby pro-inflammatory cytokines. Regulation by pharmaco-logic agents and neutralizing antibodies. J Immunol141:1665–1669.
Ruiz PE, Ponce ZA, Scanne OF. 1996. Early action poten-tial shortening in hypoxic hearts: Role of chloride cur-rent(s) mediated by catecholamine release. J Mol CellCardiol 28:279–290.
Rylander R, Snella M-C. 1983. Endotoxins and the lung:Cellular reactions and risk for disease. Prog Allergy33:332–344.
Sader MA, Celermajer DS. 2002. Endothelial function, vas-cular reactivity and gender differences in the cardiovas-cular system. Cardiovasc Res 53:597–604.
Salmi M, Jalkanen S. 1997. How do lymphocytes knowwhere to go: Current concepts and enigmas of lymphocytehoming. Adv Immunol 64:139–218.
Salvi S, Blomberg A, Rudell B, Kelly F, Sandström T, Hol-gate ST, Frew A. 1999. Acute inflammatory responses inthe airways and peripheral blood after short-term exposureto diesel exhaust in healthy human volunteers. Am JRespir Crit Care Med 159:702–709.
Samet JM, Dominici F, Curriero FC, Coursac I, Zeger SL.2000a. Fine particulate air pollution and mortality in 20US cities, 1987–1994. N Engl J Med 343:1742–1749.
Samet JM, Zeger SL, Dominici F, Curriero F, Coursac I,Dockery DW, Schwartz J, Zanobetti A. 2000b. The NationalMorbidity, Mortality, and Air Pollution Study, Part II: Mor-bidity and Mortality from Air Pollution in the UnitedStates. Research Report 94. Health Effects Institute, Cam-bridge MA.
Schwarz E, Schafer C, Bode JC, Bode C. 2000. Influence ofthe menstrual cycle on the LPS-induced cytokine responseof monocytes. Cytokine 12:413–416.

44
Ultrafine Carbon Particles in Healthy and Asthmatic Subjects
Searle SR, Casella G, McCulloch CE. 1992. Variance Com-ponents. John Wiley & Sons, New York NY.
Seaton A, MacNee W, Donaldson K, Godden D. 1995. Par-ticulate air pollution and acute health effects. Lancet345:176–178.
Seaton A, Soutar A, Crawford V, Elton R, McNerlan S,Cherrie J, Watt M, Agius R, Stout R. 1999. Particulate airpollution and the blood. Thorax 54:1027–1032.
Stearns RC, Murthy GGK, Skornik W, Hatch V, Katler M,Godleski JJ. 1994. Detection of ultrafine copper oxide par-ticles in the lungs of hamsters by electron spectroscopicimaging. In: Proceedings of the 13th International Con-gress of Electron Microscopy (Jouffrey B, Colliex C, eds),pp 763–764. Les Editions de Physique, Paris, France.
Strehlow K, Rotter S, Wassmann S, Adam O, Grohe C,Laufs K, Bohm M, Nickenig G. 2003. Modulation of antiox-idant enzyme expression and function by estrogen. CircRes 93:170–177.
Su Y, Sipin MF, Furutani H, Prather KA. 2004. Develop-ment and characterization of an aerosol time-of-flight massspectrometer with increased detection efficiency. AnalChem 76:712–719.
Svartengren M, Anderson M, Bylin G, Philipson K,Camner P. 1991. Regional deposition of 3.6-micron parti-cles and lung function in asthmatic subjects. J ApplPhysiol 71:2238–2243.
Tan WC, Qiu D, Liam BL, Ng TP, Lee SH, van Eeden SF,D'Yachkova Y, Hogg JC. 2000. The human bone marrowresponse to acute air pollution caused by forest fires. Am JRespir Crit Care Med 161:1213–1217.
Tolbert PE, Mulholland JA, MacIntosh DL, Xu F, Daniels D,Devine OJ, Carlin BP, Klein M, Dorley J, Butler AJ, Norden-berg DF, Frumkin H, Ryan PB, White MC. 2000. Air qualityand pediatric emergency room visits for asthma in Atlanta,Georgia. Am J Epidemiol 151:798–810.
Ebelt S, Brauer M, Cyrys J, Tuch T, Kreyling WG, Wich-mann HE, Heinrich J. 2001. Air quality in postunificationErfurt, East Germany: associating changes in pollutantconcentrations with changes in emissions. Environ HealthPerspect 109:325–333.
Utell MJ, Drew R. 1998. Summary of the workshop on clin-ical studies and particulate matter. Inhalation Toxicol10:625–638.
Utell MJ, Frampton MW, Zareba W, Devlin RB, Cascio WE.2002. Cardiovascular effects associated with air pollution:
Potential mechanisms and methods of testing. InhalationToxicol 14:1231–1247.
van Eeden SF, Granton J, Hards JM, Moore B, Hogg JC.1999. Expression of the cell adhesion molecules on leuko-cytes that demarginate during acute maximal exercise. JAppl Physiol 86:970–976.
Virchow JC Jr, Walker C, Hafner D, Kortsik C, Werner P,Matthys H, Kroegel C. 1995 T cells and cytokines in bron-choalveolar lavage fluid after segmental allergen provoca-tion in atopic asthma. Am J Respir Crit Care Med 151:960–968,
Walker C, Bode E, Boer L, Hansel TT, Blaser K, Virchow JCJr. 1992. Allergic and nonallergic asthmatics have distinctpatterns of T-cell activation and cytokine production inperipheral blood and bronchoalveolar lavage. Am RevRespir Dis 146:109–115.
Wallenstein S, Fisher AC. 1977. The analysis of the two-period repeated measurements crossover design withapplication to clinical trials. Biometrics 33:261–269.
Weiss A, Samelson LE. 2003. T-lymphocyte activation. In:Fundamental Immunology, 5th edition (Paul WE, ed), pp321–364. Lippincott Williams & Wilkins, Philadelphia PA.
Wichmann H-E, Spix C, Tuch T, Wölke G, Peters A, Hein-rich J, Kreyling WG, Heyder J. 2000. Daily Mortality andFine and Ultrafine Particles in Erfurt, Germany, Part I: Roleof Particle Number and Particle Mass. Research Report 98.Health Effects Institute, Cambridge MA.
Wilson FJ Jr, Hiller FC, Wilson JD, Bone RC. 1985. Quanti-tative deposition of ultrafine stable particles in the humanrespiratory tract. J Appl Physiol 58:223–229.
Wilson JW, Djukanovic R, Howarth PH, Holgate ST. 1992.Lymphocyte activation in bronchoalveolar lavage andperipheral blood in atopic asthma. Am Rev Respir Dis145:958–960.
Wilson JW, Djukanovic R, Howarth PH, Holgate ST. 1994.Inhaled beclomethasone dipropionate downregulatesairway lymphocyte activation in atopic asthma. Am JRespir Crit Care Med 149:86-90.
Yates DH, Kharitonov SA, Robbins RA, Thomas PS, BarnesPJ. 1995. Effect of a nitric oxide synthase inhibitor and aglucocorticosteroid on exhaled nitric oxide. Am J RespirCrit Care Med 152:892–896.
Zareba W, Nomura A, Couderc JP. 2001. Cardiovasculareffects of air pollution: What to measure in ECG? EnvironHealth Perspect 109(Suppl 4):533–538.

MW Frampton et al
45
APPENDIX A. HEI Quality Assurance Audit Statement
The conduct of this study was subjected to periodic,independent audits by a team from Hoover Consultants.This team consisted of an auditor with experience in toxi-cology and epidemiology and a practicing board certifiedphysician epidemiologist. The audits included in-processmonitoring of study activities for conformance to the studyprotocol and examination of records and supporting data.The dates of each audit are listed in the table below withthe phase of the study examined.
QUALITY ASSURANCE AUDITS
Date, Phase of Study Audited:
September 7–8, 1999 The audit team conducted a phaseaudit of the UPREST study and observed proceduresinvolving the second exposure for the eleventh subjectincluding blood and sputum sampling, measurement ofairway production of NO, processing of biological sam-ples and the exposure itself. The following documenta-tion was examined and/or audited: study protocol dated12/24/98, subject consent form, summary of work andresults dated July 30, 1999, a report describing the pre-liminary phase of the study (8/15/98–12/31/98)including development of the exposure system and aprotocol for the UPDOSE study, subject tracking binder,medical information on each subject, Excel database ofmedical data derived from hard copy records, StandardOperating Procedures and reports from the University ofRochester Quality Assurance Officer.
March 12–13, 2001 A phase audit of the UPASTHMAstudy was conducted. Records for the UPDOSE studyand the initial subject exposures for the UPASTHMAstudy were audited. Records included a summary of thework and results for two study periods, the protocol forthe UPASTHMA study, Consent Form for UPASTHMAsubjects, methods for processing of Holter data and sum-marized cardiac data. Audit findings from the previousaudit were examined to determine that adequate follow-up had occurred.
October 4–5, 2004 Galley proofs of the study report wereaudited against the data and records from the study.
Written reports of each inspection were provided to theDirector of Science of the Health Effects Institute whotransmitted these findings to the Principal Investigator.
These quality assurance audits demonstrated the studywas conducted by a well-coordinated, experienced teamaccording to the study protocol and standard operatingprocedures. The report appears to be an accurate represen-tation of the study.
ABOUT THE AUTHORS
Mark W Frampton is professor of medicine and environ-mental medicine at the University of Rochester MedicalCenter. He received his MD from New York UniversitySchool of Medicine in 1973. His research interests focus onthe health effects of exposure to atmospheric pollutants.
Mark J Utell is professor of medicine and environmentalmedicine and director of the Pulmonary/Critical Care andOccupational/Environmental Medicine Divisions at theUniversity of Rochester Medical Center. He received hisMD from the Tufts University School of Medicine in 1972.His research interests center on the effects of environ-mental pollutants on the human respiratory tract.
Wojciech Zareba is research associate professor of medi-cine in the Cardiology Division at the University of Roch-ester Medical Center. He received his MD and PhD fromthe Medical University of Lodz, Poland. His research inter-ests focus on cardiac electrophysiology and on the cardio-vascular effects of inhaled particles.
Günter Oberdörster is professor of toxicology andoncology at the University of Rochester School of Medi-cine and Dentistry and director of the University of Roch-ester Environmental Protection Agency PM Center. Hereceived his DVM and PhD from the University of Giessen,Germany. His research interests focus on the toxicology ofinhaled fine and ultrafine particles.
Christopher Cox, at the time these studies were initiated,was professor of biostatistics at the University of RochesterMedical Center. He is currently in the Division of Epidemi-ology, Statistics and Prevention, National Institute of ChildHealth and Human Development, Bethesda, Maryland. Hereceived his PhD degree in mathematics from the Univer-sity of Illinois in 1972. He continues to collaborate with anumber of research groups at the University of RochesterMedical Center. His research interests are in the area ofexponential family regression models.

46
Ultrafine Carbon Particles in Healthy and Asthmatic Subjects
Li-Shan Huang is assistant professor of biostatistics at theUniversity of Rochester Medical Center and acting directorof the Biostatistics Facility Core of the EnvironmentalHealth Sciences Center. She received her PhD degree instatistics from the University of North Carolina at ChapelHill. Her research interests involve smoothing methods instatistics, dimensional reduction techniques, measure-ment air models, and statistical applications in environ-mental and health sciences.
Paul E Morrow received his BS and MS degrees in chem-istry from the University of Georgia and his PhD in phar-macology from the University of Rochester. He receivedpostdoctoral training at the University of Göttingen (1959)and the University of Zurich (1960) and spent sabbaticalleaves with the Medical Research Council ToxicologyUnit, Carshalton, England, and the Comitato NacionaleEnergie Nucleare (Casaccia), Rome, Italy in 1968 and 1969.He is currently emeritus professor of toxicology and bio-physics. Dr Morrow’s primary research interest is the pul-monary toxicology of inhaled substances.
F Eun-Hyung Lee is assistant professor of medicine in thePulmonary and Critical Care Division at the University ofRochester Medical Center. She received her MD degree fromJohns Hopkins University School of Medicine in 1993.
David Chalupa is a technical associate II in the Pulmonaryand Critical Care Division at the University of RochesterMedical Center. He received his BS degree from RochesterInstitute of Technology and his MS degree from the Uni-versity of Rochester. He helped design and construct theultrafine particle inhalation facility and conducted andsupervised the inhalation exposures.
Lauren M Frasier is laboratory technician V at the Univer-sity of Rochester Medical Center. She received her BSdegree from Nazareth College and her MBA degree from StJohn Fisher College in Rochester, New York. She measuredthe airway NO production and of NO2/NO3 concentrationsin blood plasma and processed the induced sputum.
Donna M Speers is senior technical associate in the Pul-monary and Critical Care Division at the University ofRochester Medical Center. She received her BS degree inchemistry from Valparaiso University and her MS degreein statistics from the Rochester Institute of Technology.She recruited and screened the volunteers, administeredpulmonary function testing and ECG monitoring, and per-formed data analysis.
Judith Stewart is technical associate I at the University ofRochester School of Medicine. She directed the cellbiology laboratory in the Pulmonary and Critical CareDivision and performed the flow cytometry analyses inthese studies.
OTHER PUBLICATIONS RESULTING FROM THIS RESEARCH
Chalupa DC, Morrow PE, Oberdörster G, Utell MJ,Frampton MW. 2004. Ultrafine particle deposition in sub-jects with asthma. Environ Health Perspect 112:879–882.
Pietropaoli AP, Frampton MW, Hyde RW, Morrow PE, Ober-dörster G, Cox C, Speers DM, Frasier LM, Chalupa DC, HuangL-S, Utell MJ. 2004. Pulmonary function, diffusing capacityand inflammation in healthy and asthmatic subjects exposedto ultrafine particles. Inhal Toxicol 16(Suppl 1):59–72.
Pietropaoli AP, Frampton MW, Oberdörster G, Cox C,Huang L-S, Marder V, Utell MJ. 2004. Blood markers ofcoagulation and inflammation in healthy human subjectsexposed to carbon ultrafine particles, pp 181–194. In:Effects of Air contminants on the Respiratory Tract. Inter-pretations from Molecular to Meta Analysis. INIA Mono-graphs, Fraunhofer IRB-Verlag, Stuttgart, Germany.
Daigle OC, Chalupa DC, Gibb FR, Morrow PE, ObstdörsterG, Utell MJ, Frampton MW. 2003. Ultrafine particle depo-sition in humans during rest and exercise. Inhal Toxicol15:539–552.
Chalupa DF, Gibb FR, Morrow PE, Oberdörster G, Riesen-feld E, Gelein R, Utell MJ, Frampton MW. 2002. A facilityfor controlled human exposures to ultrafine particles, pp241–253. In: Crucial Issues in Inhalation Research. Mecha-nistic, Clinical and Epidemiologic (Heinrich U, Mohr U,eds). ILSI Press, Washington DC.
Utell MJ, Frampton MW, Zareba W, Devlin RB, Cascio WE.2002. Cardiovascular effects associated with air pollution:Potential mechanisms and methods of testing. Inhal Tox-icol 14:1231–1247.
Frampton MW. 2001. Systemic and cardiovascular effectsof airway injury and inflammation: Ultrafine particleexposure in humans. Environ Health Perspect 109(Suppl4):529–532.
Frampton MW, Utell MJ, Samet JM. 2000. Cardiopulmo-nary consequences of particle inhalation. pp 653–670. In:Particle-Lung Interactions (Gehr P, Heyder J, eds).
Risenfeld E, Chalupa D, Gibb FR, Oberdörster G, Gelein R,Morrow PE, Utell MJ, Frampton MW. 2000. Ultrafine par-ticle concentrations in a hospital. Inhal Toxicol 12(Suppl4):83–94.
Utell MJ, Frampton MW. 2000. Acute health effects ofambient air pollution: The ultrafine particle hypothesis. JAerosol Med 13:355–359.
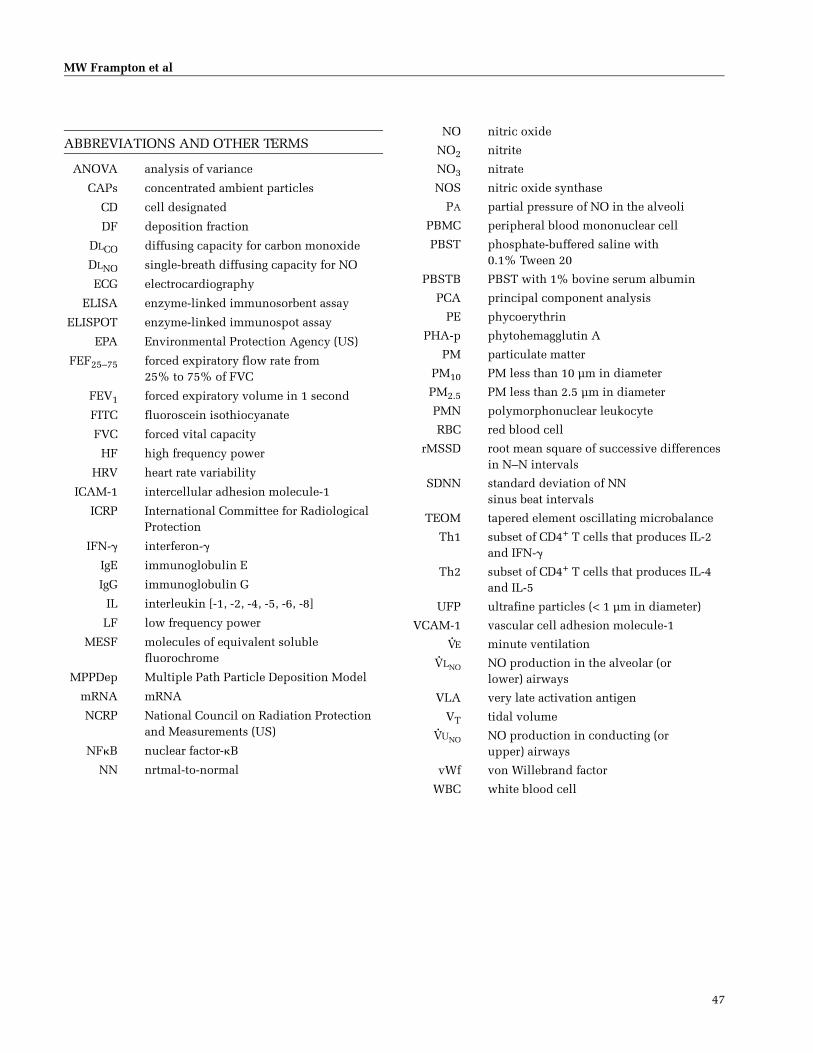
MW Frampton et al
47
ABBREVIATIONS AND OTHER TERMS
ANOVA analysis of variance
CAPs concentrated ambient particles
CD cell designated
DF deposition fraction
DLCO diffusing capacity for carbon monoxide
DLNO single-breath diffusing capacity for NO
ECG electrocardiography
ELISA enzyme-linked immunosorbent assay
ELISPOT enzyme-linked immunospot assay
EPA Environmental Protection Agency (US)
FEF25–75 forced expiratory flow rate from 25% to 75% of FVC
FEV1 forced expiratory volume in 1 second
FITC fluoroscein isothiocyanate
FVC forced vital capacity
HF high frequency power
HRV heart rate variability
ICAM-1 intercellular adhesion molecule-1
ICRP International Committee for Radiological Protection
IFN-� interferon-�
IgE immunoglobulin E
IgG immunoglobulin G
IL interleukin [-1, -2, -4, -5, -6, -8]
LF low frequency power
MESF molecules of equivalent soluble fluorochrome
MPPDep Multiple Path Particle Deposition Model
mRNA mRNA
NCRP National Council on Radiation Protectionand Measurements (US)
NFB nuclear factor-B
NN nrtmal-to-normal
NO nitric oxide
NO2 nitrite
NO3 nitrate
NOS nitric oxide synthase
PA partial pressure of NO in the alveoli
PBMC peripheral blood mononuclear cell
PBST phosphate-buffered saline with 0.1% Tween 20
PBSTB PBST with 1% bovine serum albumin
PCA principal component analysis
PE phycoerythrin
PHA-p phytohemagglutin A
PM particulate matter
PM10 PM less than 10 µm in diameter
PM2.5 PM less than 2.5 µm in diameter
PMN polymorphonuclear leukocyte
RBC red blood cell
rMSSD root mean square of successive differencesin N–N intervals
SDNN standard deviation of NNsinus beat intervals
TEOM tapered element oscillating microbalance
Th1 subset of CD4+ T cells that produces IL-2and IFN-�
Th2 subset of CD4+ T cells that produces IL-4and IL-5
UFP ultrafine particles (< 1 µm in diameter)
VCAM-1 vascular cell adhesion molecule-1
VE minute ventilation
VLNO NO production in the alveolar (or lower) airways
VLA very late activation antigen
VT tidal volume
VUNO NO production in conducting (or upper) airways
vWf von Willebrand factor
WBC white blood cell


Health Effects Institute Research Report 126 © 2004 49
COMMENTARYHealth Review Committee
Ambient particulate matter (PM*) is a complex mixtureof solid and liquid particles suspended in air. The size(ranging from approximately 0.005 to 100 µm in aero-dynamic diameter), chemical composition, and otherphysical and biological properties of these particles varywith location and time. This variability derives from dif-ferences in the sources of PM. The sources may be natural,the result of geographical conditions, weather, seasonalpatterns, or human activities, such as driving vehicles andoperating manufacturing or power plants. In addition,reactive species in the atmosphere combine to generatewhat are known as secondary particles (such as sulfates),which may comprise a significant fraction of total PM.
Although the characteristics of PM differ from place toplace, epidemiologic studies in diverse locations havereported that short-term increases in low levels of PM areassociated with short-term increases in morbidity andmortality (Health Effects Institute 2001, 2003). People withcompromised cardiac or airway function are consideredparticularly susceptible to the effects of PM (reviewed inUS Environmental Protection Agency [EPA] 1996). On thebasis of these and other findings, many governmentalagencies have set regulatory standards or guidelines forlevels of ambient PM. To protect the general populationand groups considered most vulnerable to adverse effectsfrom PM, the EPA promulgated National Ambient AirQuality Standards (NAAQS) in 1997 for particles � 2.5 µmin aerodynamic diameter (PM2.5 or fine particles).
There are several critical questions in PM research:
• Size and chemical composition of particles that maycause harmful human health effects. A key related is-sue is the toxicity of ultrafine particles—particles <100nm in diameter. For reasons described in the ScientificBackground, some scientists believe that this particlefraction may be particularly toxic (the ultrafine hy-pothesis of particle toxicity).
• Potential biologic mechanisms of PM effects that mayunderlie the epidemiologic associations reported be-tween exposure to PM and morbidity and mortality.Currently, PM effects on the respiratory and cardiovas-cular systems are the focus of research (reviewed inHealth Effects Institute 2002).
• Groups of people who may be particularly sensitive tothe effects of PM. People with asthma, a chronic dis-ease of the lower airways, are considered to be one ofthose susceptible groups. Many epidemiologic studieshave reported that short-term exposure to particulatepollution exacerbates the symptoms of asthma (eg,Schwartz et al 1993; Lipsett et al 1997) and decreaseslung function in people with asthma (eg, Pekkanen etal 1997; Peters et al 1997b).
To address these important PM topics, HEI issuedRequest for Applications (RFA) 98-1, Characterization ofExposure to and Health Effects of Particulate Matter,funding 10 experimental and epidemiology studies. A keycomponent of the RFA was the evaluation of health effectsfrom controlled exposures to ambient particles in healthyand sensitive human participants. In response to the RFA,Dr Mark Frampton and colleagues proposed to study theshort-term cardiovascular and airway and systemic inflam-matory effects of exposing healthy and asthmatic people toultrafine carbon particles. They also proposed to measurethe deposition of ultrafine particles in the lungs of partici-pants. The HEI Research Committee recommendedFrampton’s study for funding because few previous studiesin humans had investigated the effects of controlled inha-lation exposure to ultrafine particles, and these had notevaluated cardiovascular effects (Anderson et al 1992;Kuschner et al 1997).†
At the same time that the HEI Research Committee recom-mended Frampton’s study for funding, it also recommendedfunding a similar controlled exposure study by Dr HenryGong and colleagues at Rancho Los Amigos Center, Cali-fornia. Gong and his colleagues also proposed to investigatethe cardiovascular as well as airway and systemic inflam-matory effects of short-term inhalation of particles byhealthy and asthmatic people. Gong and colleaguesintended to use fine particles concentrated from the ambientair (CAPs) in the Los Angeles area. To facilitate comparisonsbetween the results of the Gong and Frampton studies, HEIorganized a workshop before their studies began with bothsets of investigators and with Dr Robert Devlin of the Officeof Research and Development (EPA, Chapel Hill, North
* A list of abbreviations and other terms appears at the end of the Investiga-tors’ Report.
This document has not been reviewed by public or private party institu-tions, including those that support the Health Effects Institute; therefore, itmay not reflect the views of these parties, and no endorsements by themshould be inferred.
† Dr Frampton’s 2-year study, “Health Effects of Exposure to Ultrafine Car-bon Particles in Healthy Subjects and in Subjects with Asthma,” began inAugust 1998. Total expenditures were $1,123,049. The draft Investigators’Report from Frampton and colleagues was received for review in July 2003.A revised report, received in January 2004, was accepted for publication inFebruary 2004. During the review process, the HEI Health Review Commit-tee and the investigators had the opportunity to exchange comments and toclarify issues in both the Investigators’ Report and in the Review Commit-tee’s Commentary.

50
Commentary
Carolina). Dr Devlin, who had initiated a human CAPs expo-sure study in his laboratory but had not yet published theresults, discussed the parameters he was measuring in hisstudy. As a result of this meeting, Gong and Framptonagreed to use similar exposure protocols and to evaluate asimilar set of health endpoints in their HEI studies. Gong’sstudy was recently published (Gong et al 2003). This Com-mentary includes a section that compares the findings of theFrampton and Gong studies and those of the EPAresearchers and their collaborators (Ghio et al 2000; Harderet al 2001; Holgate et al 2003).
SCIENTIFIC BACKGROUND
PM AND CARDIOVASCULAR RESPONSES
Before the current study started, plausible biologicalmechanisms to explain the epidemiologic associationsbetween increases in daily PM levels and short-termincreases in morbidity and mortality were scarce. Con-trolled-exposure studies in laboratory animals, particu-larly in rodents with features induced to model humandisease, had shown that PM could induce inflammation inthe airways. In rats with pulmonary hypertension andright-heart hypertrophy, which had been induced with thecompound monocrotaline, intratracheal instillation ofhigh concentrations of residual-oil fly ash (a highly toxic,combustion-generated, urban particulate rich in metals)generated inflammation in the airways and led to death ofsome animals (Costa et al 1994; Killingsworth et al 1997).
In addition, a preliminary study (Gordon et al 1998) ofrats that inhaled fine particles (concentrated approxi-mately sixfold from ambient air in New York City) showedno changes in lung inflammatory markers, but smallchanges in the distribution of peripheral blood leukocytes(an increased percentage of neutrophils and a decreasedpercentage of lymphocytes). This finding suggested thatexposure to CAPs might induce inflammatory effectsdetectable in the circulation (Gordon et al 1998).
In 1995, Seaton and colleagues proposed that particledeposition in the airways would lead to a systemic inflam-matory response, followed by an acute phase response(Seaton et al 1995). The acute phase response is part of thebody’s defenses against infectious and other noxiousagents. Within hours of exposure, the body produces pro-teins in the circulation that include serum amyloid A, C-reactive protein, and fibrinogen. Because fibrinogen bindsto platelets and contributes to their aggregation, Seatonand colleagues proposed that particle deposition in the air-ways would lead to a transient increase in the coagulability
of blood. This, in turn, would result in an increased risk ofthrombus formation and possible cardiovascular conse-quences. Subsequently, Peters and colleagues (1997a)found an increase in plasma viscosity associated withexposure to PM in Augsburg, Germany.
In the current study, Frampton and colleagues measuredmany parameters associated with the inflammatory andcoagulation pathways. Sidebar 1 describes how theseparameters are associated with cardiovascular responsesand asthma. Prior to Frampton’s work, some studies hadalso suggested that animals exposed to PM undergochanges in cardiac rhythm (namely, heart rate variability[HRV] (fluctuations in the rhythm of the heart beat) andrepolarization (the time between electrical stimuli gov-erning contraction and relaxation of the heart) (Campen et al1997; Godleski et al 1997; Watkinson et al 1998). Godleskiand colleagues found that a small number of dogs exposedintratracheally to a CAPs aerosol (concentrated up to 60times more than ambient fine particle levels in Boston air)showed cardiac electrophysiologic changes (Godleski et al1997). Watkinson and colleagues showed that intratrache-ally instilled residual-oil fly ash generated arrhythmias inmonocrotaline-treated rats (Watkinson et al 1998).
TOXICITY OF ULTRAFINE PARTICLES
Particles of different sizes have been associated withhealth effects. Some scientists have hypothesized thatultrafine particles—emitted in high numbers by combus-tion engines and the dominant contributor of particlenumber in PM2.5—may be especially toxic. This hypoth-esis is based on initial findings (reviewed in Utell andFrampton [2000], Frampton [2001], and Oberdörster[2001]) that suggest:
1. Smaller particles may penetrate deeper into the airwaysthan larger particles do and reach the alveolar regions ofthe lungs.
2. Smaller particles have a greater total surface area thanlarger particles of the same mass. Thus, they maypresent a larger surface area for interacting with airwaytissue or for transporting toxic material associated withthe particle surface into the airways.
3. In vitro, smaller particles are not as effectively phagocy-tosed (ie, ingested for removal by cells of the innateimmune response) as larger particles are.
4. In animals, ultrafine particles instilled intratracheallyare more effective than fine particles in inducing airwayinflammatory responses.
5. Smaller particles may move rapidly to tissues outsidethe airways (Nemmar et al 2001, 2002).

51
Health Review Committee
Few studies have compared the effects of exposure toultrafine and fine particles via inhalation, the normal phys-iologic route. The results of recent studies suggest thatproperties other than size, such as solubility, are likely toplay an important role in particle effects (Leikauf et al2001; Hahn et al 2004).
Prior to the current study, some epidemiologic studieshad described associations between increases inrespiratory effects and exposure to ultrafine particles inchildren with asthma (Pekkanen et al 1997; Peters et al1997b). However, these studies found no greater effect forultrafine particles than for fine particles, so did notestablish whether ultrafine particles have a largerindependent effect. In addition, during the early stages ofthe current study, Wichmann and colleagues (2000)reported that mortality was associated with ultrafine
particle levels in a German city, Erfurt. The associationreported between ultrafine particles and mortality,however, was not greater than associations reported forother components of the PM mix. Few studies hadevaluated the effects of controlled human inhalationexposure to ultrafine particles: Anderson and colleagues(1992) found little or no effect on respiratory function orsymptoms immediately after 15 healthy and 15 asthmaticvolunteers had inhaled 100 µg/m3 ultrafine sulfuric acidaerosol for 2 hours with intermittent exercise. In 6 healthyvolunteers, Kuschner and colleagues (1997) found little orno effect on cell numbers and cytokine concentrations inbronchoalveolar lavage fluid, pulmonary function, orperipheral blood neutrophil concentrations 18 to 20 hoursafter inhaling a high concentration of fine and ultrafinemagnesium oxide particles.
SIDEBAR 1. INFLAMMATION IN CARDIOVASCULAR RESPONSES AND ASTHMA
Foreign agents such as particles, bacteria, or viruses that enter the tissues trigger an inflammatory response, a cascade of events that activates mul-tiple cell types throughout the host and leads to elimination of the foreign agent (Health Effects Institute 2002). Inflammation in the airways mani-fests as an increase in numbers of certain types of leukocytes (white blood cells)—such as macrophages, neutrophils, eosinophils, or lymphocytes—in lung tissue or lung fluids. The types of leukocytes that are found depend on several factors, including time after induction of the response and ini-tial state of the host’s airways (eg, healthy vs inflamed). One early characteristic of the inflammatory response is the induction or increase in expression of molecules such as lymphocyte function–associ-ated antigen-1 (LFA-1 or CD11aCD18) and very late antigen 4 (VLA-4 or CD49dCD29) on the surface of neutrophils and macrophages (see Sidebar 2). These phagocytic cells are involved in the first lines of the body’s defenses. Sidebar 2 explains the standard nomenclature for surface molecules expressed by leukocytes.Endothelial cells—the cells at the interface of blood vessels and tissues—are also activated by the inflammatory response. As a consequence, they increase the expression of adhesion molecules, such as vascular cell adhe-sion molecule-1 (VCAM-1), intercellular adhesion molecule-1 (ICAM-1), and E- and P-selectins. These molecules are the ligands for adhesion mol-ecules, such as LFA-1, expressed by the activated leukocyte. Through these paired interactions, the adhesion of leukocytes to endothelial cells is increased in the inflammatory response. As a consequence of activation and increased adhesive properties, neutrophils or macrophages move from the blood, through the endothelial cell layer, and into the tissue. Inflammatory responses that start in the airways may also be detected in the circulation. After leukocytes and endothelial cells have been activated, many of the surface molecules induced (including VCAM-1 and ICAM-1) are shed or secreted into the plasma, where the soluble forms of these molecules can be measured and used as markers of inflammation. In addi-tion, during migration of cells into the lung and subsequent stages of the inflammatory process, activated leukocytes and the airway epithelial and endothelial cells release cytokines and chemokines, which are mediators that facilitate communication among cells. These mediators may be found in the lungs and in the circulation. Among these are the proinflammatory cytokines interleukin [IL] 6 and 8. IL-8 is chemotactic for phagocytic cells, including neutrophils; that is, it induces these cells to move down a concen-tration gradient toward the IL-8 source. IL-6 stimulates the liver to secrete the acute-phase proteins, which appear in the circulation within 6 to 24 hours. One of the acute-phase proteins, fibrinogen, is involved in platelet aggregation, which affects the cardiovascular system. Platelet aggregation also releases CD40 ligand (CD40L) into the circulation, where the soluble
form of the molecule, sCD40L, can be measured. Proinflammatory cytokines also induce the expression of nitric oxide (NO) synthase in airway cells; the synthesis of NO by this enzyme is thought to play a role in inflammatory dis-eases of the airways (Barnes 1996). Because coronary heart disease is now understood to involve inflamma-tion in blood vessels, molecules associated with the inflammatory and acute phase responses (C-reactive protein, fibrinogen, and sCD40L in particular) are currently used or being considered as risk factors for cor-onary heart disease and other cardiovascular events (Freedman 2003; Tall 2004). Chronic airway inflammation is a characteristic of asthma. Other features of asthma are the presence of eosinophils in the airways and a skewing of the immune response of T lymphocytes toward what is known as the Th2 pattern. This immune response involves the production of cytokines, including IL-4, IL-5, and IL-13, by the Th2 subset of CD4+ T lymphocytes.
SIDEBAR 2. NOMENCLATURE FOR CELL DESIGNATED NUMBERS
To standardize nomenclature of molecules expressed on the surface of cells in many different species, molecules have been assigned cell desig-nated (CD) numbers (eg, CD4 or CD19). Some two-chain molecules have two CD designations (eg, CD11aCD18). Currently, more than 250 mole-cules have been given such CD designations. This nomenclature highlights the fundamental similarities from species to species in the structure and function of molecules with the same CD designation. Some surface mole-cules have a limited cellular distribution. For example, CD3 is expressed only on T lymphocytes and natural killer cells, and CD154 (also known as CD40 ligand [CD40L]) is expressed primarily on platelets and activated T lymphocytes. Other molecules may be expressed on multiple cell types: CD54 (also known as intercellular adhesion molecule–1 [ICAM-1]) is expressed on all leukocytes.Many cell surface–associated molecules are still commonly known by their original nonstandard names and abbreviations. For example, both inter-cellular adhesion molecule-1 and ICAM-1 are used for CD54. Table 1 of the Investigators’ Report lists the CD designation, the commonly accepted name, and the function of each molecule evaluated in the cur-rent study. To be compatible with Frampton and colleagues’ Investigators’ Report, we use the nonstandard names in this Commentary.

52
Commentary
In addition, few studies had examined the deposition ofultrafine particles in the airways during spontaneousbreathing or exercise (Anderson et al 1990). Frampton andcolleagues’ study examined the short-term effects ofinhaling ultrafine particles on airway deposition and car-diovascular and respiratory parameters in healthy andasthmatic individuals.
OBJECTIVES
The objectives of the study were:
1. Develop a facility for controlled inhalation exposures ofhumans to ultrafine particles.
2. Measure the pulmonary fractional deposition ofultrafine carbon particles in healthy and asthmaticpeople.
3. Evaluate airway and systemic responses in healthy andasthmatic individuals who were exposed to 10 or 25µg/m3 ultrafine carbon particles by inhalation for 2hours. The parameters to be measured included: respira-tory function; airway inflammation; expression of bloodleukocyte and endothelial adhesion molecules; markersof the systemic acute phase response and blood coagula-bility; and cardiac electrical activity and repolarization.
The investigators hypothesized that exposure toultrafine particles would induce airway inflammation byactivating circulating leukocytes and vascular endothe-lium. In turn, this would result in a systemic acute phaseresponse and a transient increase in coagulability (hyper-coagulability). Induction of a hypercoagulable state mightbe associated with changes in levels of circulating cardio-vascular mediators that might in turn lead to changes inHRV and repolarization. Frampton and colleagues alsohypothesized that induction of inflammation might lead tocardiac electrophysiologic changes mediated via the auto-nomic nervous system (the branch of the nervous systemthat controls peripheral organs). People identified fromepidemiologic studies as being susceptible to particleeffects (such as people with asthma) would be moreaffected than healthy people.
Frampton and colleagues further hypothesized that dep-osition of ultrafine particles would be greater in peoplewith asthma compared with healthy individuals. Theinvestigators also postulated that exposure to ultrafine par-ticles might skew the immune response in people withasthma further toward Th2 cytokine production.
STUDY DESIGN
EXPOSURE PROTOCOLS
The investigators exposed healthy and asthmatic volun-teers (lifetime nonsmokers, aged 18–40 years) by mouth-piece for 2 hours/session to ultrafine carbon particles andfiltered air (ambient air passed through charcoal and highefficiency particle filters). Participants wore noseclipsduring the exposure. They were allowed to remove themouthpiece for 10 minutes after 1 hour of exposure. Theinvestigators performed three substudies, each with equalnumbers of male and female participants:
1. UPREST: 12 healthy participants exposed at rest to10 µg/m3 ultrafine carbon particles and to filtered air.Exposures were separated by at least 2 weeks.
2. UPDOSE: 12 healthy participants exposed to 10 and25 µg/m3 ultrafine carbon particles and to filtered air.Exposures were separated by at least 2 weeks. Partici-pants exercised intermittently on a stationary bicycle—for the first 15 minutes of each half hour of exposure atan intensity adjusted to increase the minute ventilationto approximately 20 L/min/m2 body surface area. Forsafety reasons, the investigators restricted randomizedexposures so that each participant received the 10 µg/m3
exposure before the 25 µg/m3 exposure.
3. UPASTHMA: 16 asthmatic participants exposed to10 µg/m3 ultrafine particles and to filtered air with inter-mittent exercise (as in the UPDOSE protocol). Exposureswere separated by at least 3 weeks. The severity ofasthma in the study participants was consistent with theUS National Institutes of Health (NIH) classification ofmild intermittent, mild persistent, or moderate persis-tent asthma (NIH 1997). Originally, the investigatorsproposed a dose–response study using 10 and 25 µg/m3
ultrafine particles that paralleled the UPDOSE protocol.Because Frampton and colleagues thought that asth-matic participants might have severe responses to thehigher level of particles, they used only the lower expo-sure concentration but increased the number of partici-pants in an attempt to enhance their ability to detecteffects at the lower exposure level.
Each substudy required 5 to 7 visits for each subject. Thefirst visit was a screening that included a physical examina-tion, exercising on a stationary bicycle to measure minuteventilation, and sputum induction. On the next visit, at leasta week later, the investigators measured blood pressure, pul-monary function by spirometry, heart rate, oxygen satura-tion by pulse oximetry, and levels of exhaled NO. They alsotook a blood sample, attached a 12-lead Holter heart monitor

53
Health Review Committee
(worn until the following day), and took a resting 10-minuteelectrocardiogram recording. In addition, they asked eachperson to fill out a symptom questionnaire.
Subjects were then exposed to particles or filtered air for 2hours. The investigators measured the same set of physio-logic, cardiovascular, and inflammatory parameters immedi-ately after exposure and 3.5 hours later. The participantsremained in the Rochester Clinical Research Center until thelatter measurements had been made. Study participants weredischarged and given an activity diary. They returned in themorning of the day after exposure and the investigators madethe same set of measurements they had taken previously. Inaddition, the investigators induced sputum in the volun-teers; that is, at a timepoint 22 hours after exposure.
Frampton and colleagues made an identical set of mea-surements when the study participants returned for subse-quent exposures . In the UPASTHMA substudy,participants returned for an additional set of measure-ments 2 days after exposure; this set also included a 10-minute ECG recording. The investigators also asked thetest subjects to assess the severity of their symptoms on ascale of 0 to 5 after exposure.
PARTICLE GENERATION AND EXPOSURE SYSTEM
Frampton and colleagues generated ultrafine carbon par-ticles (count median diameter approximately 25 nm) fromthe spark discharge of graphite electrodes; they added fil-tered air to the particles to achieve the target concentra-tions of 10 and 25 µg/m3. Analysis of particle compositionindicated that the spark discharge generated organiccarbon species in addition to elemental carbon, as hadbeen described by others (McDonald et al 2001). Usingtime of flight mass spectrometry, the investigators deter-mined that 96% of the particles emerging from the sparkgenerator consisted of elemental carbon. Thus, they con-cluded that the organic carbon compounds detected mighthave been artifacts that resulted from collecting particleson Teflon filters.
Frampton and colleagues used condensation particlecounters and an electrical detection mobility analyzer todetermine the distribution of particle sizes and particlenumber, surface area, and volume concentrations in theinspired and expired aerosols. The investigators measuredparticle mass concentrations using a tapered element oscil-lating microbalance.
PARTICLE DEPOSITION
The investigators measured inspired and expired particleconcentrations continuously every 5 seconds during the
exposure. They calculated a total respiratory deposition frac-tion for number and mass concentration using the equation:
Deposition Fraction = Inspired Concentration�Expired Concentration)/Inspired Concentration.
Frampton and colleagues calculated the deposition frac-tion for total ultrafine particles as well as for each of 8 sizebins, ranging from 7.5 to 75.0 nm count median diameter(midpoints 8.7–64.9 nm). The investigators compared thedeposition fractions they calculated with theoretical deposi-tion fractions generated using three different models: (1) theInternational Committee for Radiological Protection model;(2) the National Committee for Radiological Protectionmodel; and (3) the Multiple Path Particle Deposition Model.
MEASUREMENT OF BIOLOGICAL FUNCTION
Pulmonary Function
The investigators measured forced vital capacity (FVC)and forced expiratory volume in 1 second (FEV1) byspirometry, lung volumes by plethysmography, and dif-fusing capacity for carbon monoxide (DLCO). They alsomade continuous measurements of respiratory rate andminute ventilation.
Airway Nitric Oxide
Frampton and colleagues separately calculated NO pro-duction in the conducting (upper) airways and in the alve-olar (lower) airways. They also measured NO concentrationsin exhaled breath.
Blood Markers of Coagulation, Inflammation, and the Immune Response
Frampton and colleagues measured multiple solublemarkers in blood. These included the cytokine IL-6; thecoagulants factor VII and von Willebrand factor (vWf); andcomponents of the acute phase response, fibrinogen, andserum amyloid A. They also measured several moleculesshed from cells into blood: the soluble forms of ICAM-1(sICAM-1), L-selectin (sCD62L), P-selectin (sCD62P), E-selectin (sCD62E), VCAM-1 (sVCAM-1), and CD40 ligand(sCD40L). In asthmatic participants they also measured thenumber of lymphocytes expressing the cytokines inter-feron gamma (IFN-�) and IL-4, which are associated withthe Th1 and Th2 subsets of CD4+ T cells, respectively.
Using fluorescence-activated cell sorting (FACS),Frampton and colleagues also determined the expressionof several proteins on the surface of different sets of leuko-cytes (described in Table 2 of the Investigators’ Report).This technique allowed the investigators to quantify both

54
Commentary
the number of cells expressing a particular molecule andthe level of expression of that molecule on the cell.Because some of these cell surface molecules are expressedonly after a cell is activated, this analysis also providedsome assessment of cell activation. The following cells andsurface-associated molecules were evaluated:
• T lymphocytes: CD3, CD4, CD8, CD25, and CD45RO;
• B lymphocytes: CD19;
• Natural killer (NK) cells: CD56;
• Adhesion molecules and components of adhesionmolecules: CD11a, CD11b, CD18, CD49d, CD54, andCD62L expressed on multiple cell types;
• Receptors for the Fc portion of specific immunoglobu-lin molecules (Fc receptors): CD16, CD32, and CD64,expressed on multiple cell types.
Sputum Induction
Sputum was induced as part of screening and 22 hoursafter each exposure. The investigators measured differen-tial cell counts in the sputum plug and assayed the cell-free supernatant for IL-6 and IL-8.
Cardiac Monitoring
Frampton and colleagues obtained a continuous 12-leadECG Holter recording for each participant from before thestart of exposure until the following morning. During eachcontinuous ECG recording, the investigators also took 5-minute supine resting ECG readings before exposure,immediately after, and 3.5 and 21 hours after exposure.(For UPASTHMA, subjects also returned 45 hours afterexposure for an additional ECG monitoring session.) Inaddition, 5-minute ECG segments were identified duringthe final 15 minutes of exposure and during the night (2AM) after the exposure.
From the ECG readings, the investigators assessed mul-tiple HRV parameters. These included the high frequencypower (HF, 0.15–0.40 Hz), low frequency power (LF, 0.04–0.15 Hz), and LF/HF ratio; the standard deviation ofnormal-to-normal sinus beat intervals (SDNN) and rootmean square of successive differences in normal-to-normalintervals (rMSSD). They measured beat-to-beat RR intervals,ST segment levels, T wave amplitude, and T wave com-plexity. They also measured QTc, a measurement of the timebetween the start of the depolarization of the ventricles ofthe heart (an electrical stimulus that contracts the heart topump blood) and the end of the repolarization of the ventri-cles (the electrical stimulus that relaxes the heart), correctedfor heart rate. In addition, Frampton and colleagues quanti-fied arrhythmias for the entire recording period.
DATA MANAGEMENT AND STATISTICAL METHODS
UPREST and UPASTHMA
These studies utilized a two-period crossover design inwhich each subject was exposed to both ultrafine particlesand filtered air. The investigators used repeated measuresanalysis of variance (ANOVA) as their standard analysisfor continuous endpoints. In the analysis, order of presen-tation and gender were treated as between-subject factors,and treatment, period, and time (when repeated measure-ments were made after each exposure) were consideredwithin-subject factors. The analysis included tests forperiod and carryover effects. When carryover effects werehighly significant, first period data were examined sepa-rately. For some endpoints, repeated measurements weremade at uniform intervals after each exposure. In thesecases the ANOVA included tests for an effect of time aswell as interactions with other effects in the model.
Each ANOVA included an examination of residuals as acheck on the required assumptions of normally distributederrors with constant variance. If these assumptions werenot satisfied, data transformations (for example, square-root transformation for cell counts) were considered. In thespecial case that only one measurement was made in eachperiod, the ANOVA simplified to three different t tests, fortreatment, period, and carryover effects. In this case, non-parametric tests such as the Wilcoxon rank sum test wereused if the observations were not normally distributed.
UPDOSE
The study utilized a three-period crossover design inwhich each subject received both low (10 µg/m3) and high(25 µg/m3) concentrations of ultrafine particles and filteredair. Because each subject received the low level exposurebefore the higher level, there were three possible exposuresequences depending on where in the sequence the airexposure was placed. Equal numbers of subjects were ran-domly assigned to each sequence. The statistical analysiswas based on the usual ANOVA model for crossoverdesigns; that is, the ANOVA included effects for treatment(three levels), and period (three levels). Because of thenature of the design, carryover effects were limited to havingbeen previously exposed (in the period just before thepresent one) to 10 µg/m3 (all subjects) and 25 µg/m3 (foursubjects). A random subject effect was included in themodel. Interactions between subject and both period andtreatment were also included as random effects. Because thedata were not balanced for this model, parameters for themodel were estimated by the method of maximum likeli-hood. Residuals were examined as a check on the assump-tions, and when necessary, data transformations were

55
Health Review Committee
considered. In some cases a logarithmic or square root trans-formation was necessary to stabilize the variance.
For all the substudies, a P value of 5% was consideredstatistically significant. The HEI Review Committeethought that the investigators’ approach to assessing carry-over effects was appropriate for estimating the main effectsof exposure. However, the report did not discuss thenumber of study participants who manifested carryovereffects or the magnitude of the effects. The investigatorsdid note that “the pattern of carryover effects did not indi-cate any systematic persistence in the second period.”
RESULTS
DEPOSITION OF ULTRAFINE PARTICLES
Based on particle number, the average fractional deposi-tion in the lower airways for ultrafine particles wasapproximately 0.65 for all resting healthy volunteers(Tables 5 and 6); that is, 65% of the inhaled particles weredeposited in the airways. The resting value for asthmaticparticipants was slightly higher, 0.76. From these values,the investigators calculated that the total number of parti-cles deposited in asthmatic participants was 50% greaterthan the number of particles deposited in healthy partici-pants. With exercise, the deposition fraction increased toapproximately 0.85 for healthy and asthmatic participants.The investigators further calculated that four times asmany particles were deposited in the airways of exercisingparticipants—both healthy and asthmatic—than in the air-ways of resting participants. Similar exercise-inducedincreases in particle deposition were found when particlemass was used as the measure. The deposition fraction wasthe same in men and women and after exposures at 10 or25 µg/m3 particles.
In all groups—healthy or asthmatic, at rest or duringexercise—deposition fractions were greater for particles ofsmaller diameter. For example, based on particle number,the deposition fraction at rest was 0.80 for ultrafine parti-cles in the range 7.5 to 10.0 nm but 0.55 for particles in therange 56.2 to 75 nm.
HEALTH EFFECTS ASSOCIATED WITH EXPOSURE TO ULTRAFINE PARTICLES
Overall, few changes were detected at different measure-ment times (0, 3.5, and 21 hours [and 45 hours in asthmaticparticipants only]) after exposure to ultrafine particles inany protocol. Changes in some parameters differed frombaseline only at a single timepoint. In addition, as wasfound in the study by Gong and colleagues, the investigators
noted some changes after the control exposures, whichmay have been the result of exercise. In some importantexamples listed below, the changes reported as a conse-quence of the control exposure were greater than changesafter particle exposure.
The following paragraphs, the Investigators’ ReportTable 20, and the Commentary Table summarize the mainstudy findings. The Commentary Table also compares thefindings of this study with those of the HEI controlled-exposure study by Gong and colleagues (2003) and of thestudies by the EPA group.
• No effects were found in healthy resting volunteers (ie,UPREST) on any inflammatory, cardiovascular or pul-monary function parameter measured.
• Some small changes were noted in exercising healthyand asthmatic volunteers (ie, UPDOSE and UPASTH-MA). Of the changes associated with exposure to ul-trafine particles, many were decreases compared to airexposure. When responses were analyzed separatelyby sex, some exposure-associated effects were greaterin one sex than the other. The key results are describedin the following paragraphs.
Airway Inflammation
No effects on markers in induced sputum were detectedin either exercising healthy or asthmatic volunteers.Parameters examined included total cell numbers, levels ofleukocyte subpopulations, and levels of IL-6 and IL-8. NOproduction in the airways was not affected.
Systemic Inflammation, Coagulation and Cardiovascular Measures
Among soluble markers in healthy participants, the con-trol exposure increased sCD40L levels more than exposureto ultrafine particles (Figure 9). Compared to baselinevalues, the control exposure increased levels by approxi-mately 50% 21 hours after exposure. The control exposureincreased IL-6 levels more than ultrafine particle exposure,particularly in men at 3.5 hours after exposure (Figure 7).At this 3.5-hour timepoint, IL-6 levels in men in the con-trol exposure group were approximately double the base-line value. Fibrinogen and von Willebrand factor levels inhealthy men decreased after exposure to 25 µg/m3 particles(Figure 25); no effects were noted at 10 µg/m3 or at eitherexposure level in women.
In asthmatic participants after ultrafine particle exposure,the soluble marker plasma nitrite/nitrate (a measure ofendogenous NO production) showed a small increase (5–10%) over time, whereas levels decreased in air-exposed

Com
men
tary
Tab
le.
Con
trol
led
Exp
osu
re o
f H
um
ans
to P
arti
cles
: Cu
rren
t S
tud
y, H
EI
Res
earc
h R
epor
t 11
8 (G
ong
et a
l), a
nd
EPA
Stu
die
s
Fra
mp
ton
Gon
gE
PAa
Stu
dy
Des
ign
Par
tici
pan
ts
24 h
ealt
hy
and
16
wit
h m
ild
to
mod
erat
e as
thm
a (1
8–40
yr)
12 h
ealt
hy
and
12
wit
h m
ild
ast
hm
a (1
8–45
yr)
38 h
ealt
hy
(18–
40 y
r)
Met
hod
sE
ach
per
son
exp
osed
to
par
ticl
es a
nd
fil
tere
d a
ir
Eac
h p
erso
n e
xpos
ed t
o p
arti
cles
an
d f
ilte
red
air
E
ach
per
son
exp
osed
to
par
ticl
es (
n =
30)
or
filt
ered
air
(n
= 8
)
Typ
e of
par
ticl
es
Ult
rafi
ne
carb
on p
arti
cles
(7–
75 n
m, 2
5 n
m m
edia
n)
gen
erat
ed i
n
labo
rato
ry
Fin
e C
AP
s (a
vera
ge 1
74 µ
g/m
3 , r
ange
99–
224
µg/
m3 )
fr
om L
os A
nge
les
area
air
; par
ticl
es 0
.6–1
.0 µ
m
pre
fere
nti
ally
con
cen
trat
ed
Fin
e C
AP
s fr
om R
esea
rch
Tri
angl
e P
ark
air
(ran
ge 2
3–31
1 µ
g/m
3 ); p
arti
cles
0.6
–1.0
µm
p
refe
ren
tial
ly c
once
ntr
ated
Exp
osu
res
Inh
alat
ion
via
mou
thp
iece
for
2 h
r H
ealt
hy
rest
ing:
10 µ
g/m
3 H
ealt
hy
exer
cise
: 10
then
25
µg/
m3
Ast
hm
a ex
erci
se: 1
0 µ
g/m
3
Inh
alat
ion
, exe
rcis
e fo
r 2
hr
Inh
alat
ion
, exe
rcis
e fo
r 2
hr
Tim
ing
of
mea
sure
men
tsIm
med
iate
ly b
efor
e, i
mm
edia
tely
aft
er, 3
.5 h
r af
ter,
th
e d
ay a
fter
an
d 2
day
s af
ter
exp
osu
re f
or a
sth
ma
Imm
edia
tely
bef
ore,
im
med
iate
ly a
fter
, 3.5
hr
afte
r,
and
th
e d
ay a
fter
exp
osu
re (
and
2 d
ays
afte
r ex
pos
ure
for
ast
hm
a)
Blo
od: b
efor
e an
d 1
8 h
r af
ter
exp
osu
reB
ron
chos
cop
y an
d la
vage
: 18
hr
afte
r ex
pos
ure
Res
pir
ator
y fu
nct
ion
: bef
ore
and
aft
er e
xpos
ure
Su
mm
ary
of F
ind
ings
1. A
irw
ay
infl
amm
atio
nH
ealt
hy
and
ast
hm
a ex
erci
sin
g: N
o ch
ange
sH
ealt
hy
rest
ing:
No
chan
gesb
Hea
lth
y an
d a
sth
ma:
Few
ch
ange
s;
50%
in
co
lum
nar
ep
ith
elia
l ce
lls
in i
nd
uce
d s
pu
tum
. N
o ch
ange
s in
sp
utu
m I
L-6
or
IL-8
Hea
lth
y ex
erci
sin
g: 3
�
in %
PM
N in
bro
nch
ial
was
h b
ut n
o ch
ange
in to
tal c
ell n
um
ber,
IL-6
or
IL-8
; or
VC
AM
-1 o
r P
-sel
ecti
n in
tiss
ue
biop
sy C
D3+
cel
ls in
tiss
ue
biop
sy
2. S
yste
mic
in
flam
mat
ion
Few
ch
ange
sF
ew c
han
ges
Not
mea
sure
d
a) S
olu
ble
mar
kers
Hea
lth
y ex
erci
sin
g: s
mal
ler
in
sC
D40
L a
nd
IL
-6 w
ith
UF
co
mp
ared
to
air
(abo
ut
50%
)A
sth
ma
mal
e ex
erci
sin
g: s
mal
l N
O
Hea
lth
y an
d a
sth
ma:
sm
all
in
sIC
AM
-1. N
o ch
ange
in
ser
um
am
yloi
d A
b) L
euko
cyte
s H
ealt
hy:
No
dif
fere
nce
bet
wee
n a
ir a
nd
par
ticl
es o
n t
otal
cel
l n
um
ber
(all
exp
osu
res
).H
ealt
hy
fem
ale:
a
bou
t 10%
mon
ocyt
es a
t 21
hr,
5
0% b
asop
hil
s at
all
tim
es; 1
0%
in
CD
25+ T
cel
ls a
t 3.
5 h
r.A
sth
ma:
5
0% b
asop
hil
s at
0 a
nd
3.5
hr,
an
d
10%
CD
4+ T
cel
ls
imm
edia
tely
aft
er e
xpos
ure
.A
dh
esio
n m
olec
ule
s an
d F
c re
cep
tors
: Som
e ch
ange
s in
ex
pre
ssio
n o
n d
iffe
ren
t cel
ls, m
ostl
y ; s
ome
dif
fere
nce
s be
twee
n
hea
lth
y an
d a
sth
ma
Hea
lth
y an
d a
sth
ma:
No
chan
ges
in t
otal
cel
l n
um
ber
or d
iffe
ren
tial
cel
l co
un
tsN
o ef
fect
on
nu
mbe
rs o
f to
tal
cell
s or
leu
kocy
te
subs
ets
3. C
oagu
lati
onH
ealt
hy
mal
e: s
mal
l f
ibri
nog
en a
nd
vW
fH
ealt
hy
and
ast
hm
a: N
o ch
ange
in
fib
rin
ogen
or
vWf.
5
%–1
0% i
n f
acto
r V
II
Sm
all
in f
ibri
nog
en
4. C
ard
iac
elec
trop
hys
iolo
gyH
ealt
hy
and
ast
hm
a: l
ittl
e or
no
chan
ge i
n H
RV
H
ealt
hy:
sm
alle
r i
n Q
Tc i
nte
rval
aft
er p
arti
cles
th
an a
irA
sth
ma
fem
ale:
S
D o
f QT
inte
rval
an
d S
D o
f QT
pea
k d
ura
tion
Hea
lth
y an
d a
sth
ma:
No
chan
ge i
n H
F o
r L
F H
RV
; n
orm
aliz
ed H
F l
ead
ing
to
LF
/HF
rat
io. N
o ch
ange
in
QTc
Not
mea
sure
d
5. C
ard
iac
fun
ctio
nH
ealt
hy
and
ast
hm
a: s
mal
l i
n h
eart
rat
eN
ot m
easu
red
6. P
ulm
onar
y fu
nct
ion
Hea
lth
y an
d a
sth
ma:
N
o ch
ange
in
FE
V1
or F
VC
; m
inu
te v
enti
lati
onN
o ch
ange
in
FE
V1
or F
VC
No
chan
ge i
n F
EV
1 or
FV
C o
r ot
her
s
Ast
hm
a =
su
bjec
ts w
ith
ast
hm
a; h
ealt
hy
= h
ealt
hy
subj
ects
.a
EPA
ref
eren
ces:
Gh
io e
t al
200
0; H
ard
er e
t al
200
1; H
olga
te e
t al
200
3.b
Th
e F
ram
pto
n s
tud
y re
por
ted
no
chan
ges
in h
ealt
hy
rest
ing
par
tici
pan
ts i
n a
ny
of t
he
cate
gori
es o
f p
aram
eter
s d
escr
ibed
in
th
is t
able
. Th
us,
th
e re
mai
nd
er o
f th
is c
olu
mn
ref
ers
only
to
exer
cisi
ng
par
tici
pan
ts.

57
Health Review Committee
individuals (Figure 11). This pattern was driven by changesin men, as levels did not change in women.
Among healthy participants, total leukocyte numbersincreased after all exposures, including air, with anincrease in the percentage of polymorphonuclear leuko-cytes (PMNs) and a decrease in other leukocyte types (datanot shown). Monocyte levels decreased in all groups afterexposure, from approximately 8% of total leukocytes atbaseline to 6% to 7% 3.5 hours after exposure. Levelsreturned to baseline by 21 hours, except in healthy womenexposed to 25 µg/m3 ultrafine particles (Figure 12). Baso-phils at 0 and 3.5 hours after exposure to 10 or 25 µg/m3 par-ticles decreased in women from a baseline level ofapproximately 1% of total leukocytes to approximately0.5% total leukocytes. Even at 21 hours after exposure, baso-phil levels were still below baseline in ultrafine particle-exposed women. Lymphocyte assessments in womenrevealed that approximately 10% more T cells (ie, CD3+)expressed CD25 3.5 hours after ultrafine particle exposurethan at baseline. Levels returned to baseline by 21 hoursafter exposure. Expression of some adhesion molecules andFc receptors on monocytes and PMNs decreased after expo-sure to ultrafine particles (summarized in the Investigators’Report Table 20). Some changes were noted in only men oronly women.
Among asthmatic participants, total leukocyte numberswere not affected by exposure to ultrafine particles. Basophillevels decreased approximately 50% (from a baseline level of0.8% total leukocytes) at 0 and 3.5 hours after exposure toultrafine particles (Figure 14). Immediately after exposure toultrafine particles, CD4+ T lymphocytes decreased from 46%to 41% as a percentage of total lymphocytes. The investiga-tors stated that no other lymphocyte subset was affected. Nochanges were found after exposure to ultrafine particles inthe numbers of lymphocytes expressing the cytokines IFN-�and IL-4. Expression of some adhesion molecules and Fcreceptors on leukocytes changed after exposure to ultrafineparticles (summarized in Table 20). Most of these changeswere decreases in expression.
Pulmonary Function and Symptoms In healthy partici-pants, exposure to ultrafine particles was associated withdecreased minute ventilation during exercise and, inwomen only, decreased oxygen saturation; asthmatic partic-ipants at rest also showed decreased minute ventilation. Inpeople with asthma, symptoms, vital signs, and oxygen sat-uration were not affected by exposure to ultrafine particles.
Cardiac Electrophysiologic Changes Exposure toultrafine particles in healthy and asthmatic participantswas associated with little if any change in measures of HRV
(Tables 16 and 18, and Figure 27). Some small changeswere noted in measures of cardiac repolarization (Tables17 and 19, and Figures 28 and 29). In healthy participants,exercise during exposure to either air or ultrafine particlesdecreased the QT interval and increased QTc. However,ultrafine particle exposure decreased the QT intervalslightly more than did air exposure (Figure 28). Theincrease in QTc with ultrafine particle exposure was lessthan during air exposure (Figure 28). Over the next 21hours, QTc values returned close to baseline levels afterexposure to ultrafine particles but remained above baselinein people exposed to air. Thus, at all times the QTc wasapproximately 20 milliseconds less in people exposed toultrafine particles than air. In asthmatic volunteers in thehours after exposure, the standard deviation of the QTinterval and QT peak duration were slightly lower afterultrafine particle exposure than after air exposure (Figure29). The investigators state that this pattern was drivenmainly by responses in women.
DISCUSSION
This is an innovative and complex study. It is the first toevaluate cardiovascular and respiratory responses at mul-tiple timepoints in healthy and asthmatic individualsbefore, during, and after exposure via inhalation ofultrafine particles. Moreover, Frampton and colleaguescarried out a technically demanding protocol that requiredcooperation from volunteers on multiple visits to the Roch-ester research facility in order to make intrusive measure-ments of cardiovascular function.
The particles studied were relevant to normal humanexposures: although generated in the laboratory, the parti-cles were composed of elemental carbon, a major compo-nent of urban PM. The concentrations of ultrafine particlesused in the study—10 and 25 µg/m3, which correspond to 2and 7 × 10⁶ particles/cm3 (Table 4)—were much higher thanaverage levels of ultrafine particles found in ambient urbanair, however. For example, in Erfurt, Germany (Wichmann etal 2000) the daily average mass concentration of particles 50nm in diameter was approximately 0.1 µg/m3. In the LosAngeles area (Hughes et al 1998), the daily average massconcentration for all ultrafine particles was 1 µg/m3. In arecent study of traffic-related PM exposures, Zhu and col-leagues (2002) found the highest number of particles, domi-nated by small particles in the ultrafine range, to beapproximately 1.5 × 10⁵/cm3 30 m downwind of a freeway.
Frampton and colleagues’ findings indicate that in healthyresting people a 2-hour exposure via mouthpiece to 10 µg/m3
inhaled ultrafine carbon particles had no effect oninflammation in the airways or in the circulation, coagulation

58
Commentary
pathways, or cardiac electrophysiologic parametersmeasured up to 21 hours later. In addition, the investigatorsdid not find evidence of pulmonary inflammation or anacute phase response in exercising healthy or asthmaticvolunteers. Thus, as the investigators appropriately note,these findings do not support their original hypothesis thatexposure to ultrafine particles would induce pulmonaryinflammation and an acute phase response.
The investigators did find some changes associated withparticle exposure in exercising asthmatic and healthy par-ticipants. The changes in healthy and asthmatic partici-pants were generally similar, suggesting that for theseexposures asthmatic participants are not more susceptiblethan healthy participants. Some of these changes weremore prominent in one sex than the other. As the investiga-tors appropriately note, some cardiovascular and leuko-cyte responses differ between the sexes (Sader andCelermajer 2002), but the current study findings have not“convincingly established or excluded significant genderdifferences in responses to carbon ultrafine particles.”
The fact that the investigators detected small changes incardiac repolarization but found no significant changes inHRV parameters suggests that ultrafine particles inducefew changes in electrophysiologic parameters in eitherhealthy or asthmatic participants. As the investigatorsappropriately note, the small changes detected in cardiacrepolarization parameters such as QTc have uncertain bio-logical or clinical significance. For example, changes in QTcassociated with ultrafine particle exposure rapidly returnedto baseline, but changes after air exposure did not. In addi-tion, Frampton and colleagues found that QTc increasedapproximately 20 milliseconds less in exercising healthypeople exposed to ultrafine particles than in those exposedto air. Generally, prolongation of the interval for more than30 milliseconds is thought to be clinically relevant.
Among the key effects Frampton and colleaguesdetected were small changes in leukocyte subsets in thecirculation: an apparent redistribution of cell types(because the total number of circulating leukocytes did notchange) and changes in expression of activation markersexpressed on specific leukocyte populations. Interestingly,the majority of changes that Frampton and colleaguesdetected in circulating cell numbers were decreases—spe-cifically, decreases in numbers of basophils (healthyfemales and all asthmatic participants), monocytes (allhealthy participants), and CD4+ T cells (asthmatic partici-pants)—rather than increases that are generally associatedwith inflammatory responses. Some of the decreases in cellnumbers in the circulation represented substantial changesin a particular leukocyte subset. For example, the numberof basophils decreased in the circulation by approximately
50% in healthy and asthmatic populations after exposureto ultrafine particles, and CD4+ T cells decreased byapproximately 12% in asthmatic participants. The investi-gators did find a small compensatory increase in circu-lating PMN number, a feature of systemic inflammatoryresponses to PM in other systems (eg, Salvi et al 1999,healthy humans exposed to diesel exhaust; Gordon et al1998, rats exposed to CAPs; Clarke et al 2000, dogsexposed to CAPs).
Exposure to ultrafine particles was also associated withdecreased expression of adhesion molecules on the surfaceof certain leukocytes in the blood (markers of activation).Generally, however, increased expression of adhesion mol-ecules on leukocytes and vascular endothelial cells is con-sidered a feature of activation in the inflammatoryresponse (discussed in the Scientific Background). Theinvestigators speculate on how particle exposure in exer-cising participants may be associated with decreases inleukocyte numbers and decreased expression of activationmarkers in circulating leukocytes. They propose that expo-sure to ultrafine particles induces mild constriction ofblood vessels and activation of endothelial cells in the pul-monary vascular bed. Further, because exercise has beenshown to release PMN into the circulation from the mar-gins of blood vessels in the lung (eg van Eeden et al 1999),Frampton and colleagues suggest that particle exposure inexercising participants inhibits the outflow of activatedleukocytes from the lung into the circulation. This inter-esting idea merits further study. However, the investigatorsdid not evaluate the vascular bed of the lungs directly andso cannot confirm this interpretation. Vasoconstriction ofsmall pulmonary arteries has been described to occur inhealthy and bronchitic rats exposed to Boston-derivedCAPs (Batalha et al 2002).
At face value, the biological significance of particleexposure rapidly depleting from the circulation the partic-ular cell types reported—and in high numbers—is notclear. Basophils, whose circulating level dropped by 50%,are involved in the immunologic response to allergens(agents that trigger allergic responses) and have not previ-ously been linked with in vivo effects of particle exposure.CD4+ T cells are activated by exposure to antigens, but gen-erally only a tiny fraction of the total CD4+ T cell popula-tion (1 cell in 105) is activated by a particular antigen.Thus, the particle exposure-associated depletion ofapproximately 12% of the total CD4+ T cell pool fromblood is surprising.
As the investigators discuss, other explanations for thefindings are possible; first, ultrafine particle exposure mayresult in the release of anti-inflammatory cytokines (such astransforming growth factor �) that interact with the surface

59
Health Review Committee
of particles and prevent or decrease an inflammatoryresponse in the blood. Second, ultrafine particles might beselectively toxic to cells activated in the circulation andlead to the removal of these cells by apoptosis. An alterna-tive possibility is that the changes measured are simplyrandom; that is, that the investigators measured many dif-ferent parameters, and by chance some of these measure-ments differed from baseline values. The chance nature ofthese positive findings may also explain why some of thefindings were more prominent in one sex than the other.
One of the initial hypotheses of the study was that expo-sure to particles would change the pattern of cytokinessynthesized by CD4+ T cells to a more Th2-like or allergicpattern (decreased IFN� and increased IL-4, leading toimmunoglobulin E synthesis). Skewing of responses to aTh2 pattern has been found in rodents exposed to dieselexhaust, another type of PM emission (van Zijverden et al2000; Steerenberg et al 2003). The fact that the investiga-tors did not find such changes suggests that the ultrafinecarbon emissions may lack the components that activateTh2 CD4+ T cells and hence the type of immunoglobulinsynthesized by B cells. Alternatively, it may indicate thatultrafine particle exposure-related changes in Th1 and Th2cytokines cannot be detected by measuring the number ofcytokine-producing cells in blood. As Frampton and col-leagues reported exposure-associated activation of CD4+ Tcells in blood in the current study, further studies of par-ticle effects on CD4+ T cells and the cytokines they pro-duce may be worth pursuing.
PARTICLE DEPOSITION
Apart from an early study examining a very smallnumber of people with asthma (Anderson et al 1990), thisis one of the first studies to examine total deposition ofultrafine particles in the lower airways of asthmatic volun-teers. Thus, the investigators’ finding that the depositionfraction for ultrafine particles was greater in resting asth-matic participants than resting healthy participants isnovel. It suggests that at identical particle exposure levelsasthmatic people may be exposed to a greater lung dose ofultrafine particles than healthy people (approximately50% greater in this study). Their finding that the numberand mass of particles deposited in exercising healthy andasthmatic participants increased approximately four timescompared to levels deposited in resting participants, sug-gests that exercise does increase the dose of particles to thelung. Exercising healthy participants showed a limitednumber of effects of exposure to ultrafine particles, whereasresting healthy participants in this study showed no effectsof exposure, which may be the result of the number ormass of particles taken in by the exercising individuals
exceeding some threshold. The investigators’ finding thateven within the ultrafine particle range smaller particleshave increased deposition compared to larger particles isinteresting and suggests that smaller particles preferen-tially deposit in the respiratory system.
One of the key features of the study design was that par-ticipants were exposed by mouthpiece to inhaled ultrafineparticles. Under normal conditions, people inhale parti-cles through the nose as well as by the mouth althoughexercise increases mouth breathing. Data suggest, however,that a minimal fraction of inhaled ultrafine particles in thesize range used in the current report deposit in the nose (egHeyder et al 1986). Nonetheless, some ultrafine particlesinhaled via the nose are likely to be trapped there and notdeposit in the lower airways. Thus the number or mass ofultrafine particles depositing in the lower airways of par-ticipants in this study might have been higher than thenumber or mass of particles depositing in the lower air-ways of people exposed to an identical concentration ofparticles via the nose as well as the mouth.
COMPARISON WITH RESULTS OF THE GONG STUDY AND OTHER CONTROLLED HUMAN EXPOSURE STUDIES
As described in the Introduction, before their studiesstarted Frampton and Gong discussed designs, exposureprotocols, and endpoints to determine areas of overlap thatwould allow some comparisons to be made when thestudies were completed. The top section of the Commen-tary Table shows that Frampton and Gong used similarstudy designs and exposure protocols and investigatedsimilar sets of endpoints. Both studies used a crossoverdesign (ie, using the individual participant as his or herown control) to evaluate cardiovascular and respiratoryeffects of a single 2-hour exposure to particles and filteredair in a small number of exercising healthy and asthmaticparticipants. Frampton and colleagues’ study also com-pared effects in the absence of exercise and evaluated theeffect of an additional concentration of particles.
The particles used in the two studies differed. Gongevaluated fine particles concentrated from ambient air inthe Los Angeles area to a target concentration that repre-sented a worst-case scenario exposure (target 200 µg/m3,actual 174 µg/m3). As described above, Frampton evalu-ated ultrafine carbon particles at levels higher than thosemeasured in urban air.
Despite the efforts to use similar protocols, comparingresults of the Frampton and Gong studies is challenging: thestudies involved small numbers of participants exposed todifferent types of particles in different locations. Nonetheless,some common themes are visible in the results of the two

60
Commentary
studies. The first is that results of both studies indicate thatfew cardiovascular, respiratory, or cardiac electrophysio-logic endpoints change in exposed healthy volunteers.Second, inflammatory effects in the airways are minimal.Third, changes in cardiovascular, respiratory, and cardiacelectrophysiologic endpoints in asthmatic participants donot appear to differ greatly from those measured in healthyparticipants. These general conclusions may have importantimplications for designing future studies of particle effects:What kinds of particles should be studied? What kinds ofclinical conditions may give qualitatively and quantita-tively different responses from those in healthy people?Should other endpoints be examined, and if so, what is therationale for choosing them?
The results of the Frampton and Gong studies, whichindicate that CAPs and ultrafine particles induced fewinflammatory, electrophysiologic, or vascular responses,parallel those of CAPs studies in healthy adults that usedsimilar levels and durations of exposure in the EasternUnited States (Ghio et al 2000; Harder et al 2001; Holgate etal 2003). These studies are also summarized in the Com-mentary Table. Ghio and colleagues (2000), at the EPAresearch facility in North Carolina, found that CAPsinduced a mild inflammatory response in healthy partici-pants exposed to 20 to 300 µg/m3
CAPs for 2 hours whileexercising intermittently (the same pattern as participants inthe studies of Gong and Frampton). They found no changesin many endpoints, including symptoms, lung function,blood leukocyte differential counts, or levels of fibrinogen,IL-6, and IL-8 in bronchoalveolar lavage fluids. They diddetect increases in lavaged PMN numbers and blood fibrin-ogen levels 18 hours after CAPs exposure (Ghio et al 2000).
By evaluating additional blood and lavage fluid parame-ters for the participants that Ghio and colleagues originallystudied, Harder and colleagues (2001) found that CAPsexposure did not affect expression of several cell surfacemarkers associated with activation of different cell types.This suggested that CAPs did not affect immune defensesin the airways or blood of exposed individuals (Harder etal 2001). In a further study of some of the participants inthe EPA CAPs studies (Holgate et al 2003), bronchial tis-sues did not show any CAPs-related changes in the param-eters measured, which included numbers of neutrophils,distribution of T lymphocyte subsets, and expression ofadhesion molecules by vascular endothelium.
Frampton and colleagues did detect changes in circu-lating T lymphocyte subsets—specifically, decreased num-bers of circulating CD4+ T cells in healthy participants andincreased expression of the activation marker CD25 inwomen. In the EPA CAPs studies, T lymphocyte changeswere not detected in the circulation (Harder et al 2001) or in
the airways (Holgate et al 2003). Frampton and colleaguesalso detected changes in the levels of some adhesion mole-cules, such as ICAM-1, expressed on the surface of certainleukocytes. Gong and colleagues did not measure cell-asso-ciated ICAM-1 but found small increases in levels of solubleICAM-1. Holgate and colleagues did not find any change inexpression of adhesion molecules (including ICAM-1)expressed by bronchial tissue vascular endothelium.
Effects on vascular parameters, in particular acute phasereactants, differ among the studies. For example, the Ghio,Frampton, and Gong studies all measured fibrinogenlevels: after CAPs exposure Ghio and colleagues (2000)detected increases in blood levels, but at a similar timeafter exposure Gong and colleagues (2003) found nochanges; after exposure to ultrafine particles, Framptonand colleagues detected small decreases in healthy men.
Similarly, both Frampton and Gong measured HRV andrepolarization parameters QT and QTc. Gong found a smallincrease in normalized HF, and thus a decrease in theLF/HF ratio, an indication of a small change in parasympa-thetic influence on the autonomic nervous system.Frampton found few or no exposure-related effects on HRVparameters. Gong found that QTc did not change afterexposure in healthy or asthmatic participants, whereasFrampton found smaller increases in the QTc interval asso-ciated with ultrafine particle exposure than with air expo-sure in healthy and asthmatic men. Other human CAPsexposure studies have also reported electrophysiologicand vascular changes: Devlin and colleagues (2003)reported decreased HRV in elderly people exposed toCAPs and Brook and colleagues (2002) in Toronto, Canada,found that a combination of CAPs and ozone reduced thediameter of the brachial artery (that is, were vasoconstric-tive) in healthy adults exposed at rest, but they did notexamine effects of the pollutants separately or evaluatepossible effects on systemic or airway inflammation.
As described above, however, comparing these sets ofresults is challenging. The PM components responsible foreffects may vary from place to place. In addition, thetiming of measurements made is also critically important.In the Gong and Frampton studies, measurements weremade at several timepoints, whereas in the EPA studiesmeasurements were made only at 18 hours after exposure.
CONCLUSION
In summary, Frampton and colleagues did not detectairway or systemic effects after 12 healthy people at restinhaled 10 µg/m3 ultrafine carbon particles (median diam-eter approximately 25 nm) via a mouthpiece for 2 hours.

61
Health Review Committee
The investigators found few ultrafine particle-associatedairway, systemic, or cardiac electrophysiologic changes atdifferent times after similarly exposing 12 healthy volun-teers to to 10 or 25 µg/m3 particles and 16 mildly asthmaticvolunteers to 10 µg/m3 particles, with intermittent exercisefor both groups. For example, they found no changes inlung function, airway inflammation, total blood leukocytedifferential counts, or the levels in blood of fibrinogen orserum amyloid A.
They did find that the numbers of some leukocyteschanged in the circulation: decreases in basophils andmonocytes in healthy women, and decreases in basophilsand CD4+ T cells in asthmatic participants. Levels of theactivation marker CD25 also increased on T cells fromhealthy women and levels of expression of some adhesionmolecules decreased on different sets of leukocytes inhealthy and asthmatic participants. The investigatorsspeculate that these changes signify that exposure toultrafine particles activates some sets of leukocytes andvascular endothelium; activated leukocytes then migrateto and are retained in the vascular bed of the lung. This isan interesting idea that is worth studying. The investiga-tors also found a few cardiac electrophysiologic changes—particularly in measures of cardiac repolarization—inhealthy and asthmatic participants, but they were of smallmagnitude.
The clinical significance of any of the ultrafine particle-associated changes is not clear. The changes observed sug-gest, however, that in this small set of healthy and mildlyasthmatic participants, the effects of exposure 10 or 25µg/m3 ultrafine carbon particles for 2 hours are small. Thepaucity of effects in the current study is consistent with theresults of studies conducted in North America of humanexposures to concentrated fine particles. Consequently, theresults of the current study do not lend support to thehypothesis that ultrafine particles are more toxic thanother components of the broader particle mix. Conductingcontrolled exposures with ultrafine particles of differentsizes and composition; with different susceptible popula-tions (such as those with cardiovascular disease); using alarger number of participants; longer exposure durationsand higher concentrations; and measuring different end-points would increase the statistical and scientific strengthof future studies, and thus provide a stronger test of theultrafine hypothesis.
ACKNOWLEDGMENTS
The Health Review Committee thanks the ad hocreviewers for their help in evaluating the scientific merit ofthe Investigators’ Report. The Committee is also grateful to
Maria Costantini for her oversight of the study, to GeoffreySunshine for his assistance in preparing its Commentary,to Mary K Brennan for science edit of the Investigators’Report and Commentary, and to Sally Edwards, RuthShaw and Frederic Howe for their roles in publishing thisResearch Report.
REFERENCES
Anderson KR, Avol EL, Edwards SA, Shamoo DA, Peng RC,Linn WS, Hackney JD. 1992. Controlled exposures of vol-unteers to respirable carbon and sulfuric acid aerosols. JAir Waste Manage Assoc 42:770–776.
Anderson PJ, Wilson JD, Hiller FC 1990. Respiratory tractdeposition of ultrafine particles in subjects with obstruc-tive or restrictive lung disease. Chest 97:1115-1120. BarnesPJ. 1996. NO or no NO in asthma? Thorax 51:218–220.
Batalha JR, Saldiva PH, Clarke RW, Coull BA, Stearns RC,Lawrence J, Murthy GG, Koutrakis P, Godleski JJ. 2002.Concentrated ambient air particles induce vasoconstric-tion of small pulmonary arteries in rats. Environ HealthPerspect 110:1191–1197.
Brook RD, Brook JR, Urch B, Vincent R, Rajagopalan S, Sil-verman F. 2002. Inhalation of fine particulate air pollutionand ozone causes acute arterial vasoconstriction in healthyadults. Circulation 105:1534–1536.
Campen MJ, Watkinson WP, Dowd SM, Costa DL. 1997.Changes in electrocardiographic waveform parametersafter exposure to residual oil fly ash particles in the cold-acclimated and cardiopulmonary-compromised rat. Am JResp Crit Care Med 155: A247.
Clarke RW, Coull B, Reinisch U, Catalano P, KillingsworthCR, Koutrakis P, Kavouras I, Murthy GG, Lawrence J, LovettE, Wolfson JM, Verrier RL, Godleski JJ. 2000. Inhaled con-centrated ambient particles are associated with hemato-logic and bronchoalveolar lavage changes in canines.Environ Health Perspect 108:1179–1187.
Costa DL, Lehmann JR, Frazier LT, Doerfler D, Ghio A.1994. Pulmonary hypertension: A possible risk factor inparticulate toxicity [abstract]. Am J Respir Crit Care Med149:A840.
Devlin RB, Ghio AJ, Kehrl, Sanders G, Cascio W. 2003. Eld-erly humans exposed to concentrated air pollution parti-cles have decreased heart rate variability. Eur Respir J 21,Suppl 40, 762-80s.

62
Commentary
US Environmental Protection Agency. 1996. Air QualityCriteria for PM. EPA/600/P-95/001. Office of Research andDevelopment, Washington DC
Frampton MW. 2001. Systemic and cardiovascular effectsof airway injury and inflammation: Ultrafine particle expo-sure in humans. Environ Health Perspect 109:529–532.
Freedman JJE. 2003. CD40Ligand: Assessing risk instead ofdamage? New Engl J Med 348:1163–1165.
Ghio AJ, Kim C, Devlin RB. 2000. Concentrated ambient airparticles induce mild pulmonary inflammation in healthyhuman volunteers. Am J Respir Crit Care Med 162:981–988.
Godleski JJ, Sioutas C, Verrier RL, Killingsworth CR, LovettE, Murthy GGK, Hatch V, Wolfson JM, Ferguson ST,Koutrakis P. 1997. Inhalation exposure of canines to con-centrated ambient air particles [abstract]. Am J Respir CritCare Med 155:A246.
Gong H Jr, Sioutas C, Linn WS. 2003. Controlled Exposuresof Healthy and Asthmatic Volunteers to ConcentratedAmbient Particles in Metropolitan Los Angeles. ResearchReport 118. Health Effects Institute, Boston MA.
Gordon T, Nadziejko C, Schlesinger R, Chen LC. 1998. Pul-monary and cardiovascular effects of acute exposure toconcentrated ambient particulate matter in rats. ToxicolLett 96,97:285–288.
Hahn FF, Barr EB, Ménache MG, Seagrave JC. 2004. Par-ticle Size- and Composition-Related Adverse HealthEffects in an Aged, Sensitive Population of Rats. ResearchReport. Health Effects Institute, Boston MA. In press.
Harder SD, Soukup JM, Ghio AJ, Devlin RB, Becker S.2001. Inhalation of PM2.5 does not modulate host defenseor immune parameters in blood or lung of normal humansubjects. Environ Health Perspect 109(Suppl 4):599–604.
Health Effects Institute. 2001. Airborne Particles andHealth: HEI Epidemiologic Evidence. HEI Perspectives.Health Effects Institute, Cambridge MA.
Health Effects Institute. 2002. Understanding the HealthEffects of Components of the Particulate Matter Mix:Progress and Next Steps. HEI Perspectives. Health EffectsInstitute, Boston MA.
Health Effects Institute. 2003. Revised Analyses of Time-Series Studies of Air Pollution and Health, Special Report.Health Effects Institute, Boston MA.
Heyder J, Gebhart J, Rudolf G, Schiller CF, Stahlhofen W.1986. Deposition of particles in the human respiratory tractin the size range 0.005 – 15 µm. J Aerosol Sci 17: 811-825.
Holgate ST, Devlin RB, Wilson S, Frew AJ. 2003. HealthEffects of Acute Exposure to Air Pollution. Part II: HealthySubjects Exposed to Concentrated Ambient Particles.Research Report 112. Health Effects Institute, Boston MA.
Hughes LS, Cass GR, Gone J, Ames M, Olmez I 1998. Phys-ical and chemical characterization of atmospheric ultrafineparticles in the Los Angeles area. Environ Sci Technol32:1153–1161.
Killingsworth CR, Alessandrini F, Murthy GGK, CatalanoPJ, Paulauskis JD, Godleski JJ. 1997. Inflammation,chemokine expression, and death in monocrotaline-treatedrats following fuel oil fly ash inhalation. Inhalation Toxicol9:541–565.
Kuschner WG, Wong H, D'Alessandro A, Quinlan P, BlancPD. 1997. Human pulmonary responses to experimentalinhalation of high concentration fine and ultrafine magne-sium oxide particles. Environ Health Perspect. 105:1234–1237.
Leikauf GD, McDowell SA, Wesselkamper SC, Miller CR,Hardie WD, Gammon K, Biswas PP, Korfhagen TR,Bachurski CJ, Wiest JS, Willeke K, Bingham E, Leikauf JE,Aronow BJ, Prows DR. 2001. Pathogenomic Mechanismsfor Particulate Matter Induction of Acute Lung Injury andInflammation in Mice. Research Report 105. Health EffectsInstitute, Boston MA.
Lipsett M, Hurley S, Ostro B. 1997. Air pollution and emer-gency room visits for asthma in Santa Clara County, Cali-fornia. Environ Health Perspect 105:216–222.
McDonald JD, Powell QH, Bowen LE, Mauderly JL. 2001.Organic carbon content of aerosols produced from a palascarbon generation system [abstract]. Toxicologist 2048.60:430. Full citation???
National Institutes of Health (US). 1997. Guidelines for theDiagnosis and Management of Asthma. Expert PanelReport 2. NIH 97-4051. National Asthma Education andPrevention Program, Bethesda MD.
Nemmar A, Hoet PH, Vanquickenborne B, Dinsdale D,Thomeer M, Hoylaerts MF, Vanbilloen H, Mortelmans L,Nemery B. 2002. Passage of inhaled particles into the bloodcirculation in humans. Circulation 105:411–414.
Nemmar A, Vanbilloen H, Hoylaerts MF, Hoet PHM, Ver-bruggen A, Nemery B. 2001. Passage of intratracheallyinstilled ultrafine particles from the lung into the systemiccirculation in hamster. Am J Respir Crit Care Med164:1665–1668.
Oberdörster G. 2001. Pulmonary effects of inhaledultrafine particles. Int Arch Occup Environ Health 74:1–8.

63
Health Review Committee
Pekkanen J, Timonen KL, Ruuskanen J, Reponen A, MirmeA.1997. Effects of ultrafine and fine particles in urban airon peak expiratory flow among children with asthmaticsymptoms. Environ Res 74: 24–33.
Peters A, Doring A, Wichmann H-E, Koenig W. 1997a.Increased plasma viscosity during an air pollution episode:a link to mortality? Lancet 349:1582–1587.
Peters A, Wichmann HE, Tuch T, Heinrich J, Heyder J. 1997b.Respiratory effects are associated with the number of ultrafineparticles. Am J Respir Crit Care Med 155:1376–1383.
Sader MA, Celermajer DS. 2002. Endothelial function, vas-cular reactivity and gender differences in the cardiovas-cular system. Cardiovasc Res 53:597–604.
Salvi S, Blomberg A, Rudell B, Kelly F, Sandstrom T, Hol-gate ST, Frew A. 1999. Acute inflammatory responses inthe airways and peripheral blood after short-term exposureto diesel exhaust in healthy human volunteers. Am JRespir Crit Care Med 159:702–709.
Schwartz J, Slater D, Larson TV, Pierson WE, Koenig JQ1993, Particulate air pollution and hospital emergencyroom visits for asthma in Seattle. Am Rev Respir Dis.147:826–831.
Seaton A, MacNee W, Donaldson K, Godden D. 1995. Par-ticulate air pollution and acute health effects. Lancet345:176–178.
Steerenberg PA, Withagen CE, Dormans JA, van Dalen WJ,van Loveren H, Casee FR. 2003. Adjuvant activity of various
diesel exhaust and ambient particles in two allergicmodels. J Toxicol Environ Health 66:1421–1439.
Tall AR. 2004. C-reactive protein reassessed. New Engl JMed 350:1450–1452.
Utell MJ, Frampton MW 2000 Acute health effects ofambient air pollution: the ultrafine particle hypothesis. JAerosol Med 13: 355–59.
van Eeden SF, Granton J, Hards JM, Moore B, Hogg JC.1999. Expression of the cell adhesion molecules on leuko-cytes that demarginate during acute maximal exercise. JAppl Physiol 86:970-976.
van Zijverden M, van der Pijl A, Bol M, van Pinxteren FA,de Haar C, Penninks AH, van Loveren H, Pieters R. 2000.Diesel exhaust, carbon black, and silica particles displaydistinct Th1/Th2 modulating activity. Toxicol Appl Phar-macol 168:131–139.
Watkinson WP, Campen MJ, Costa DL. 1998. Cardiacarrhythmia induction after exposure to residual oil fly ashparticles in a rodent model of pulmonary hypertension.Toxicol Sci 41:209–216.
Wichmann HE, Spix C, Tuch T, Wolke G, Peters A, Hein-rich J, Kreyling WG, Heyder J. 2000. Daily Mortality andFine and Ultrafine Particles in Erfurt, Germany. Part I: Roleof Particle Number and Particle Mass. Research Report 98.Health Effects Institute, Boston MA.
Zhu Y, Hinda WC, Kim S, Sioutas C. 2002. Concentrationand size distribution of ultrafine particles near a majorhighway. J Air Waste Manage Assoc 52:1032–1042.


RELATED HEI PUBLICATIONS: PARTICULATE MATTER AND DIESEL EXHAUST
* Reports published since 1990.Copies of these reports can be obtained from the Health Effects Institute and many are available at www.healtheffects.org.
Report PrincipalNumber Title Investigator Date*
Research Reports
120 Effects of Concentrated Ambient Particles on Normal and Hypersecretory JR Harkema 2004Airways in Rats
118 Controlled Exposures of Healthy and Asthmatic Volunteers to Concentrated H Gong Jr 2003Ambient Particles in Metropolitan Los Angeles
117 Peroxides and Macrophages in Toxicity of Fine Particulate Matter DL Laskin 2003
112 Health Effects of Acute Exposure to Air Pollution ST Holgate 2003 Part I. Healthy and Asthmatic Subjects Exposed to Diesel Exhaust Part II. Healthy Subjects Exposed to Concentrated Ambient Particles
111 Effect of Concentrated Ambient Particulate Matter on Blood Coagulation C Nadziejko 2002Parameters in Rats
110 Particle Characteristics Responsible for Effects on Human Lung Epithelial Cells AE Aust 2002
107 Emissions from Diesel and Gasoline Engines Measured in Highway Tunnels Part I. Real-World Particulate Matter and Gaseous Emissions AW Gertler 2002 from Motor Vehicles in a Highway Tunnel Part II. Airborne Carbonyls from Motor Vehicle Emissions D Grosjean 2002 in Two Highway Tunnels
106 Effects of Combined Ozone and Air Pollution Particle Exposure in Mice L Kobzik 2001
105 Pathogenomic Mechanisms for Particulate Matter Induction of Acute Lung GD Leikauf 2001Injury and Inflammation in Mice
104 Inhalation Toxicology of Urban Ambient Particulate Matter: R Vincent 2001Acute Cardiovascular Effects in Rats
101 Epithelial Penetration and Clearance of Particle-Borne Benzo[a]pyrene P Gerde 2001
99 A Case-Crossover Analysis of Fine Particulate Matter Air Pollution and H Checkoway 2000Out-of-Hospital Sudden Cardiac Arrest
98 Daily Mortality and Fine and Ultrafine Particles in Erfurt, Germany H-E Wichmann 2000 Part I. Role of Particle Number and Particle Mass
97 Identifying Subgroups of the General Population That May Be Susceptible MS Goldberg 2000to Short-Term Increases in Particulate Air Pollution: A Time-Series Study in Montreal, Quebec
96 Acute Pulmonary Effects of Ultrafine Particles in Rats and Mice G Oberdörster 2000
95 Association of Particulate Matter Components with Daily Mortality M Lippmann 2000 and Morbidity in Urban Populations
91 Mechanisms of Morbidity and Mortality from Exposure to Ambient JJ Godleski 2000Air Particles
Continued

* Reports published since 1990.Copies of these reports can be obtained from the Health Effects Institute and many are available at www.healtheffects.org.
RELATED HEI PUBLICATIONS: PARTICULATE MATTER AND DIESEL EXHAUST
Report PrincipalNumber Title Investigator Date*
76 Characterization of Fuel and Aftertreatment Device Effects on ST Bagley 1996Diesel Emissions
68 Pulmonary Toxicity of Inhaled Diesel Exhaust and Carbon Black inChronically Exposed Rats Part I. Neoplastic and Nonneoplastic Lung Lesions JL Mauderly 1994 Part II. DNA Damage K Randerath 1995 Part III. Examination of Possible Target Genes SA Belinsky 1995
Special Reports
Revised Analyses of Time-Series Studies of Air Pollution and Health 2003
Research Directions to Improve Estimates of Human Exposure and 2002Risk from Diesel Exhaust
Reanalysis of the Harvard Six Cities Study and the American Cancer 2000Society Study of Particulate Air Pollution and Mortality: A Special Reportof the Institute’s Particle Epidemiology Reanalysis Project
Diesel Emissions and Lung Cancer: Epidemiology and Quantitative 1999Risk Assessment
Particulate Air Pollution and Daily Mortality: The Phase I Report of the ParticleEpidemiology Evaluation ProjectPhase I.A. Replication and Validation of Selected Studies 1995Phase I.B. Analyses of the Effects of Weather and Multiple Air Pollutants 1997
Diesel Exhaust: A Critical Analysis of Emissions, Exposure and Health Effects 1995
HEI Communications
10 Improving Estimates of Diesel and Other Emissions for Epidemiologic Studies 2003
9 Evaluation of Human Health Risk from Cerium Added to Diesel Fuel 2001
8 The Health Effects of Fine Particles: Key Questions and the 2003 Review (Report of the Joint Meeting of the EC and HEI) 1999
7 Diesel Workshop: Building a Research Strategy to Improve Risk Assessment 1999
5 Formation and Characterization of Particles: Report of the 1996 HEI Workshop 1996
HEI Research Program Summaries
Research on Diesel Exhaust and Other Particles 2003
Research on Diesel Exhaust 1999
Research on Particulate Matter 1999
HEI Perspectives
Understanding the Health Effects of Components of the Particulate Matter Mix: 2002Progress and Next Steps
Airborne Particles and Health: HEI Epidemiologic Evidence 2001

H E A L T HE F F E C T SINSTITUTE
The Health Effects Institute was chartered in 1980 as an
independent and unbiased research organization to provide
high quality, impartial, and relevant science on the health
effects of emissions from motor vehicles, fuels, and other
environmental sources. All results are provided to industry
and government sponsors, other key decisionmakers, the
scientific community, and the public. HEI funds research
on all major pollutants, including air toxics, diesel exhaust,
nitrogen oxides, ozone, and particulate matter. The Institute
periodically engages in special review and evaluation of key
questions in science that are highly relevant to the regulatory
process. To date, HEI has supported more than 220 projects
at institutions in North America, Europe, and Asia and has
published over 160 Research Reports and Special Reports.
Typically, HEI receives half of its core funds from the
US Environmental Protection Agency and half from 28
worldwide manufacturers and marketers of motor vehicles
and engines who do business in the United States. Other
public and private organizations periodically support special
projects or certain research programs. Regardless of funding
sources, HEI exercises complete autonomy in setting its
research priorities and in reaching its conclusions.
An independent Board of Directors governs HEI. The
Institute’s Health Research Committee develops HEI’s five-
year Strategic Plan and initiates and oversees HEI-funded
research. The Health Review Committee independently
reviews all HEI research and provides a Commentary
on the work’s scientific quality and regulatory relevance.
Both Committees draw distinguished scientists who
are independent of sponsors and bring wide-ranging
multidisciplinary expertise.
The results of each project and its Commentary are
communicated widely through HEI’s home page, Annual
Conference, publications, and presentations to professional
societies, legislative bodies, and public agencies.
OFFICERS & STAFFDaniel S Greenbaum President
Robert M O’Keefe Vice President
Jane Warren Director of Science
Sally Edwards Director of Publications
Jacqueline C Rutledge Director of Finance and Administration
Deneen Howell Corporate Secretary
Cristina I Cann Staff Scientist
Aaron J Cohen Principal Scientist
Maria G Costantini Principal Scientist
Wei Huang Staff Scientist
Debra A Kaden Principal Scientist
Sumi Mehta Staff Scientist
Geoffrey H Sunshine Senior Scientist
Annemoon MM van Erp Staff Scientist
Terésa Fasulo Science Administration Manager
L Virgi Hepner Senior Science Editor
Jenny Lamont Science Editor
Francine Marmenout Senior Executive Assistant
Teresina McGuire Accounting Assistant
Kasey L Oliver Administrative Assistant
Robert A Shavers Operations Manager
Mark J Utell ChairProfessor of Medicine and Environmental Medicine, University of Rochester
Melvyn C BranchJoseph Negler Professor of Engineering, Mechanical Engineering Department, University of Colorado
Kenneth L DemerjianProfessor and Director, Atmospheric Sciences Research Center, Universityat Albany, State University of New York
Peter B FarmerProfessor and Section Head, Medical Research Council Toxicology Unit,University of Leicester
Helmut GreimProfessor, Institute of Toxicology and Environmental Hygiene, Technical University of Munich
Rogene HendersonSenior Scientist Emeritus, Lovelace Respiratory Research Institute
Stephen I RennardLarson Professor, Department of Internal Medicine, University of Nebraska Medical Center
Howard RocketteProfessor and Chair, Department of Biostatistics, Graduate School of Public Health, University of Pittsburgh
Jonathan M SametProfessor and Chairman, Department of Epidemiology, Bloomberg School of Public Health, Johns Hopkins University
Ira TagerProfessor of Epidemiology, School of Public Health, University of California, Berkeley
HEALTH RESEARCH COMMITTEE
BOARD OF DIRECTORSRichard F Celeste ChairPresident, Colorado College
Purnell W ChoppinPresident Emeritus, Howard Hughes Medical Institute
Jared L CohonPresident, Carnegie Mellon University
Alice HuangSenior Councilor for External Relations, California Institute of Technology
Gowher RizviDirector, Ash Institute for Democratic Governance and Innovations, Harvard University
Richard B StewartUniversity Professor, New York University School of Law, and Director, New York University Center on Environmental and Land Use Law
Robert M WhitePresident (Emeritus), National Academy of Engineering, and Senior Fellow, University Corporation for Atmospheric Research
Archibald Cox Founding Chair, 1980–2001
Donald Kennedy Vice Chair EmeritusEditor-in-Chief, Science; President (Emeritus) and Bing Professor of Biological Sciences, Stanford University
HEALTH REVIEW COMMITTEEDaniel C Tosteson ChairProfessor of Cell Biology, Dean Emeritus, Harvard Medical School
Ross AndersonProfessor and Head, Department of Public Health Sciences, St George’s Hospital Medical School, London University
John R HoidalProfessor of Medicine and Chief of Pulmonary/Critical Medicine, University of Utah
Thomas W KenslerProfessor, Division of Toxicological Sciences, Department of Environmental Sciences, Johns Hopkins University
Brian LeadererProfessor, Department of Epidemiology and Public Health, Yale University School of Medicine
Thomas A LouisProfessor, Department of Biostatistics, Bloomberg School of Public Health, Johns Hopkins University
Edo D PellizzariVice President for Analytical and Chemical Sciences, Research Triangle Institute
Nancy ReidProfessor and Chair, Department of Statistics, University of Toronto
William N RomProfessor of Medicine and Environmental Medicine and Chief of Pulmonary and Critical Care Medicine, New York University Medical Center
Sverre VedalProfessor, Department of Environmental and Occupational Health Sciences, University of Washington

Charlestown Navy Yard
120 Second Avenue
Boston MA 02129-4533 USA
+1-617-886-9330
www.healtheffects.org
R E S E A R C HR E P O R T
H E A L T HE F F E CTSINSTITUTE
Janu
ary 2004
R E S E A R C H R E P O R T
H E A L T HE F F E CTSINSTITUTE
Includes a Commentary by the Institute’s Health Review Committee
Number 126
December 2004
Decem
ber 2004
Number 126December 2004
Effects of Exposure to Ultrafine Carbon Particles in Healthy Subjects and Subjects with AsthmaMark W Frampton, Mark J Utell, Wojciech Zareba, Günter Oberdörster, Christopher Cox, Li-Shan Huang, Paul E Morrow, F Eun-Hyung Lee, David Chalupa, Lauren M Frasier, Donna M Speers, and Judith Stewart
Departments of Medicine, Environmental Medicine, and Biostatistics, University of Rochester School of Medicine, Rochester, New York; Division of Epidemiology, Statistics and Prevention, National Institute of Child Health and Human Development, National Institutes of Health, Bethesda, Maryland
Ultrafin
e Carb
on
Particles in
Health
y and
Asth
matic Su
bjects
REPO
RT 126