research report - hire immigrants€¦ · · 2017-01-31research report . do large employers ......
TRANSCRIPT

RESEARCH REPORT
DO LARGE EMPLOYERS TREAT RACIAL MINORITIES MORE FAIRLY? A NEW ANALYSIS OF CANADIAN FIELD EXPERIMENT DATA
RUPA BANERJEE Ryerson University, Faculty of Management
JEFFREY G. REITZ University of Toronto, R.F. Harney Program, Munk School of Global Affairs
PHIL OREOPOULOS University of Toronto, Economics
January 25, 2017
___________________________________________________________________________
This research was supported with funds from the R.F. Harney Professorship and Program in Ethnic, Immigration and Pluralism Studies, Munk School of Global Affairs, University of Toronto (http://munkschool.utoronto.ca/ethnicstudies/). Original data collection was carried out with support from Metropolis British Columbia. The authors are grateful for research assistance provided by Noga Keidar and Tamar Becker, and for helpful comments from Heather Zhang. Contact the first-named author at: [email protected].

2
DO LARGE EMPLOYERS TREAT RACIAL MINORITIES MORE FAIRLY? A NEW ANALYSIS OF CANADIAN FIELD EXPERIMENT DATA
RUPA BANERJEE JEFFREY G. REITZ
PHIL OREOPOULOS
ABSTRACT: Analysis of amended data from a large-scale Canadian employment audit study (Oreopoulos 2011) shows that large employers with over 500 employees discriminate against applicants with Asian (Chinese, Indian or Pakistani) names in the decision to call for an interview, about half as often as smaller employers. The audit involved submission of nearly 13,000 computer-generated resumes to a sample of 3,225 jobs offered online in Toronto and Montreal in 2008 and 2009 for which university-trained applicants were requested by email submission. An organization-size difference in employer response to Asian names on the resume exists when the Asian-named applicant has all Canadian qualifications (20% disadvantage for large employers, almost 40% disadvantage for small employers) and when they have some or all foreign qualifications (35% disadvantage for large employers, over 60% disadvantage for small employers). Discrimination in smaller organizations is most pronounced in considering applicants for jobs at the highest skill levels. As well, whereas the Asian-name disadvantage is overcome in large organizations when the applicant has an additional Canadian master’s degree, this is not the case in smaller organizations. It is suggested that large organizations discriminate less frequently because they have more resources devoted to recruitment, a more professionalized human resources recruitment process, and greater experience with a diverse staff complement. Experimentation with anonymized resume review may be an inexpensive way that organizations can test their own hiring procedures for discrimination.

3
DO LARGE EMPLOYERS TREAT RACIAL MINORITIES MORE FAIRLY? A NEW ANALYSIS OF CANADIAN FIELD EXPERIMENT DATA
This study examines the extent of discrimination against skilled immigrants from
Asian backgrounds in Canada today, and asks whether this type of discrimination varies according to types of employers. In particular, we ask whether and how the practice of discrimination may vary according to types of organizations. Our focus is in particular on any differences between large and more modern organizations, as compared with the more traditional sectors of the labour market. Is the practice of discrimination minimized through the use of modern human resource management processes employed by more progressive organizations? These more professional recruitment processes may be aimed at maintaining and enforcing more objective and non-prejudicial criteria.
We use evidence from the discrimination audit study conducted in Toronto and
Montreal in 2008 and 2009 by Oreopoulos (2011). In this study, employers were sent 12,910 resumes in response to 3,225 job postings, and the study recorded whether the employers called to request an interview. These data represent the largest and most extensive body of information on racial discrimination in Canada today. While Canada prides itself on being among the most inclusive societies in the world, and the 2016 Social Progress Index ranks Canada second in the area of tolerance and inclusion, the findings of this audit provide clear evidence that discrimination based on racial origins persists in Canadian labour markets today. In the present, we build on these results, and supplement the original data with information on the employers who posted the jobs, enabling us to examine how employer characteristics affect the propensity to discriminate.
We begin with an overview of research on the racial discrimination in Canada today,
and show that some of the controversies about the extent of such discrimination have been significantly clarified by the employment audit methodology. We also describe the previous specific findings of most interest here. We then describe our further analysis to distinguish types of employers, and how they vary in the treatment of minority applicants. THE IMPORTANCE OF EMPLOYMENT-AUDIT STUDIES IN ASSESSING DISCRIMINATION
Employment audit studies have made an important contribution to the study of
racial discrimination. The conventional research approach to the study of discrimination is based on comparisons of immigrants and racial minority groups in census or labour force survey data, with differences in qualifications adjusted statistically. These studies are open to alternative interpretation. From these studies, we know that racial minorities face significant disadvantage in employment (for example Baker and Benjamin 1997; Hum and Simpson 1999; Pendakur and Pendakur 2002; Palameta 2007; Skuterud 2010; Pendakur and Pendakur 2011). While racial minority immigrants suffer the most significant hardship (Li

4
and Li 2013), even native-born minorities tend to earn less than their white counterparts, particularly in the private sector (Hou and Coulombe 2010). The employment disadvantage of Canadian-born racial minorities is of particular interest since this is a young and growing population who have been raised and educated in Canada and are fluent in English and/or French (Statistics Canada 2013). Therefore any disparity that they face relative to their white counterparts is not likely to be the result of language difficulties, or the lack of transferability of foreign qualifications. Nevertheless, there is the possibility that the differences may arise from other factors that affect employer assessments of productivity.
Audit studies address discrimination by observing actual employer responses to
simulated resumes which vary only in the information about the origins of applicants, and with productivity-related qualifications presented as identical. There have been a number of discrimination audit studies in other countries, including the United States (for example Bertrand and Mullainathan 2004, Gaddis 2015, and Kang et al. 2016)), Sweden (Carlsson and Rooth 2007), France (Adida et al. 2010) and Germany (Kaas and Manger 2010). All found significant discrimination against minority applicants. Neumark (2012) reviewed such audit studies and concluded that audit studies which control for observable variations in applicants’ quality that may affect hiring outcomes provide much more reliable and unbiased measures of employer discrimination than survey data. A number of studies have utilized the audit study design to examine racial discrimination in the hiring process. The types of discrimination they capture is what is often called ‘direct discrimination,’ and including implicit, statistical and prejudicial discrimination. A limitation of the audit studies is that typically they focus on only one employer decision – for example the call for an interview – and omit others which may contribute to the overall minority earnings disadvantages.
In the present study, we build upon Oreopoulos’ (2011) original Canadian data in
order to examine the impact of organizational and job characteristics on discriminatory practices in the decision to call an applicant for an interview. THE 28-PERCENT ASIAN NAME DISADVANTAGE
Resumes used in the Canadian discrimination audit contained standardized
qualifications and varied only in the ethnic character of the name on the resume. The sample was drawn from jobs posted online that accepted applications by email based on ‘pdf’ resumes, focusing on jobs most often requiring an undergraduate degree (but not a higher degree) and several years of experience. For the resumes, racial background was indicated by whether the applicant had an Anglo-Canadian name, or an Asian name: Chinese, Indian, or Pakistani.1 All resumes indicated bachelor’s degrees and other 1 Examples of Anglo-Canadian names (called ‘English names’ in the paper) were Greg Johnson and Emily Brown; Indian names used included Samir Sharma and Tara Singh; Pakistani names included Ali Saeed and Hina Chaudhry, and Chinese names included Lei Li and Xuiying Zhang. The study also included an examination of three other categories: those with English names who were immigrants from Britain, those with Chinese family names but English first names, and those with Greek names. These results are not examined here.

5
qualifications to ensure comparability across groups. The resumes were sent in random order to the employers, within a few days of one another. Discrimination was revealed in disparities at the first stage of screening of applicants, specifically whether the employer called for an interview.
Analysis showed that an Asian name on a resume can put the applicant at a serious
disadvantage in attempts to get a foot in the door with Canadian employers. Specifically, applicants with Asian names had a 28 percent reduced likelihood of getting called for an interview compared to applicants with an Anglo name even when all qualifications are equivalent and Canadian in origin (see Figure 1). This means that for every 100 calls received by applicants with Anglo names, applicants with Asian names received only 72.2 Because these resumes with Asian names had equivalent Canadian education and experience, this finding can be considered as a measure of the extent of racial discrimination in the process of granting interviews. This is because the distinction of an Anglo-Canadian v. Asian name was the only basis on which employers could choose between the two applications. Other than the difference in names, the applicants presented similar qualifications, and entirely Canadian in origin. And the Asian name very clearly references race. If racial discrimination is defined as a different outcome for different racial groups which can be attributed to race and not to actual qualifications, then the finding truly assesses racial discrimination.
SOURCE: Oreopoulos, 2011, p. 161, Table 4. See Table 1 in Appendix.
2 In the original study, the finding was reported as an 39% Anglo advantage (Oreopoulos 2011, p. 160-1), because 100 calls is 39 percent more than 72 calls. This is mathematically equivalent, but we opt to present the results here in terms of the extent of Asian disadvantage relative to the mainstream Anglo population.

6
In this finding, the implication of discrimination is appropriate regardless of whether the employer was concerned about the qualifications of the Asians. Oreopoulos contacted employers as a later stage of his research, to get their perspectives on the results, and many indicated that an Asian name suggested the possibility of language problems and heavy accents. However, as Oreopoulos observed, the information in the resumes – including the Canadian education and experience – would contradict this concern, and in any case the employer could easily check by means of a quick telephone call. The ‘language-difficulty’ rationale was also challenged by the fact that rates of discrimination were similar regardless of the extent to which the job required communication skills. So employers had no evidence to base their concerns about the language skills of the Asians from which they received resumes.
However, in another aspect the study included resumes where applicants had an
Asian name but with foreign education and varying degrees of foreign experience. Analysis showed that applicants with Asian names plus foreign education but all Canadian experience were 29.7% percent less likely to get a call compared to applicants with Anglo; 46.1% percent less likely if the Asian applicant had a mix of Canadian and foreign experience, and 62.5% percent less likely if the Asian applicant had only foreign experience (see Figure 1, shaded bars). In other words, among Asian applicants with foreign education, the presence or absence of Canadian experience made a very large difference in the response of employers. Less frequent positive responses to resumes with some or all foreign qualifications have a different implication regarding racial discrimination. In many cases there may be a legitimate concern among employers about the relevance of foreign qualifications, including both education and experience. This is why so much attention has been given to the question of the equivalence of these qualifications, how immigrants may demonstrate that equivalence, and how they may make up for any deficiencies. Nevertheless, there is also a potential for discrimination in assessment of these qualifications, and it is of interest to see which employers show themselves willing to give an Asian with foreign qualifications a chance. Efforts to keep such applications active and to follow up with an interview may indicate greater openness to diversity and to accommodation of difference, and our study is interested in how such a response may depend on employer characteristics. QUESTIONS ABOUT TYPES OF EMPLOYERS What types of employers reject applications simply on the basis of an applicant’s Asian name? And what types are unwilling to pursue applications with Asian names, even with Canadian qualifications or possibly even with some foreign qualifications? Are the ‘Asian-name averse’ employers representative of older or more traditional segments of the labour market, where skills may be required but matter less than finding employees who will be part of ‘the gang’ at work? Do employers who adopt modern human resource management techniques move beyond these traditional prejudices to take advantage of the

7
diversity of today’s Canadian workforce? These are important questions because they may suggest whether changes toward a more advanced and ‘knowledge-based’ economy is likely to break down vestiges of racial discrimination, or whether they simply maintain and practice such discrimination in new forms. There has been a tendency to see racial discrimination as a practice of the past, rather than part of present-day reality in Canada. Although the fairly recent Canadian audit study findings show that discrimination is far from eliminated, it may still be argued that trends in modern management are toward less discriminatory procedures. Is this really the case?
This is a question with practical as well as theoretical implications. Some employers believe that the process of modernizing their human resource management procedures is largely complete, and that new selection methods render racial discrimination all but impossible. However, others suggest that the recruitment function in any organization functions in a ‘political’ environment, which sets criteria for judging performance based on the kinds of workers selected. This opens the door for popular preferences to influence human resources procedures. Such pressures may exist whether the human resource function is internal to an organization, or whether recruitment is conducted by external agencies.
The effect of formalized Human Resource Management practices on discriminatory behaviour has been examined by many organizational theorists and researchers over the years. In fact, it has been argued that the field of Human Resource Management (HRM) arose because of the need for companies to comply with government-mandated equal opportunity legislation. In 1960s and 1970s, personnel managers came to become advocates for codified selection, performance evaluation and promotion practices as a way to curb favouritism and discrimination, without having to resort to quotas (Bell 1971; Bassford 1974; Harvard Law Review; 1989; Dobbin et al. 1993). Although some have argued that these HR practices are simply symbolic gestures that legitimize the status quo without having any substantive impact on the employment status of disadvantaged groups (e.g. Ferguson 1984; Acker 1990; Edelman 1992), others have found that formalized HR does have a real impact on discriminatory behaviour (e.g. Glasser 1988; Bielby 2000; Reskin 2000; Goodman, Fields and Blum 2003). Still others contend that the relationship is more complicated and that HR managers must make an explicit effort to increase diversity and improve the status of specific disadvantaged groups in order to have any impact at all (Konrad and Linnehan 1995; Dobbin, Schrage and Kalev 2015).
EMPLOYER SIZE AND THE HIRING PROCESS
The original Canadian audit study data did not include information on employer characteristics, so for this study it was necessary to add this information. The file included the name of the employer organization, and this provided the opportunity to gather information on organization size, specifically the number of employees in the recruiting organization. This is useful because large organizations may be expected to differ from

8
smaller organizations in a number of aspects potentially relevant to discrimination. Over 70 percent of private sector employees in Canada work for small employers (less than 100 employees), so it is important to understand whether small employers behave differently than larger employers (Industry Canada 2016). Many empirical studies have confirmed that small organizations are more likely to operate in an informal and flexible manner than are larger firms (Chaston 1997; Crick and Chaudry 1997; Gibb 1997; Hendrickson and Psarouthakis 1998; Marlow and Patton 1993; Pfeffer 1994; Whittington 1993; Kok and Uhlaner 2001). Large organizations may devote more resources to the recruitment process, may have a more professionalized human resource management function, and may have a more diverse workforce, or at least one in which more diverse groups are represented. All of these factors may be seen as altering the nature of the hiring process and affecting the likelihood of discrimination. Certain studies of employment disadvantage of minorities have found that racial minorities tend to do better in more rule-bound work environments. For example, Fang and Heywood (2006) found that racial minorities in Canada earn more if they are in “piece-work” or “output-based” pay settings. Similarly, Hou and Coulomb (2010) find that Canadian-born racial minorities fare much better in the public sector than in the private sector. The public sector has larger establishment sizes on average than the private sector, and therefore is more likely to have the resources to allocate to standardized recruitment practices.
The more resources devoted to recruitment, the more intensive the review of
applications, the larger the number of applications that can be reviewed carefully, and the more interviews that can be conducted. All of this may work to increase the likelihood that a minority candidate may be considered fairly, because the process is unlikely to be swayed by something as superficial as the ethnic character of the applicant’s name.
A more professionalized recruitment process may influence the degree to which the
review of applicants’ files is systematic, focuses on key qualifications, and militates against relying on extraneous considerations. Professionalized recruitment may also incorporate processes of multiple stages, group-based review, and explicit procedures to prevent discrimination, all of which may give additional opportunity to minority applicants.
Third, a more diverse organization may also create or reflect an environment more
open to non-discriminatory hiring. The experience of hiring and working with minorities may serve to mollify concerns or fears that may exist about the question of diversity. As well, In fact, it could be that in cities with diverse populations such as Toronto and Montreal, large organizations may be expected to have confronted and addressed those issues in an effective manner.
And finally, larger organizations may have more resources to devote to training for
new hires, which may help them make up for any lack of direct Canadian experience that minority applicants may be perceived as needing. This may make larger firms more willing to consider such job applications.

9
Of course all these hypotheses may be false. They all assume a social environment which is essentially supportive of non-discriminatory hiring, and if that assumption is not correct, then none of the processes mentioned above may operate as outlined above. More careful review of applications, more systematic assessment of qualifications, and greater experience with Asian applicants, would not be expected to lead to better outcomes for Asians if those who conduct the reviews believe that Asian workers are basically not wanted in the organization, or that management will look less favourably on recruiters who too-frequently recommend the hiring of Asians. In other words, social indifference to the question of discrimination may mean that even larger organizations with their resources, professional human resources management and experience with diversity will be unable to overcome discriminatory hiring.
Some previous audit-study research has examined employer characteristics including
size, providing some indication of more discrimination in smaller organizations, at least where credential-assessment processes are relevant. On the one hand, Bertrand and Mullainathan (2004) focused on blue-collar jobs, in which assessment of qualification by human resources procedures may not be relevant. They found that resumes with white-sounding names received 50 percent more call-backs from employers than black-sounding names, and no significant differences by occupation, industry and employer size. By contrast, Carlsson and Rooth (2007) found in Sweden that Swedish names received 50 percent more call-backs than Middle Eastern names, and small employers (those with fewer than 20 employees), those with high turnover and those located in municipalities with relatively few immigrants were more discriminatory in their selection. Kaas and Manger (2010) in Germany found a German name increased the probability of a callback by about 14 percent. Within small firms, however, the rate of discrimination was much higher: German names were 24 percent more likely to receive a call-back from employers with less than 30 employees.
ADDING ORGANIZATIONAL SIZE TO THE DATA To the original data, we have added a measure of organizational size, using information about each organization obtained from an internet search.3 We analysed three categories of organization size: those with 50 employees or less, those with 51-500 employees, and those with more than 500 employees. In the 3,225 job postings tested originally, we excluded those for which none of the resumes received a return call for an interview (and hence yielding no information about discrimination) leaving 2,516 employers. Of these, we were able to obtain information on organizational size for 1,609 employers (63.9 percent; 670 small organizations, 457 medium-sized organizations, and 495 large
3 Internet information on employer size may not always pertain to the exact period of time during which the resumes were submitted, in some cases it may be more recent, and in some cases it may be based on earlier counts. However, it seems unlikely that large shifts in organization size affected a significant number of the employers.

10
organizations = 1,622 organizations; excluding missing cases on other variables = 1609). We also excluded cases in which the only return calls were for resumes with Greek names or for British immigrants, leaving 1,278 job postings. Hence, our analysis is based on the 1,278 job postings where return calls were made to either an Anglo-named or Asian-named applicant, and information was available on the number of employees in the employer organization.
In this sample (N=1,278), the basic patterns originally reported (Oreopoulos 2011) are altered only slightly. Whereas the original analysis showed a 28.0 percent disadvantage for Asian-named resumes with all Canadian qualifications, in the sample with employer-size data the corresponding Asian-name disadvantage is 32.6 percent. The disadvantages for Asian-named applicants with foreign education but Canadian experiences is 39.0 percent, for those with foreign education and some foreign experience it is 50.3 percent, and for those with foreign education and all foreign experience, it is 72.3 percent. In the following analyses, for simplicity all the resumes with any foreign qualifications are combined in one category. The Asian-name resume with any foreign qualifications were 53.5 percent less likely to receive a call.
DIFFERENCES IN LARGER ORGANIZATIONS We find that the tendency for Asian-named applicants to receive fewer calls was
greatest in the small and medium size organizations, and somewhat less in the largest category with 500 or more employees. Compared to applicants with Anglo names, the Asian-named applicants with all Canadian qualifications had 20.1 percent fewer calls in the largest organizations, but 39.4 percent fewer in the medium size organizations, and 37.1 percent fewer in the smallest organizations (less than 50 employees; see Figure 2). So the disadvantage of an Asian name is less in the large organizations, although it has not disappeared. The disadvantage of Asian-named applicants is about half of what it is for the smaller organizations.

11
SOURCE: Authors’ analysis, N=1278. See Table 2 in Appendix.
Statistical analysis shows that while the difference between large and small
organisations in level of racial discrimination, and the lower level of such discrimination, is significant (p < 0.07), so also the remaining level of discrimination in large organisations is significant when analyzed separately (N=493; p < 0.01). Both findings should be given attention. The lower level of discrimination against Asians in the larger organizations is an important finding with considerable implication for both theory and policy as will be explored below. At the same time, when we analyse discrimination in the large organizations alone, we find the 20.1 percent fewer calls to Asian-named applicants with all Canadian qualifications to be significant also. In a nutshell, while discrimination by large organizations is less, it is still significant.
There is also an organizational size difference in treatment of Asian-named
applicants with some foreign qualifications. Generally the largest organizations are more likely to consider these applicants in an interview than either the middle sized or smaller organizations. Regarding Asian-named applicants with foreign qualifications, again employers in all organization size categories called these applicants 34.5 percent less often, while the employers with medium size called 60.1 percent less often, and the smaller employers called them 65.9 percent less often. Overall calls to Asian-named applicants with foreign qualifications are less frequent than to those with only Canadian qualifications, but the inter-organizational differences follow the same pattern. The disadvantage for Asian-named applicants with foreign qualifications is just over half in large organizations than what

12
it is in medium sized or small organizations. Again the difference by organizational size is significant. Compared to the larger organizations, in the medium-size organizations the disadvantage for Asian-named applicants with foreign qualifications is 75.6 percent greater, and in the smaller organizations it is 90.7 percent greater. Statistically, the difference in Asian disadvantage by organization size is significant, as is the Asian disadvantage in the large organizations considered separately. Although all organizations tend to reflect skepticism in their response to foreign qualifications, the larger organizations may give somewhat less unfavourable consideration to these resumes. VARIATION BY OCCUPATIONAL SKILL LEVEL
Does organizational size affect discrimination at the highest skill levels, which are the jobs likely to be the best-paid? Although all applicant resumes showed at least a bachelor’s degree level of qualification, not all the jobs to which the resumes were submitted actually require the same level of skill. Most jobs required a bachelor’s degree, but some did not, and there was considerable variation in the level of employment, the skills required, and the likely remuneration. In the job posting, the job description enabled us to classify the job according to occupational status, closely related to skill level. We used the Nam-Powers-Boyd occupational status scale as adapted to the 2001 Canadian census categories (Boyd 2008). The occupations in the job postings had an average NPB score of 71.6, ranging between 19 and 96 and with a standard deviation of 17.7. All the occupations were in the “white-collar” category, so examples of high-skill jobs (NPB score 80 or higher) were accountant, civil engineer, or sales and marketing manager; average skill level jobs (NPB score 65-75) included financial advisor, claims adjustor, administrative assistant; lower skill jobs (NPB 60 or less) included bookkeeper, accounts payable processor, restaurant manager, canvasser or cashier.
We find that across the entire sample, the extent of discrimination against Asian-
named applicants with all Canadian qualifications is virtually the same for both high skill jobs and lower skill jobs. For the high skill jobs, Asian-named applicants with all Canadian qualifications were 32.9 percent less likely to get a call, compared to 30.7 percent less likely for the low skill jobs (see Figure 3).. The coefficient for the interaction of the Asian-named but Canadian qualified applicant with skill level of job is just slightly negative, -0.027 (n.s.), implying slightly less positive responses for Asians applying to high-skilled jobs than to low-skill jobs.

13
SOURCE: Author's analysis, N-1236. See Table 3 in Appendix.
Skill level matters much more when Asian-named applicants have some foreign
qualifications. Their rate of receiving calls is less overall and significantly lower in the high-skill jobs compared to the low-skill jobs. Whereas overall the Asian-named applicants had about 53.3 percent less chance of receiving a call-back if they had some foreign qualifications, this number rises to 58.5 percent for applicants to high skill jobs; for applicants to low-skill jobs the Asian applicants were 45.7 percent less likely to receive a call. The coefficient for the interaction of Asian-named foreign-qualified applicant with skill level (-0.116) is negative, and significant at the 0.07 level.
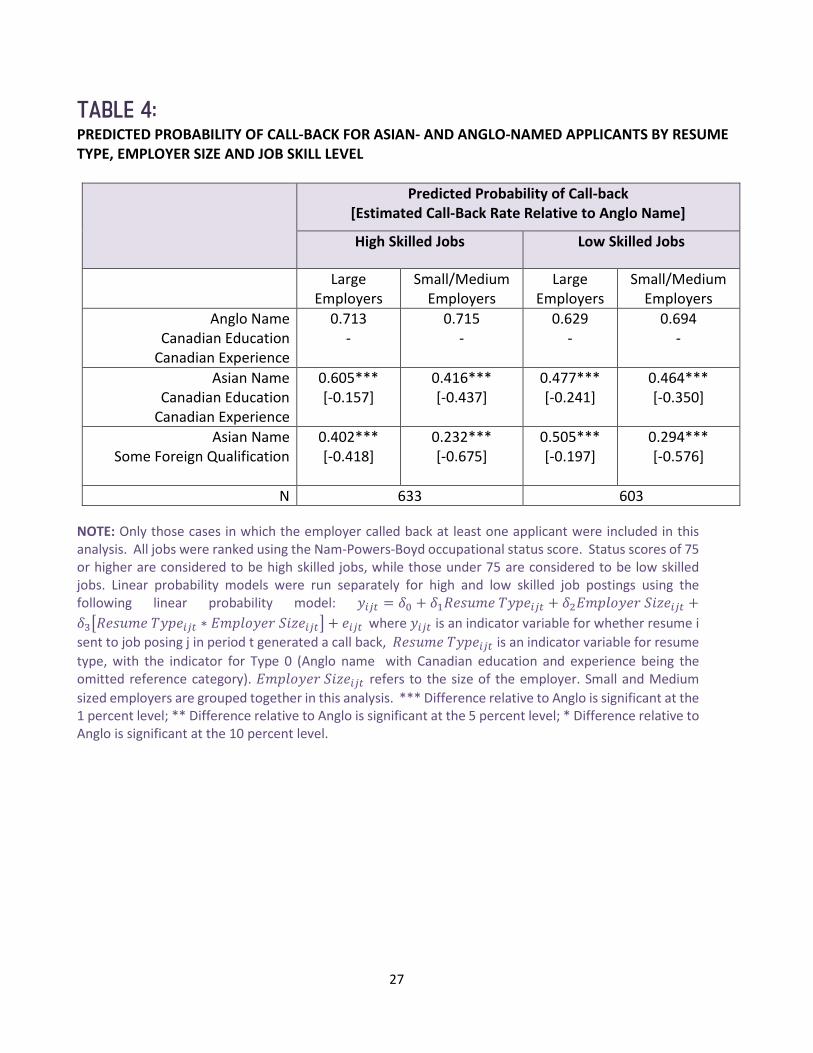
The less favourable response to Asian-named and foreign-qualified applicants at the higher skill levels may arise because in those jobs, more is at stake in the credential assessment, so avoiding the issue by not calling for an interview is seen as the safer option. Hence to understand the impact of differences between large and small organizations, it is important to consider the extent to which those differences exist particularly at the higher skill levels. The analyses in the next charts show that the difference between large and small organizations in response to Asian applicants definitely persists at the high-skill level. Most significantly, the difference is found for Asian-named applicants with all-Canadian qualifications, as well as for those with some foreign qualifications (see Figure 4A). This finding underscores that small organizations are avoiding Asian-named applicants regardless of whether their qualifications may be more difficult to assess because of foreign origins. Their skepticism about the suitability of Asian-named applicants is evident even when foreign qualifications are not at issue. Asian-named applicants to high-skill jobs and with all-Canadian qualification are 15.2 percent less likely to be called by large organizations, but 41.8 percent less likely to be called by medium or small organizations. Compared to large organizations, medium and small organizations are more than twice as negative in their

14
response to Asian applicants when foreign qualification is not an issue. The difference between large and smaller organizations in this type of discrimination is significant, p = 0.07. When the Asian-named applicants to high-skill jobs have some foreign qualification, the calls are less frequent by 43.7 percent in the large organizations, and by 67.5 percent in smaller organizations, p = 0.06. Hence when the most sought-after jobs are at stake, organizational size affects responses to Asian-named applicants both when foreign qualifications are at issue, and when they are not.
SOURCE: Authors' analysis, N=633. See table 4 in Appendix.
SOURCE: Authors' analysis, N=603. See Table 4 in Appendix.

15
At the lower skill level, Asian-named applicants also receive less frequent calls, but the degree of disadvantage is less. As well, the differences by organizational size, as well as by type of qualification, are less pronounced. Still organizational size does matter and it is the relatively small organizations that are least likely to respond to Asian-named applicants. The most significant disadvantage is for Asian applicants to low-skill jobs in small-medium organizations who have some foreign qualification (see Figure 4B). These applicants are 57.6 percent less likely to receive a call than an Anglo-named applicant. But at the low-skill job level, there are less unfavourable responses to Asian applicants to small organizations with all Canadian qualifications, and to Asian applicants to large organizations regardless of type of qualification. There is a pervasive tendency for Asian-named applicants to be relatively preferred for the low-skill jobs, particularly in smaller organizations.
IMPACT OF ADDITIONAL QUALIFICATIONS
We also ask whether discriminatory aversion to Asian names is affected if the Asian applicant has a higher level of qualification than the Anglo-Canadian-named applicant. In other words, we ask: if Asian-named applicants with equivalent qualifications receive less favourable treatment, how much additional qualification might it take to offset this negative effect? Would an additional degree give the Asian-named applicant a more equal chance to be called for an interview, particularly for the highest skill-level jobs? Are their organizational differences in how additional qualifications might matter?
We found that the additional MA had different effects depending on the skill level of the job. At high skill levels, for Anglo applicants the possession of a Canadian MA improved prospects for a callback by 15.8 percent, whereas at lower skill levels possession of a Canadian MA actually reduced prospects for a callback 10.5 percent. The negative effect for low-skill jobs could reflect the problem of “over-qualification,” by which qualifications markedly above those actually required for the job may signal to employers the possibility of problems, such as lack of potential long-term commitment to a job, or possibly other problems which may not be visible.
So to test the effect of extra qualifications, we focus our attention on the high-skill
jobs, and there the data indicate that for Anglo applicants, having the Canadian MA improves the prospects of a call from the employer from 69.9 percent to 81.0 percent, or about 10.1 percent (see Figure 5). This is about the same as for Asian-named applicants with Canadian qualifications: the rate is increased from 45.9 percent to 56.5 percent, about 10.6 percent. Notice that the positive effect of the extra MA, while notable, is not enough to offset the overall disadvantage of the Asian name. The callback rate for Anglo applicants without the MA at 69.9 percent is still 13.4 percent higher than it is for Asian-named applicants with the MA.

16
SOURCE: Authors' analysis, N=633. See Table 5 in Appendix.
For the Asian-named applicants with foreign qualifications but the extra Canadian
MA, we find that the disadvantage for those with the extra Canadian MA actually becomes greater. (The negative effect of the MA specifically for the Asian-named applicants with foreign qualifications is -0.213, and is statistically significant at the 0.05 level.) The reason for this negative effect is not at all clear. However, it certainly underscores the substantial size of the overall disadvantage for those with Asians names, that it cannot be offset by simply adding extra Canadian qualifications, even an additional degree. Whether an even higher level of additional qualification for the Asian-named applicants would finally offset the disadvantage of the name itself is unclear, of course, but it is also possible that at some point the issue of ‘over-qualification’ and its negative effects might become significant. At the lower-skill job level, the effect of the MA is not as positive either for Anglo-named or Asian-named applicants (not shown). The coefficient is -0.07295 but not significant.
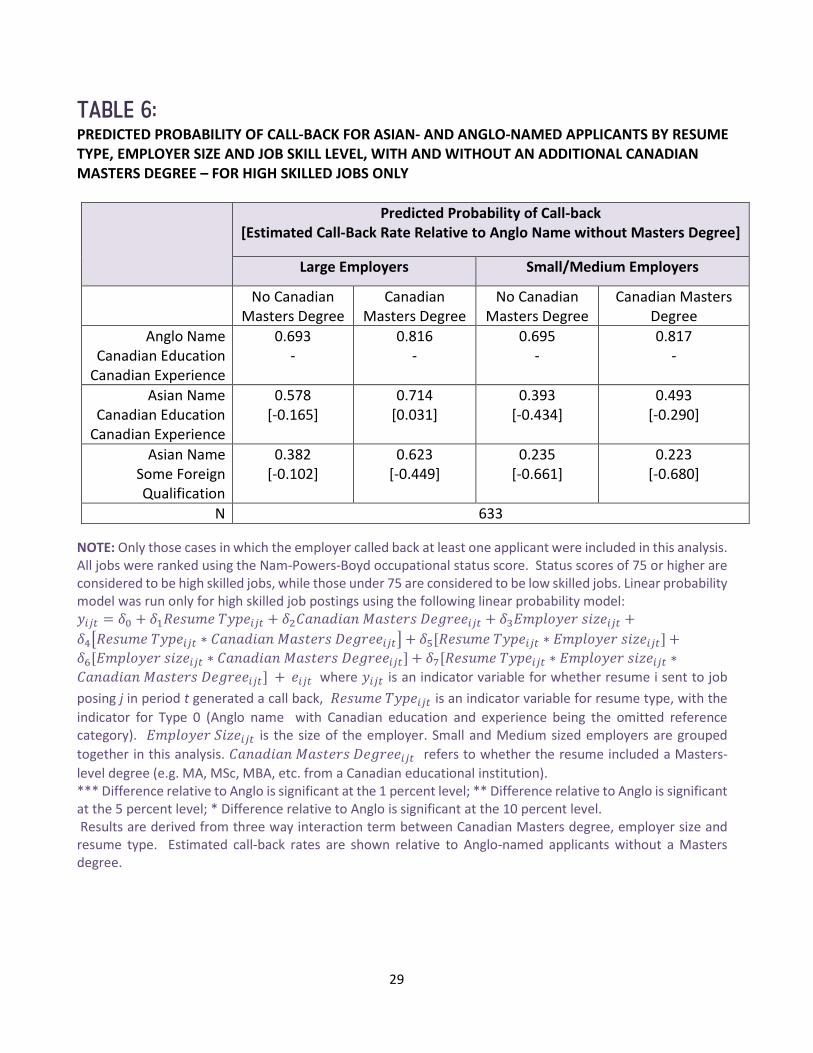
If we examine these variations by organizational size, we see that the extra MA makes about the same difference for Asian-named applicants with Canadian qualifications as it does for the Anglo-named applicants. Because the Asian-named disadvantage is less in the large organizations, we can see that having the extra MA boosts the Asian-named applicant’s callback rate to about equivalent to the rates for Anglo applicants without the MA (see Figure 6). In other words, in large organizations, the size of the Asian name disadvantage can be made up by possessing an extra Canadian MA degree. In the smaller companies, this is not the case partly because the benefit of the Canadian MA is less, and also because of the large gap in callback rates occasioned simply by having an Asian name in for these employers. For the Asian-named applicants with foreign qualifications, the benefits of the Canadian MA are less, and this is particularly the case in the smaller organizations. So with the exception of Asian-named applicants with all Canadian qualifications, the addition of a Canadian MA does not serve to cancel the disadvantage

17
associated with having an Asian name. Those with the MA still have call-back rates below those of the Anglo applicants even without the extra MA.
SOURCE: Authors’ analysis, N=633. See Table 6 in Appendix.
SUMMARY AND IMPLICATIONS Although employers both large and small exhibit discriminatory practices in the assessment of Asian-named applicants even when they have Canadian qualifications, and show even more reluctance to consider Asian-named applicants with foreign qualifications, there is a substantial difference between larger and smaller organizations in this regard. Larger organisations are more receptive to Asian-named applicants than smaller organizations, whether or not they have Canadian qualifications. These biases are particularly evident in applicants for jobs at the highest skill levels, and the difference between large and smaller organizations also is quite evident in the data on responses to applicants to those jobs. In fact to some extent the more favourable responses of large organizations occurs because of more favourable responses to Asian-named applicants with foreign qualifications specifically in the case of low-skill jobs. However, there remains a substantial difference by organizational size even for jobs at the high skill levels. Our analysis shows that large organizations also respond more favourably to the possession of ‘extra’ qualifications, specifically a Canadian MA (which served to top-up the qualifications of the applicants in this study all of whom possessed a bachelor’s degree). The extra degree provides a sufficient boost which tends to offset the Asian-name disadvantage in competition with an Anglo applicant without the degree. For Asian applicants in the smaller organizations, even the extra degree does not really alter the substantial disadvantage faced in attempting to get a job interview.

18
These findings carry important implications for understanding employment discrimination, and for taking steps to address it. Our hypotheses suggested that larger organizations might have more favourable outcomes for minorities because of devoting more resources to the evaluation of applications, because of a more professional recruitment process informed by the knowledge-base of human resource management, and because of more experience with diversity because of the larger workforce. Smaller organizations lack these advantages, and in addition may find that hiring any single minority applicant may have a greater impact simply because of the smaller size of the organization. All these possibilities should be further explored. A relatively low-cost method for doing this would be for employers to experiment with anonymized resumes. They could on a random basis mask the names of applicants at the time of the initial screening, and then track the result. They could also take steps to ensure that more information is used after the interview to make a hiring decision. What the findings suggest overall is that discrimination represents the activities of employers who in some ways are themselves disadvantaged. They are disadvantaged in not having at their disposal the knowledge-base and resources to fully appreciate the value of applicants whose names and in some instances qualifications may seem strange. They lack the experience to fully tap more diverse segments of the workforce. The problem of discrimination in the relatively smaller organizations is not necessarily easily addressed. The employers though small represent a significant part of the labour market, and yet they may be isolated to some degree from trends across industries toward more flexible and open hiring processes. Because of the lack of professional HR staff, they may not be aware of practices developing in their industry or field of activity. In short, their isolation places them at a competitive disadvantage relative to the larger, and evidently more successful, employers. Some large organizations have become advocates of ‘diversity hiring.’ They may be well-positioned to do so, but in some ways their advocacy may not ring true to many smaller employers. They may ask: If diversity hiring creates a competitive advantage, why are the large organizations giving away their ‘secrets’? Perhaps they are simply playing a public relations game? These are legitimate questions, but the data here suggest that the resources large organizations put into hiring leads them to consider hiring minorities more often, and to probe more deeply into the value of foreign qualifications.

19
REFERENCES
Acker, J. (1990). “Hierarchies, jobs, bodies: a theory of gendered organisations”. Gender and
Society, 4(2), 139-158. Adida, Claire L., David D. Laitinb, and Marie-Anne Valfortc, 2010. “Identifying barriers to
Muslim integration in France,” Proceedings of the National Academy of Sciences, 107 52 22384–22390, doi: 10.1073/pnas.1015550107.
Baker, M. and D. Benjamin. (1997) “Ethnicity, foreign birth and earnings: a Canada/US
comparison,” in Transition and Structural Change in the North American Labour Market, ed. M.G. Abbott, C.M. Beach, and R.P. Chaykowski (Kingston: IRC Press, Industrial Relations Centre, Queen’s University).
Bassford, Gerald L. 1974. "Job Testing-Alternative to Employment Quotas." Business
Horizons 17:37-50. Bell, Duran, Jr. 1971. "Bonuses, Quotas, and the Employment of Black Workers." Journal of
Human Resources 6:309-20. Bertrand, M., & Mullainathan, S. (2004). Are Emily and Greg More Employable Than Lakisha
and Jamal? A Field Experiment on Labor Market Discrimination. American Economic Review, 94(4), 991–1013.
Bielby, W. T. (2000). Minimizing workplace gender and racial bias. Contemporary Sociology,
29(1), 120–129. Boyd, M. (2008). “A Socioeconomic Scale for Canada: Measuring Occupational Status from
the Census.” Canadian Review of Sociology 45(1): 51-91. Carlsson, M., & Rooth, D. O. (2007). Evidence of ethnic discrimination in the Swedish labor
market using experimental data. Labour Economics, 14(4 SPEC. ISS.), 716–729. Chaston, I., 1997, “Small Firm Performance: Assessing the Interaction Between
Entrepreneurial Style and Organizational Structure”, European Journal of Marketing 31, 814–831.
Crick, D. and S. Chaudry, 1997, ‘Small Businesses’ Motives for Exporting: The Effect of
Internationalisation’, Journal of Marketing Practice: Applied Marketing Science 3(3), 156–170.
de Kok, J. & L.M. Uhlaner. (2001). Organization Context and Human Resource Management
in the Small Firm. Small Business Economics, 17, 273–291.

20
Dobbin, F., Sutton, J. R., Meyer, J. W., & Scott, W. R. (1993). Equal Opportunity Law and the
Construction of Internal Labor Markets Equal Opportunity Law and the Construction of Internal Labor Markets’. American Journal of Sociology, 99(2), 396–427.
Dobbin, F., Schrage, D., & Kalev, A. (2015). Rage against the Iron Cage: The Varied Effects of Bureaucratic Personnel Reforms on Diversity. American Sociological Review, 80(5), 1014–1044.
Edelman, Lauren B. 1992. “Legal Ambiguity and Symbolic Structures: Organizational Mediation of Civil Rights Law.” American Journal of Sociology 97(6):1531–76.
Fang, T. & Heywood, J. (2006). “Output pay and ethnic wage differentials: Canadian evidence”, Industrial Relations Vol. 45, No. 2 (April 2006).
Ferguson, Kathy E. 1984. The Feminist Case against Bureaucracy. Philadelphia: Temple University Press.
Kang, S. K., K. A. DeCelles, A. Tilcsik, and S. Jun. 2016. “Whitened Resumes: Race and Self-Presentation in the Labor Market.” Administrative Science Quarterly 61(3): 469–502.
King, Eden B., Saaid a Mendoza, Juan M. Madera, Mikki R. Hebl, and Jennifer L. Knight. 2006. “What’s in a Name? A Multiracial Investigation of the Role of Occupational Stereotypes in Selection Decisions.” Journal of Applied Social Psychology 36(5):1145–59.
Michael Gaddis, S. (2015). Discrimination in the credential society: An audit study of race and college selectivity in the labor market. Social Forces, 93(4), 1451–1459.
Gibb, A. A., 1997, ‘Small Firms’ Training and Competitive- ness: Building upon the Small Business as a Learning Organization’, International Small Business Journal 15(3), 13–29.
Glasser, I. (1988). Affirmative action and the legacy of racial injustice. In P. A. Katz & D. A. Taylor (Eds.), Eliminating racism: Profiles in controversy (pp. 341-357). New York: Plenum Press.
Goodman, J. S., D. L. Fields and T. C. Blum (2003). ‘Cracks in the glass ceiling: In what kinds of organizations do women make it to the top?’, Group and Organization Management, 28, pp. 475–501.
Harvard Law Review. 1989. Note: "Rethinking Weber: The Business Response to Affirmative Action." Harvard Law Review 102:658-71.
Heckman, J., 1998. “Detecting Discrimination”. Journal of Economic Perspectives 12, 101–
116.
21
Hendrickson, L. U. and J. Psarouthakis, 1998, Dynamic Management of Growing Firms: A
Strategic Approach, 2nd edition, Ann Arbor, MI: The University of Michigan Press. Hou, F., & Coulombe, S. (2010). “Earnings Gaps for Canadian-Born Visible Minorities in the
Public and Private Sectors.” Canadian Public Policy. 36(1), 29–43. Hum, D., and W. Simpson. 1999. “Wage Opportunities for Visible Minorities in Canada.”
Canadian Public Policy 25, no. 3. Industry Canada. 2016. Key Small Business Statistics.
Kaas, L., & Manger, C. (2010). Ethnic Discrimination in Germany ’ s Labour Market : A Field Experiment. German Economic Review, 13(4741), 1-20.
Konrad, A. M., & Linnehan, F. (1995). Formalized HRM Structures: Coordinating Equal Employment Opportunity or Concealing Organizational Practices? Academy of Management Journal, 38(3), 787–820.
Li, P. S., & Li, E. X. (2013). Decomposing Immigrants’ Economic Integration in Earnings Disparity: Racial Variations in Unexpected Returns. Canadian Ethnic Studies, 45(3), 81–94.
Marlow, S. and D. Patton, 1993, ‘Research Note-Managing the Employment Relationship in the Smaller Firm: Possibilities for Human Resource Management’, International Small Business Journal 11(4), 57–64.
Neumark, D. (2012). Detecting Discrimination in Audit and Correspondence Studies. Journal of Human Resources, 47(November 2011), 1128–1157.
Oreopoulos, P. (2011). Why Do Skilled Immigrants Struggle in the Labor Market ? A Field Experiment with Thirteen Thousand Resumes. American Economic Journal: Economic Policy, 3(4), 148–171.
Palameta, B. (2007). “Economic integration of immigrants’ children” perspectives (October 2007) (pp. 5– 16). Ottawa: Statistics Canada.
Pendakur, K., and R. Pendakur. 2002. "Colour My World: Has the Minority-Majority Earnings Gap Changed over Time?" Canadian Public Policy 28 (4): 489-512.
Pendakur, K., & Pendakur, R. (2011). Color by Numbers: Minority Earnings in Canada 1995--2005. Journal of International Migration and Integration, 12(3), 305–329.
22
Pfeffer, J., 1994, Competitive Advantage through People, Boston: Harvard Business School Press.
Reitz, J., Zhang, H. & Hawkins, A. (2009). “Comparisons of the success of racial minority immigrant offspring in the United States, Canada and Australia”, unpublished working paper.
Reskin, B. F. (2000). The Proximate Causes of Employment Discrimination. Contemporary Sociology, 29(2), 319–328.
Shih, J. (2002). ‘‘Yeah, I could hire this one, but I know it’s gonna be a problem’’: How ethnicity, nativity, and gender affect employers’ perceptions of job seekers. Ethnic and Racial Studies, 25, 99-119.
Skuterud, M. (2010). The visible minority earnings gap across generations of Canadians. Canadian Journal of Economics, 43(3), 860–881.
Statistics Canada. (2013). Immigration and Ethnocultural Diversity in Canada: National Household Survey.
Whittington, R., 1993, What Is Strategy And Does It Matter? London: Routledge.
Young, R. K., Kennedy, A. H., Newhouse, A., Browne, P., & Thiessen, D. (1993). The effects of names on perception of intelligence, popularity, and competence. Journal of Applied Social Psychology, 23, 1770-1788.

23
APPENDIX

24
TABLE 1: PREDICTED PROBABILITY OF CALL-BACK BY RESUME TYPE, ASIAN AND ANGLO NAMES
Predicted Probability of Call-back [Estimated Call-Back Rate Relative to Anglo Name]
Anglo Name
Canadian Education Canadian Experience
0.157 -
Asian Name Canadian Education
Canadian Experience 0.113*** [-0.280]
Asian Name Foreign Education
Canadian Experience 0.111*** [-0.297]
Asian Name Foreign Education Mixed Experience
0.085*** [-0.461]
Asian Name Foreign Education
Foreign Experience 0.059*** [-0.625]
N=9230 SOURCE: Figure 4, Oreopoulos (2011). Note: we exclude Greek, Chinese with English first name and British English in this analysis. *** Difference relative to Anglo is significant at the 1 percent level; ** Difference relative to Anglo is significant at the 5 percent level; * Difference relative to Anglo is significant at the 10 percent level

25
TABLE 2: PREDICTED PROBABILITY OF CALL-BACK FOR ASIAN- AND ANGLO-NAMED APPLICANTS, BY RESUME TYPE AND EMPLOYER SIZE
NOTE: Only those cases in which the employer called back at least one applicant were included in this analysis. Results are derived from regression using the following linear probability model: 𝑦𝑦𝑖𝑖𝑖𝑖𝑖𝑖 = 𝛿𝛿0 +𝛿𝛿1𝑅𝑅𝑅𝑅𝑅𝑅𝑅𝑅𝑅𝑅𝑅𝑅 𝑇𝑇𝑦𝑦𝑇𝑇𝑅𝑅𝑖𝑖𝑖𝑖𝑖𝑖 + 𝛿𝛿2𝐸𝐸𝑅𝑅𝑇𝑇𝐸𝐸𝐸𝐸𝑦𝑦𝑅𝑅𝐸𝐸 𝑆𝑆𝑖𝑖𝑧𝑧𝑅𝑅𝑖𝑖𝑖𝑖𝑖𝑖 + 𝛿𝛿3�𝑅𝑅𝑅𝑅𝑅𝑅𝑅𝑅𝑅𝑅𝑅𝑅 𝑇𝑇𝑦𝑦𝑇𝑇𝑅𝑅𝑖𝑖𝑖𝑖𝑖𝑖 ∗ 𝐸𝐸𝑅𝑅𝑇𝑇𝐸𝐸𝐸𝐸𝑦𝑦𝑅𝑅𝐸𝐸 𝑆𝑆𝑖𝑖𝑧𝑧𝑅𝑅𝑖𝑖𝑖𝑖𝑖𝑖� + 𝑅𝑅𝑖𝑖𝑖𝑖𝑖𝑖 where 𝑦𝑦𝑖𝑖𝑖𝑖𝑖𝑖 is an indicator variable for whether resume i sent to job posting j in period t generated a call back, 𝑅𝑅𝑅𝑅𝑅𝑅𝑅𝑅𝑅𝑅𝑅𝑅 𝑇𝑇𝑦𝑦𝑇𝑇𝑅𝑅𝑖𝑖𝑖𝑖𝑖𝑖 is an indicator variable for resume type, with the indicator for Type 0 (Anglo name with Canadian education and experience being the omitted reference category. 𝐸𝐸𝑅𝑅𝑇𝑇𝐸𝐸𝐸𝐸𝑦𝑦𝑅𝑅𝐸𝐸 𝑆𝑆𝑖𝑖𝑧𝑧𝑅𝑅𝑖𝑖𝑖𝑖𝑖𝑖 refers to the size of the employer (small:<50; medium: 51-499; large>=500). *** Difference relative to Anglo is significant at the 1 percent level; ** Difference relative to Anglo is significant at the 5 percent level; * Difference relative to Anglo is significant at the 10 percent level.
Predicted Probability of Call-back [Estimated Call-Back Rate Relative to Anglo Name]
All Employers
Large Employers
Medium Employers
Small Employers
Anglo Name Canadian Education
Canadian Experience
0.701 -
0.674 -
0.703 -
0.708 -
Asian Name Canadian Education
Canadian Experience
0.473*** [-0.326]
0.538* [-0.201]
0.426*** [-0.394]
0.446*** [-0.371]
Asian Name Some Foreign Qualification
0.326*** [-0.535]
0.441*** [-0.346]
0.277*** [-0.607]
0.242*** [-0.659]
N=1278

26
TABLE 3: PREDICTED PROBABILITY OF CALL-BACK FOR ASIAN- AND ANGLO-NAMED APPLICANTS, BY RESUME TYPE AND JOB SKILL LEVEL
NOTE: Only those cases in which the employer called back at least one applicant were included in this analysis. All jobs were ranked using the Nam-Powers-Boyd occupational status score. Status scores of 75 or higher are considered to be high skilled jobs, while those under 75 are considered to be low skilled jobs. Linear probability models were run separately for high and low skilled job postings using the following linear probability model: 𝑦𝑦𝑖𝑖𝑖𝑖𝑖𝑖 = 𝛿𝛿0 + 𝛿𝛿1𝑅𝑅𝑅𝑅𝑅𝑅𝑅𝑅𝑅𝑅𝑅𝑅 𝑇𝑇𝑦𝑦𝑇𝑇𝑅𝑅𝑖𝑖𝑖𝑖𝑖𝑖 + 𝑅𝑅𝑖𝑖𝑖𝑖𝑖𝑖 where 𝑦𝑦𝑖𝑖𝑖𝑖𝑖𝑖 is an indicator variable for whether resume i sent to job posing j in period t generated a call back, 𝑅𝑅𝑅𝑅𝑅𝑅𝑅𝑅𝑅𝑅𝑅𝑅 𝑇𝑇𝑦𝑦𝑇𝑇𝑅𝑅𝑖𝑖𝑖𝑖𝑖𝑖 is an indicator variable for resume type, with the indicator for Type 0 (Anglo name with Canadian education and experience being the omitted reference category. *** Difference relative to Anglo is significant at the 1 percent level; ** Difference relative to Anglo is significant at the 5 percent level; * Difference relative to Anglo is significant at the 10 percent level.
Predicted Probability of Call-back [Estimated Call-Back Rate Relative to Anglo Name]
All Jobs High Skilled Jobs Low Skilled Jobs
Anglo Name Canadian Education
Canadian Experience
0.688 -
0.719 -
0.678 -
Asian Name Canadian Education
Canadian Experience
0.468*** [-0.321]
0.483*** [-0.329]
0.470*** [-0.307]
Asian Name Some Foreign Qualification
0.321*** [-0.533]
0.298*** [-0.585]
0.369*** [-0.457]
N 1236 633 603
27
TABLE 4: PREDICTED PROBABILITY OF CALL-BACK FOR ASIAN- AND ANGLO-NAMED APPLICANTS BY RESUME TYPE, EMPLOYER SIZE AND JOB SKILL LEVEL
NOTE: Only those cases in which the employer called back at least one applicant were included in this analysis. All jobs were ranked using the Nam-Powers-Boyd occupational status score. Status scores of 75 or higher are considered to be high skilled jobs, while those under 75 are considered to be low skilled jobs. Linear probability models were run separately for high and low skilled job postings using the following linear probability model: 𝑦𝑦𝑖𝑖𝑖𝑖𝑖𝑖 = 𝛿𝛿0 + 𝛿𝛿1𝑅𝑅𝑅𝑅𝑅𝑅𝑅𝑅𝑅𝑅𝑅𝑅 𝑇𝑇𝑦𝑦𝑇𝑇𝑅𝑅𝑖𝑖𝑖𝑖𝑖𝑖 + 𝛿𝛿2𝐸𝐸𝑅𝑅𝑇𝑇𝐸𝐸𝐸𝐸𝑦𝑦𝑅𝑅𝐸𝐸 𝑆𝑆𝑖𝑖𝑧𝑧𝑅𝑅𝑖𝑖𝑖𝑖𝑖𝑖 +𝛿𝛿3�𝑅𝑅𝑅𝑅𝑅𝑅𝑅𝑅𝑅𝑅𝑅𝑅 𝑇𝑇𝑦𝑦𝑇𝑇𝑅𝑅𝑖𝑖𝑖𝑖𝑖𝑖 ∗ 𝐸𝐸𝑅𝑅𝑇𝑇𝐸𝐸𝐸𝐸𝑦𝑦𝑅𝑅𝐸𝐸 𝑆𝑆𝑖𝑖𝑧𝑧𝑅𝑅𝑖𝑖𝑖𝑖𝑖𝑖�+ 𝑅𝑅𝑖𝑖𝑖𝑖𝑖𝑖 where 𝑦𝑦𝑖𝑖𝑖𝑖𝑖𝑖 is an indicator variable for whether resume i sent to job posing j in period t generated a call back, 𝑅𝑅𝑅𝑅𝑅𝑅𝑅𝑅𝑅𝑅𝑅𝑅 𝑇𝑇𝑦𝑦𝑇𝑇𝑅𝑅𝑖𝑖𝑖𝑖𝑖𝑖 is an indicator variable for resume type, with the indicator for Type 0 (Anglo name with Canadian education and experience being the omitted reference category). 𝐸𝐸𝑅𝑅𝑇𝑇𝐸𝐸𝐸𝐸𝑦𝑦𝑅𝑅𝐸𝐸 𝑆𝑆𝑖𝑖𝑧𝑧𝑅𝑅𝑖𝑖𝑖𝑖𝑖𝑖 refers to the size of the employer. Small and Medium sized employers are grouped together in this analysis. *** Difference relative to Anglo is significant at the 1 percent level; ** Difference relative to Anglo is significant at the 5 percent level; * Difference relative to Anglo is significant at the 10 percent level.
Predicted Probability of Call-back [Estimated Call-Back Rate Relative to Anglo Name]
High Skilled Jobs Low Skilled Jobs
Large
Employers Small/Medium
Employers Large
Employers Small/Medium
Employers Anglo Name
Canadian Education Canadian Experience
0.713 -
0.715 -
0.629 -
0.694 -
Asian Name Canadian Education
Canadian Experience
0.605*** [-0.157]
0.416*** [-0.437]
0.477*** [-0.241]
0.464*** [-0.350]
Asian Name Some Foreign Qualification
0.402*** [-0.418]
0.232*** [-0.675]
0.505*** [-0.197]
0.294*** [-0.576]
N 633 603

28
TABLE 5: PREDICTED PROBABILITY OF CALL-BACK FOR ASIAN- AND ANGLO-NAMED APPLICANTS WITH AND WITHOUT AN ADDITIONAL CANADIAN MASTERS DEGREE – FOR HIGH SKILLED JOBS ONLY
NOTE: Only those cases in which the employer called back at least one applicant were included in this analysis. All jobs were ranked using the Nam-Powers-Boyd occupational status score. Status scores of 75 or higher are considered to be high skilled jobs, while those under 75 are considered to be low skilled jobs. Linear probability model was run only for high skilled job postings using the following linear probability model: 𝑦𝑦𝑖𝑖𝑖𝑖𝑖𝑖 = 𝛿𝛿0 +𝛿𝛿1𝑅𝑅𝑅𝑅𝑅𝑅𝑅𝑅𝑅𝑅𝑅𝑅 𝑇𝑇𝑦𝑦𝑇𝑇𝑅𝑅𝑖𝑖𝑖𝑖𝑖𝑖 + 𝛿𝛿2𝐶𝐶𝐶𝐶𝐶𝐶𝐶𝐶𝐶𝐶𝑖𝑖𝐶𝐶𝐶𝐶 𝑀𝑀𝐶𝐶𝑅𝑅𝑀𝑀𝑅𝑅𝐸𝐸𝑅𝑅 𝐷𝐷𝑅𝑅𝐷𝐷𝐸𝐸𝑅𝑅𝑅𝑅𝑖𝑖𝑖𝑖𝑖𝑖 + 𝛿𝛿3�𝑅𝑅𝑅𝑅𝑅𝑅𝑅𝑅𝑅𝑅𝑅𝑅 𝑇𝑇𝑦𝑦𝑇𝑇𝑅𝑅𝑖𝑖𝑖𝑖𝑖𝑖 ∗𝐶𝐶𝐶𝐶𝐶𝐶𝐶𝐶𝐶𝐶𝑖𝑖𝐶𝐶𝐶𝐶 𝑀𝑀𝐶𝐶𝑅𝑅𝑀𝑀𝑅𝑅𝐸𝐸𝑅𝑅 𝐷𝐷𝑅𝑅𝐷𝐷𝐸𝐸𝑅𝑅𝑅𝑅𝑖𝑖𝑖𝑖𝑖𝑖�+ 𝑅𝑅𝑖𝑖𝑖𝑖𝑖𝑖 where 𝑦𝑦𝑖𝑖𝑖𝑖𝑖𝑖 is an indicator variable for whether resume i sent to job posing j in period t generated a call back, 𝑅𝑅𝑅𝑅𝑅𝑅𝑅𝑅𝑅𝑅𝑅𝑅 𝑇𝑇𝑦𝑦𝑇𝑇𝑅𝑅𝑖𝑖𝑖𝑖𝑖𝑖 is an indicator variable for resume type, with the indicator for Type 0 (Anglo name with Canadian education and experience being the omitted reference category). 𝐶𝐶𝐶𝐶𝐶𝐶𝐶𝐶𝐶𝐶𝑖𝑖𝐶𝐶𝐶𝐶 𝑀𝑀𝐶𝐶𝑅𝑅𝑀𝑀𝑅𝑅𝐸𝐸𝑅𝑅 𝐷𝐷𝑅𝑅𝐷𝐷𝐸𝐸𝑅𝑅𝑅𝑅𝑖𝑖𝑖𝑖𝑖𝑖 refers to whether the resume included a Masters-level degree (e.g. MA, MSc, MBA, etc. from a Canadian educational institution). *** Difference relative to Anglo is significant at the 1 percent level; ** Difference relative to Anglo is significant at the 5 percent level; * Difference relative to Anglo is significant at the 10 percent level.
Predicted Probability of Call-back [Estimated Call-Back Rate Relative to Anglo Name]
No Canadian Masters Degree Canadian Masters Degree Anglo Name
Canadian Education Canadian Experience
0.699 -
0.810 -
Asian Name Canadian Education
Canadian Experience
0.459*** [-0.344]
0.563*** [-0.194]
Asian Name
Some Foreign Qualification 0.295*** [-0.577]
0.321*** [-0.54]
N 633
29
TABLE 6: PREDICTED PROBABILITY OF CALL-BACK FOR ASIAN- AND ANGLO-NAMED APPLICANTS BY RESUME TYPE, EMPLOYER SIZE AND JOB SKILL LEVEL, WITH AND WITHOUT AN ADDITIONAL CANADIAN MASTERS DEGREE – FOR HIGH SKILLED JOBS ONLY
NOTE: Only those cases in which the employer called back at least one applicant were included in this analysis. All jobs were ranked using the Nam-Powers-Boyd occupational status score. Status scores of 75 or higher are considered to be high skilled jobs, while those under 75 are considered to be low skilled jobs. Linear probability model was run only for high skilled job postings using the following linear probability model: 𝑦𝑦𝑖𝑖𝑖𝑖𝑖𝑖 = 𝛿𝛿0 + 𝛿𝛿1𝑅𝑅𝑅𝑅𝑅𝑅𝑅𝑅𝑅𝑅𝑅𝑅 𝑇𝑇𝑦𝑦𝑇𝑇𝑅𝑅𝑖𝑖𝑖𝑖𝑖𝑖 + 𝛿𝛿2𝐶𝐶𝐶𝐶𝐶𝐶𝐶𝐶𝐶𝐶𝑖𝑖𝐶𝐶𝐶𝐶 𝑀𝑀𝐶𝐶𝑅𝑅𝑀𝑀𝑅𝑅𝐸𝐸𝑅𝑅 𝐷𝐷𝑅𝑅𝐷𝐷𝐸𝐸𝑅𝑅𝑅𝑅𝑖𝑖𝑖𝑖𝑖𝑖 + 𝛿𝛿3𝐸𝐸𝑅𝑅𝑇𝑇𝐸𝐸𝐸𝐸𝑦𝑦𝑅𝑅𝐸𝐸 𝑅𝑅𝑖𝑖𝑧𝑧𝑅𝑅𝑖𝑖𝑖𝑖𝑖𝑖 +𝛿𝛿4�𝑅𝑅𝑅𝑅𝑅𝑅𝑅𝑅𝑅𝑅𝑅𝑅 𝑇𝑇𝑦𝑦𝑇𝑇𝑅𝑅𝑖𝑖𝑖𝑖𝑖𝑖 ∗ 𝐶𝐶𝐶𝐶𝐶𝐶𝐶𝐶𝐶𝐶𝑖𝑖𝐶𝐶𝐶𝐶 𝑀𝑀𝐶𝐶𝑅𝑅𝑀𝑀𝑅𝑅𝐸𝐸𝑅𝑅 𝐷𝐷𝑅𝑅𝐷𝐷𝐸𝐸𝑅𝑅𝑅𝑅𝑖𝑖𝑖𝑖𝑖𝑖�+ 𝛿𝛿5[𝑅𝑅𝑅𝑅𝑅𝑅𝑅𝑅𝑅𝑅𝑅𝑅 𝑇𝑇𝑦𝑦𝑇𝑇𝑅𝑅𝑖𝑖𝑖𝑖𝑖𝑖 ∗ 𝐸𝐸𝑅𝑅𝑇𝑇𝐸𝐸𝐸𝐸𝑦𝑦𝑅𝑅𝐸𝐸 𝑅𝑅𝑖𝑖𝑧𝑧𝑅𝑅𝑖𝑖𝑖𝑖𝑖𝑖] +𝛿𝛿6[𝐸𝐸𝑅𝑅𝑇𝑇𝐸𝐸𝐸𝐸𝑦𝑦𝑅𝑅𝐸𝐸 𝑅𝑅𝑖𝑖𝑧𝑧𝑅𝑅𝑖𝑖𝑖𝑖𝑖𝑖 ∗ 𝐶𝐶𝐶𝐶𝐶𝐶𝐶𝐶𝐶𝐶𝑖𝑖𝐶𝐶𝐶𝐶 𝑀𝑀𝐶𝐶𝑅𝑅𝑀𝑀𝑅𝑅𝐸𝐸𝑅𝑅 𝐷𝐷𝑅𝑅𝐷𝐷𝐸𝐸𝑅𝑅𝑅𝑅𝑖𝑖𝑖𝑖𝑖𝑖] + 𝛿𝛿7[𝑅𝑅𝑅𝑅𝑅𝑅𝑅𝑅𝑅𝑅𝑅𝑅 𝑇𝑇𝑦𝑦𝑇𝑇𝑅𝑅𝑖𝑖𝑖𝑖𝑖𝑖 ∗ 𝐸𝐸𝑅𝑅𝑇𝑇𝐸𝐸𝐸𝐸𝑦𝑦𝑅𝑅𝐸𝐸 𝑅𝑅𝑖𝑖𝑧𝑧𝑅𝑅𝑖𝑖𝑖𝑖𝑖𝑖 ∗𝐶𝐶𝐶𝐶𝐶𝐶𝐶𝐶𝐶𝐶𝑖𝑖𝐶𝐶𝐶𝐶 𝑀𝑀𝐶𝐶𝑅𝑅𝑀𝑀𝑅𝑅𝐸𝐸𝑅𝑅 𝐷𝐷𝑅𝑅𝐷𝐷𝐸𝐸𝑅𝑅𝑅𝑅𝑖𝑖𝑖𝑖𝑖𝑖] + 𝑅𝑅𝑖𝑖𝑖𝑖𝑖𝑖
where 𝑦𝑦𝑖𝑖𝑖𝑖𝑖𝑖 is an indicator variable for whether resume i sent to job posing j in period t generated a call back, 𝑅𝑅𝑅𝑅𝑅𝑅𝑅𝑅𝑅𝑅𝑅𝑅 𝑇𝑇𝑦𝑦𝑇𝑇𝑅𝑅𝑖𝑖𝑖𝑖𝑖𝑖 is an indicator variable for resume type, with the indicator for Type 0 (Anglo name with Canadian education and experience being the omitted reference category). 𝐸𝐸𝑅𝑅𝑇𝑇𝐸𝐸𝐸𝐸𝑦𝑦𝑅𝑅𝐸𝐸 𝑆𝑆𝑖𝑖𝑧𝑧𝑅𝑅𝑖𝑖𝑖𝑖𝑖𝑖 is the size of the employer. Small and Medium sized employers are grouped together in this analysis. 𝐶𝐶𝐶𝐶𝐶𝐶𝐶𝐶𝐶𝐶𝑖𝑖𝐶𝐶𝐶𝐶 𝑀𝑀𝐶𝐶𝑅𝑅𝑀𝑀𝑅𝑅𝐸𝐸𝑅𝑅 𝐷𝐷𝑅𝑅𝐷𝐷𝐸𝐸𝑅𝑅𝑅𝑅𝑖𝑖𝑖𝑖𝑖𝑖 refers to whether the resume included a Masters-level degree (e.g. MA, MSc, MBA, etc. from a Canadian educational institution). *** Difference relative to Anglo is significant at the 1 percent level; ** Difference relative to Anglo is significant at the 5 percent level; * Difference relative to Anglo is significant at the 10 percent level. Results are derived from three way interaction term between Canadian Masters degree, employer size and resume type. Estimated call-back rates are shown relative to Anglo-named applicants without a Masters degree.
Predicted Probability of Call-back [Estimated Call-Back Rate Relative to Anglo Name without Masters Degree]
Large Employers Small/Medium Employers
No Canadian
Masters Degree Canadian
Masters Degree No Canadian
Masters Degree Canadian Masters
Degree Anglo Name
Canadian Education Canadian Experience
0.693 -
0.816 -
0.695 -
0.817 -
Asian Name Canadian Education
Canadian Experience
0.578 [-0.165]
0.714 [0.031]
0.393 [-0.434]
0.493 [-0.290]
Asian Name
Some Foreign Qualification
0.382 [-0.102]
0.623 [-0.449]
0.235 [-0.661]
0.223 [-0.680]
N 633