research article heating quality and stability of...
TRANSCRIPT
Research ArticleHeating Quality and Stability of Aqueous EnzymaticExtraction of Fatty Acid-Balanced Oil in Comparisonwith Other Blended Oils
Yang Li,1 Dan Li,1 Baokun Qi,1 Sami Rokayya,1,2 Wenjun Ma,1 Jing Liang,1
Xiaonan Sui,1 Yan Zhang,1 and Lianzhou Jiang1
1 Department of Food Science, Northeast Agricultural University, Harbin, Heilongjiang 150030, China2Department of Home Economics, Faculty of Education Quality, Mansoura University, Mansoura, Dakahlia 35516, Egypt
Correspondence should be addressed to Yang Li; [email protected] and Lianzhou Jiang; [email protected]
Received 15 February 2014; Revised 5 May 2014; Accepted 13 May 2014; Published 28 May 2014
Academic Editor: Stavros Lalas
Copyright © 2014 Yang Li et al. This is an open access article distributed under the Creative Commons Attribution License, whichpermits unrestricted use, distribution, and reproduction in any medium, provided the original work is properly cited.
The heating performance of enzyme-assisted aqueous processing-extracted blended oil (EAEPO), hexane-extracted blended oil(HEBO), and three kinds of blended oils was investigated by varying the heating times. Oil degradation was monitored by analysisof the acid value (AV), peroxide value (PV), p-anisidine value (p-AV), color, and trans-fatty acid composition. The fatty acidratios of EAEPO, HEBO, and the three kinds of blended oils were very similar (0.27 : 1.03 : 0.96, 0.27 : 1.08 : 1.16, 0.27 : 0.65 : 0.8,0.27 : 0.6 : 0.84, and 0.27 : 0.61 : 0.79, resp.). The AV and color increased in proportion to the heating time for all the oils. There wasa rapid increase in the PV and p-AV of EAEPO and HEBO after heating for only 1 h, whereas the other three blended oils showed arapid increase after heating for 2 h or 6 h. Despite the highest trans-fatty acid content found for HEBO, this content was relativelylow and remained low up to a heating time of 8 h. It was found that after heating, a fatty acid ratio relatively close to its idealvalue (0.27 : 0.48 : 0.49) was maintained by EAEPO, which indicates that EAEPO is tolerant to heat treatment and is suitable formaintaining a healthy diet.
1. Introduction
In recent times, the use of oils with a balanced fatty acidratio has emerged as one of the most important concerns formaintaining a healthy diet. The blending of several oils withdifferent characteristics is one of the simplest procedures forcontrolling the characteristics of edible oil [1]. The UnitedStates Recommended Dietary Allowances (RDA) and theWorld Health Organization (WHO) recommend the fattyacid ratio of 1 (SFA, saturated fatty acid(s)) : 1 (MUFA,monounsaturated fatty acid(s)) : 1 (PUFA, polyunsaturatedfatty acid(s)) as an ideal ratio for health [2]. In addition, areport from the Chinese Nutrition Society (CNS) regardingdietary reference intakes suggested a fatty acid ratio of0.27 : 1 : 1 (SFA :MUFA : PUFA) after subtracting the dailyconsumption of fatty acids derived from animal fat [3]. Theuse of hexane-extracted blended oil (HEBO) is the main
method currently used to achieve this aim. However, thehexane derived from petroleum distillates has environmen-tal and safety issues, and thus, it is necessary to developalternative methods of hexane extraction. Furthermore, thegoal of achieving an acid-balanced oil has been realizedby extracting oil from a mixture of soybean, rape seed,purple perilla, fructus cannabis, and scabish using an aqueousenzymatic method (EAEP). The oil extraction yield wasmaximized by applying the simplex-centroid mixture designmethod. This balanced fatty acid oil may be one of the majornutritional sources in the diet for maintaining human healthby providing the body with unsaturated fatty acids, beingparticularly rich in omega-3, omega-6, and other nutritionalcomponents. However, heat treatment of oils is one of themost important methods for preparing food for humanconsumption worldwide [4] but may affect the shelf lifeand quality of the oil directly. Heating may simultaneously
Hindawi Publishing CorporationJournal of ChemistryVolume 2014, Article ID 530787, 8 pageshttp://dx.doi.org/10.1155/2014/530787
2 Journal of Chemistry
induce degradation and oxidation of oil components withthe formation of products deleterious to human health.In addition, many reports concluded that the stability ofindividual vegetable oils against oxidation is unique, beingdependent on the fatty acid composition and on the degreeof unsaturation in particular [5, 6].
The quality characteristics of many oils, including DegletNour, Allig, olive, sunflower, and hydrogenated soybean oil,have been investigated [7, 8]. Microwave heating of soybeanoil induces severe quality and composition losses, primarilywith more than 3min of microwave heating [9]. Thus, thereactions that occur during heating of oil are an importantconcern. During heating, lipids may undergo chemical alter-ations due to hydrolytic and oxidative rancidity [10]. Theinfluence of heating on the antioxidant activity of certainspice essential oils has been discussed in order to controllipid oxidation during food processing [11]. The influenceof these reactions is derived from a number of productsgenerated during heating, including volatile compounds,hydrolysis products, cyclic compounds, trans configurationcompounds, polymers, and acrylamide. After the first twofrying cycles, the free fatty acid content, peroxide value, andtotal polar materials increase, whereas the radical scavengingactivity decreases [5].
In this paper, the oxidative stability of oils extracted usingvarious techniques, including solvent and aqueous enzymaticmethods, is determined. The major reaction conditions andcorresponding physical and chemical alterations during heat-ing are also studied by comparative analysis of three blendedoils with fatty acid compositions similar to that of EAEPOand HEBO.
2. Materials and Methods
2.1. Materials. Dehulled and full-fat soybean flakes wereobtained from a company in Shijiazhuang, and rape seed,purple perilla, fructus cannabis, and scabish were obtainedfrom Anhui, Jiangsu, Guangxi, and Muyang, respectively.Three different types of oils, namely, Golden Arowana blendoil (GABO), Fook Lam Moon Grain blend oil (FGBO), andFook Lam Moon balanced blend oil (FBBO), were obtainedfrom a local market (RT-Mart, Harbin). Alcalase 2.4 L wassourced fromNovo-Nordisk A/S (Bagsvaerd, Denmark).Thefatty acidmethyl ester (FAME) standards were obtained fromSigma-Aldrich Chemical Co. (St. Louis, MO, USA).
2.2. Methods
2.2.1. Extrusion Process. Water was sprayed onto the crackedsoybean flakes to achieve the desired moisture content of14.5%while tumbling the seeds in amixer (TMV-100, China).The moisture content of 14.5% was chosen on the basisof previous work on oil extraction using EAEP [12]. Theextruder (20mm screw die diameter) used in this workwas manufactured by Engineering College, Northeast Agri-cultural University, Harbin, China. The rotational speed ofthe extruder was 105 rpm and the barrel temperature was90∘C. The extruded soybeans were immediately used for the
EAEP procedure or stored in polyethylene bags at 4∘C in arefrigerator prior to use.
2.2.2. Enzyme-Assisted Aqueous Extraction Process (EAEP).Prior to the extraction procedure, the dehulled forms ofrape seed (31.5%), purple perilla (11.8%), fructus cannabis(33.3%), and scabish (21.2%) were individually cracked andthen mixed together with the extruded soybean (2.3%). Thebeaker filled with the seed mixtures and additional water(1 : 6 w/w) was subjected to ultrasonic treatment for 50minat 55∘C at a power of 500W and then incubated at 55∘C ina water bath; the pH of the slurry was adjusted to 9 by theaddition of 2N NaOH [13]. The enzyme dosage of Alcalase2.4 L was 1.85% (v/w, based on the dry weight of the samples).A continuous stirring device was used to disperse themixtureduring the enzymatic hydrolysis process. The reactions werestably maintained at the temperature and pH stated above for3 h. At the end of the EAEP, the slurry was centrifuged in a50mL centrifuge tube at multiples of the force of gravity andexpressed at 2,372 g (TGL-16G, China) for 30min at 20∘C.Four distinct layers (oil, cream, skim, and insoluble) wereobtained after the centrifugation. The upper oil layer wascarefully collected using a Pasteur pipette, and the remainingoil adhering to the cream surface was washed twice withhexane. The hexane was removed by evaporation in a fumehood.
2.2.3. Hexane Extraction (HE) Process. The blending flakes(100 g) (extruded soybean 2.3%, dehulled rape seed 31.5%,dehulled purple perilla 11.8%, dehulled fructus cannabis33.3%, and dehulled scabish 21.2%) were placed in a Soxhletextractor equipped with a 0.5 L round-bottom flask and awater condenser. The extraction was carried out on a waterbath for 6 h using 3 L of 𝑛-hexane. After the extraction,hexane was removed under reduced pressure using a vacuumrotary evaporator (R205, China) at 45∘C. The recovered oilwas stored under refrigeration (4∘C) prior to use.
2.2.4. Heat Treatment. To simulate conventional times usedin cooking, the heating period was varied as 1, 2, 4, 6, and8 h. For each oil type and time, three subsamples of 80mLwere, respectively, placed in a domestic electronic heaterplate with an intelligent magnetic stirrer (ZNCL, China)and the samples were heated at 200∘C. Unheated samples ofeach oil type were used as controls (corresponding to 0 h).After heating, samples were stored in a brown bottle in arefrigerator (4∘C) prior to analysis.
2.3. Oil Quality Analysis
2.3.1. Determination of Fatty Acid and Trans-Fatty AcidCompositions. The trans-fatty acid composition of the oiltypes was analyzed using a gas chromatograph connected toa mass spectrometer (GC-MS). The fatty acid methyl esterswere prepared in two steps: the oils were first saponifiedwith 0.5M KOH and subsequently methylated with 40%BF3in methanol. The separation was performed using an
HP-88 capillary column (100mm × 0.25mm i.d., 0.2 𝜇m
Journal of Chemistry 3
film thickness; Agilent Technologies, USA) connected to aGC/MS (6890/5973, USA). The operating conditions were asfollows: carrier gas pressure, 100 kPa; carrier gas, helium; splitratio, 1 : 30; injection temperature, 250∘C; scanning scope, 50–550 amu; and ionization voltage, 70 eV.The oven temperaturesettings were programmed as follows: the temperature washeld at 80∘C for 5min, increased to 150∘C at 10∘C/min andheld at 150∘C for 2min, then increased continuously to 230∘Cat a rate of 5∘C/min, and held for 10min. The individual fattyacids were identified by comparing their retention times withstandards [2].
2.3.2. Determination of Acid Value, p-Anisidine Value, andColor. The acid value was determined according to a litera-turemethod (AOAC,Cd-63), where 125mLof the neutralizedsolvent mixture and 2mL phenolphthalein indicator solutionwere placed into an Erlenmeyer flask and neutralized withalkali to a faint but permanent pink color. The oil sample wasthen weighed (20±0.05 g) and added to the solution, and thesample was shaken vigorously while titrating with standardalkali to the first permanent pink color of the same intensityas that of the neutralized solvent before the latter was addedto the sample.
The 𝑝-anisidine value of the oxidized oil from frieddough after storage was determined according to the AOCSRecommended Practice Ti la-64 (AOCS, 1990).
An accurately measured amount of oil (100mg) wasdissolved in 25mL, and the absorbance was measured at350 nm using a UV-vis spectrophotometer (1600PC, China).This solution (2.5mL) was combined with 0.5mL of 0.5%(w/v) 𝑝-anisidine in acetic acid, and the absorbance was readat 350 nm after 10min.
The color was determined using a Lovibond Tintometer(WSL-2, China) in the transmittance mode and expressed asred (R) and yellow (Y) values.
2.3.3. Determination of Peroxide Value. An accurately mea-sured amount of oil (300mg) was dissolved in 9.9mL ofchloroform/methanol (7 : 3, v/v) afterwhich 50.0 𝜇Lof 10mMxylenol orange and 50.0𝜇L of iron(III) chloride solutionwereadded [14]. The mixture solution was incubated at roomtemperature for 5min and then centrifuged at 1000 g for5min at 5∘C. The supernatant was used for measurement ofthe absorbance at 560 nm using a UV-vis spectrophotometer(model 1600 PC, China). The iron(III) chloride solution wasused to construct a standard curve.
2.3.4. Statistical Analysis. Data from replicate analyses ofall samples were subjected to a variance analysis (ANOVA)test using SPSS 18.0 for Windows. The significant differencebetween the means was determined by Duncan’s New Multi-ple Range Test (𝑃 < 0.05).
3. Results and Discussion
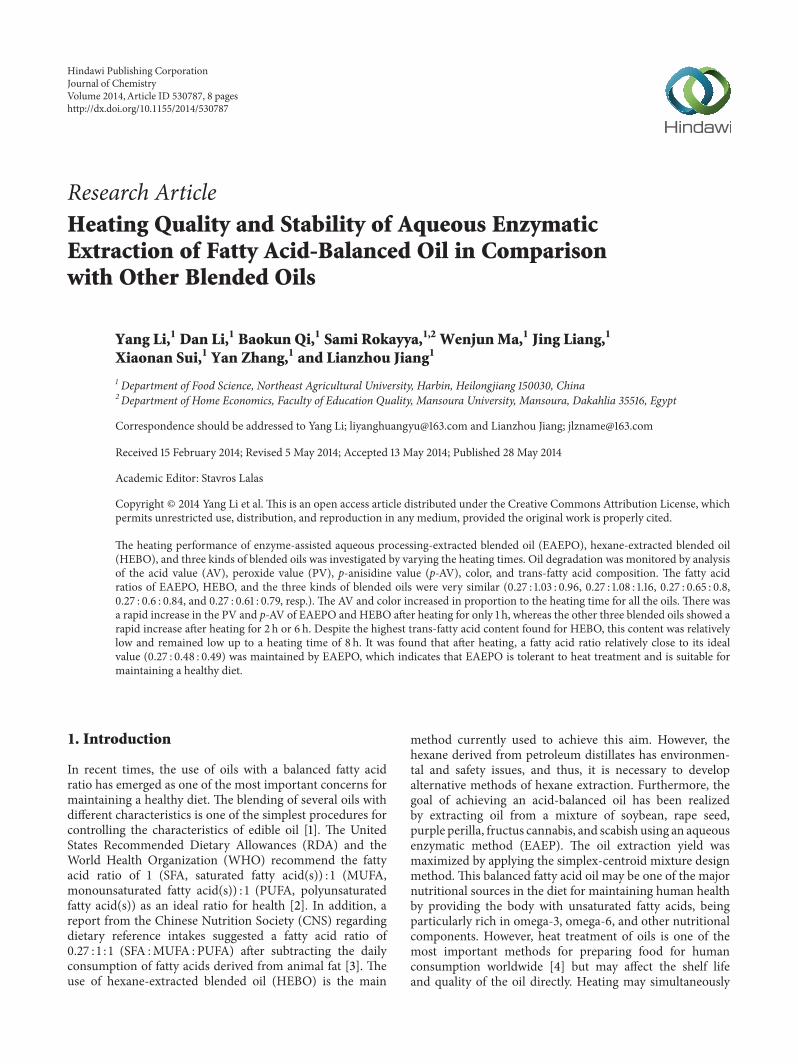
3.1. Changes in Acid Value. Theacid value is considered in thefood industry as an indicator of the quality of the oil and thedegree of its degradation during heating. An increase in the
0 2 4 6 8
0.05
0.10
0.15
0.20
0.25
0.30
0.35
0.40
0.45
0.50
Acid
val
ue
Time (h)
FGBOFBBOGABO
EAEPOHEBO
Figure 1: Changes in acid value.
acid value leads to the development of unpleasant tastes andodors in oils. Although the initial acid values of the oils variedfrom 0.08 (EAEPO) to 0.16 (HEBO) as shown in Figure 1,at the end of the heating period (8 h), the overall change inthe acid value was found to be lowest in the case of EAEPO(0.35), followed by FBBO, FGBO, and GABO. The overallchange in the acid value was highest for HEBO (0.48). Thisvariation may be due to differences in the extraction methodused. Enzymatic extraction offers the advantages of requiringa lower temperature and not requiring explosive solvents orgenerating harmful waste relative to solvent extraction.Theseresults are in agreement with the values previously reportedfor corn oil [15].
The results also indicated a significant increase in the acidvalue of the various oil types as heating progressed, whichmay be attributed to the hydrolysis of TAG and/or cleavageand oxidation of fatty acid double bonds [16]. In addition,the low acid value of the three types of blended oils relativeto HEBO might be due to the refining of the former oils. Itis recognized that the free fatty acids (FFAs) are removed bysaponification; thus, smaller amounts of FFAs are expectedfor refined oils [17]. However, the lowest acid content of theEAEPO sample might be related to its ideal fatty acid ratio. Ina similar study, the stability of soybean and canola oils, withmodified fatty acid composition, toward fryingwas evaluated.The amount of free fatty acids generated during frying wassignificantly less than that of the corresponding unmodifiedoils after 5 h of frying [18].
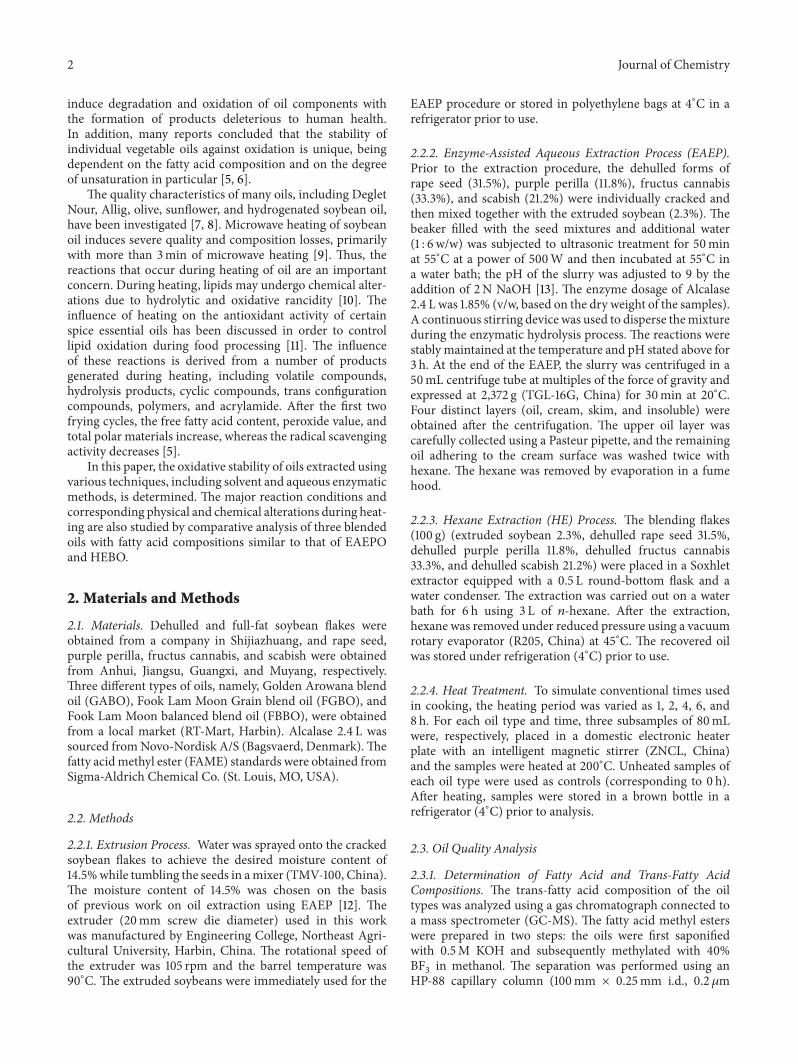
3.2. Changes in Peroxide Value (PV). Figure 2 shows thechanges in the PV of the oils with heating from 0 h to8 h. Prior to the heating process, EAEPO presented thelowest peroxide value (3.18mEqO
2/kg), followed by HEBO
(3.51mEqO2/kg), FGBO (3.65mEqO
2/kg), and FBBO
(3.77mEqO2/kg). The highest PV was detected for GABO
(3.88mEqO2/kg). The PV of all the samples was within the
acceptable limit of below 10mEqO2/kg for vegetable oils
[18]. In addition, the lowest PV of EAEPO is plausibly due
4 Journal of Chemistry
0 2 4 6 8
Time (h)
FGBOFBBOGABO
EAEPOHEBO
2.0
2.5
3.0
3.5
4.0
4.5
Pero
xide
val
ue
Figure 2: Changes in peroxide value.
to tocopherol release during the EAEP, which is related tohydrolysis by the enzymes [19].
The peroxide levels of all of the oil types remained similarto the original values during heating with slight variationsfrom the initial amounts (2–4mEqO
2/kg) due to the volatile
nature of peroxides [17]. However, the concentration ofperoxides in the various oil types differed significantly.
The PV of the EAEPO and HEBO samples increasedduring the first 1 h, followed by a decline to the initiallevels (3.63mEqO
2/kg and 2.76mEqO
2/kg, resp.). In the
case of FGBO and FBBO, the PV continued to increaseup to 6 h with an eventual return to the initial levels ofca. 4.02mEqO
2/kg and 3.96mEqO
2/kg, respectively. The
peroxide value of GABO increased to 3.81mEqO2/kg after
2 h. The rapid increase in the PV of the EAEPO and HEBOsamples indicates that these oils were unstable to oxidativedegradation.The EAEPO andHEBO samples had the highestpercentage of polyunsaturated fatty acids and demonstratedless stability to oxidation, which is in agreement with thedata previously reported for olive oil [17]. The PV decreasedafter reaching a maximum for all of the oil types, which isattributed to the fact that primary oxidation reactions causean increase in the concentration of peroxides to a maximumvalue, beyond which the peroxide concentration decreasesdue to thermal decomposition thereof into secondary prod-ucts [20].
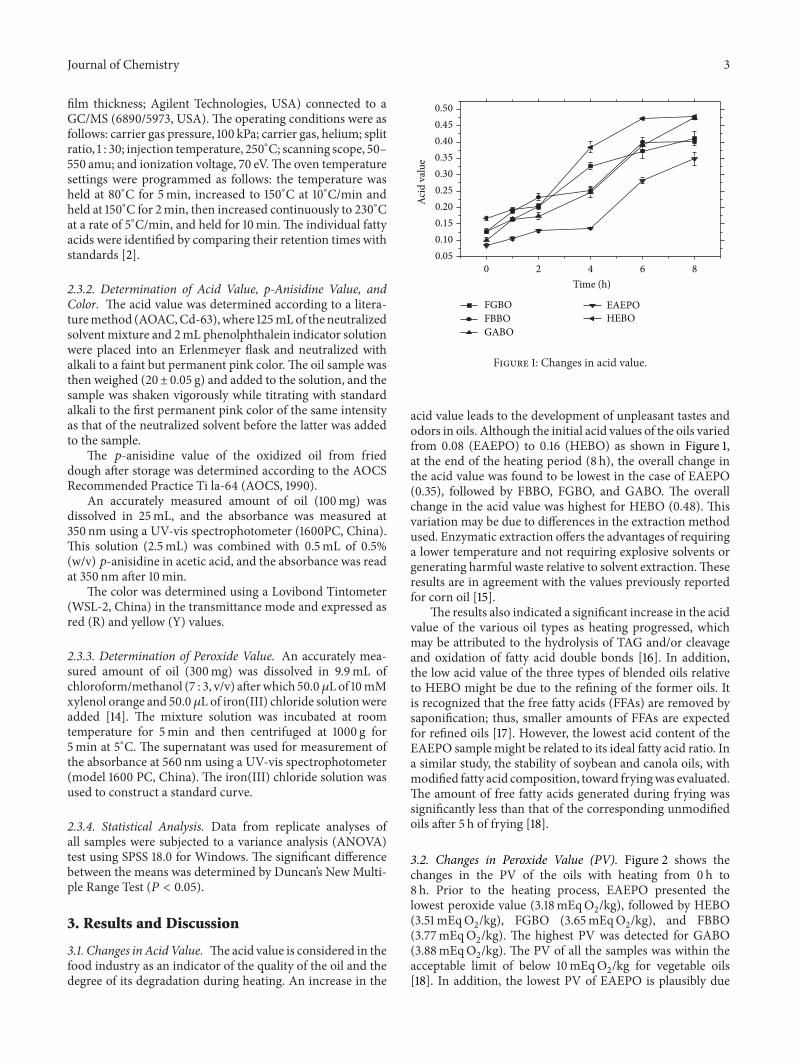
3.3. Changes in p-Anisidine Value (p-AV). The 𝑝-AV is ameasure of the content of aldehydes (principally 2-alkenalsand 2, 4-alkadienals), which are relatively stable, and is thusa useful tool for monitoring the oxidative state of oil duringheating.Therefore, for an accurate estimation of the oxidationstatus of the oils, both the PV and𝑝-AV should be interpretedsimultaneously.
Figure 3 shows the changes in the 𝑝-AV of the oilswith heating from 0 h to 8 h. The 𝑝-AV of all oil typesincreased with time. Furthermore, the 𝑝-AV of all the oiltypes exhibited significant changes at the same heating time.
0 2 4 6 8
Time (h)
FGBOFBBOGABO
EAEPOHEBO
0
10
20
30
40
50
60
70
80
p-A
nisid
ine v
alue
Figure 3: Changes in 𝑝-anisidine value.
This may be attributed to further decomposition of the less-stable primary oxidative products (hydroperoxides) to formaldehydic compounds, as previously reported [17, 21].
It was also noted that the trend in the variation ofthe 𝑝-AV with heating for FGBO was similar to that forFBBO with a maximum rate of change at 6 h of treatmentcompared to GABO for which the maximum rate of changewas achieved at 2 h. However, in the case of EAEPO andHEBO, rapid hydroperoxide formation was detected after1 h of heat treatment, probably due to the high amounts ofPUFA in the two oils. The slightly higher 𝑝-AV of HEBOmay be due to the ability of the solvent to extract other lipidassociated substances such as sterols, fat soluble compounds,and hydrocarbons. This increased 𝑝-AV level was consistentwith the PV data presented in Figure 2, which confirms thatEAEPO and HEBO present minor resistance to oxidationunder heating conditions relative to the other three blendedoils.
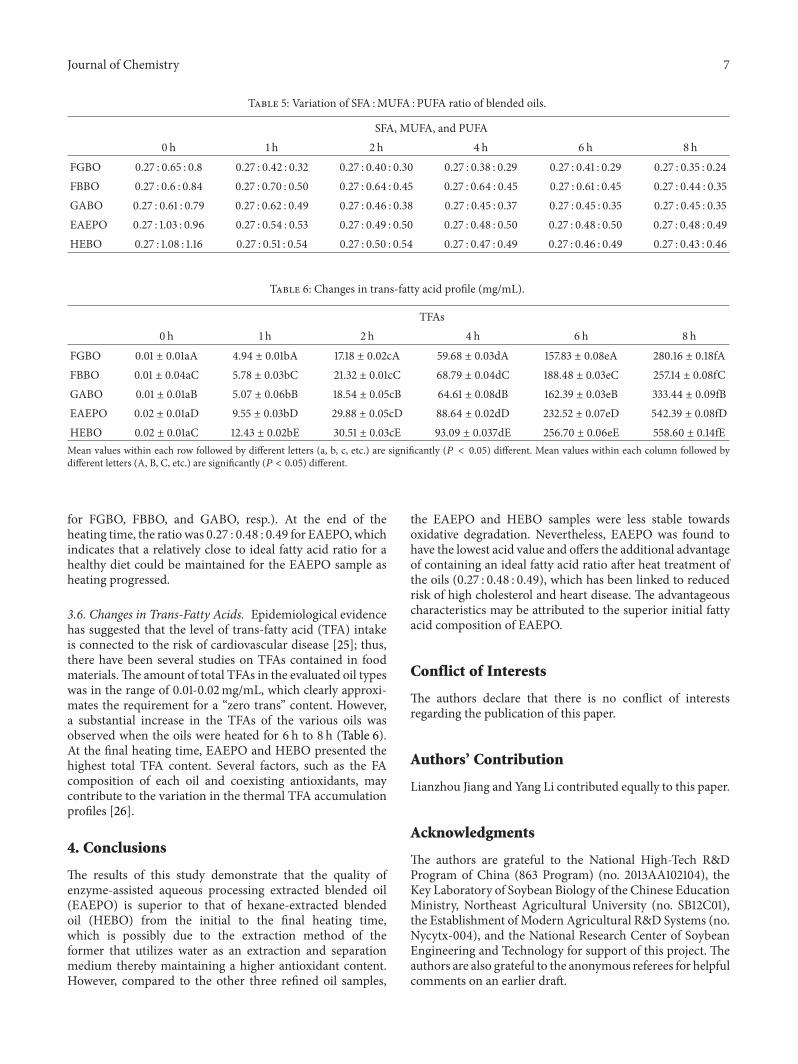
3.4. Changes in Color. Color is an important food evaluationindicator for rapid monitoring of the quality of heated oil.For the unheated oils, HEBO had the highest R parameterof 34.97 compared to the other blended oils due to theextraction of pigments by the organic solvent. The yellowcolor of EAEPO was more prominent than that of theother blended oils (55.01), indicative of the presence ofmore yellow pigments, such as carotenoids, in the EAEPOsample (Tables 1 and 2). However, the lighter color ofthe other three oils is related to decolorization during oilrefining.
Heat treatment induced a considerable increase in the Rand Y parameters. In general, the reddish and yellowishcoloration intensifies when the pigments developed duringoxidation and thermal decomposition of fatty acids diffuseinto the oil during heating. In addition, these changes mayalso be due to traces of carotenoids [22]. The differencein the R parameter of the nontreated and treated oils wasslightly higher (34.97 versus 39.72) in the case of HEBO,
Journal of Chemistry 5
Table 1: Variation of yellow color of blended oils.
Y0 h 1 h 2 h 4 h 6 h 8 h
FGBO 15.08 ± 0.14aB 15.53 ± 0.09bB 15.94 ± 0.05cB 16.09 ± 0.04cB 16.37 ± 0.03215dB 16.65 ± 0.08eBFBBO 19.70 ± 0.02aC 20.17 ± 0.03bC 20.25 ± 0.03bC 20.39 ± 0.08cC 20.60 ± 0.02082dC 20.87 ± 0.04eCGABO 29.29 ± 0.05aD 29.49 ± 0.06bD 29.87 ± 0.08cD 30.09 ± 0.01dD 30.26 ± 0.06110dD 30.57 ± 0.09eDEAEPO 55.01 ± 0.09aE 55.32 ± 0.03bE 55.37 ± 0.07bE 55.80 ± 0.09cE 55.85 ± 0.07000cdE 56.05 ± 0.07eEHEBO 2.13 ± 0.09aA 2.74 ± 0.03bA 3.07 ± 0.03cA 3.07 ± 0.06dA 3.52 ± 0.02517dA 3.78 ± 0.02eAMean values within each row followed by different letters (a, b, c, etc.) are significantly (𝑃 < 0.05) different. Mean values within each column followed bydifferent letters (A, B, C, etc.) are significantly (𝑃 < 0.05) different.
Table 2: Variation of red color of blended oils.
R0 h 1 h 2 h 4 h 6 h 8 h
FGBO 1.21 ± 0.02aA 1.57 ± 0.11bA 2.00 ± 0.06cA 2.56 ± 0.06dB 2.79 ± 0.04eC 3.50 ± 0.09fBFBBO 1.49 ± 0.02aC 1.87 ± 0.04bC 2.00 ± 0.05bcA 2.07 ± 0.11cA 2.63 ± 0.07cB 2.76 ± 0.04dAGABO 1.37 ± 0.04aB 1.77 ± 0.04bB 1.97 ± 0.04cA 2.04 ± 0.04cdA 2.15 ± 0.04dA 4.11 ± 0.109eCEAEPO 2.57 ± 0.05aD 3.60 ± 0.03bD 3.64 ± 0.02bB 4.55 ± 0.05cC 4.67 ± 0.02cD 5.86 ± 0.04dDHEBO 34.97 ± 0.03aE 38.03 ± 0.09bE 38.27 ± 0.07bC 38.90 ± 0.11cD 39.37 ± 0.05dE 39.72 ± 0.10eEMean values within each row followed by different letters (a, b, c, etc.) are significantly (𝑃 < 0.05) different. Mean values within each column followed bydifferent letters (A, B, C, etc.) are significantly (𝑃 < 0.05) different.
12 14 16 18 20 22 24 26
1
2
3
4
5
6
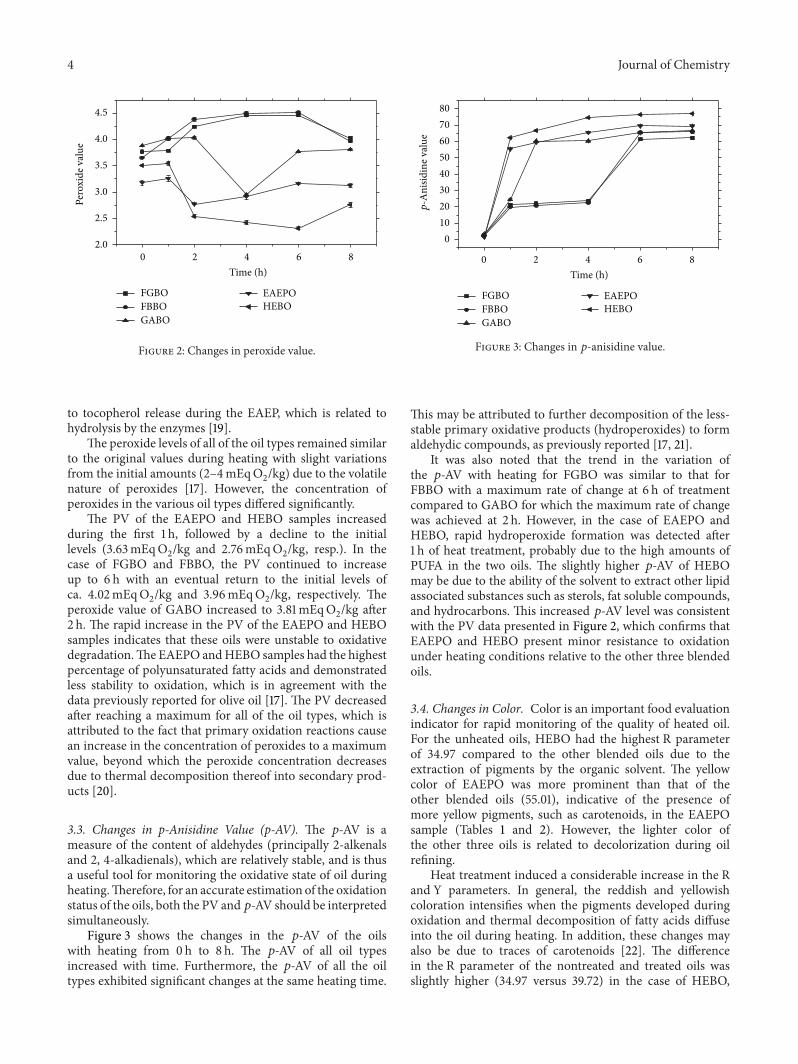
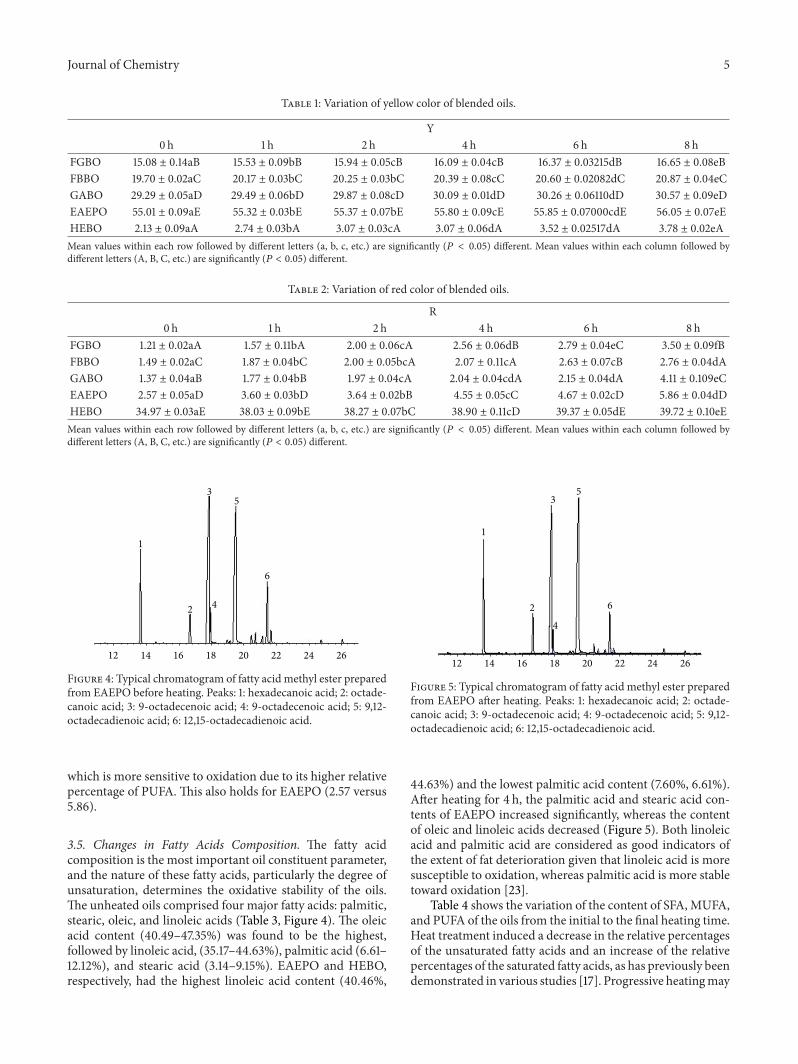
Figure 4: Typical chromatogram of fatty acid methyl ester preparedfrom EAEPO before heating. Peaks: 1: hexadecanoic acid; 2: octade-canoic acid; 3: 9-octadecenoic acid; 4: 9-octadecenoic acid; 5: 9,12-octadecadienoic acid; 6: 12,15-octadecadienoic acid.
which is more sensitive to oxidation due to its higher relativepercentage of PUFA. This also holds for EAEPO (2.57 versus5.86).
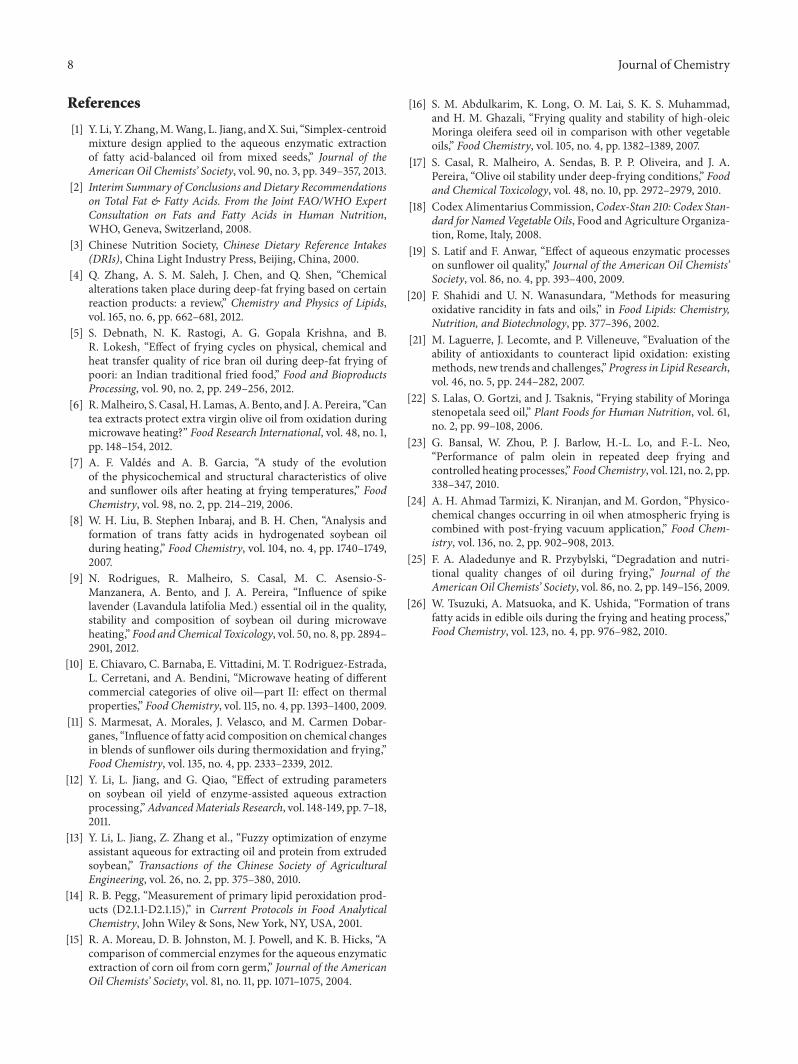
3.5. Changes in Fatty Acids Composition. The fatty acidcomposition is the most important oil constituent parameter,and the nature of these fatty acids, particularly the degree ofunsaturation, determines the oxidative stability of the oils.The unheated oils comprised four major fatty acids: palmitic,stearic, oleic, and linoleic acids (Table 3, Figure 4). The oleicacid content (40.49–47.35%) was found to be the highest,followed by linoleic acid, (35.17–44.63%), palmitic acid (6.61–12.12%), and stearic acid (3.14–9.15%). EAEPO and HEBO,respectively, had the highest linoleic acid content (40.46%,
12 14 16 18 20 22 24 26
1
2
3
4
5
6
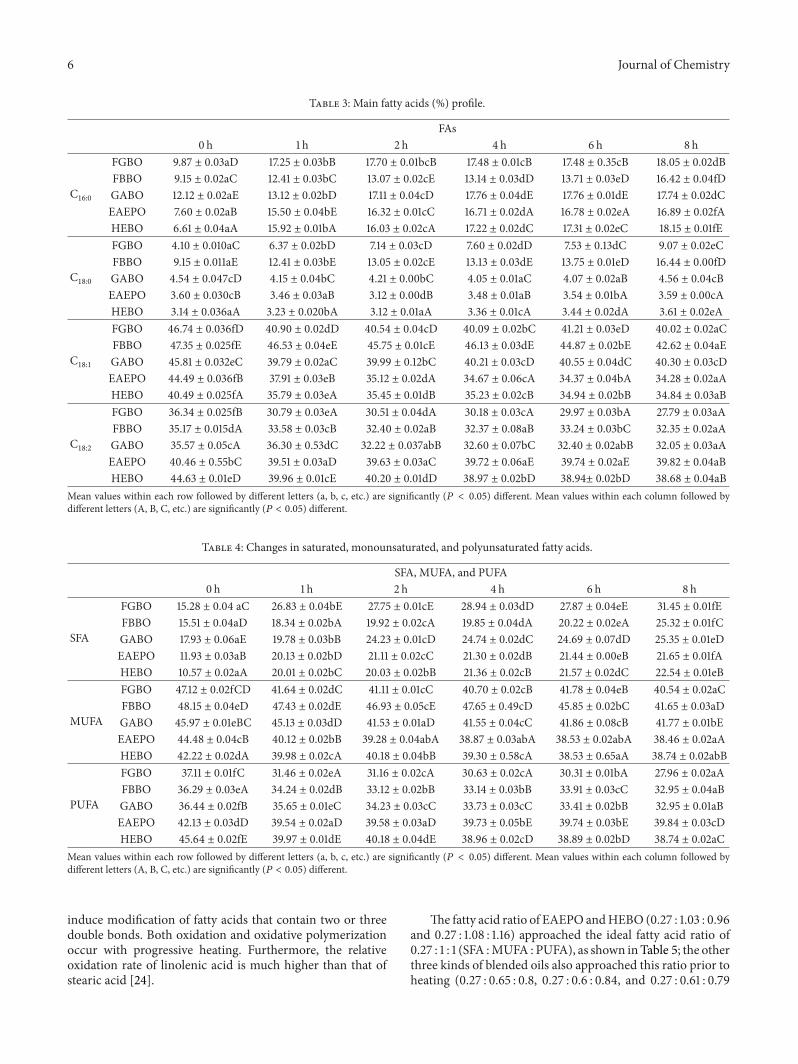
Figure 5: Typical chromatogram of fatty acid methyl ester preparedfrom EAEPO after heating. Peaks: 1: hexadecanoic acid; 2: octade-canoic acid; 3: 9-octadecenoic acid; 4: 9-octadecenoic acid; 5: 9,12-octadecadienoic acid; 6: 12,15-octadecadienoic acid.
44.63%) and the lowest palmitic acid content (7.60%, 6.61%).After heating for 4 h, the palmitic acid and stearic acid con-tents of EAEPO increased significantly, whereas the contentof oleic and linoleic acids decreased (Figure 5). Both linoleicacid and palmitic acid are considered as good indicators ofthe extent of fat deterioration given that linoleic acid is moresusceptible to oxidation, whereas palmitic acid is more stabletoward oxidation [23].
Table 4 shows the variation of the content of SFA,MUFA,and PUFA of the oils from the initial to the final heating time.Heat treatment induced a decrease in the relative percentagesof the unsaturated fatty acids and an increase of the relativepercentages of the saturated fatty acids, as has previously beendemonstrated in various studies [17]. Progressive heatingmay
6 Journal of Chemistry
Table 3: Main fatty acids (%) profile.
FAs0 h 1 h 2 h 4 h 6 h 8 h
C16:0
FGBO 9.87 ± 0.03aD 17.25 ± 0.03bB 17.70 ± 0.01bcB 17.48 ± 0.01cB 17.48 ± 0.35cB 18.05 ± 0.02dBFBBO 9.15 ± 0.02aC 12.41 ± 0.03bC 13.07 ± 0.02cE 13.14 ± 0.03dD 13.71 ± 0.03eD 16.42 ± 0.04fDGABO 12.12 ± 0.02aE 13.12 ± 0.02bD 17.11 ± 0.04cD 17.76 ± 0.04dE 17.76 ± 0.01dE 17.74 ± 0.02dCEAEPO 7.60 ± 0.02aB 15.50 ± 0.04bE 16.32 ± 0.01cC 16.71 ± 0.02dA 16.78 ± 0.02eA 16.89 ± 0.02fAHEBO 6.61 ± 0.04aA 15.92 ± 0.01bA 16.03 ± 0.02cA 17.22 ± 0.02dC 17.31 ± 0.02eC 18.15 ± 0.01fE
C18:0
FGBO 4.10 ± 0.010aC 6.37 ± 0.02bD 7.14 ± 0.03cD 7.60 ± 0.02dD 7.53 ± 0.13dC 9.07 ± 0.02eCFBBO 9.15 ± 0.011aE 12.41 ± 0.03bE 13.05 ± 0.02cE 13.13 ± 0.03dE 13.75 ± 0.01eD 16.44 ± 0.00fDGABO 4.54 ± 0.047cD 4.15 ± 0.04bC 4.21 ± 0.00bC 4.05 ± 0.01aC 4.07 ± 0.02aB 4.56 ± 0.04cBEAEPO 3.60 ± 0.030cB 3.46 ± 0.03aB 3.12 ± 0.00dB 3.48 ± 0.01aB 3.54 ± 0.01bA 3.59 ± 0.00cAHEBO 3.14 ± 0.036aA 3.23 ± 0.020bA 3.12 ± 0.01aA 3.36 ± 0.01cA 3.44 ± 0.02dA 3.61 ± 0.02eA
C18:1
FGBO 46.74 ± 0.036fD 40.90 ± 0.02dD 40.54 ± 0.04cD 40.09 ± 0.02bC 41.21 ± 0.03eD 40.02 ± 0.02aCFBBO 47.35 ± 0.025fE 46.53 ± 0.04eE 45.75 ± 0.01cE 46.13 ± 0.03dE 44.87 ± 0.02bE 42.62 ± 0.04aEGABO 45.81 ± 0.032eC 39.79 ± 0.02aC 39.99 ± 0.12bC 40.21 ± 0.03cD 40.55 ± 0.04dC 40.30 ± 0.03cDEAEPO 44.49 ± 0.036fB 37.91 ± 0.03eB 35.12 ± 0.02dA 34.67 ± 0.06cA 34.37 ± 0.04bA 34.28 ± 0.02aAHEBO 40.49 ± 0.025fA 35.79 ± 0.03eA 35.45 ± 0.01dB 35.23 ± 0.02cB 34.94 ± 0.02bB 34.84 ± 0.03aB
C18:2
FGBO 36.34 ± 0.025fB 30.79 ± 0.03eA 30.51 ± 0.04dA 30.18 ± 0.03cA 29.97 ± 0.03bA 27.79 ± 0.03aAFBBO 35.17 ± 0.015dA 33.58 ± 0.03cB 32.40 ± 0.02aB 32.37 ± 0.08aB 33.24 ± 0.03bC 32.35 ± 0.02aAGABO 35.57 ± 0.05cA 36.30 ± 0.53dC 32.22 ± 0.037abB 32.60 ± 0.07bC 32.40 ± 0.02abB 32.05 ± 0.03aAEAEPO 40.46 ± 0.55bC 39.51 ± 0.03aD 39.63 ± 0.03aC 39.72 ± 0.06aE 39.74 ± 0.02aE 39.82 ± 0.04aBHEBO 44.63 ± 0.01eD 39.96 ± 0.01cE 40.20 ± 0.01dD 38.97 ± 0.02bD 38.94± 0.02bD 38.68 ± 0.04aB
Mean values within each row followed by different letters (a, b, c, etc.) are significantly (𝑃 < 0.05) different. Mean values within each column followed bydifferent letters (A, B, C, etc.) are significantly (𝑃 < 0.05) different.
Table 4: Changes in saturated, monounsaturated, and polyunsaturated fatty acids.
SFA, MUFA, and PUFA0 h 1 h 2 h 4 h 6 h 8 h
SFA
FGBO 15.28 ± 0.04 aC 26.83 ± 0.04bE 27.75 ± 0.01cE 28.94 ± 0.03dD 27.87 ± 0.04eE 31.45 ± 0.01fEFBBO 15.51 ± 0.04aD 18.34 ± 0.02bA 19.92 ± 0.02cA 19.85 ± 0.04dA 20.22 ± 0.02eA 25.32 ± 0.01fCGABO 17.93 ± 0.06aE 19.78 ± 0.03bB 24.23 ± 0.01cD 24.74 ± 0.02dC 24.69 ± 0.07dD 25.35 ± 0.01eDEAEPO 11.93 ± 0.03aB 20.13 ± 0.02bD 21.11 ± 0.02cC 21.30 ± 0.02dB 21.44 ± 0.00eB 21.65 ± 0.01fAHEBO 10.57 ± 0.02aA 20.01 ± 0.02bC 20.03 ± 0.02bB 21.36 ± 0.02cB 21.57 ± 0.02dC 22.54 ± 0.01eB
MUFA
FGBO 47.12 ± 0.02fCD 41.64 ± 0.02dC 41.11 ± 0.01cC 40.70 ± 0.02cB 41.78 ± 0.04eB 40.54 ± 0.02aCFBBO 48.15 ± 0.04eD 47.43 ± 0.02dE 46.93 ± 0.05cE 47.65 ± 0.49cD 45.85 ± 0.02bC 41.65 ± 0.03aDGABO 45.97 ± 0.01eBC 45.13 ± 0.03dD 41.53 ± 0.01aD 41.55 ± 0.04cC 41.86 ± 0.08cB 41.77 ± 0.01bEEAEPO 44.48 ± 0.04cB 40.12 ± 0.02bB 39.28 ± 0.04abA 38.87 ± 0.03abA 38.53 ± 0.02abA 38.46 ± 0.02aAHEBO 42.22 ± 0.02dA 39.98 ± 0.02cA 40.18 ± 0.04bB 39.30 ± 0.58cA 38.53 ± 0.65aA 38.74 ± 0.02abB
PUFA
FGBO 37.11 ± 0.01fC 31.46 ± 0.02eA 31.16 ± 0.02cA 30.63 ± 0.02cA 30.31 ± 0.01bA 27.96 ± 0.02aAFBBO 36.29 ± 0.03eA 34.24 ± 0.02dB 33.12 ± 0.02bB 33.14 ± 0.03bB 33.91 ± 0.03cC 32.95 ± 0.04aBGABO 36.44 ± 0.02fB 35.65 ± 0.01eC 34.23 ± 0.03cC 33.73 ± 0.03cC 33.41 ± 0.02bB 32.95 ± 0.01aBEAEPO 42.13 ± 0.03dD 39.54 ± 0.02aD 39.58 ± 0.03aD 39.73 ± 0.05bE 39.74 ± 0.03bE 39.84 ± 0.03cDHEBO 45.64 ± 0.02fE 39.97 ± 0.01dE 40.18 ± 0.04dE 38.96 ± 0.02cD 38.89 ± 0.02bD 38.74 ± 0.02aC
Mean values within each row followed by different letters (a, b, c, etc.) are significantly (𝑃 < 0.05) different. Mean values within each column followed bydifferent letters (A, B, C, etc.) are significantly (𝑃 < 0.05) different.
induce modification of fatty acids that contain two or threedouble bonds. Both oxidation and oxidative polymerizationoccur with progressive heating. Furthermore, the relativeoxidation rate of linolenic acid is much higher than that ofstearic acid [24].
The fatty acid ratio of EAEPO andHEBO (0.27 : 1.03 : 0.96and 0.27 : 1.08 : 1.16) approached the ideal fatty acid ratio of0.27 : 1 : 1 (SFA :MUFA : PUFA), as shown inTable 5; the otherthree kinds of blended oils also approached this ratio prior toheating (0.27 : 0.65 : 0.8, 0.27 : 0.6 : 0.84, and 0.27 : 0.61 : 0.79
Journal of Chemistry 7
Table 5: Variation of SFA :MUFA : PUFA ratio of blended oils.
SFA, MUFA, and PUFA0 h 1 h 2 h 4 h 6 h 8 h
FGBO 0.27 : 0.65 : 0.8 0.27 : 0.42 : 0.32 0.27 : 0.40 : 0.30 0.27 : 0.38 : 0.29 0.27 : 0.41 : 0.29 0.27 : 0.35 : 0.24FBBO 0.27 : 0.6 : 0.84 0.27 : 0.70 : 0.50 0.27 : 0.64 : 0.45 0.27 : 0.64 : 0.45 0.27 : 0.61 : 0.45 0.27 : 0.44 : 0.35GABO 0.27 : 0.61 : 0.79 0.27 : 0.62 : 0.49 0.27 : 0.46 : 0.38 0.27 : 0.45 : 0.37 0.27 : 0.45 : 0.35 0.27 : 0.45 : 0.35EAEPO 0.27 : 1.03 : 0.96 0.27 : 0.54 : 0.53 0.27 : 0.49 : 0.50 0.27 : 0.48 : 0.50 0.27 : 0.48 : 0.50 0.27 : 0.48 : 0.49HEBO 0.27 : 1.08 : 1.16 0.27 : 0.51 : 0.54 0.27 : 0.50 : 0.54 0.27 : 0.47 : 0.49 0.27 : 0.46 : 0.49 0.27 : 0.43 : 0.46
Table 6: Changes in trans-fatty acid profile (mg/mL).
TFAs0 h 1 h 2 h 4 h 6 h 8 h
FGBO 0.01 ± 0.01aA 4.94 ± 0.01bA 17.18 ± 0.02cA 59.68 ± 0.03dA 157.83 ± 0.08eA 280.16 ± 0.18fAFBBO 0.01 ± 0.04aC 5.78 ± 0.03bC 21.32 ± 0.01cC 68.79 ± 0.04dC 188.48 ± 0.03eC 257.14 ± 0.08fCGABO 0.01 ± 0.01aB 5.07 ± 0.06bB 18.54 ± 0.05cB 64.61 ± 0.08dB 162.39 ± 0.03eB 333.44 ± 0.09fBEAEPO 0.02 ± 0.01aD 9.55 ± 0.03bD 29.88 ± 0.05cD 88.64 ± 0.02dD 232.52 ± 0.07eD 542.39 ± 0.08fDHEBO 0.02 ± 0.01aC 12.43 ± 0.02bE 30.51 ± 0.03cE 93.09 ± 0.037dE 256.70 ± 0.06eE 558.60 ± 0.14fEMean values within each row followed by different letters (a, b, c, etc.) are significantly (𝑃 < 0.05) different. Mean values within each column followed bydifferent letters (A, B, C, etc.) are significantly (𝑃 < 0.05) different.
for FGBO, FBBO, and GABO, resp.). At the end of theheating time, the ratio was 0.27 : 0.48 : 0.49 for EAEPO,whichindicates that a relatively close to ideal fatty acid ratio for ahealthy diet could be maintained for the EAEPO sample asheating progressed.
3.6. Changes in Trans-Fatty Acids. Epidemiological evidencehas suggested that the level of trans-fatty acid (TFA) intakeis connected to the risk of cardiovascular disease [25]; thus,there have been several studies on TFAs contained in foodmaterials.The amount of total TFAs in the evaluated oil typeswas in the range of 0.01-0.02mg/mL, which clearly approxi-mates the requirement for a “zero trans” content. However,a substantial increase in the TFAs of the various oils wasobserved when the oils were heated for 6 h to 8 h (Table 6).At the final heating time, EAEPO and HEBO presented thehighest total TFA content. Several factors, such as the FAcomposition of each oil and coexisting antioxidants, maycontribute to the variation in the thermal TFA accumulationprofiles [26].
4. Conclusions
The results of this study demonstrate that the quality ofenzyme-assisted aqueous processing extracted blended oil(EAEPO) is superior to that of hexane-extracted blendedoil (HEBO) from the initial to the final heating time,which is possibly due to the extraction method of theformer that utilizes water as an extraction and separationmedium thereby maintaining a higher antioxidant content.However, compared to the other three refined oil samples,
the EAEPO and HEBO samples were less stable towardsoxidative degradation. Nevertheless, EAEPO was found tohave the lowest acid value and offers the additional advantageof containing an ideal fatty acid ratio after heat treatment ofthe oils (0.27 : 0.48 : 0.49), which has been linked to reducedrisk of high cholesterol and heart disease. The advantageouscharacteristics may be attributed to the superior initial fattyacid composition of EAEPO.
Conflict of Interests
The authors declare that there is no conflict of interestsregarding the publication of this paper.
Authors’ Contribution
Lianzhou Jiang and Yang Li contributed equally to this paper.
Acknowledgments
The authors are grateful to the National High-Tech R&DProgram of China (863 Program) (no. 2013AA102104), theKey Laboratory of Soybean Biology of the Chinese EducationMinistry, Northeast Agricultural University (no. SB12C01),the Establishment of Modern Agricultural R&D Systems (no.Nycytx-004), and the National Research Center of SoybeanEngineering and Technology for support of this project. Theauthors are also grateful to the anonymous referees for helpfulcomments on an earlier draft.
8 Journal of Chemistry
References
[1] Y. Li, Y. Zhang,M.Wang, L. Jiang, andX. Sui, “Simplex-centroidmixture design applied to the aqueous enzymatic extractionof fatty acid-balanced oil from mixed seeds,” Journal of theAmerican Oil Chemists’ Society, vol. 90, no. 3, pp. 349–357, 2013.
[2] Interim Summary of Conclusions and Dietary Recommendationson Total Fat & Fatty Acids. From the Joint FAO/WHO ExpertConsultation on Fats and Fatty Acids in Human Nutrition,WHO, Geneva, Switzerland, 2008.
[3] Chinese Nutrition Society, Chinese Dietary Reference Intakes(DRIs), China Light Industry Press, Beijing, China, 2000.
[4] Q. Zhang, A. S. M. Saleh, J. Chen, and Q. Shen, “Chemicalalterations taken place during deep-fat frying based on certainreaction products: a review,” Chemistry and Physics of Lipids,vol. 165, no. 6, pp. 662–681, 2012.
[5] S. Debnath, N. K. Rastogi, A. G. Gopala Krishna, and B.R. Lokesh, “Effect of frying cycles on physical, chemical andheat transfer quality of rice bran oil during deep-fat frying ofpoori: an Indian traditional fried food,” Food and BioproductsProcessing, vol. 90, no. 2, pp. 249–256, 2012.
[6] R.Malheiro, S. Casal,H. Lamas, A. Bento, and J. A. Pereira, “Cantea extracts protect extra virgin olive oil from oxidation duringmicrowave heating?” Food Research International, vol. 48, no. 1,pp. 148–154, 2012.
[7] A. F. Valdes and A. B. Garcia, “A study of the evolutionof the physicochemical and structural characteristics of oliveand sunflower oils after heating at frying temperatures,” FoodChemistry, vol. 98, no. 2, pp. 214–219, 2006.
[8] W. H. Liu, B. Stephen Inbaraj, and B. H. Chen, “Analysis andformation of trans fatty acids in hydrogenated soybean oilduring heating,” Food Chemistry, vol. 104, no. 4, pp. 1740–1749,2007.
[9] N. Rodrigues, R. Malheiro, S. Casal, M. C. Asensio-S-Manzanera, A. Bento, and J. A. Pereira, “Influence of spikelavender (Lavandula latifolia Med.) essential oil in the quality,stability and composition of soybean oil during microwaveheating,” Food and Chemical Toxicology, vol. 50, no. 8, pp. 2894–2901, 2012.
[10] E. Chiavaro, C. Barnaba, E. Vittadini, M. T. Rodriguez-Estrada,L. Cerretani, and A. Bendini, “Microwave heating of differentcommercial categories of olive oil—part II: effect on thermalproperties,” Food Chemistry, vol. 115, no. 4, pp. 1393–1400, 2009.
[11] S. Marmesat, A. Morales, J. Velasco, and M. Carmen Dobar-ganes, “Influence of fatty acid composition on chemical changesin blends of sunflower oils during thermoxidation and frying,”Food Chemistry, vol. 135, no. 4, pp. 2333–2339, 2012.
[12] Y. Li, L. Jiang, and G. Qiao, “Effect of extruding parameterson soybean oil yield of enzyme-assisted aqueous extractionprocessing,”AdvancedMaterials Research, vol. 148-149, pp. 7–18,2011.
[13] Y. Li, L. Jiang, Z. Zhang et al., “Fuzzy optimization of enzymeassistant aqueous for extracting oil and protein from extrudedsoybean,” Transactions of the Chinese Society of AgriculturalEngineering, vol. 26, no. 2, pp. 375–380, 2010.
[14] R. B. Pegg, “Measurement of primary lipid peroxidation prod-ucts (D2.1.1-D2.1.15),” in Current Protocols in Food AnalyticalChemistry, John Wiley & Sons, New York, NY, USA, 2001.
[15] R. A. Moreau, D. B. Johnston, M. J. Powell, and K. B. Hicks, “Acomparison of commercial enzymes for the aqueous enzymaticextraction of corn oil from corn germ,” Journal of the AmericanOil Chemists’ Society, vol. 81, no. 11, pp. 1071–1075, 2004.
[16] S. M. Abdulkarim, K. Long, O. M. Lai, S. K. S. Muhammad,and H. M. Ghazali, “Frying quality and stability of high-oleicMoringa oleifera seed oil in comparison with other vegetableoils,” Food Chemistry, vol. 105, no. 4, pp. 1382–1389, 2007.
[17] S. Casal, R. Malheiro, A. Sendas, B. P. P. Oliveira, and J. A.Pereira, “Olive oil stability under deep-frying conditions,” Foodand Chemical Toxicology, vol. 48, no. 10, pp. 2972–2979, 2010.
[18] Codex Alimentarius Commission,Codex-Stan 210: Codex Stan-dard for Named Vegetable Oils, Food and Agriculture Organiza-tion, Rome, Italy, 2008.
[19] S. Latif and F. Anwar, “Effect of aqueous enzymatic processeson sunflower oil quality,” Journal of the American Oil Chemists’Society, vol. 86, no. 4, pp. 393–400, 2009.
[20] F. Shahidi and U. N. Wanasundara, “Methods for measuringoxidative rancidity in fats and oils,” in Food Lipids: Chemistry,Nutrition, and Biotechnology, pp. 377–396, 2002.
[21] M. Laguerre, J. Lecomte, and P. Villeneuve, “Evaluation of theability of antioxidants to counteract lipid oxidation: existingmethods, new trends and challenges,”Progress in Lipid Research,vol. 46, no. 5, pp. 244–282, 2007.
[22] S. Lalas, O. Gortzi, and J. Tsaknis, “Frying stability of Moringastenopetala seed oil,” Plant Foods for Human Nutrition, vol. 61,no. 2, pp. 99–108, 2006.
[23] G. Bansal, W. Zhou, P. J. Barlow, H.-L. Lo, and F.-L. Neo,“Performance of palm olein in repeated deep frying andcontrolled heating processes,” FoodChemistry, vol. 121, no. 2, pp.338–347, 2010.
[24] A. H. Ahmad Tarmizi, K. Niranjan, and M. Gordon, “Physico-chemical changes occurring in oil when atmospheric frying iscombined with post-frying vacuum application,” Food Chem-istry, vol. 136, no. 2, pp. 902–908, 2013.
[25] F. A. Aladedunye and R. Przybylski, “Degradation and nutri-tional quality changes of oil during frying,” Journal of theAmerican Oil Chemists’ Society, vol. 86, no. 2, pp. 149–156, 2009.
[26] W. Tsuzuki, A. Matsuoka, and K. Ushida, “Formation of transfatty acids in edible oils during the frying and heating process,”Food Chemistry, vol. 123, no. 4, pp. 976–982, 2010.

Submit your manuscripts athttp://www.hindawi.com
Hindawi Publishing Corporationhttp://www.hindawi.com Volume 2014
Inorganic ChemistryInternational Journal of
Hindawi Publishing Corporation http://www.hindawi.com Volume 2014
International Journal ofPhotoenergy
Hindawi Publishing Corporationhttp://www.hindawi.com Volume 2014
Carbohydrate Chemistry
International Journal of
Hindawi Publishing Corporationhttp://www.hindawi.com Volume 2014
Journal of
Chemistry
Hindawi Publishing Corporationhttp://www.hindawi.com Volume 2014
Advances in
Physical Chemistry
Hindawi Publishing Corporationhttp://www.hindawi.com
Analytical Methods in Chemistry
Journal of
Volume 2014
Bioinorganic Chemistry and ApplicationsHindawi Publishing Corporationhttp://www.hindawi.com Volume 2014
SpectroscopyInternational Journal of
Hindawi Publishing Corporationhttp://www.hindawi.com Volume 2014
The Scientific World JournalHindawi Publishing Corporation http://www.hindawi.com Volume 2014
Medicinal ChemistryInternational Journal of
Hindawi Publishing Corporationhttp://www.hindawi.com Volume 2014
Chromatography Research International
Hindawi Publishing Corporationhttp://www.hindawi.com Volume 2014
Applied ChemistryJournal of
Hindawi Publishing Corporationhttp://www.hindawi.com Volume 2014
Hindawi Publishing Corporationhttp://www.hindawi.com Volume 2014
Theoretical ChemistryJournal of
Hindawi Publishing Corporationhttp://www.hindawi.com Volume 2014
Journal of
Spectroscopy
Analytical ChemistryInternational Journal of
Hindawi Publishing Corporationhttp://www.hindawi.com Volume 2014
Journal of
Hindawi Publishing Corporationhttp://www.hindawi.com Volume 2014
Quantum Chemistry
Hindawi Publishing Corporationhttp://www.hindawi.com Volume 2014
Organic Chemistry International
ElectrochemistryInternational Journal of
Hindawi Publishing Corporation http://www.hindawi.com Volume 2014
Hindawi Publishing Corporationhttp://www.hindawi.com Volume 2014
CatalystsJournal of