critical analysis on the quality of stability studies of
TRANSCRIPT

This is an electronic reprint of the original article.This reprint may differ from the original in pagination and typographic detail.
Powered by TCPDF (www.tcpdf.org)
This material is protected by copyright and other intellectual property rights, and duplication or sale of all or part of any of the repository collections is not permitted, except that material may be duplicated by you for your research use or educational purposes in electronic or print form. You must obtain permission for any other use. Electronic or print copies may not be offered, whether for sale or otherwise to anyone who is not an authorised user.
Tiihonen, Armi; Miettunen, Kati; Halme, Janne; Lepikko, Sakari; Poskela, Aapo; Lund, PeterCritical analysis on the quality of stability studies of perovskite and dye solar cells
Published in:Energy and Environmental Science
DOI:10.1039/c7ee02670f
Published: 01/01/2018
Document VersionPublisher's PDF, also known as Version of record
Published under the following license:CC BY
Please cite the original version:Tiihonen, A., Miettunen, K., Halme, J., Lepikko, S., Poskela, A., & Lund, P. (2018). Critical analysis on thequality of stability studies of perovskite and dye solar cells. Energy and Environmental Science, 11(4), 730-738.https://doi.org/10.1039/c7ee02670f

This journal is©The Royal Society of Chemistry 2018 Energy Environ. Sci.
Cite this:DOI: 10.1039/c7ee02670f
Critical analysis on the quality of stability studiesof perovskite and dye solar cells†
Armi Tiihonen, *a Kati Miettunen, ab Janne Halme, a Sakari Lepikko, a
Aapo Poskelaa and Peter D. Lund a
The success of perovskite and dye-sensitized solar cells will depend on their stability over the
whole life-time. Aging tests are of utmost importance to identify deficiencies and to suggest cell
improvements. Here we analyzed the quality of 261 recent aging tests and found serious shortcomings
in current practices. For example, in about 50% of the studies only one sample was considered, meaning
that the sample size was too small for statistical significance. We propose a new procedure for aging
tests based on careful planning and scientific reporting. This includes estimating the required sample
size for an aging test and avoiding so-called nuisance factors, i.e. unintended variations always present
in real world testing. The improved procedure can provide more reliable information on stability and
lifetime, which could contribute to better understanding of degradation mechanisms important for
improving these photovoltaic technologies.
Broader contextPerovskite and dye-sensitized solar cells are promising third generation photovoltaic technologies. In less than a decade, the conversion efficiency of perovskitesolar cells has increased almost ten fold, reaching up to 20 percent. Dye solar cells can be manufactured from a variety of materials and in different colorsshowing wide application areas with commercial potential. Though the lifetime of both PV technologies has constantly improved, they still suffer from majordegradation problems, which hamper their market breakthrough. Research on cell stability is therefore of utmost importance, but the quality of relatedresearch has shown major shortcomings. Here we comprehensively analyzed the methods used in stability and aging tests, which revealed severe weaknesses incurrent practices, in particular insufficient reporting and inadequate sample sizes for statistical relevance. As these deficiencies may hamper the progress ofperovskite and dye-sensitized solar cells, a new procedure for aging tests is proposed including detailed instructions on how to achieve high quality in suchexperiments.
1 Introduction
Dye-sensitized solar cells (DSCs) and perovskite solar cells(PSCs) are among the most promising emerging photovoltaic(PV) technologies. DSCs are close to market breakthrough1 andcan be produced energy efficiently in a variety of colors2 fromlow-cost materials.3 PSCs complement their parent DSCs byreaching high efficiencies using solid-state structures and arethus an exciting, emerging area of research. Researchers havereported efficiencies as high as 22.1 � 0.7% for small-sizedPSCs.4 The stability of both cell types has improved constantlywith promising recent results such as DSCs passing a
three-month outdoor aging test without external weatherprotection5 and PSCs passing a 1000 hours aging test under UVillumination.6 Even so, the quest for sufficiently long lifetimefor market breakthrough continues. The concept of adequatelifetime depends on how we intend to use the solar cells: fromindoor applications under intermediate conditions that requireyears-long stability, to building-integrated PVs under extremestress that require decades of stability. However, it is clear thatproducing more reliable cells requires better understanding oftheir aging mechanisms.
The number of aging studies is small compared to the numberof studies focused on improving the already high efficiencies, asthis simplistic comparison reveals: 18% of the articles related toDSCs or PSCs listed in the Web of Science mention stability intheir topic (details in ESI,† Section S5), whereas efficiency ismentioned in 79% of the articles. Recently the need for morestability research for both DSCs and PSCs has been recognized.1,7
Additionally increased attention is directed at the standards of
a New Energy Technologies, Department of Applied Physics, Aalto University,
P.O. Box 15100, 00076 Aalto, Finland. E-mail: [email protected] Biobased Colloids and Materials, Department of Bioproducts and Biosystems,
Aalto University, P.O. Box 16300, 00076 Aalto, Finland
† Electronic supplementary information (ESI) available. See DOI: 10.1039/c7ee02670f
Received 17th September 2017,Accepted 21st December 2017
DOI: 10.1039/c7ee02670f
rsc.li/ees
Energy &EnvironmentalScience
ANALYSIS
Ope
n A
cces
s A
rtic
le. P
ublis
hed
on 0
5 Fe
brua
ry 2
018.
Dow
nloa
ded
on 0
4/04
/201
8 07
:29:
11.
Thi
s ar
ticle
is li
cens
ed u
nder
a C
reat
ive
Com
mon
s A
ttrib
utio
n 3.
0 U
npor
ted
Lic
ence
.
View Article OnlineView Journal
Energy Environ. Sci. This journal is©The Royal Society of Chemistry 2018
stability testing – researchers1,7,8 and publishers9 have called forbetter reporting and more uniform methods.
The main motivation in aging tests is (1) to determine thereal lifetime of the cells, and (2) to compare the durability ofdifferent types of cells under certain stress factors. The firstobjective is challenging, because the desired lifetimes of thecells are often very long. In practice, the lifetime of the cells isinvestigated by accelerated aging tests. The challenge is indetermining the accelerating factor of the aging test accuratelyenough, which is a topic still under research even for commercialsilicon solar cells.10
The latter objective of comparing cell types is principallysimple: if everybody performs the same test under the sameconditions, the results should be comparable. Currently uni-formity and repeatability are poor in the stability testing of bothDSCs and PSCs, which is demonstrated in Section 2. Thissituation leads to seemingly contradictory research results – arecognized problem in the literature.1 This in turn hampers theprogress of the whole field of research as important phenomenamay remain unnoticed for too long because of a lack of informationon the circumstances of the aging tests.
Similar problems have been found in other fields, whichhave been targeted by standardizing the aging tests. Thisapproach has also been suggested at least for PSCs.7 Commercializedtechnologies – silicon and thin film solar cells – have standardizedtests for estimating the durability of PV modules against prolongedexposure in climates that are specified in the standard (IEC61215-1:2016). These tests are for initial durability testing, notfor estimating the long-term stability or lifetime of the modules,although they are sometimes used as the basis for suchestimations.11
IEC 61215-1:2016 tests are not adaptable for emerging PVtechnologies as such. To begin with, these third-generationtechnologies are too young to meet many of the establishedevaluations for outdoor testing; also entering the market willmost likely happen in milder indoor conditions. For instance, adamp heat test designed for terrestrial thin-film solar cells at atemperature of 85 1C and 85% air humidity (IEC 61215-1:2016)would degrade most DSCs and PSCs quickly. Overly harsh testsleading to a rapid failure are unsuitable for research purposes:something more than a binary pass/fail resolution is needed todetect if there is progress in stability. Not to mention that manylaboratories researching third-generation solar cells have insufficientequipment to perform the detailed and laborious tests that aredesigned for commercial large-scale manufacturers. Anotherexample of standardization is the International Summit onOrganic and Hybrid Photovoltaic Stability (ISOS) protocol oforganic PVs12 that has been agreed by a wide internationalconsortium of organic PV researchers. ISOS is designed forresearch purposes, and it is divided into three levels from thehighest levels to very basic, encouraging more groups to includestability studies in their research. The ISOS protocol also servesas a practical starting point for designing stability tests for DSCsand PSCs.
Here we present the current state of stability research ofperovskite and dye solar cells, investigated with a focus on the
methods and practices of performing aging tests instead of themore commonly investigated findings from aging tests. Basedon our literature survey, we present practical procedures forimproving the effectiveness and quality of aging testing. Ourrecommended procedures can be applied to all standards oftesting – the focus is to maximize accumulated knowledge andaccelerate aging research, regardless of how extensive or humbleyour facilities may be.
Our results show that the state of aging testing of PSCs andDSCs is alarming. Efforts of the whole community are requiredfor swift corrections. Thus, we propose a series of internationalsummits for agreeing with the principles of stability testing ofthese cells. The improved methods could greatly enhance theprogress in stability research in future.
2 Current state of stability research
For this contribution, a group of recently published stabilityrelated articles was selected for literature survey. The selectedgroup was formed of all the articles mentioning stability-relatedterms in their titles, listed in the Web of Science, and publishedduring 2016 for PSCs and 2015–2016 for DSCs (details in ESI,†Section S5). The 157 articles included a total of 261 individualaging tests.
2.1 Group sizes in aging tests
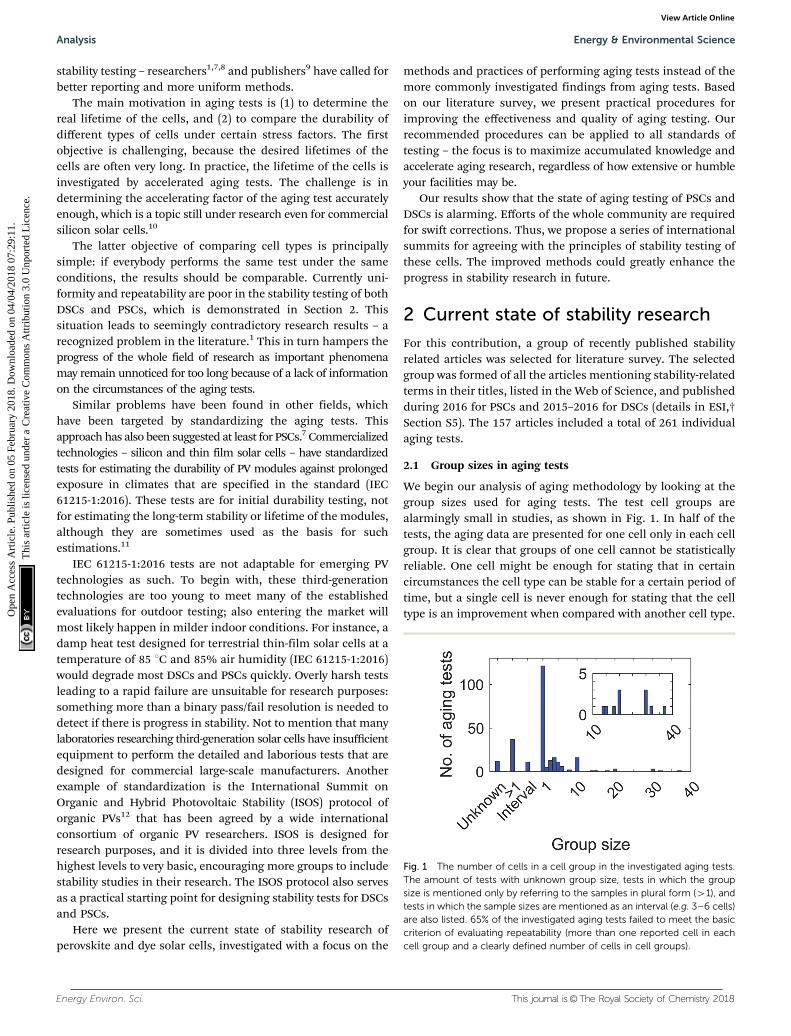
We begin our analysis of aging methodology by looking at thegroup sizes used for aging tests. The test cell groups arealarmingly small in studies, as shown in Fig. 1. In half of thetests, the aging data are presented for one cell only in each cellgroup. It is clear that groups of one cell cannot be statisticallyreliable. One cell might be enough for stating that in certaincircumstances the cell type can be stable for a certain period oftime, but a single cell is never enough for stating that the celltype is an improvement when compared with another cell type.
Fig. 1 The number of cells in a cell group in the investigated aging tests.The amount of tests with unknown group size, tests in which the groupsize is mentioned only by referring to the samples in plural form (41), andtests in which the sample sizes are mentioned as an interval (e.g. 3–6 cells)are also listed. 65% of the investigated aging tests failed to meet the basiccriterion of evaluating repeatability (more than one reported cell in eachcell group and a clearly defined number of cells in cell groups).
Analysis Energy & Environmental Science
Ope
n A
cces
s A
rtic
le. P
ublis
hed
on 0
5 Fe
brua
ry 2
018.
Dow
nloa
ded
on 0
4/04
/201
8 07
:29:
11.
Thi
s ar
ticle
is li
cens
ed u
nder
a C
reat
ive
Com
mon
s A
ttrib
utio
n 3.
0 U
npor
ted
Lic
ence
.View Article Online

This journal is©The Royal Society of Chemistry 2018 Energy Environ. Sci.
In some studies, the aging tests have possibly been performedfor more cells, but the data are presented only for one cell.Unfortunately the scientific audience has no means of recognizingif the study had more cells or not. Additionally presenting the dataonly for one cell unnecessarily dissipates the information aboutthe repeatability of the results. Fig. 1 shows that the second mostcommon option for group sizes is to refer to the samples in plural,but then the study neglects to report the exact group size. For thescientific audience, including the number of cells is moreinformative, as not doing so unnecessarily complicates theinterpretation of the results.
Small groups of, e.g., less than five cells are also typicallyinsufficient for statistically significant conclusions, althoughthey result in more reliable conclusions than comparison ofsingle cells. Small cell groups can be used for acquiring tentativedata about the differences of the cell types, but the quantitativedata are unreliable because the information about the variationsof the results is inadequate. As a result, the impact of theresulting article decreases. Therefore it is worthwhile to targetstatistically acceptable group sizes (see Section 3.2 for determiningsufficient group sizes). In only 10% of the investigated tests, tenor more cells have been prepared for each cell group (Fig. 1),demonstrating that increasing group sizes to statistically acceptablelevels is possible.
2.2 Aging test conditions
The vast majority of the 261 investigated tests are indoor testsfor cells: only 15 tests are outdoor tests and 3 tests are onmodules. The statistics might be justified for PSCs that are inthe early stage of their development cycle. However, DSCs are amore mature technology and would greatly benefit from anincreased number of outdoor and module studies as alreadyrecognized in the literature.1
38% of the investigated tests are performed for encapsulatedor sealed cells, 61% for open devices. Most open devices arePSCs, probably because many DSC types contain liquid electrolytesthat would soon leak out or evaporate from a cell left withoutproper sealing.
More than 60% of the investigated aging tests are performedat open circuit voltage, i.e., operation regime that correspondsto the storage of the cells, and those are mainly done in darkconditions (Fig. 2a). Reverse bias and short circuit conditionsare applied on the cells rarely, possibly because realizing theseconditions in an aging test setup requires an effort (cf. opencircuit). They are also seemingly atypical operation states of acell. However reverse bias conditions exist in panels that arepartly shadowed, for example. Also short circuit conditionsmight appear in a damaged cell or panel. A continuous cur-rent–voltage curve measurement (IV), applied as a condition in8% of the aging tests, directly corresponds to none of theoperational states of the cell. The benefit of the repeated IVtest stress is the continuous variation of the electric state thathappens in actual cell operation, although typically at a significantlyslower pace in daily cycles. Only roughly one-eighth of the agingtests are performed under load, which is the main operatingstate of the cell (Fig. 2a). The different operating conditions of
the cell should be represented in stability research for the sakeof completeness. Specifically, operation under load should beutilized more in aging tests because the stability at open circuitor other electric states does not necessarily correlate withstability in real-life use.13,14
2.3 Environmental conditions in aging tests
Aging tests are typically performed in dark conditions, asillustrated in Fig. 2b. It is important to investigate the behaviorof the cells in the dark, but the number of dark tests incomparison to the illuminated tests is currently out of proportion.Increasing the share of illuminated aging tests would be beneficialfor forming a full picture of the aging behavior of PSCs and DSCs.A quarter of aging tests use both visible light and ultraviolet (UV)light. The proportion of tests that do not report the type ofillumination the cells were exposed to (visible and/or UV light) islarge, 15%. UV light is a recognized stress factor for both DSCs andPSCs, in many cases resulting in significantly shorter lifetimes for
Fig. 2 (a) The electric condition of the cells in the investigated aging tests.The cells are aged at open circuit (Voc) either under illumination or in the dark,under load, under reverse bias, by cycling IV repeatedly (IV), at short circuit (Isc),or the electric state remains unknown (unknown). Only a minority of agingtests are performed under operational conditions (i.e. under load). (b) Theinvestigated aging tests divided into dark tests, tests illuminated with visibleand/or ultraviolet light, and tests that did not mention if the illuminationcontained ultraviolet and/or visible light. Cells are dominantly aged in the dark.See ESI,† Section S5 for more detailed information on the classification.
Energy & Environmental Science Analysis
Ope
n A
cces
s A
rtic
le. P
ublis
hed
on 0
5 Fe
brua
ry 2
018.
Dow
nloa
ded
on 0
4/04
/201
8 07
:29:
11.
Thi
s ar
ticle
is li
cens
ed u
nder
a C
reat
ive
Com
mon
s A
ttrib
utio
n 3.
0 U
npor
ted
Lic
ence
.View Article Online

Energy Environ. Sci. This journal is©The Royal Society of Chemistry 2018
the cells than pure visible light.3,15 Therefore it is important tostate what kind of illumination the cells are exposed to.
The aging of the cells is also affected by the intensity of light.For the majority of illuminated aging tests, the visible lightintensity is reported quantitatively as Fig. 3a indicates; typicallytests are performed at 1 Sun intensity. The state of the reportingof visible illumination seems good. In contrast, only a minorityof illuminated tests are performed with quantitatively stated UVintensity (Fig. 3b). A quarter of illuminated tests apply onlyvisible light using LED lamps for example, and another quarterprovide no information about the spectrum of the light.Commonly the presence of UV light is deduced from thereported lamp type or solar simulator model, but the intensityof UV light remains unknown (‘‘some UV’’ in Fig. 3b, moredetails in ESI,† Section S5).
It seems that generally having a commercial solar simulatorwith a high-quality calibration cell is regarded as sufficient todescribe the aging spectrum in detail. However many standards
for the solar simulator spectral accuracy specify only thespectrum above 400 nm (e.g. SFS-EN 60904-9, JIS C 8912, andASTM E927 for AM 1.5G). Thus commercial solar simulators arenot necessarily accurate in the UV part of the spectrum, in factthey could actually emit no UV at all, even if they would be veryaccurate in the visible part of the spectrum.
Currently both UV and visible light intensities are reportednumerically only in 31% of the investigated illuminated indoortests. Reporting of the intensity separately for the visible andUV parts of the spectrum would be valuable because UVillumination strongly degrades some cell types.
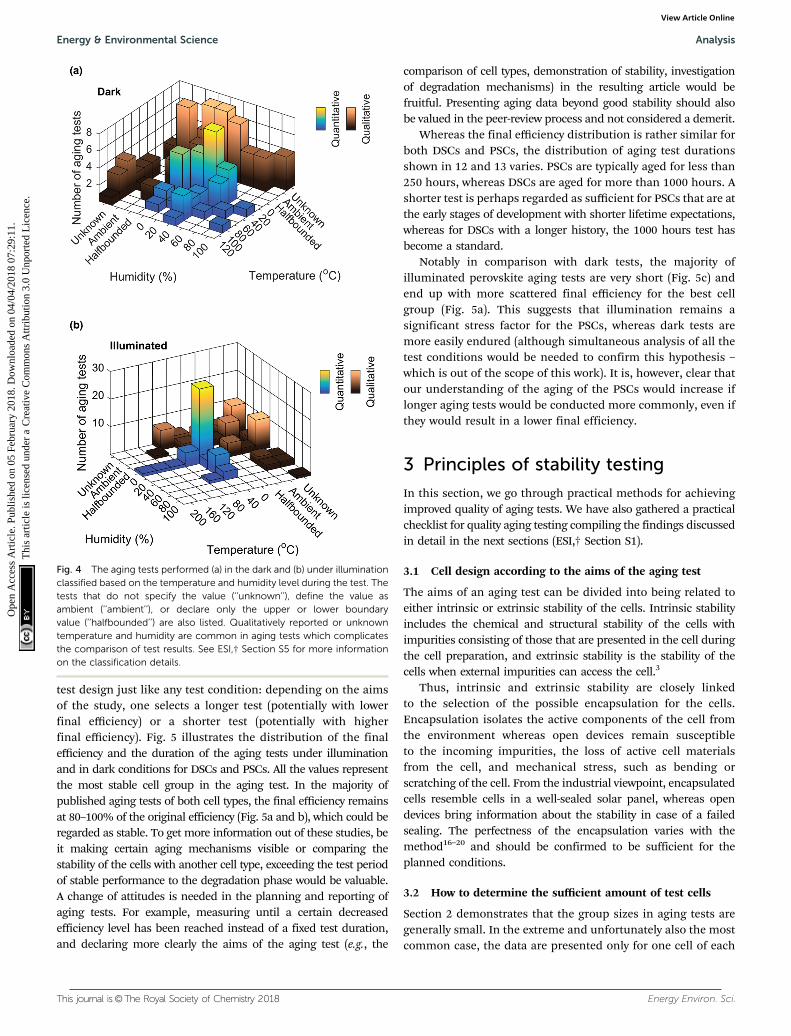
Fig. 4a and b illustrate the temperature and humidityapplied in dark and illuminated aging tests. For most aging tests,the humidity and/or temperature are reported only qualitatively,such as being ‘‘ambient’’, or are not reported at all. Illuminatedaging tests are commonly performed in a dry atmosphere and atlow temperature. Dark storage tests are performed in a narrowertemperature range than illuminated tests, but the humidity rangeis wider. The scarcity of published illuminated aging testsapplying higher than 60 1C temperature or more than 10%humidity suggests that these conditions remain a severe stressfactor for DSCs and PSCs.
This trend of missing reporting of environmental conditionsduring the aging tests spreads across all basic environmentalvariables. Numerical values are stated for visible and UV lightintensities, humidity, and temperature in only one-third ofaging tests. The absence of reporting suggests a lack of monitoringof the environmental variables, a situation that is problematicbecause other environmental factors than the intended ones (e.g.,humidity in a light soaking test) could greatly affect the test result.Even if the monitoring would have been appropriate, the environ-mental details missing from the article complicate the comparisonof results with other tests.
2.4 Measurements during aging tests
The current–voltage curve (IV) is measured in 91% of the agingtests, which makes IV the most typical measurement. Otheradditional measurements are performed in 41% of the agingtests. These tests include a variety of measurements from theshort circuit current (instead of IV) or maximum power pointtracking and X-ray diffraction spectroscopy to electrochemicalimpedance spectroscopy. Selection principles for measurementsapplied in aging tests are further discussed in Section 3.4.
In 89% of the tests, the performance of the cells has beenmonitored with measurements during the aging test, in addition tothe beginning and end of the test. The regular monitoring ofperformance provides information about the progress of degradationmechanisms that could be, for example, linear or step-wise. Typicallythe measurements seem to be performed manually on a regularbasis during the test. Manual measurements are laborious, soworking hours would be saved if the commonly repeatedmeasurements were automated.
2.5 Stability in aging tests
The length and final efficiency in aging tests are properties withstrong reverse correlation, yet the combination is a question of
Fig. 3 The amount of (a) visible and (b) UV light in all but dark aging tests.The visible light illumination is divided into completely unknown illuminationlevel (unknown), visible illumination but with unknown intensity (somevisible), quantitatively stated illumination level (either no visible, 0–0.5 Sun,0.5–1 Sun, 1 Sun, or 2–4 Sun), and outdoor tests. The UV light illumination isclassified in a similar way. In the case of UV light, ‘‘unknown’’ means that theexistence of UV irradiation could not be determined, and ‘‘some UV’’ meansthat UV illumination exists based on lamp type or solar simulator brand butthe actual intensity of UV light is not reported by the authors or simulatormanufacturer. Quantitative values are presented in Suns (0–1, 1–4, or80–110 times the intensity of the UV part of the AM 1.5G spectrum).
Analysis Energy & Environmental Science
Ope
n A
cces
s A
rtic
le. P
ublis
hed
on 0
5 Fe
brua
ry 2
018.
Dow
nloa
ded
on 0
4/04
/201
8 07
:29:
11.
Thi
s ar
ticle
is li
cens
ed u
nder
a C
reat
ive
Com
mon
s A
ttrib
utio
n 3.
0 U
npor
ted
Lic
ence
.View Article Online
This journal is©The Royal Society of Chemistry 2018 Energy Environ. Sci.
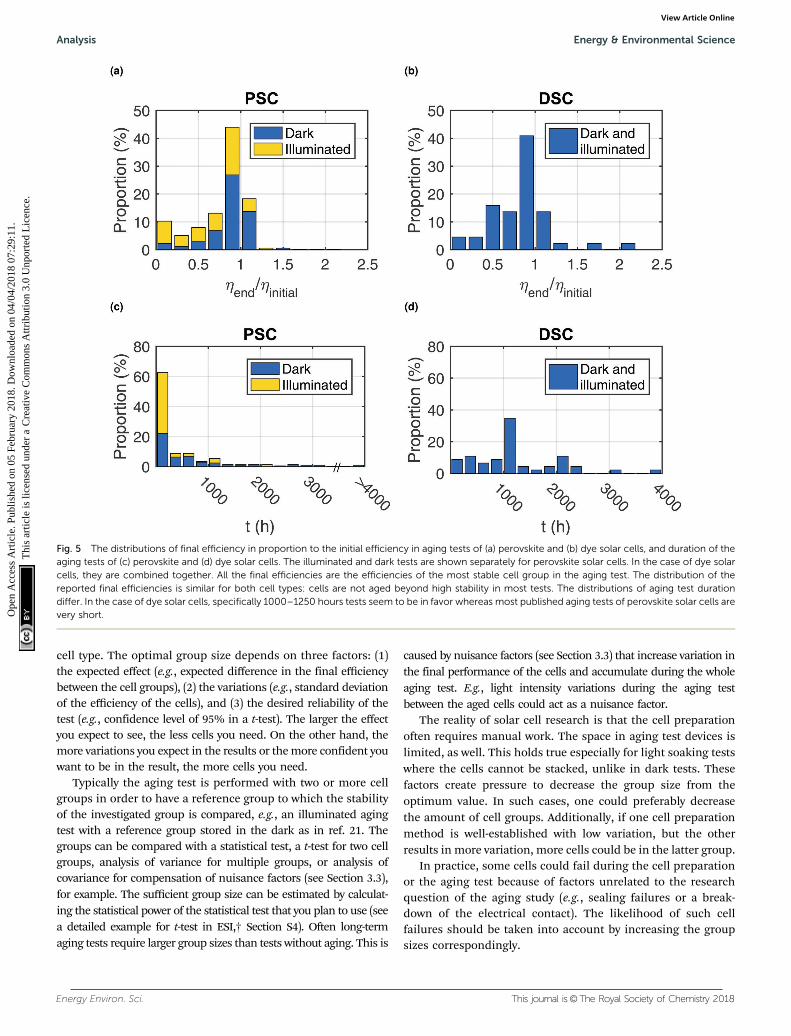
test design just like any test condition: depending on the aimsof the study, one selects a longer test (potentially with lowerfinal efficiency) or a shorter test (potentially with higherfinal efficiency). Fig. 5 illustrates the distribution of the finalefficiency and the duration of the aging tests under illuminationand in dark conditions for DSCs and PSCs. All the values representthe most stable cell group in the aging test. In the majority ofpublished aging tests of both cell types, the final efficiency remainsat 80–100% of the original efficiency (Fig. 5a and b), which could beregarded as stable. To get more information out of these studies, beit making certain aging mechanisms visible or comparing thestability of the cells with another cell type, exceeding the test periodof stable performance to the degradation phase would be valuable.A change of attitudes is needed in the planning and reporting ofaging tests. For example, measuring until a certain decreasedefficiency level has been reached instead of a fixed test duration,and declaring more clearly the aims of the aging test (e.g., the
comparison of cell types, demonstration of stability, investigationof degradation mechanisms) in the resulting article would befruitful. Presenting aging data beyond good stability should alsobe valued in the peer-review process and not considered a demerit.
Whereas the final efficiency distribution is rather similar forboth DSCs and PSCs, the distribution of aging test durationsshown in 12 and 13 varies. PSCs are typically aged for less than250 hours, whereas DSCs are aged for more than 1000 hours. Ashorter test is perhaps regarded as sufficient for PSCs that are atthe early stages of development with shorter lifetime expectations,whereas for DSCs with a longer history, the 1000 hours test hasbecome a standard.
Notably in comparison with dark tests, the majority ofilluminated perovskite aging tests are very short (Fig. 5c) andend up with more scattered final efficiency for the best cellgroup (Fig. 5a). This suggests that illumination remains asignificant stress factor for the PSCs, whereas dark tests aremore easily endured (although simultaneous analysis of all thetest conditions would be needed to confirm this hypothesis –which is out of the scope of this work). It is, however, clear thatour understanding of the aging of the PSCs would increase iflonger aging tests would be conducted more commonly, even ifthey would result in a lower final efficiency.
3 Principles of stability testing
In this section, we go through practical methods for achievingimproved quality of aging tests. We have also gathered a practicalchecklist for quality aging testing compiling the findings discussedin detail in the next sections (ESI,† Section S1).
3.1 Cell design according to the aims of the aging test
The aims of an aging test can be divided into being related toeither intrinsic or extrinsic stability of the cells. Intrinsic stabilityincludes the chemical and structural stability of the cells withimpurities consisting of those that are presented in the cell duringthe cell preparation, and extrinsic stability is the stability of thecells when external impurities can access the cell.3
Thus, intrinsic and extrinsic stability are closely linkedto the selection of the possible encapsulation for the cells.Encapsulation isolates the active components of the cell fromthe environment whereas open devices remain susceptibleto the incoming impurities, the loss of active cell materialsfrom the cell, and mechanical stress, such as bending orscratching of the cell. From the industrial viewpoint, encapsulatedcells resemble cells in a well-sealed solar panel, whereas opendevices bring information about the stability in case of a failedsealing. The perfectness of the encapsulation varies with themethod16–20 and should be confirmed to be sufficient for theplanned conditions.
3.2 How to determine the sufficient amount of test cells
Section 2 demonstrates that the group sizes in aging tests aregenerally small. In the extreme and unfortunately also the mostcommon case, the data are presented only for one cell of each
Fig. 4 The aging tests performed (a) in the dark and (b) under illuminationclassified based on the temperature and humidity level during the test. Thetests that do not specify the value (‘‘unknown’’), define the value asambient (‘‘ambient’’), or declare only the upper or lower boundaryvalue (‘‘halfbounded’’) are also listed. Qualitatively reported or unknowntemperature and humidity are common in aging tests which complicatesthe comparison of test results. See ESI,† Section S5 for more informationon the classification details.
Energy & Environmental Science Analysis
Ope
n A
cces
s A
rtic
le. P
ublis
hed
on 0
5 Fe
brua
ry 2
018.
Dow
nloa
ded
on 0
4/04
/201
8 07
:29:
11.
Thi
s ar
ticle
is li
cens
ed u
nder
a C
reat
ive
Com
mon
s A
ttrib
utio
n 3.
0 U
npor
ted
Lic
ence
.View Article Online
Energy Environ. Sci. This journal is©The Royal Society of Chemistry 2018
cell type. The optimal group size depends on three factors: (1)the expected effect (e.g., expected difference in the final efficiencybetween the cell groups), (2) the variations (e.g., standard deviationof the efficiency of the cells), and (3) the desired reliability of thetest (e.g., confidence level of 95% in a t-test). The larger the effectyou expect to see, the less cells you need. On the other hand, themore variations you expect in the results or the more confident youwant to be in the result, the more cells you need.
Typically the aging test is performed with two or more cellgroups in order to have a reference group to which the stabilityof the investigated group is compared, e.g., an illuminated agingtest with a reference group stored in the dark as in ref. 21. Thegroups can be compared with a statistical test, a t-test for two cellgroups, analysis of variance for multiple groups, or analysis ofcovariance for compensation of nuisance factors (see Section 3.3),for example. The sufficient group size can be estimated by calculat-ing the statistical power of the statistical test that you plan to use (seea detailed example for t-test in ESI,† Section S4). Often long-termaging tests require larger group sizes than tests without aging. This is
caused by nuisance factors (see Section 3.3) that increase variation inthe final performance of the cells and accumulate during the wholeaging test. E.g., light intensity variations during the aging testbetween the aged cells could act as a nuisance factor.
The reality of solar cell research is that the cell preparationoften requires manual work. The space in aging test devices islimited, as well. This holds true especially for light soaking testswhere the cells cannot be stacked, unlike in dark tests. Thesefactors create pressure to decrease the group size from theoptimum value. In such cases, one could preferably decreasethe amount of cell groups. Additionally, if one cell preparationmethod is well-established with low variation, but the otherresults in more variation, more cells could be in the latter group.
In practice, some cells could fail during the cell preparationor the aging test because of factors unrelated to the researchquestion of the aging study (e.g., sealing failures or a break-down of the electrical contact). The likelihood of such cellfailures should be taken into account by increasing the groupsizes correspondingly.
Fig. 5 The distributions of final efficiency in proportion to the initial efficiency in aging tests of (a) perovskite and (b) dye solar cells, and duration of theaging tests of (c) perovskite and (d) dye solar cells. The illuminated and dark tests are shown separately for perovskite solar cells. In the case of dye solarcells, they are combined together. All the final efficiencies are the efficiencies of the most stable cell group in the aging test. The distribution of thereported final efficiencies is similar for both cell types: cells are not aged beyond high stability in most tests. The distributions of aging test durationdiffer. In the case of dye solar cells, specifically 1000–1250 hours tests seem to be in favor whereas most published aging tests of perovskite solar cells arevery short.
Analysis Energy & Environmental Science
Ope
n A
cces
s A
rtic
le. P
ublis
hed
on 0
5 Fe
brua
ry 2
018.
Dow
nloa
ded
on 0
4/04
/201
8 07
:29:
11.
Thi
s ar
ticle
is li
cens
ed u
nder
a C
reat
ive
Com
mon
s A
ttrib
utio
n 3.
0 U
npor
ted
Lic
ence
.View Article Online

This journal is©The Royal Society of Chemistry 2018 Energy Environ. Sci.
3.3 Nuisance factors in aging tests
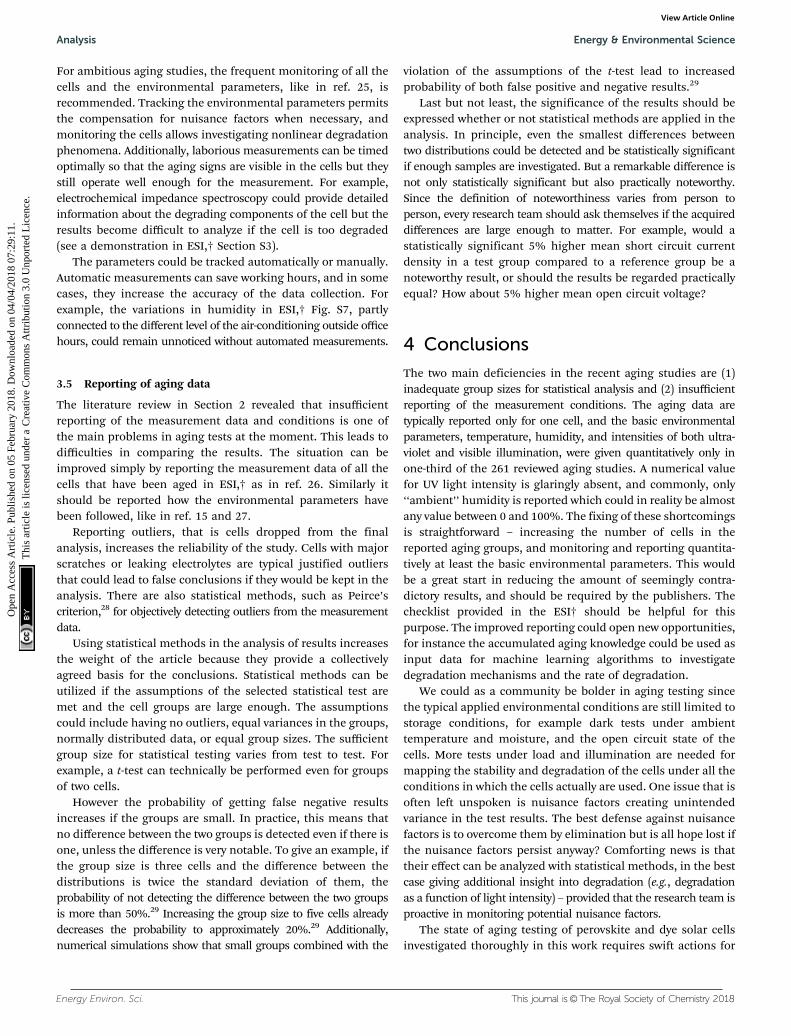
Nuisance factors affect the results of the aging test, althoughthey are not studied intentionally in the aging test. They createadditional variation – noise – in the results. As an example,Fig. 6 illustrates different illumination levels acting as a nuisancefactor of the post-aging cell efficiency. The increased noise isundesirable because the differences between the cell groups inaging tests could, in the worst case, even be completely coveredby the noise. There are two strategies for handling the nuisancefactors. They can be minimized or compensated for in the resultanalysis.
In the primary strategy, minimization, the cell preparationprocedure and the environmental conditions are ensured toremain constant between the cells and not to contain unexpectedfactors. A healthy dose of paranoia may be very helpful in this.If exercised, it does not significantly complicate or slow downthe work.
For example, the order in which the cells are preparedcan affect their performance: the components might adsorbcontamination during the cell preparation, and thus the cellsprepared first might have better stability than the later ones.Thus preparing and measuring different cell types in an alternatingfashion is a very easy way to prevent false positive and negativeresults with practically zero extra work. Regarding the nuisancefactors related to cell materials, different material batches mightresult in different stability, and even the cell assembly date mightaffect the results if ambient conditions (especially humidity) varygreatly from day to day. Therefore it is advisable to prepare all thecells during a short time period and when applicable from the samematerial batches. If that is not feasible, it would be worthwhileto have reference cells for each assembling session to verifyequal quality.
Aspects related to illumination are likely nuisance factors.The spectrum could affect the results of the aging test greatly,in the case of many cell configurations.1,22,23 Therefore, oneshould be aware of the spectrum of the light (especially if itcontains UV light) and the effects of possible filters on it. Thespatial variations of illumination intensity across the agingplatform could be tens of percent and still remain unnoticed
by the human eye because of the eye’s good intensity adaptivity.The most simple option to measure the spatial intensitydistribution is to use a photodiode that is sensitive to theapplied illumination spectrum. In our light soaking system,we record the light intensity for each cell separately, for exampleon a weekly basis, in addition to constant tracking of a few spots.Other significant environmental factors than intensity should alsobe followed during the aging test. Just stating ‘‘ambient’’ is notenough. To give an example, ESI,† Fig. S7 illustrates the indoor airhumidity varying greatly in both the short-term (between days) andlong-term (between seasons). These variations certainly affect theaging of moisture-sensitive unsealed devices.
Nuisance factors could remain significant even after they areminimized, their importance could be detected only after theaging test, or they might be impossible to control during thetest. In these cases, the alternative strategy is to compensate forthe most significant nuisance factor(s) after the aging testwith regression analysis or analysis of covariance (ANCOVA),for example. ANCOVA is used for determining if the groups aredifferent regardless of a covariate, that is, the nuisance factor(application example in ref. 22). The compensation is naturallypracticable only for nuisance factors that are measurable.
3.4 Measurements during aging tests
The measurements performed in the aging test should becapable of revealing the effects that are anticipated in thehypothesis. The IV curve measurement/characterization is usedfor tracking the stability of the cells, but its use in the analysisof degradation phenomena is very limited. Therefore, all butthe most simple aging tests require additional measurements.
The measurements should be selected and performed sothat they do not add unnecessary nuisance factors to the agingtest. Some tests, such as electrochemical impedance spectro-scopy (EIS) or IV cycling, could affect the electrochemical state ofthe cells and consequently the results of the following measure-ments of the same sample. Thus, the measurement sequenceshould be kept unchanged during the aging test.
Sometimes, a measurement can even accelerate or activatethe degradation of the cells. For example, measuring the IVcurve of the cells with metal substrates far to the reverse loadconditions can trigger corrosion. The corrosion reactions have acertain polarization after which corrosion occurs. Consequently,polarization can be used even as corrosion prevention but alsoto trigger it. Degradation reactions related to device polarizationhave also been observed in cells without metal electrodes.24 Asanother example, the cells could be so sensitive to UV lightthat the prolonged and repeated IV measurements under fullspectrum illumination could trigger cell degradation eventhough they might otherwise pass the aging test. The IV curve ofthe cell could be measured before and after the whole measurementsequence to confirm that the cells remain stable during themeasurements.
The measurements can be performed either only before andafter the aging test, or repeatedly during the aging test. Measuringthe cells only before and after the aging test saves working hoursbut gives limited information on the degradation phenomena.
Fig. 6 Illumination level is acting as a nuisance factor of the efficiency ofdye solar cells after 700 hours of aging under illumination22 because thepost-aging efficiencies form a line with negative slope with respect to theillumination intensity (measured separately for each cell). A reprintedderivative from ref. 22 under CC-BY license.
Energy & Environmental Science Analysis
Ope
n A
cces
s A
rtic
le. P
ublis
hed
on 0
5 Fe
brua
ry 2
018.
Dow
nloa
ded
on 0
4/04
/201
8 07
:29:
11.
Thi
s ar
ticle
is li
cens
ed u
nder
a C
reat
ive
Com
mon
s A
ttrib
utio
n 3.
0 U
npor
ted
Lic
ence
.View Article Online
Energy Environ. Sci. This journal is©The Royal Society of Chemistry 2018
For ambitious aging studies, the frequent monitoring of all thecells and the environmental parameters, like in ref. 25, isrecommended. Tracking the environmental parameters permitsthe compensation for nuisance factors when necessary, andmonitoring the cells allows investigating nonlinear degradationphenomena. Additionally, laborious measurements can be timedoptimally so that the aging signs are visible in the cells but theystill operate well enough for the measurement. For example,electrochemical impedance spectroscopy could provide detailedinformation about the degrading components of the cell but theresults become difficult to analyze if the cell is too degraded(see a demonstration in ESI,† Section S3).
The parameters could be tracked automatically or manually.Automatic measurements can save working hours, and in somecases, they increase the accuracy of the data collection. Forexample, the variations in humidity in ESI,† Fig. S7, partlyconnected to the different level of the air-conditioning outside officehours, could remain unnoticed without automated measurements.
3.5 Reporting of aging data
The literature review in Section 2 revealed that insufficientreporting of the measurement data and conditions is one ofthe main problems in aging tests at the moment. This leads todifficulties in comparing the results. The situation can beimproved simply by reporting the measurement data of all thecells that have been aged in ESI,† as in ref. 26. Similarly itshould be reported how the environmental parameters havebeen followed, like in ref. 15 and 27.
Reporting outliers, that is cells dropped from the finalanalysis, increases the reliability of the study. Cells with majorscratches or leaking electrolytes are typical justified outliersthat could lead to false conclusions if they would be kept in theanalysis. There are also statistical methods, such as Peirce’scriterion,28 for objectively detecting outliers from the measurementdata.
Using statistical methods in the analysis of results increasesthe weight of the article because they provide a collectivelyagreed basis for the conclusions. Statistical methods can beutilized if the assumptions of the selected statistical test aremet and the cell groups are large enough. The assumptionscould include having no outliers, equal variances in the groups,normally distributed data, or equal group sizes. The sufficientgroup size for statistical testing varies from test to test. Forexample, a t-test can technically be performed even for groupsof two cells.
However the probability of getting false negative resultsincreases if the groups are small. In practice, this means thatno difference between the two groups is detected even if there isone, unless the difference is very notable. To give an example, ifthe group size is three cells and the difference between thedistributions is twice the standard deviation of them, theprobability of not detecting the difference between the two groupsis more than 50%.29 Increasing the group size to five cells alreadydecreases the probability to approximately 20%.29 Additionally,numerical simulations show that small groups combined with the
violation of the assumptions of the t-test lead to increasedprobability of both false positive and negative results.29
Last but not least, the significance of the results should beexpressed whether or not statistical methods are applied in theanalysis. In principle, even the smallest differences betweentwo distributions could be detected and be statistically significantif enough samples are investigated. But a remarkable difference isnot only statistically significant but also practically noteworthy.Since the definition of noteworthiness varies from person toperson, every research team should ask themselves if the acquireddifferences are large enough to matter. For example, would astatistically significant 5% higher mean short circuit currentdensity in a test group compared to a reference group be anoteworthy result, or should the results be regarded practicallyequal? How about 5% higher mean open circuit voltage?
4 Conclusions
The two main deficiencies in the recent aging studies are (1)inadequate group sizes for statistical analysis and (2) insufficientreporting of the measurement conditions. The aging data aretypically reported only for one cell, and the basic environmentalparameters, temperature, humidity, and intensities of both ultra-violet and visible illumination, were given quantitatively only inone-third of the 261 reviewed aging studies. A numerical valuefor UV light intensity is glaringly absent, and commonly, only‘‘ambient’’ humidity is reported which could in reality be almostany value between 0 and 100%. The fixing of these shortcomingsis straightforward – increasing the number of cells in thereported aging groups, and monitoring and reporting quantita-tively at least the basic environmental parameters. This wouldbe a great start in reducing the amount of seemingly contra-dictory results, and should be required by the publishers. Thechecklist provided in the ESI† should be helpful for thispurpose. The improved reporting could open new opportunities,for instance the accumulated aging knowledge could be used asinput data for machine learning algorithms to investigatedegradation mechanisms and the rate of degradation.
We could as a community be bolder in aging testing sincethe typical applied environmental conditions are still limited tostorage conditions, for example dark tests under ambienttemperature and moisture, and the open circuit state of thecells. More tests under load and illumination are needed formapping the stability and degradation of the cells under all theconditions in which the cells actually are used. One issue that isoften left unspoken is nuisance factors creating unintendedvariance in the test results. The best defense against nuisancefactors is to overcome them by elimination but is all hope lost ifthe nuisance factors persist anyway? Comforting news is thattheir effect can be analyzed with statistical methods, in the bestcase giving additional insight into degradation (e.g., degradationas a function of light intensity) – provided that the research team isproactive in monitoring potential nuisance factors.
The state of aging testing of perovskite and dye solar cellsinvestigated thoroughly in this work requires swift actions for
Analysis Energy & Environmental Science
Ope
n A
cces
s A
rtic
le. P
ublis
hed
on 0
5 Fe
brua
ry 2
018.
Dow
nloa
ded
on 0
4/04
/201
8 07
:29:
11.
Thi
s ar
ticle
is li
cens
ed u
nder
a C
reat
ive
Com
mon
s A
ttrib
utio
n 3.
0 U
npor
ted
Lic
ence
.View Article Online
This journal is©The Royal Society of Chemistry 2018 Energy Environ. Sci.
improvements. The whole community should collaborate in theprocess. Thus, we suggest a series of international summits fordetermining the definitive standards of stability testing of thesecells. This move could greatly enhance the progress in stabilityresearch in future.
Authors contributions
A. T. is the corresponding author who made the literaturereview, compiled the principles of improving stability testing,and wrote the article. All authors discussed the results andimplications, and edited the article. A. T. and S. L. performed theair humidity measurement presented in ESI.† K. M. instructed thework and P. L. supervised it.
Conflicts of interest
The authors declare no conflicts of interest.
Acknowledgements
The authors thank Tiina and Antti Herlin Foundation, KoneFoundation, and the Academy of Finland (project SOLID,271081) for the financial support. The authors thank HeidiHenrickson for valuable comments on the article.
References
1 A. Hinsch, W. Veurman, H. Brandt, K. Flarup Jensen andS. Mastroianni, ChemPhysChem, 2014, 15, 1076–1087.
2 S. G. Hashmi, M. Ozkan, J. Halme, S. M. Zakeeruddin,J. Paltakari, M. Gratzel and P. D. Lund, Energy Environ.Sci., 2016, 9, 2453–2462.
3 M. Asghar, J. Zhang, H. Wang and P. Lund, RenewableSustainable Energy Rev., 2017, 77, 131–146.
4 M. A. Green, K. Emery, Y. Hishikawa, W. Warta, E. D. Dunlop,D. H. Levi and A. W. Y. Ho-Baillie, Prog. Photovoltaics Res. Appl.,2017, 25, 3–13.
5 G. Griffini, F. Bella, F. Nisic, C. Dragonetti, D. Roberto, M. Levi,R. Bongiovanni and S. Turri, Adv. Energy Mater., 2015, 5, 1401312.
6 S. G. Hashmi, A. Tiihonen, D. Martineau, M. Ozkan, P. Vivo,K. Kaunisto, V. Ulla, S. M. Zakeeruddin and M. Gratzel,J. Mater. Chem. A, 2017, 5, 4797–4802.
7 Y. Yang and J. You, Nature, 2017, 544, 155–156.8 T. Leijtens, G. E. Eperon, S. Pathak, A. Abate, M. M. Lee and
H. J. Snaith, Nat. Commun., 2013, 4, 2885.9 Editorial, Nat. Mater., 2015, 14, 1073.
10 V. Sharma and S. Chandel, Renewable Sustainable EnergyRev., 2013, 27, 753–767.
11 K. Branker, M. Pathak and J. Pearce, Renewable SustainableEnergy Rev., 2011, 15, 4470–4482.
12 M. O. Reese, S. A. Gevorgyan, M. Jørgensen, E. Bundgaard,S. R. Kurtz, D. S. Ginley, D. C. Olson, M. T. Lloyd, P. Morvillo,E. A. Katz, A. Elschner, O. Haillant, T. R. Currier, V. Shrotriya,M. Hermenau, M. Riede, K. R. Kirov, G. Trimmel, T. Rath,O. Inganas, F. Zhang, M. Andersson, K. Tvingstedt, M. Lira-Cantu, D. Laird, C. McGuiness, S. J. Gowrisanker, M. Pannone,M. Xiao, J. Hauch, R. Steim, D. M. DeLongchamp, R. Rosch,H. Hoppe, N. Espinosa, A. Urbina, G. Yaman-Uzunoglu,J.-B. Bonekamp, A. J. van Breemen, C. Girotto, E. Voroshaziand F. C. Krebs, Sol. Energy Mater. Sol. Cells, 2011, 95,1253–1267.
13 M. Berginc, U. O. Krasovec and M. Topic, Sol. Energy Mater.Sol. Cells, 2014, 120, 491–499.
14 S. Mastroianni, A. Lanuti, S. Penna, A. Reale, T. M. Brown,A. Di Carlo and F. Decker, ChemPhysChem, 2012, 13, 2925–2936.
15 F. Bella, G. Griffini, J.-P. Correa-Baena, G. Saracco, M. Gratzel,A. Hagfeldt, S. Turri and C. Gerbaldi, Science, 2016, 354,203–206.
16 J. Macaira, L. Andrade and A. Mendes, Sol. Energy Mater. Sol.Cells, 2016, 157, 134–138.
17 D. Ivanou, R. Santos, J. Macaira, L. Andrade and A. Mendes,Sol. Energy, 2016, 135, 674–681.
18 T. J. Wilderspin, F. D. Rossi and T. M. Watson, Sol. Energy,2016, 139, 426–432.
19 Q. Dong, F. Liu, M. K. Wong, H. W. Tam, A. B. Djurisic,A. Ng, C. Surya, W. K. Chan and A. M. C. Ng, ChemSusChem,2016, 9, 2597–2603.
20 F. Matteocci, L. Cina, E. Lamanna, S. Cacovich, G. Divitini,P. A. Midgley, C. Ducati and A. D. Carlo, Nano Energy, 2016,30, 162–172.
21 S.-W. Lee, S. Kim, S. Bae, K. Cho, T. Chung, L. E. Mundt,S. Lee, S. Park, H. Park and M. C. Schubert, et al., Sci. Rep.,2016, 6, 38150.
22 A. Tiihonen, K. Miettunen, S. Rendon, D. Mavrynsky,J. Halme, R. Leino and P. Lund, J. Electrochem. Soc., 2015,162, H661–H670.
23 W. Li, W. Zhang, S. Van Reenen, R. J. Sutton, J. Fan, A. A.Haghighirad, M. B. Johnston, L. Wang and H. J. Snaith, EnergyEnviron. Sci., 2016, 9, 490–498.
24 T. Handa, D. M. Tex, A. Shimazaki, T. Aharen, A. Wakamiyaand Y. Kanemitsu, Opt. Express, 2016, 24, A917–A924.
25 Y. Reyna, M. Salado, S. Kazim, A. Perez-Tomas, S. Ahmadand M. Lira-Cantu, Nano Energy, 2016, 30, 570–579.
26 M. Salado, J. Idigoras, L. Calio, S. Kazim, M. K. Nazeeruddin,J. A. Anta and S. Ahmad, ACS Appl. Mater. Interfaces, 2016, 8,34414–34421.
27 Y. Dkhissi, S. Meyer, D. Chen, H. C. Weerasinghe, L. Spiccia,Y.-B. Cheng and R. A. Caruso, ChemSusChem, 2016, 9,687–695.
28 S. M. Ross, J. Eng. Technol., 2003, 20, 38–41.29 J. C. De Winter, Pract. Assess., Res. Eval., 2013, 18, 10.
Energy & Environmental Science Analysis
Ope
n A
cces
s A
rtic
le. P
ublis
hed
on 0
5 Fe
brua
ry 2
018.
Dow
nloa
ded
on 0
4/04
/201
8 07
:29:
11.
Thi
s ar
ticle
is li
cens
ed u
nder
a C
reat
ive
Com
mon
s A
ttrib
utio
n 3.
0 U
npor
ted
Lic
ence
.View Article Online