republic of kenya ministry of environment and mineral ... materials/neaps/embu... · ministry of...
TRANSCRIPT

1
REPUBLIC OF KENYAMINISTRY OF ENVIRONMENT AND MINERAL
RESOURCES
EMBU DISTRICTENVIRONMENT ACTION PLAN
2009-2013

i
EXECUTIVE SUMMARYThe Environmental Management and Coordination Act 1999 provides for the
formulation of the District Environment Action Plans every five years. This is the first
District Environment Action Plan (DEAP) for Embu District. The preparation of this
DEAP was done through a participatory process involving the public, private and civil
sectors. Further, this document has incorporated salient issues from all administrative
units in the District.
The DEAP highlights priority environmental issues requiring action to mitigate
increasing environmental degradation for the District to achieve sustainable
development. The report is divided into eight chapters. Chapter 1 gives the challenges of
sustainable development and describes the rationale for and preparatory process of the
DEAP. It presents the district’s main profile covering the physical features, demographic
and agro-ecological zones.
Chapter 2 describes the District’s Environment and Natural Resources of Land, Water,
Biodiversity, rare, threatened and invader species, wetlands and agriculture, livestock and
fisheries. For each resource, major environmental issues, challenges and proposed
interventions have been identified.
Chapter 3 entails the human settlements and infrastructure in Kitui District covering
situation analysis, challenges and proposed interventions. Environmental challenges
addressed include; waste management, sanitation, pollution, diseases, land use, demand
for water, energy, materials for construction, land and wetlands degradation, policy and
legislation..
Chapter 4 addresses environmental aspects in trade, industry, tourism and services
sectors. The key issues under this chapter are high pollution levels from production and
consumption sectors including weak enforcement of relevant legislations.
Chapter 5 discusses environmental hazards and disasters. The major hazards covered
include those related to climate/weather and drought, flood, fire, galleys, disease
outbreaks like malaria, and invasive species. Mitigations measures have been proposed
for implementation.
Environmental information, networking and technology are discussed in chapter six. It
emerges that environmental information and networking technology have continued to

ii
receive scanty attention. In order to achieve sustainable environmental management, it is
necessary to focus on raising awareness and enhancing public participation at all levels.
Governance, Policy and Legal Framework as well as Institutional arrangements are
covered in chapter Seven. The key issues addressed include, non-compliance with
environmental regulations, conflicting laws and regulations, delays in approving
EIA/EA, high cost of environment impact assessment and audit experts for small
projects, weak enforcement of environment laws, lack of environment standards and
regulations, inactive District Environment Committee. Chapter 8 brings out the
implementation Matrix.

iii
FOREWORDThe 1992 Earth Summit held in Rio de Janeiro came up with various recommendations,
among them Agenda 21, a Global Environmental Action Plan. The theme of the
Summit focused on how nations could attain sustainable development. The Government
of Kenya embraced this idea by developing the first National Environment Action Plan
(NEAP) in 1994.
Since independence, Kenya has continued to demonstrate her commitment to
environmental management through various initiatives, among them the National
Development Plans of 1974 and the National Environment Action Plan of 1994.
Further, there have been a number of sectoral policies on environment in fields such as
Agriculture, Livestock, Water, Energy, Food, Land, Wildlife, Forest, Industry, Trade,
Arid Lands, Disaster Management and the Draft Sessional Paper No. 6 of 1999 on
Environment and Development.
The Environmental Management and Coordination Act (EMCA, 1999) provides for the
integration of environmental concerns in national policies, plans, programmes and
projects. In this regard, EMCA 1999 provides for the formulation of National, Provincial
and District Environment Action Plans every five years.
Environmental Action Planning is a tool that aims at integrating environmental concerns
into development planning. The process followed in preparing this DEAP was
participatory, involving various stakeholders from institutions and sectors, including the
public, private, NGOs and local communities at District and Divisional levels. These
consultative meetings provided the basis also for formulation of the PEAP and finally
the National Environment Action Plan.
The DEAP addresses environmental issues from various sectors in an integrated manner
and discusses their significance in development planning. It proposes a strategy for
achieving sustainable development in line with Kenya’s quest to meet the Millennium
Development Goals (MDGs) Vision 2030 and Medium Term Plan (MTP 2008-2012).
The Plan has brought out a number of proposed interventions, legal and institutional
framework to be incorporated into sectoral development plans and programmes. Its
implementation will be monitored by the DEC and will be reflected in the State of the
Environment Reports.

iv
The preparation of the DEAPs for Embu owes much to the technical and financial
assistance provided by the NEMA. This support, which included innovative community
and civil society consultations, facilitation of DEC meetings as well as final publication
cost is hereby gratefully acknowledged.
I wish to underscore that the 2009-2013 DEAP report is a broad-based strategy that will
enable the District attain sustainable development as envisaged in Vision 2030
Dr. Ayub Macharia (PhD),
Ag, DIRECTOR GENERAL
NATIONAL ENVIRONMENT MANAGEMENT AUTHORITY

v
ACKNOWLEDGEMENTOn behalf of the National Environment Management Authority (NEMA) ,I would like
to thank the Embu District Commissioner , who is also the chairman District
Environment Committee (DEC) for spearheading the preparation process for this
District Environment Action Plan,(2009-2013). I also wish to thank most sincerely the
District Environment Committee members and the District Environmental Action Plan
Technical Committee members for their invaluable inputs and approval of this
environmental action plan.
I also acknowledge the contribution of the members of the local communities through
NGOs, CBOs from the district who actively participated in the identification and
prioritization of the environmental issues which formed part of this document.
NEMA also acknowledges the Provincial Director of Environment (Eastern) and
District Environment Officer (Embu), for their insights and dedication to this process.
Lastly, I extend my gratitude in one way or another to all those who contributed towards
the finalization of this District Environmental Action Plan.
Dr. Kennedy I. Ondimu
DIRECTOR, ENVIRONMENTAL PLANNING
& RESEARCH CO-ORDINATION
vi
TABLE OF CONTENTSEXECUTIVE SUMMARY ..................................................................................................................I
FOREWORD......................................................................................................................................III
ACKNOWLEDGEMENT ...................................................................................................................V
TABLE OF CONTENTS....................................................................................................................VI
LIST OF TABLES ........................................................................................................................... VIII
LIST OF FIGURES ............................................................................................................................IX
ABBREVIATIONS AND ACRONYMS ............................................................................................X
CHAPTER ONE ..................................................................................................................................1
1.0 INTRODUCTION ..........................................................................................................................1
1.1 PREAMBLE ...................................................................................................................................1
1.2 CHALLENGES OF SUSTAINABLE DEVELOPMENT ..................................................................2
1.3 EMBU DEAP SCOPE ....................................................................................................................3
1.4 EMBU DISTRICT PROFILE..........................................................................................................4
1.5 POPULATION SIZE AND DISTRIBUTION ..................................................................................7
1.6 SOCIAL, CULTURAL, AND ECONOMIC CHARACTERISTICS ..................................................8
CHAPTER TWO ...............................................................................................................................13
2.0 ENVIRONMENT AND NATURAL RESOURCES ........................................................................13
2.1 SOILS AND LAND .......................................................................................................................13
2.2 AGRICULTURE, LIVESTOCK AND FISHERIES .......................................................................14
2.3. FISHERIES RESOURCES ..........................................................................................................16
2.4 WATER RESOURCES..................................................................................................................17
2.5 FORESTRY AND WILDLIFE RESOURCES ................................................................................18
2.6 WILDLIFE ...................................................................................................................................20
2.7 ENERGY SECTOR .......................................................................................................................22
CHAPTER THREE ...........................................................................................................................24
3.0 HUMAN SETTLEMENTS AND INFRASTRUCTURE..................................................................24
3.1 HUMAN SETTLEMENTS ...................................................................................................................24
3.2. RURAL AND URBAN HOUSING TYPES..............................................................................................24
3.3 COMMUNICATION NETWORKS ...............................................................................................29

vii
CHAPTER FOUR..............................................................................................................................32
4.0 INDUSTRIAL, TRADE AND SERVICES......................................................................................32
4.1. TRADE ........................................................................................................................................32
4.2 INDUSTRY...................................................................................................................................33
4.3 TOURISM ....................................................................................................................................35
4.4 MINING .......................................................................................................................................36
4.5 SERVICES SECTOR ....................................................................................................................37
CHAPTER FIVE ...............................................................................................................................38
5.0 ENVIRONMENTAL HAZARDS AND DISASTERS ......................................................................38
5.1 EXTENT AND TRENDS OF ENVIRONMENTAL HAZARDS AND DISASTERS ..............................................38
CHAPTER SIX..................................................................................................................................39
6.0. ENVIRONMENTAL EDUCATION AND TECHNOLOGIES ......................................................39
6.1. STATUS OF ENVIRONMENTAL EDUCATION.........................................................................39
6.2. PUBLIC AWARENESS AND PARTICIPATION .........................................................................40
6.3. TECHNOLOGIES .......................................................................................................................40
6.4. ENVIRONMENTAL INFORMATION SYSTEMS ........................................................................41
6.5. INDIGENOUS KNOWLEDGE ...................................................................................................42
CHAPTER SEVEN ...........................................................................................................................43
7.0 ENVIRONMENT GOVERNANCE AND INSTITUTIONAL FRAMEWORKS...............................43
7.1 OVERVIEW..................................................................................................................................43
7.2. STATUS OF ENVIRONMENTAL GOVERNANCE AND INSTITUTIONAL ARRANGEMENT .43
7.4. REGULATORY INSTRUMENTS.................................................................................................44
7.5. MULTILATERAL ENVIRONMENTAL AGREEMENTS (MEAS) ................................................45
CHAPTER EIGHT ............................................................................................................................47
8.0 IMPLEMENTATION STRATEGY ................................................................................................47
8.1 OVERVIEW .....................................................................................................................................47
8.2 MONITORING AND EVALUATION............................................................................................47
REFERENCES ..................................................................................................................................54

viii
LIST OF TABLESTABLE 1: AGRO-ECOLOGICAL ZONES IN EMBU DISTRICT......................................................................................... 6TABLE 2: SHOWS THE DISTRICT DEMOGRAPHIC STATISTICS ..................................................................................... 7TABLE 3: STATUS OF FISHERIES RESOURCES......................................................................................................... 16TABLE 4: TYPES AND STATUS OF FORESTS.............................................................................................................. 19TABLE 5: EDUCATIONAL FACILITIES IN THE DISTRICT .......................................................................................... 30TABLE 6 : IMPLEMENTATION MATRIX.................................................................................................................... 48

ix
LIST OF FIGURESFIGURE 1: LOCATION OF EMBU DISTRICT ................................................................................................................ 4

x
ABBREVIATIONS AND ACRONYMSASALs -Arid and Semi Arid Lands
UNCED -United Nations Conference on Environment and Development
EMCA -Environment Management and Coordination Act
NGO -Non-Governmental Organization
CBO -Community Based Organization
NEMA National Environment Management Authority
NEAP -National Environment Action Plan
PRSP -Poverty Reduction Strategy Paper
ERSW&EC -Economic Recovery Strategy for Wealth and Employment Creation
PDPS - Physical Development Plans
NDP -National Development Plan
UNFCCC -United Nations Framework Convention on Climate Change
UNCBD -United Nations Convention on Biological Diversity
UNCCD -United Nations Convention to Combat Desertification
PIC -Rotterdam Convention on Prior Informed Consent
NEPAD New Partnership for African Development
MDGs -Millennium Development Goals
WSSD -World Summit Sustainable Development
PEP - Poverty Eradication Programme
MEAs -Multilateral Environmental Agreements
EAC -East African Community
UN -United Nations
IGAD -Intergovernmental Authority on Drought and Development
SACCO -Saving and Credit Cooperative Society
HIV/AIDS -Human Immunodeficiency Virus/ Acquired Immune deficiency
Syndrome
FYM -Financial Yield Management
GM -Guarantee Minimums
GMR -Guarantee Minimum Returns
LH -Lower Highland
LH1 -Lower Highland 1
UM -Upper Midland
UM2 - Upper Midland 2

xi
UM3 -Upper Midland 3
UM4 -Upper Midland 4
LM -Lower Midland
MENR Ministry of Environment and Natural Resources
KEWI -Kenya Water Institute
DFEO - District Forestry Extension Officer
NRM -Natural Resources Management
KWS -Kenya Wildlife Services
FD -Forest Department
GOK -Government of Kenya
DEO -District Environment Officer
DALEO -District Agriculture and Livestock Extension Officer
IUCN International Union for Conservation of Nature
SOE State of Environment
NRC Non-esident Cultivation
NHC National Housing Corporation
URTI Upper Respiratory Tract Infection
GDP Gross Domestic Product
KCC Kenya Creameries Cooperatives
SMES Small and Medium Enterprises
BOD Biological Oxygen Demand
ICT Information and Communication Technology
EIA Environmental Impact Assessment
EA Environmental Audit
KARI Kenya Agricultural Research Institute
MOA Ministry of Agriculture
MOW&I Ministry of Water and Irrigation
MKEPP Mt. Kenya East Pilot Project
IK Indigenous Knowledge
NEC National Environment Council
PEC Provincial Environment Committee
DEC District Environment Committee
SERC Standards, Enforcement and Review Committee
NEAP National Environment Action Plan

xii
TAC Technical Advisory Committee
NET National Environment Tribunal
PCC Public Complaints Committee
IFAD International Fund for Agricultural Development
USAID United States Agent for International Development
GTZ Germany International Cooperation Agent
FINIDA Finland International Development Agent
GEF Global Environment Facility
SGP Small Grants Programme of UNDP
COMPACT Community Management of Protected Areas Conservation
KTDA Kenya Tea Development Authority

1
CHAPTER ONE1.0 INTRODUCTION
1.1 PREAMBLE
The United Nations Conference on Environment and Development (UNCED)
commonly known as the Earth Summit held in Rio de Janeiro in 1992 aimed at
improving the global environment, while ensuring that economic and social concerns are
integrated into development planning. The Conference underscored the need to plan for
sustainable socio-economic development by integrating environmental concerns into
development through adopting and preparing appropriate policies, plans, programmes
and projects. The Conference agreed on the guiding principles and a global plan of action
(Global Environmental Action Plan) for sustainable development commonly called Agenda
21.
Sustainable development is defined as “development that meets the needs of the present
generation without compromising the ability of future generations to meet their own
needs”. Development is also said to be sustainable if it meets ecological, economic and
equity needs. The process of attaining sustainable development calls for the integration
of environmental considerations at all levels of decision making in development planning
and implementation of programmes and projects. The theme of the Summit was on how
nations could attain the sustainable development objective. The Government of Kenya
embraced this noble idea when it developed the first National Environment Action Plan
(NEAP) in 1994.
The country also prepared the National Development Plan (1994-97) that ensured that
there was not only a chapter on Environment and Natural Resources but also that
environmental concerns were integrated in all the chapters of the Development Plan.
Environmental planning was anchored in EMCA, 1999, which provides for the
integration of environmental concerns into national policies, plans, programmes and
projects. In this regard, EMCA provides for the formulation of National, Provincial and
District Environment Action Plans every five years.
1.1.1 EMCA, 1999 Provision On Environmental Planning
The Act, requires that every District Environment Committee (DEC) shall every five
years prepare a District Environment Action Plan in respect of the district for which it is
appointed and shall submit such plan to the chairman of the Provincial Environment

2
Action Plan Committee for incorporation into the Provincial Environment Action Plan
as provided for under Section 39 of EMCA, 1999.
1.1.2 Environmental Action Planning Process
DEAP Methodology
District environmental action planning began with the capacity building of the DEAP
Secretariat comprising of District Water Officer, District Development Officer (DDO)
and District Environment Officer (DEO) on DEAP methodology. Subsequently, the
District Environment Committee gazetted in 2003 constituted the District Environment
Action Planning Committee comprising lead agencies and representatives from other
stakeholders, chaired by the DDO and the DEO as the Secretary. Once the DEAP draft
was ready it was tabled before the DEC who approved it for submission to the
Provincial Environment Committee for inclusion in the Provincial Environment Action
Plan (PEAP).
Objectives of District Environment Action PlansThe objectives of District Environment Action Planning are to:
Determine major environmental issues and challenges facing the district
Identify environmental management opportunities
Create synergy and harmony in environmental planning
Integrate environmental concerns into social, economic planning and
development of the district
Formulate appropriate environmental management strategies specific to the
district
1.2 CHALLENGES OF SUSTAINABLE DEVELOPMENT
The economy of the district depend on natural resources where majority of the
population live in the rural areas and subsequently deriving their livelihoods from natural
resources. Economic activities undertaken in the district from natural resources include
agriculture, industry, water, energy, trade and quarrying. These resources are faced with
threat due to over reliance on them. The increasing population makes the situation
worse.
Poverty is a major issue in the district. It leads to over use and destruction of the
environment as poor people struggle to get daily livelihood as opposed to long-term
environmental sustainability. This phenomenon is counteractive in the sense that as the

3
resources so destroyed is diminished; the population will still require resources. There
exists a close link between poverty and environment such that fighting poverty leads to
improved environmental conditions.
Rapid urbanization has led to the development of slums in most urban areas. This has
been worsened by rural urban migration resulting in; health deterioration, loss of
biodiversity, water pollution and encroachment of fragile areas. Sanitation has also
deteriorated coupled with widespread accumulation of wastes and poor disposal of
effluents resulting in increased respiratory and waterborne diseases.
Poor management of plantation forests led to the imposition of the ban on shamba
system and subsequent loss of livelihood of communities. This has led to increased
poverty and creation of slums/squatter villages in the tea/coffee zones. The displaced
communities in turn are now encroaching on the forest natural resources or migrating to
the drier areas.
Intensification of agricultural production in the tea and coffee zones, with subsequent
increase in use of fertilizers and pesticides has increased eutrophication and pollution of
water bodies.
The pollution of rivers has health implications on the people with subsequent increase in
water borne diseases and morbidity.
An increase in migration of people from the coffee zone to the lower zones has
increased pressure on the marginal areas leading to environmental degradation.
There is also widespread encroachment to ecologically sensitive areas, including
cultivating of river frontage, reclamation of wetlands, and cultivation of trust lands hills,
overgrazing and charcoal burning.
1.3 EMBU DEAP SCOPE
The preparation of the Embu DEAP was aligned with Vision 2030 and the Midterm
Plan 2008-2012. It covers the period 2009-2013 and will be revised after five years as
directed by EMCA (1999). The DEAP will be monitored by the annual preparation of
the State of Environment Reports. The environmental indicators that have been
developed in the implementation matrix will be monitored by the respective lead
agencies on an annual basis and incorporated in the annual State of Environment
Reports. The National Steering Committee and the National Environment Action

4
Planning Committee have approved the indicators. The DEAP has been subjected to
stakeholder meetings at District level.
1.4 EMBU DISTRICT PROFILE
1.4.1 Geographical Location
Embu district is one of the thirteen districts in Eastern Province (Figure1) covering an
area of 708 km² (with Mt. Kenya Forest Reserve and Mt. Kenya National Park occupying
210.2 km² which is about 30% and uninhabited) It borders Mbeere District to the east
and south east, Kirinyaga District to the West and Meru South District to the North. The
District lies approximately between latitudes 0°8' and 0° 35' south and longitudes 37°19'
and 37°42' east.
Figure 1: Location of Embu district

5
Embu district is divided into five administrative divisions, namely; Central, Manyatta,
Nembure, Runyenjes, and Kyeni. There are 15 locations and 52 sub-locations.
Manyatta Division is the largest occupying 208 km², followed by Runyenjes occupying
186 km², Kyeni occupying 139 km² and Nembure occupying 111km2. Central Division is
the smallest of all, occupying 64km2. The District Headquarters is located in Embu town,
which is in Central Division.
There are two parliamentary electoral constituencies namely; Manyatta (covering central
and Manyatta divisions, and Kithimu location in Nembure division) and Runyenjes
constituency (covering Kyeni and Runyenjes division, Makengi location in Nembure
Division and Gaturi North location in Manyatta Division). The district has three local
authorities namely: Embu Municipal council, Runyenjes municipal council and Embu
county council
1.4.2 Climate and Physical Features
Highlands, midlands and other topographical features like hills and valleys, typical of
Kenya’s Eastern Highlands, characterize the landscape of the District. Altitude varies
between 910 and 4500metres above sea level. The upper parts of the district (parts of
Kyeni, Manyatta and Runyenjes Divisions) fall between 1500 to 4500metres. The middle
parts covering Nembure and Central Divisions fall between 1200 to 1500metres.
The district is drained by four major rivers, namely Thuchi, Kii, Rupingazi (with
Kapingazi as a tributary) and Ena, all of which flow in a South East direction. The
Kapingazi and Rupingazi are intensely used for domestic water and for irrigation.
The highlands are found in areas whose altitude range from about 1500 to 4500 meters.
The only hills n the district are Karwe and Maranga
1.4.3 Rainfall
The annual rainfall ranges from 2200-2500mm to less than 800mm in the lower zones
down at the eastern end of Kyeni and Runyenje’s Divisions. Rainfall and altitudes largely
determine land use. The wide range of altitude gives the District distinct agro-ecological
zones. The South Eastern part receives 1,250 to 2,500mm of rainfall while the lowlands
on the leeward side to the north and to the East receive unreliable rains of between 400-
1,000mm. Annual average rainfall is 700mm. The rainfall in the District is bimodal, with
long rains occurring from mid-March to May, and short rains from October to
December.
6
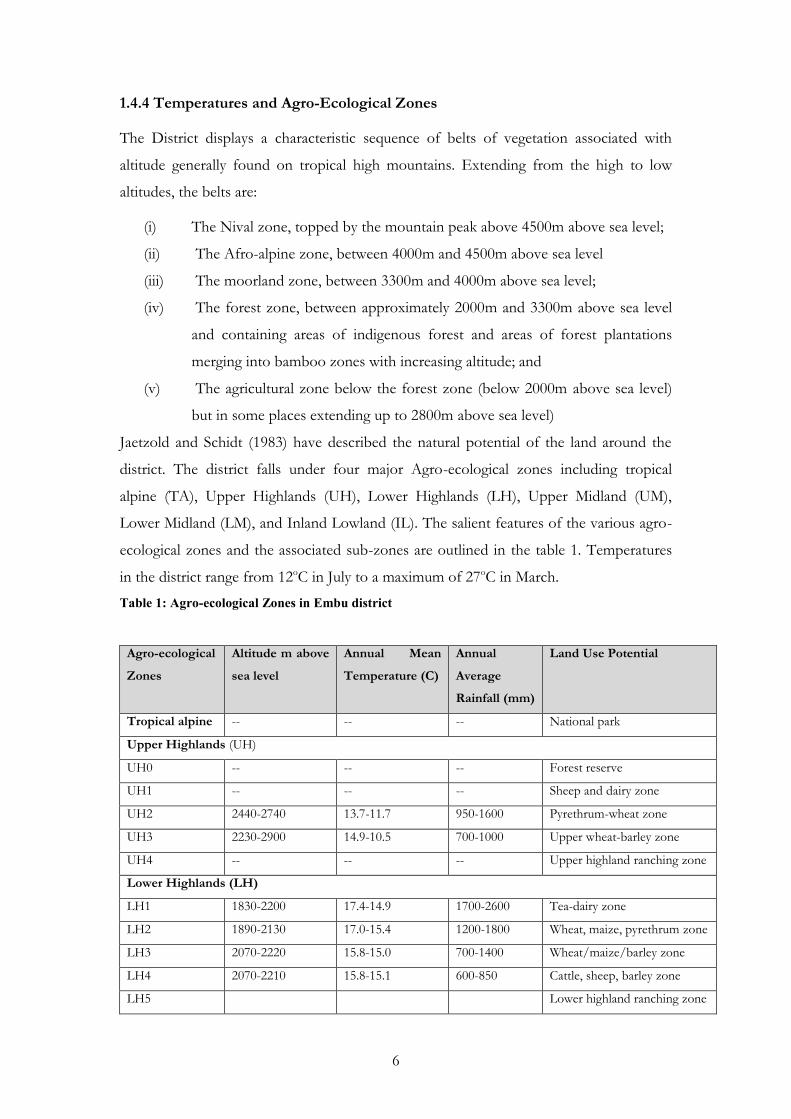
1.4.4 Temperatures and Agro-Ecological Zones
The District displays a characteristic sequence of belts of vegetation associated with
altitude generally found on tropical high mountains. Extending from the high to low
altitudes, the belts are:
(i) The Nival zone, topped by the mountain peak above 4500m above sea level;
(ii) The Afro-alpine zone, between 4000m and 4500m above sea level
(iii) The moorland zone, between 3300m and 4000m above sea level;
(iv) The forest zone, between approximately 2000m and 3300m above sea level
and containing areas of indigenous forest and areas of forest plantations
merging into bamboo zones with increasing altitude; and
(v) The agricultural zone below the forest zone (below 2000m above sea level)
but in some places extending up to 2800m above sea level)
Jaetzold and Schidt (1983) have described the natural potential of the land around the
district. The district falls under four major Agro-ecological zones including tropical
alpine (TA), Upper Highlands (UH), Lower Highlands (LH), Upper Midland (UM),
Lower Midland (LM), and Inland Lowland (IL). The salient features of the various agro-
ecological zones and the associated sub-zones are outlined in the table 1. Temperatures
in the district range from 12oC in July to a maximum of 27oC in March.Table 1: Agro-ecological Zones in Embu district
Agro-ecologicalZones
Altitude m abovesea level
Annual MeanTemperature (C)
AnnualAverageRainfall (mm)
Land Use Potential
Tropical alpine -- -- -- National park
Upper Highlands (UH)
UH0 -- -- -- Forest reserve
UH1 -- -- -- Sheep and dairy zone
UH2 2440-2740 13.7-11.7 950-1600 Pyrethrum-wheat zone
UH3 2230-2900 14.9-10.5 700-1000 Upper wheat-barley zone
UH4 -- -- -- Upper highland ranching zone
Lower Highlands (LH)
LH1 1830-2200 17.4-14.9 1700-2600 Tea-dairy zone
LH2 1890-2130 17.0-15.4 1200-1800 Wheat, maize, pyrethrum zone
LH3 2070-2220 15.8-15.0 700-1400 Wheat/maize/barley zone
LH4 2070-2210 15.8-15.1 600-850 Cattle, sheep, barley zone
LH5 Lower highland ranching zone
7
Agro-ecologicalZones
Altitude m abovesea level
Annual MeanTemperature (C)
AnnualAverageRainfall (mm)
Land Use Potential
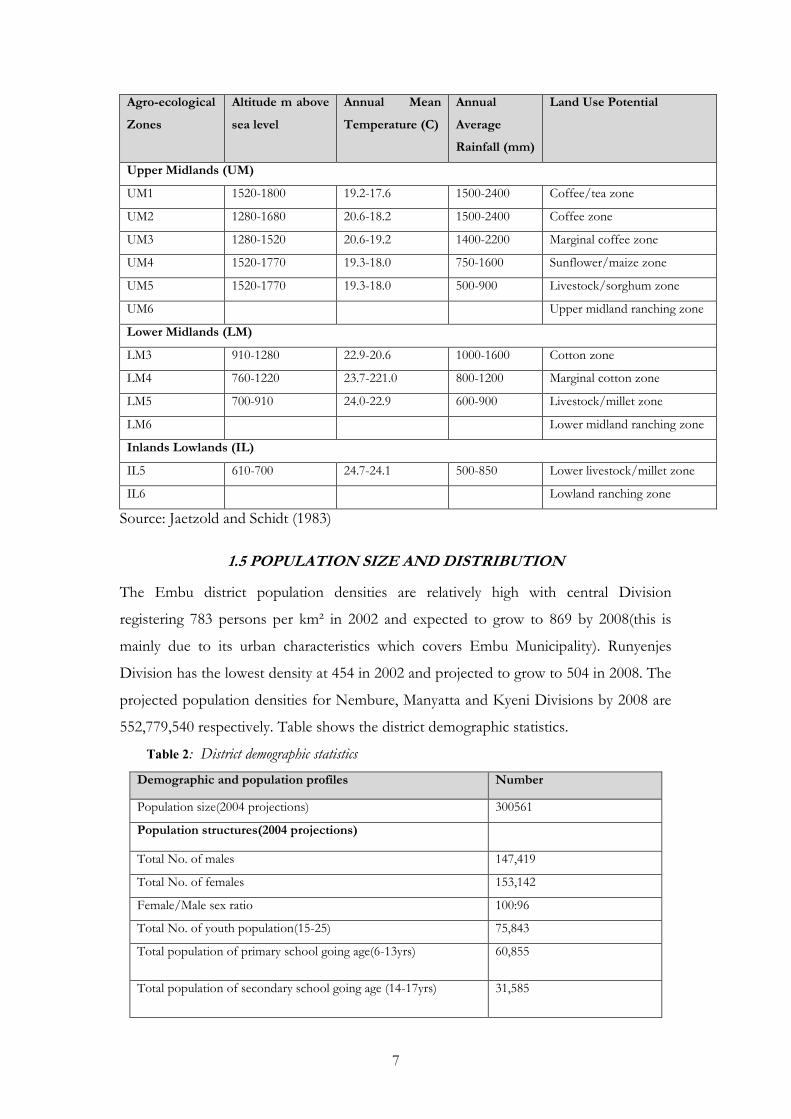
Upper Midlands (UM)
UM1 1520-1800 19.2-17.6 1500-2400 Coffee/tea zone
UM2 1280-1680 20.6-18.2 1500-2400 Coffee zone
UM3 1280-1520 20.6-19.2 1400-2200 Marginal coffee zone
UM4 1520-1770 19.3-18.0 750-1600 Sunflower/maize zone
UM5 1520-1770 19.3-18.0 500-900 Livestock/sorghum zone
UM6 Upper midland ranching zone
Lower Midlands (LM)
LM3 910-1280 22.9-20.6 1000-1600 Cotton zone
LM4 760-1220 23.7-221.0 800-1200 Marginal cotton zone
LM5 700-910 24.0-22.9 600-900 Livestock/millet zone
LM6 Lower midland ranching zone
Inlands Lowlands (IL)
IL5 610-700 24.7-24.1 500-850 Lower livestock/millet zone
IL6 Lowland ranching zone
Source: Jaetzold and Schidt (1983)
1.5 POPULATION SIZE AND DISTRIBUTION
The Embu district population densities are relatively high with central Division
registering 783 persons per km² in 2002 and expected to grow to 869 by 2008(this is
mainly due to its urban characteristics which covers Embu Municipality). Runyenjes
Division has the lowest density at 454 in 2002 and projected to grow to 504 in 2008. The
projected population densities for Nembure, Manyatta and Kyeni Divisions by 2008 are
552,779,540 respectively. Table shows the district demographic statistics.
Table 2: District demographic statisticsDemographic and population profiles Number
Population size(2004 projections) 300561
Population structures(2004 projections)
Total No. of males 147,419
Total No. of females 153,142
Female/Male sex ratio 100:96
Total No. of youth population(15-25) 75,843
Total population of primary school going age(6-13yrs) 60,855
Total population of secondary school going age (14-17yrs) 31,585

8
Demographic and population profiles Number
Total labour force(15-64yrs) 172,543
Dependency ratio 100.73
Population growth rate 1.7% p.a
Population Density (excluding Mt. Kenya forest) (2004projections).
Highest density Central division 800
Lowest density Runyenjes division 465
Average density(excluding Mt. Kenya forest) 577
Other demographic information
Urban population 11.5%
Crude birth rate(2003) 32.8
Crude death rate 8.8/1000
Life expectancy Male: 60.7 female: 71.9
Infant mortality rate 41.1/1000
Child mortality rate 69/1000
Total fertility rate 3.7
Social economic indicators
Total number of households 68,p16
Average household size 4.35
Number of female headed households 21,368(31.7)
Poverty index 56%
Urban population living in absolute poverty 47%
Rural population living in absolute poverty 57%
Source: District Statistics office, Embu 2001
1.6 SOCIAL, CULTURAL, AND ECONOMIC CHARACTERISTICS
1.6.1 Social
Social-economic vulnerability in the district increases from the upper tea zone (with an
average monthly income of Ksh 6000) to the lower cotton and tobacco zones (with an
average monthly income of Ksh 1000). These incomes influence a household’s ability to
provide food, education and health care. Overall, the district population is vulnerable
since it is subject to decreasing farm size and declining land productivity. The collapse of
the coffee sector stemming not only from the depressed world coffee prices, but also
from local and national problems in the industry, has made small-scale coffee production
uneconomic and has significantly contributed to accelerating poverty in the district.

9
Religion
The major religion in the District is Christianity, although in the urban centers there are
few Muslims.
Languages
The main language spoken in the District is Kiembu, Chuka and Kimbeere although due
to immigration, there are languages like Kirinyaga and Kimeru
1.6. 2 Cultural
Traditionally, land is owned through inheritance and subdivided between sons each
successive generation, leading to small agriculturally unviable holdings. Women do not
inherit land from their parents. As a result, there are inequalities in land ownership and
accessibility between men and women. Any unmarried woman is allocated a plot for
building a dwelling but she may not have access to the rest of the land. Some widows
become household head, but they can still not inherit the land or hold a title to it as land
may be inherited only by men and from the husband’s family. Women own land only
when they purchase their own.
Economic Characteristics
Social-economic vulnerability in the district increases from the upper tea zone (with an
average monthly income of ksh 6000) to the lower cotton and tobacco zones (with an
average monthly income of ksh 1000). These incomes influence a household’s ability to
provide food, education and health care. Overall, the district population is vulnerable
since it is subject to decreasing farm size and declining land productivity.
The collapse of the coffee sector stemming not only from the depressed world coffee
prices, but also from local and national problems in the industry, has made small-scale
coffee production uneconomical and has significantly contributed to accelerating poverty
in the district.
Embu district economic mainstay is coffee and tea production. The production levels of
the two crops have been declining over the last few years thus perpetuating poverty
situation in the district. This has had trigger effects to the other sectors of the economy,
affecting the social-economic well being of the people. This is reflected for instance in
the increasing drop out rates at both primary and secondary Schools levels. Other crops
include Macadamia, Tobacco and cereals such as maize, beans and horticultural crops
10
such as French beans, cabbages, kales, tomatoes, avocados, mangoes, pawpaw, bananas
and other fruits.
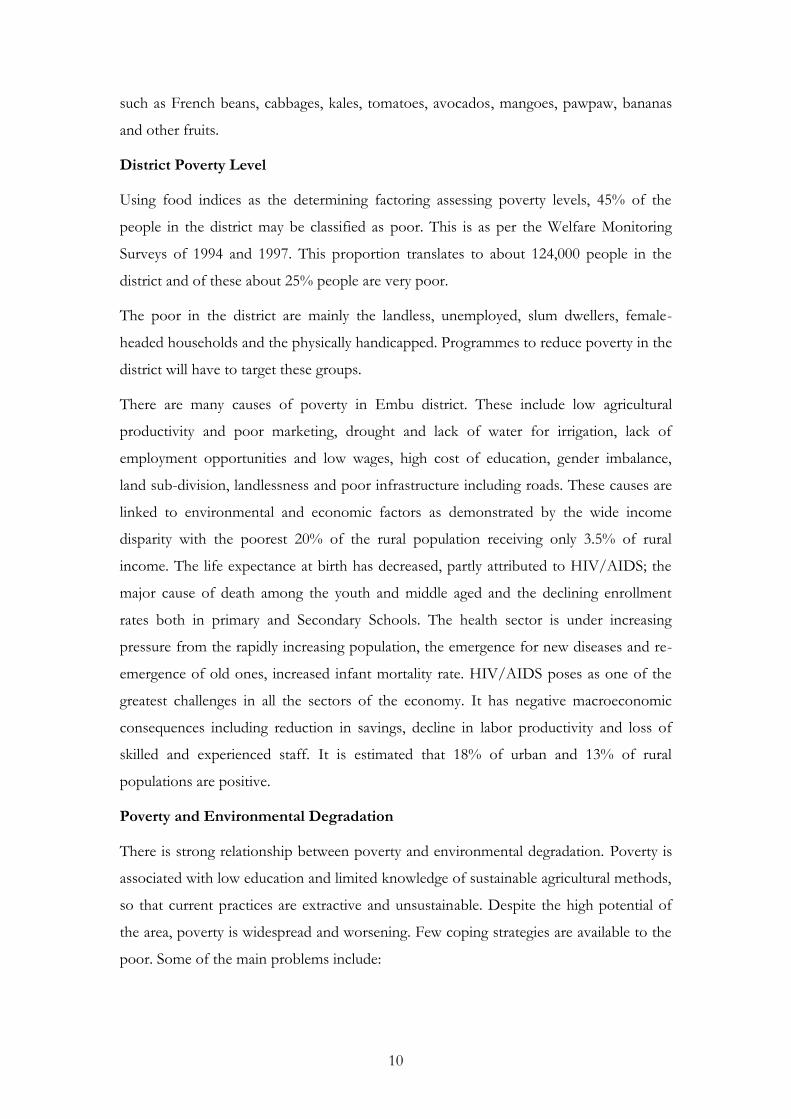
District Poverty Level
Using food indices as the determining factoring assessing poverty levels, 45% of the
people in the district may be classified as poor. This is as per the Welfare Monitoring
Surveys of 1994 and 1997. This proportion translates to about 124,000 people in the
district and of these about 25% people are very poor.
The poor in the district are mainly the landless, unemployed, slum dwellers, female-
headed households and the physically handicapped. Programmes to reduce poverty in the
district will have to target these groups.
There are many causes of poverty in Embu district. These include low agricultural
productivity and poor marketing, drought and lack of water for irrigation, lack of
employment opportunities and low wages, high cost of education, gender imbalance,
land sub-division, landlessness and poor infrastructure including roads. These causes are
linked to environmental and economic factors as demonstrated by the wide income
disparity with the poorest 20% of the rural population receiving only 3.5% of rural
income. The life expectance at birth has decreased, partly attributed to HIV/AIDS; the
major cause of death among the youth and middle aged and the declining enrollment
rates both in primary and Secondary Schools. The health sector is under increasing
pressure from the rapidly increasing population, the emergence for new diseases and re-
emergence of old ones, increased infant mortality rate. HIV/AIDS poses as one of the
greatest challenges in all the sectors of the economy. It has negative macroeconomic
consequences including reduction in savings, decline in labor productivity and loss of
skilled and experienced staff. It is estimated that 18% of urban and 13% of rural
populations are positive.
Poverty and Environmental Degradation
There is strong relationship between poverty and environmental degradation. Poverty is
associated with low education and limited knowledge of sustainable agricultural methods,
so that current practices are extractive and unsustainable. Despite the high potential of
the area, poverty is widespread and worsening. Few coping strategies are available to the
poor. Some of the main problems include:

11
shortage of land for agriculture linked to high population and land fragmentation,
which has lead to the cultivation of steep slopes, riverbanks, and wetlands – with
environmental consequences in terms of soil erosion (loss of top soil, declining
soil fertility, loss of water catchments capacity leading to lower dry season flows
and flooding during wet season),
loss of coffee and dairy farming incomes linked to the loss of services provided
by parastatals in these industries, with the result that the farmers have opted for
other activities such as illegal harvesting of trees in the forest for sale and
growing marijuana in the forest,
Lengthy procedures for obtaining water abstraction permits results in many
people simply extracting water without permits;
Unregulated water use for irrigation in the middle catchment areas has deprived
the communities in the lower areas of water which they need for their livestock
and which could be used for intensifying agricultural production. In response the
farmers resort to opportunistic activities such as charcoal burning which destroys
the vegetation cover and causes accelerated soil erosion which further reduces
land productivity;
Sale of subsistence crops at harvest time leaves many families vulnerable for
several months before the next harvest;
Lack of markets for farm produce in general, so that farmers are not earning
income which could be invested in their farms,
Inadequate soil conservation structures on slopes of the lowest gradient leads to
soil erosion and concomitant siltation in the rivers.
While high population density leads to pressure on the land and subdivision of farms, it
need not have a negative effect on environmental conservation. It can even be a
stimulant to agricultural intensification provided there is awareness creation on better
crop husbandry and soil and water conservation. High population density also means
that labor will not be a limiting factor, allowing the cultivation of labor intensive, high
value crops and the construction of soil and water conservation structures.
Natural Resource Base
The district is well endowed with big rivers and therefore relies heavily on surface water
resources. The other natural resources are the forests, which occupy an area of 2,264
hectares representing 3.5 % of the district’s total area. The district has also an enormous
potential for fisheries activities.

12
1.6.3 Agriculture and Rural DevelopmentLand use types and ownershipThe most common farming systems in the district are small-scale cash crop and
subsistence farming. The cropping patterns are determined by the district agro-ecological
zones. The intensity of land use changes decreases as one goes downstream of the
various river catchments. In the tea zones, family land size varies from less than ½ acre
to 4 acres. In the coffee zone, farm sizes vary from 0.2 ha to 2.0 ha. In the lower zone,
family land size is variable and ranges from less than 0.1 ha to over 16 ha. The farm sizes
have been declining for over 30 years.

13
CHAPTER TWO2.0 ENVIRONMENT AND NATURAL RESOURCES
2.1 SOILS AND LAND
2.1.1 Soil
Most of the soils in the district are developed on parent materials derived from Mount
Kenya. The soils pattern follows the Mount Kenya top-sequence found in Meru South
District. The higher parts contain soils of variable fertility and depth (Histosols and
Leptosols) but it is too cold for agriculture. At slightly lower altitude, humid top soils of
moderate high fertility (Andosols) are found. These soils are leached and acidic. The
major part of the district, forming the volcanic ridges, has soils with top soil often rich in
organic matter and of moderate to high fertility (mainly Nitisols and Andosols). Parts of
the district bordering Mbeere District have deeply weathered red clay soils (Ferralsols) of
low fertility.
2.1.2 Land Use Changes
Land under freehold tenure is used mainly for agricultural purposes. Crops grown
include beans, maize, potatoes, vegetables such as French beans, cabbage and sukuma
wiki, etc. Tea, coffee and dairy cattle keeping are mainly practiced in the upper parts of
the District. The lower parts are experiencing intensive land subdivision. People have
encroached into riparian reserves where they introduce inappropriate land use practices.
A part from agricultural use and Urban Centers, the rest of the District is covered by Mt.
Kenya Forest.
2.1.3 Regulatory and Institutional Arrangements
The Ministry of Lands through the District Lands Officer, in collaboration with Ministry
of Agriculture, Municipal and County Councils control the allocation and development
of land in the district.
Key environmental issues
Inadequate environmental conservation
Soil erosion
Excessive use of fertilizers
Inadequate farming technologies
Subdivision of land into uneconomical units

14
Proposed interventions
Promote soil and water conservation and management;
Awareness creation among the land users
Promote appropriate technologies
Encourage organic farming
Enforcement of legislations governing land
2.2 AGRICULTURE, LIVESTOCK AND FISHERIES
2.2.1 Agriculture
Agriculture is the main economic activity. The physical features, soils and climate create a
very favorable environment for growing high value crops like tea, coffee and macadamia.
Other crops include maize, beans and horticultural crops (French, beans, tomatoes,
avocados, cabbages, and kales). The average farm size is about 1.2 hectares. The area
under maize, beans, Irish potatoes and cowpeas has fluctuated over time depending on
the price structure and the cost of inputs. In general, there is potential for increasing crop
productivity with improved management and use of inputs.
Agriculture accounts for 60% of the total national employment. Its contribution to gross
domestic product (GDP) was 37% just after independence but it has declined to 25% in
the year 2000. The relative decline in agriculture is attributable in part to rapid rates of
growth in other sectors and to underperformances in relation to its potential for creating
employment and income. This under performance is linked to a number of factors,
which include; barriers to the management of biophysical, socio-economic, and
institutional environments. The evolution of and implementation of micro and
macroeconomics policies has constrained development.
The collapse of a number of parastatals such as Kenya meat commission and KCC
among others also had a negative impact on farmers and livestock keepers. While past
intensive efforts to train farmers through extension services and technical advice, have
certainly contributed to the current level of development particularly of the cash crop
sector, the adoption of sustainable agricultural techniques remains a challenge. Poor
flows in agricultural information that leads to high transaction costs have lowered the
pace of agricultural development. One current practical dilemma is how to improve the
performance of agricultural extension services that are currently facing logistical and
methodological constraints.

15
Key environmental issues
Soil erosion
Pollution of rivers from agrochemicals
Inadequate soil and water conservation structures
Water pollution due to effluent discharge from tea industries
Proposed interventions
Promote soil and water conservation measures
Promote proper use of agrochemicals
Enforce relevant regulations
Create awareness on environmental conservation
2.2. 2 Livestock
Livestock production mainly consists of both local and exotic cattle, sheep, goats local
and exotic poultry, pigs, and rabbits. There is emerging livestock in the district that
mainly include Bee keeping, Silkworm farming and Quails. The main products of
livestock in the district include: Milk, Beef, Eggs, Poultry meat and Pork.
The livestock population has been on the increase over time. The increase in dairy cattle
and goats could be attributed to the Integrated Small Livestock and National Dairy
Development Programmes in the district. Most areas of the District produce enough
food to feed its population apart from the dry area which covers less than 5% of the
district, in the lower areas of Runyenje’s, Kyeni, Nembure and Central Divisions.
Key Environmental issues
Livestock diseases
Soil erosion
overstocking
Poor animal husbandry
Poor waste management.
Inadequate extension officers
Proposed interventions
Community sensitization on proper farming methods
Integrate indigenous and modern farming methods
Control livestock diseases
Encourage zero grazing

16
Encourage good husbandry practices
Enforcement of relevant legislation
2.3. FISHERIES RESOURCES
Fish farming is practiced on a small scale largely for domestic consumption, while the
surplus is sold. Accessibility and transport to the market hinders fish production. The
fishermen also use undersize nets that affect future production. Increased sedimentation
has also affected fish production because of increased water turbidity. Subsistence fishing
is also done on rivers like Rupingazi, Thambana, Nyanjara, Thuci, Ena, and Kii. Table 3
shows status of fisheries resources.
Table 3: Status of Fisheries ResourcesFisheries Status
Warm water aquaculture( year 2001)
Potential(area) 1,062 units(1.5% of Embu District)
Potential (production) 300,000kg
Potential (value) 30 million
Population of fish farmers 77
No. of fish ponds 144
Area covered by fish ponds 20,831m²
Main species of fish catch Tilapia, cat fish, common carp
Cold water Aquaculture (year 2001)
Suitable trout farming areas River Rupingazi, Thambana, Nyanjara, Thuci,
Ena, and Kii
Potential for trout production 200,000kg
Value of potential production Ksh 80m p.a current prize at 400/= per kg
Current production(11000 rainbow trout) One farmer with six ponds and
One Group with two ponds
Main species of trout Rainbow trout, Brown Trout
Source: District Agricultural Office 2001
Key Environmental Issues
Use of small size nets which catch young fish
Unexploited potential for fish farming
Sedimentation and siltation of fish ponds
Proposed Interventions
Use of appropriate fishing nets

17
Desiltation of ponds
Promote fish farming
2.4 WATER RESOURCES
2.4.1 Key Water Sources
Main sources of water in the district include rivers, streams, springs, rainfall and
boreholes. Major uses of water in the district include Domestic, Agricultural, Industrial
and Recreational. The water supply systems do not meet the demand mainly due to
population increase and poor management of the resource. This challenge is being
addressed through capacity building programmes for Project Management Committees
to improve on service delivery through efficient distribution of available water resource,
formation of Water and River Users Associations for equitable sharing of the water
resource and conservation and management of the water catchments areas and the river
basin itself.
The irrigated areas in the district include Nthambo, Njukiri, Manyatta and Mbuvori.
WetlandsReclamation of the wetlands and cultivation of river frontage is now a major source of
degradation in the district. Although the actual area is not known, a large percentage of
wetlands in the area have already been drained and converted to agricultural use mainly
for the growing of maize, beans, tomatoes, cabbages and tree species such as Newtonia
buchananii, Albizia gummifera and Croton macrostachyus among other important tree species in
both tea and coffee zones. In addition, cultivation of river frontage has been found to
interfere with water quality through increase in siltation and eutrophication.
Key Environmental Issues
Change in water quality
Water borne diseases
Loss of soil fertility
Soil erosion
Siltation of water works
Flooding
Water borne and water related diseases
Breeding grounds for mosquitoes
Encroachments into wetlands

18
Proposed interventions
Monitoring of water quality
Promote proper farming practices
Catchments protection
Sound management of wetlands
Community involvement in relevant projects and programmes
Enforcement of relevant legislations
2.5 FORESTRY AND WILDLIFE RESOURCES
2.5.1 Forestry
The district forests, occupy an area of 2,264 hectares representing 3.5 % of the district’s
total area. The Mount Kenya ecosystem, especially the National park is home to
biodiversity of national and global significance. In 1994, a list of 882 plant species
belonging to 479 genera in the 146 families was published for the forest zone of Mt.
Kenya. There are at least 11 strict endemic species of higher plants and more than 150
near endemic, i.e. species that also occur in at least one of the following; Aberdares
Mountains, Mt. Kilimanjaro, Mt. Elgon, Mt. Meru and Ruwenzori mountain. Below the
afro-alpine zone, the bamboo (Arundinaria alpina) forest, which occurs between 2,400m
above sea level and 3000m above sea level, dominates the upper reaches of the forest. In
the lower mountain region, between 1500 and 2400m above sea level, broad-leaved
evergreen hardwoods and conifers dominate the forest. Within this range, the species of
Ocotea usambarensis, Juniperus procera and Podocarpus latifolius dominate at high elevations
whilst at the lower altitude forested areas, Croton macrostachyus, Newtonia buchanii, Prunus
Africana, Olea europea, Ficus thoningii are common forest trees.
The total area of forest in Embu is 19,067.7 hectares, which include:
Mt. Kenya Forest 18393.0 ha.
Kirimiri Hill Forest 101.0 ha.
Maranga Hill Forest 219 ha.
Njukiri East Forest 383.7 ha.
Farm Forests cover about 1/3 of the District.
2.5.2 Trends and Status of Forest Resources
There are constant threats to forest products from the neighbouring communities. Table
4 shows the types and status of forest resources.

19
Table 4: Types and Status of forestsType of
forest
Extent
(ha)
Distribution
(%of total)
or Name
location Forest
uses
Status
gazzeted Under
Trust
land
Private
land
%
degradatio
n
Natural 18,393.0 Mt .Kenya Mt.
Kenya
Conservation gazzeted 20%
Natural 101.0 ha. Kirimiri Runyenje
s
Division
Conservation Trust
land
Intact
Man
made
219.0 ha Maranga Runyenje
s
Division
Conservation
&
Exploitation
Trust
land
50%
Natural
and Man
made
383.7 ha. Njukiri East Central
Division
Conservation
&
Exploitation
Trust
land
50%
Man
made
N/A Farm lands Through
out
District
Domestic Private
land
N/A
Source Embu District Forest Office 2001
2.5.3 Regulatory and Management ArrangementsThe forest department, Kenya forestry research institute and the ministry of agriculture
are the main government service deliverer in the district. The district forestry extension
officers attached to the forest station help in the establishment of community tree
nurseries by providing technical advice. The nearest forest station to the nurseries also
facilitates the management of soil materials and seedlings.. The local communities are
empowered with the relevant skills to manage the established tree nurseries through
training courses in tree nursery management, water harvesting techniques, compost
making and agro-forestry.
The Forest Department is also responsible for community activities dealing with planting
of trees in the national reserves and outside the forest reserve. It also plays essential role
as regard to environmental issues at the district level.
Key environmental issues
Deforestation
Illegal logging

20
Encroachment of the forest for cultivation
Poor methods of extracting medicinal plants
Loss of biodiversity
charcoal burning and extraction of fire wood
inadequate environmental /forest management
Unsustainable methods in natural resource utilization
Proposed interventions
Initiating afforestation and reafforestation programmes
Awareness creation and sensitization of people living around the forest areas.
Introduction of alternative livelihoods other than charcoal burning
Encourage community participation in forest management
Develop forest management plans
Enforcing the relevant environmental legislation
2.6 WILDLIFE
2.6.1 Types of Wildlife and Area Under Wildlife
The forested parts of Embu district are a suitable habitat for a wide diversity of fauna
some of which attract tremendous conservation interest. According to the International
Union for the Conservation of Nature (IUCN) Red Data Book, threatened large
mammals found in the Mt. Kenya forest include; leopard, Eastern bongo, Giant forest hog,
Black rhino, Africa elephant and Black fronted duiker. Other wildlife that is commonly
encountered in the area include Cape buffalo, black and white colobus, Skye’s monkey, olive
baboon, eland, Zebra, reedbuck, spotted hyena, serval, genet, and mongoose. Notable smaller and
rare mammals reportedly include the Mt. Kenya mole shrew, mole rat, thicket rat, highland
musk shrew and East African rock hyrax. Mt. Kenya is an important bird area and home to
the threatened and little-known Abbot’s starling. Fifty-three out of Kenya’s 67 African
Highland biome bird species are found here. At least 35 forest specialist species and six
of the eight species from Kenya Mountains Endemic Bird Area reportedly occur on Mt
Kenya.
2.6.2 Trends and Status of Wildlife Resources
The status of wildlife in Embu has been relatively stable. However, there are
occurrences of wild fires that causes animals migration.

21
2.6.3 Regulatory and Management Arrangements
The wildlife management is carried on under the provisions of the wildlife (Management
and Conservation) Act Cap. 376. In 1989, the act was amended to create the KWS to
replace the Department of Wildlife management that was in charge of implementing the
provisions of the act. The act prohibits a range of activities within a national park or
reserve. These include hunting; residing; cutting or setting fire to vegetation; knowingly
introducing animal or vegetation; clearing; cultivating or breaking up land for cultivation;
and fishing.
2.6.4 Exploitation of Wildlife Resources both Consumptive and Non-consumptive
Exploitation of wildlife in Mt. Kenya region is strictly prohibited as it has been declared
as one of the world’s conservatory sites. However, there are reported cases of game meat
harvesting.
Key environmental issues
Human/wildlife conflict
Habitat destruction
Loss of biodiversity
Wildlife poaching
Proposed interventions
Promote community participation in wildlife conservation
Enforce existing legislations
Create awareness on the importance of wildlife
Control human/wildlife conflicts
2.6.5 Biodiversity Data and Information
Population pressure is pushing the Embu people to farm on the hills. This has led to loss
of biodiversity and general degradation of the water catchment’s areas. Flood plains and
river line ecosystems (wetlands) have been reclaimed for farming, sand scooping and
brick making activities in the District. This is encouraged by market availability for sand,
and vegetables. Brick making and curing is taken as an off-season activity (July-
September) and, since water and fuel wood is limiting resources, this activity is located
near water bodies where fuel wood can be sourced easily. This has led to water quality
decline, loss of biodiversity and increased soil erosion. Important habitats for fish
breeding and other forms of life have also been encroached on.

22
Key environmental issues
Loss of biodiversity
Deforestation
destruction of water catchment areas
Inadequate information on environmental conservation measures
Habitat destruction
Inadequate information /data on biodiversity status
Proposed Interventions
Enforcement of legislations to protect the endangered species
Initiating afforestation and re-afforestation programmes
Undertake inventory on biodiversity
Create awareness on the importance of environment conservation
Promote community participation in environmental conservation
2.7 ENERGY SECTOR
The main types of energy in the district are, firewood, charcoal, solar, electricity,
biogas/gas, LPG kerosene and wind. Energy usage depends on household economic
status. The energy types are categorized as traditional and convectional. The traditional
type include wood, charcoal and other biomass while conventional include petroleum
products, solar and electricity. Both rural and urban households consume a mixture of
both traditional and conventional energy types.
FirewoodMost of the households use this energy for cooking purposes. Firewood from the district
mainly comes from on farm sources
CharcoalMost of the urban households rely on charcoal for cooking and heating. Charcoal is
considered relatively cheap compared with firewood. Per capita use stands at 156kg in
urban and 152 in rural areas.
Farm Residue and Wood WasteThere is rampant household use of farm residues like maize, millet, sorghum, sugarcane
remnants after harvesting. Sawdust has also been used as a source of energy
Petroleum products

23
Kerosene is widely used by households both in rural and urban areas mainly for lighting.
ElectricityThis is the most modern and convenient source of energy. However, it is expensive for
the majority of the households in the district. There is a need for rural electrification
programme to be enhanced so that the rural folks can access this energy even if it is only
for lighting.
Solar EnergyThere is limited use of solar energy for both lighting and heating
BiogasThis form of energy is not well spread in the district. However, the district has a lot of
potential.
Unexploited and Potential Energy SourcesWind energy is an unexploited source in the district there are also underutilized energy
sources that include biomass, solar and liquefied petroleum Gas (LPG).
Key environmental issues
Deforestation
Air and indoor pollution
Soil erosion
Loss of biodiversity
Loss of habitats
High initial cost of accessing energy
Proposed interventions
Encourage afforestation and reafforestation programmes
Introduction of efficient and affordable energy technology
Promote soil conservation initiatives
Enforcement of environmental legislations and regulations
Design houses with adequate ventilations
Awareness creation to the community on the importance of environmental
conservation

24
CHAPTER THREE3.0 HUMAN SETTLEMENTS AND INFRASTRUCTURE
3.1 Human Settlements
Over the years, Human settlement issues have continued to cause degradation on the
environment. Although a number of policies and legislations have been put in place to
address some of the emerging concerns, environmental degradation continues unabated
due to weak enforcement mechanisms. The district’s inhabitants are predominantly a
rural society with majority of them living in dispersed rural settlements.
3.2. Rural and Urban Housing Types
Embu town, as an administrative centre has enjoyed positive trends in the development
of housing. Most of the houses are permanent except in the slum area where you find
temporary, mud, timber and brick houses. In the rural areas, 90% of the houses are
temporary mud houses, few timber, brick and stone houses. The housing providers
include:
Government
Local authorities
National housing corporation (NHC)
Private developer
Individuals
From the 1999 census, report 12,039 households were found to reside in the real urban
area of Embu municipality against a population of 40747. Consequently, the average size
was held at 4 persons per household. The emerging scenario in housing depicted a
situation of non- crowding and low housing demand. A survey conducted to authenticate
the above revealed that there was a number of housing units, which were unoccupied.
3.2.1 Rural Settlement SchemesHuman settlements are the built up areas where human beings live and provide
themselves with basic human development needs. Such needs include shelter, food,
health, education services and the other socio-economic systems that sustain human
systems. It is in human settlements that human beings seek to satisfy their material, social
and spiritual needs. There are three major types of settlements in the district namely:
The nucleated

25
The scatter
Ribbon
Due to its physical extents, Embu district reflects both the concentrated and scattered
settlements. Pockets of concentrated settlements are however noticeable in some small
satellite markets i.e. Kibugu, Manyatta, Kithimu and Runyenjes, while the scattered
settlements take up the other parts of the district.
3.2.2 Squatter Settlements
The squatter settlements are distributed within the trust land and in the out skirts of the
local rural markets where development has not taken ground due to some constraints.
The council has however embarked on the slum and squatter upgrading programmes.
Key environmental issues
Inadequate land use planning
Pollution
Deforestation
Overstretching the existing infrastructure
Proposed interventions
Initiating coordinated urban planning
Enforcing relevant legislation and regulations
Initiating afforestation and reafforestation programs
3.2.3 Human and Environmental Health
Man and other creatures depend on environmental ecosystem for their day-to-day
survival. Environmental concerns should be addressed during development of all
infrastructure projects. The challenge is to sensitize all stakeholders to mainstream
environmental issues in all development initiatives.
Malaria account for over 30% of morbidity making it the leading cause of death in the
district. HIV/ Aids scourge is the second leading killer after malaria, largely affecting the
working age bracket, while the respiratory tracts and water borne diseases especially
tuberculosis are major human and environmental health challenges. Other health
challenges are water borne and water related diseases.
Common diseases influenced by environmental factors
The major diseases in the district include;
Malaria

26
HIV and AIDs
Intestinal worms
Diseases of the skin
Pneumonia
Accidents
Diarrhea diseases
Rheumatism
Eye infections
Urethra tract infections
Immunization coverage is 86%
Latrine coverage 92%
U.R.T.I (Diseases of Respiratory System)
Skin
Eye infections
Typhoid
Other water borne diseases found in the district include typhoid, cholera dysentery, amoebiasis,
bilhazia, and filariasis.
These diseases are generally caused by poor sanitation, inadequate coverage of safe and
clean water supplies in the district, poor hygiene practices, poor food handling practices,
poverty, and social-cultural practice Poor sanitation and drainage, poor management of
solid waste, climatic and other conditions that favorable to breeding of mosquitoes as
well as poverty also play a significant role. Typhoid and other respiratory diseases have
been on the increase for the last few years in Embu district.
Key Environmental Issues
Poor environmental sanitation
Low level of awareness of safe and hygienic use of water
Spread of diseases
Poor refuse disposal
Proposed Intervention
Promotion of sanitation and hygiene standards
Prevention and control of disease outbreaks
Awareness campaigns for diseases prevention and control,

27
Control of disease vectors,
Supervision and advise on safe and proper disposal of both solid and liquid
wastes,
3.2.4 Pollution and Waste Generated from Human Settlement
Major sources of pollutionThe major sources of pollution are industrial, municipal, agriculture, institutional,
domestic, construction debris and waste from mining operations. Rapid urbanization has
led to high consumption of natural resources and generation of waste.
3.2.5 Types and Amounts of Waste and PollutionThe Embu district waste falls into three categories namely: Solid, liquid, and gaseous.
There is also noise pollution from motor vehicles, nightclubs, discos and religious
organizations. Indiscriminate disposal of solid, liquid and human waste pollutes the
district environment. This is in form of sewerage, food waste, plastic bags and other
households’ wastes as is the case in Shauri and Kathita estates. In low-income areas, the
collection services are very poor. Uncollected waste is found thrown along the streets,
play fields and between houses. The collection of garbage from communal sites is not
frequent. Usually, priority is given to the central district, industrial area and high income
residential areas. Less effort are put in the middle and low-income areas and slum
settlements. The accumulated and scattered waste emits awful smell and is breeding
grounds for rodents, flies and mosquitoes.
The main types of solid wastes found in both Embu and Runyenjes municipalities are,
Food waste, paper, plastics, textiles, bones, metals, glass, wood shavings, rubber and
leather. Most of this waste is disposed off in open dumpsites, burned or composted.
There is a scarcity of disposal sites within the municipalities, because the available areas
are converted to residential. This due to lack of proper planning and zoning. Composting
and burning is generally practiced in estates that have large compounds and within the
rural areas. Generally, most urban waste is collected in bins at the household level and in
bulk containers at the institutional level and large super markets.
Only Embu District Hospital incinerates their hospital waste, but nearly all clinics in the
towns dispose off their medical waste at the dumpsites. Incineration is expensive and not
affordable by many medical practitioners although their services are highly required.
28
There is a lot of noise from upcoming churches, which are constructed within residential
areas and offices.
3.2.6 Sanitation
Pit latrines are the common onsite sanitation systems in the District, covering most of
the rural settlements, urban slums, peri-urban settlements and small towns. Latrine
coverage in the rural areas is generally high; 100% in the tea zone, approximately 80% in
the coffee zone and 60%-80% in the cotton/livestock zone. However, use of proper
hygiene practices like washing hands after visiting the latrine is rarely practiced. The
situation is most critical in the market centers. None of the rural market centers has
adequate sanitation facilities. Large amounts of organic waste are being generated and are
often thrown in the nearby depressions and are eventually washed into streams. There
are limited environmental sanitation facilities such as garbage pits and dish racks in the
district.
Sewage system in Embu town covers, only 4.7km². The system coverage includes Isaac
Walton, Spring Valley, Majengo, town centre and Government institutions. A large part
of the municipality is not covered taking into account that the main trunk covers about
54.4km of the major road reserves. For areas not served by the sewage system, use of
septic tanks and pit latrines is predominant.
Key environmental Issues
Poor Sewerage system in urban areas
Poor solid waste management
Pollution of water systems
Environmental Diseases
Slum developments
Noise pollution
Proposed Interventions
Enforcement of relevant legislations and regulations
Control slum developments
Provide clean water
Awareness creation

29
3.3 COMMUNICATION NETWORKS
3.3 1 Roads
Embu district has no tarmac road other than the Nairobi-Meru road that traverse the
district at the middle and Embu Muthatari on the way to Mbeere. Most of the rural
access roads are impassable during the rainy season, which adversely affects access to the
market for agricultural produce and ease of access to farm inputs, and extension services
.The cost of road maintenance per unit is comparatively high in most areas due to the
hilly terrain characterizing the district.
3.3.2 Telecommunications
The district is well covered by the mobile telephone services and expects to further
benefit from service quality improvement currently being undertaken by the service
providers. The landline service has also experienced increase in the number of telephone
lines availability and enhancement of quality through upgrading of the technology.
However, there is need to further roll out the services to cover all rural areas through
quality and quantity improvement particularly for the fixed line services offered by
Telkom. Over 1000 lines were available for leasing out by June 2005. Improving
telephone access to rural areas will increase access to ICT particularly to learning
institutions.
The main problems facing telecommunication are high cost of installation and
maintenance and poor/inadequate road maintenance
Key environmental issues
Pollution from transportation, use and storage of petroleum products, has been
reported in the district and molasses leaking from the tankers.
Destruction of roads by heavy commercial vehicles.
Inadequate infrastructure in the district
Proposed interventions
Control of pollution by Phasing out the use of leaded petrol
Enforcement of Environmental legislations
Enforcement of Municipal and Town Councils by-laws to reduce pollution
from petroleum outlets and establishment of the same.
Awareness creation among the public on danger of poor storage and use of
petroleum products.

30
Encourage the use of cleaner technologies
Develop and improve the existing infrastructure
3.3.3 Social Economics Services and Infrastructure
EducationSustainability of the benefits of free primary education (FPE) is a major challenge in
relation to ensuring the enrolment is maintained and that transition rates increase to take
care of the high enrolments. The quality of education is threatened by the sheer numbers
enrolled more so as regards the availability of the physical facilities. There is need to
continue on enhancing the management skills of school heads and school communities
to deliver on the primary education. High poverty levels are contributing negatively on
the transition rates. The district is addressing this through improving the capacity of local
day secondary schools to admit more students by supporting the construction of
additional facilities like classrooms and laboratories. Table 5 summarizes the educational
facilities in the District.
Educational facilities in the DistrictTable 5: Educational facilities in the DistrictPre- Primary Number
Number of pre-primary schools 261
Gross Enrolment by sex
Male 4.506
Female 4,686
Total No. of teachers 371
Teacher/pupil ratio 1:26
Primary
No. of primary schools 201
Gross enrolment rates by sex
Male 118.7%
PRE- PRIMARY
Female 119.6%
Dropout rates (10-14yrs) 9.5%
Total No. of teachers 2130
Teacher/pupil ratio 1:31
Secondary
No. of secondary schools 77
Total enrolment by sex 13270
Male 6450 48.61%

31
Female 6820 51.39%
Total No. of teachers 850
Tertiary
No. of training institutions
Teachers colleges 1
Medical training 2(Embu Medical Training, Kyeni Mission Hosp.
Nursing School)
Youth polytechnics 13
Theological Mt. Kenya Theological College
Commercial private colleges 4
Key environmental issues
High dropout rates
High prevalence of HIV/AIDS
High cost of education
Frequent changes in recommended text books and course books
Poor transition rate from one level of education to another
Inadequate physical infrastructure
Proposed Interventions
Expand school bursaries to cater for needy children
Offer loans and scholarships
Promote education at all levels
HealthThe health sector needs to be enhanced for health services delivery through physical
facility development, supply of drugs and equipment. Various health provision facilities
were upgraded in 2004/2005 but physical facilities and equipment availability to meet
services commensurate with their new status is a challenge.

32
CHAPTER FOUR4.0 INDUSTRIAL, TRADE AND SERVICES
4.1. TRADE
The Kenya’s general trade policy objectives are articulated in Sessional paper No. 1 of
1986 and elaborated in the 8th National Development plan. The district’s general policy
objectives include moving towards a more open regime, strengthening and increasing the
districts market access and integrating it in the Kenyan economy. However, a number of
factors have adversely affected the achievements of these objectives. This include; influx
of imports in the domestic market, non-competitiveness of local products, limited
negotiation capacity of private and public sectors, poor infrastructure, high cost of
utilities, finance, and high cost of inputs of locally manufactured goods.
Over the years, the district wholesale and retail trade has continued to grow both in rural
and urban areas. However, there have been poor planning, which has led to
mushrooming of shops and kiosks, which have generated enormous amounts of waste.
These wastes include polythene bags, which end up clogging the sewerage system and
littering the environment.
Garages
The wastes generated by the garages are mostly oil based; scrap metal and others that are
non-biodegradable. Those wastes contaminate the air, soil, water and at times block the
sewage systems. The perception that these enterprises support the very poor in the
society makes it difficult for authorities to monitor and properly regulate them
Agriculture and produce market
This sector’s contribution to the GDP has progressively declined from 37% in the early
1970s to about 25% in 2000.Growth in agriculture and improved rural incomes has a
significant and direct impact in reducing poverty. The sector also provides raw materials
to the manufacturing sector. In the district, the sector covers all the crops including
horticultural crop, which is currently the third most important foreign exchange earner.
4.1.1 Challenges and Environmental Impacts of Trade Liberalization
The major problem is dumping of counter fait goods. When these products do not
function, they are just dumped. Most of them are non-biodegradable and therefore result
into another source of pollution.
33
4.2 INDUSTRY
The Kenya’s industrial sector is one of the largest in Sub-Sahara Africa but Embu district
is lagging behind in terms of industries. Some of the main recognizable industries in the
district are the tea and coffee industries. This sector performs less than its optimal
capacity due to the high costs of energy, poor infrastructure and increased dynamism of
the customer needs and demands.
4.2.1 The Charcoal Burning Industry
Approximately 80% of the total quantity of energy consumed in the district is provided
by the woody biomass. The amount is expected to double by the year 2020. Carbon
monoxide is widely generated indoors by heating and cooking appliances in poorly
ventilated rooms.
Over reliance on both charcoal and firewood is mainly responsible for the deforestation
of most of the forests with serious consequences on flooding and soil erosion. Whereas
charcoal burning is illegal, its sale is done openly and it is legal. There is need therefore
for the government to remove the apparent conflict between the two activities, while at
the same time finding an alternative and affordable energy sources for the rural and
urban poor.
4.2.2 The Tea Industry
Environmental pressures of the tea sector include; smallholder factories use fossil fuel,
which is expensive and produce environmentally unfriendly carbon gases as opposed to
large estates and wood fuel, which causes deforestation. This has resulted into
destruction of forest ecosystems, destruction of catchments areas and increased land
degradation.
4.2.3 The Coffee Industry
Smallholder farmers under the cooperatives societies produce most of the coffee in the
district with only a small percentage being produced by the large estates. The coffee co-
operative factories are organized into a series of societies serving small-scale growers (1-5
acre plots) and privately owned estates.
Wastewater from coffee factories is normally discharged into watercourses after pre-
treatment, or directly through seepage pits; and in some cases, it is used for irrigation.
34
Coffee wastewater has high biological oxygen demand (BOD) that interferes with aquatic
life. Solid wastes from coffee factories are used as mulch for grass, coffee and soil
conditioning. The use of pesticides and fungicides for coffee also raises environmental
concerns.
4.2.4 Slaughter Houses
The district has slaughterhouses that have serious environmental problems with respect
to the management of their solid waste, effluents and gaseous emissions. Based on
existing practices, the following environmental liability should be addressed;
Hygiene standards for treating , handling and storage of animals and meat on all
stages of the production process
Regular hygiene and animal health checks should be carried out before slaughter
Collection of residues arising from the slaughter of animals
Burning of waste and recovering fats and oils
Effluent produced during the slaughtering process may generate pollution problems due
to the high content of animal fat, waste, blood and cleaning agents. The main sources of
atmospheric odor are animal wastes (skin, hides, and hooves), unprocessed materials and
other solid waste.
4.2.5 Transport
The district’s transport system generally comprises of roads. It integrates the various
productions, population centre and facilitates mobility in both rural and urban centre.
Vehicular pollution has become a significant environmental problem in the district with
the main pollutants being lead and by-products of fuel combustion, which include both
visible smoke and invisible emissions. The main emissions are hydrocarbons, carbon
monoxide, oxides of nitrogen and particulate matters.
4.2.6 Telephone
Telecommunication is important in facilitating the integration of the domestic economy
and contributes to promotion of trade and economic development. The number of
telephone exchange connection has been increasing steadily. The mobile phones industry
has been growing very fast in the district. However, there is need to manage the disposal
of the mobile phone scratch cards and enhance safe disposal of rechargeable batteries.

35
4.2.7 Information and Communication Technologies (ICT)
Although information and communication technologies are one of the fastest growing
and dynamic sub-sectors in Kenya, Embu district has lagged behind in the sector. The
demands for basic ICT services remains unmet and the disparity in the distribution of
communications facilities between the rural and urban areas continue to widen.
4.3 TOURISM
Kenya is a mega diverse country with high quality tourism products. It has remained one
of the most popular tourist destinations in the world. The Embu district stunning
topography ranges from the snow capped peaks on Mt. Kenya (5199m), to the diverse
flora and fauna in the whole region. The Kenya tourism board has in the recent past
implemented some mitigation measures recommended at the global level, including
minimizing resource use and treating wastes, recycling wastewater and rehabilitating
degraded sites. However, the mushrooming of unclassified hotels and restaurants in the
major urban centers has negatively impacted on the environment due to improper
disposal of wastes generated from these facilities. Some of the facilities have also become
health hazards due to unavailability of running water.
4.3.1 Type of Tourism, Attraction and Potential
The tourism industry is growing slowly in Embu. The only hotel meeting international
standards in the district is the Isaac Walton. The tourism potential is very high in the
district but is to be fully exploited.
Positive impacts of tourism on the environment
Ecotourism promotes environmental health by providing environmental education to the
local people and by building consumer demand for environment-friendly products and
services. It contributes to environmental conservation through improved environmental
management and planning for example through control of tourism activities and use of
environment-friendly technology. The suppliers of hotels and restaurants such as
farmers, vegetable growers, breweries, banks and foreign exchange dealers, motor and
fuel suppliers, builders, furniture makers and airport staff all benefit from the tourism
industry.
Negative impacts of tourism to the environment
Deforestation, cutting down trees or shrubs for firewood, particularly while
hiking and camping

36
Soil erosion; air, noise and water pollution , littering ; decreased diversity of flora
and fauna ; and aesthetic degradation
Pollution as a result of improper disposal of solid waste from tourist facilities
4.4 MINING
This activity involves excavation of the earth’s surface and sub-surface for the purpose of
exploiting and processing minerals for economic and industrial development. The district
does not have many mining activities apart from the sand harvesting and quarrying.
4.4.1 Sand Harvesting and Quarrying
This activity is carried out under the authority and permission of the local authorities. It
pays little respect to the environmental aspects. Although the activity is not wide spread
in the district for the last few years, it is currently expanding at a high rate due to the
increased demands for construction raw materials.
Key environmental Issues
Open quarries act as breeding grounds for mosquitoes and other environmental
hazards.
Inadequate enforcement of relevant legislations governing the sector
Inadequate awarenessProposed Interventions
Rehabilitation of quarries and disused mines
Creating awareness on sustainable quarrying and mining activities
Enforcement of relevant legislations
Create awareness
4.4.2 Trends in Industrial Development in the District
The real industrial growth in Embu has somehow stagnated. There is no major industrial
growth. The Jua Kali has been growing but without proper planning. The Agro-based
Industries have not been expanding at a good rate. For example, Coffee & tea expansion
has stagnated while fruit canning and milk processing has experienced some expansion in
recent years. The wood industry was affected by the ban on forest exploitation of Mt.
Kenya forest.

37
The industries in the district include:
Tea factories
Coffee Industries
Wood based industry
Jua Kali
Processing industries (canning & Milk)
Service industry (shops & supermarkets)
Transport industry
Tourism (minimal)
4.5 SERVICES SECTOR
The services sector plays an important role in creating and supporting an enabling
environment that facilitates private sector investment, growth and job creation. The
provision of adequate services, coupled with macroeconomic stability and long-term
development strategy, are essential preconditions for sustainable economic and social
development. The sector also greatly contributes to the degradation of the district’s
environment. Though the roads are in moderate to poor condition, they serve as a
channel for transporting natural resources from the district, both legally acquired and
contraband. Runoff water from the roads causes erosion as it finds the natural course to
watercourses. Servicing of vehicles that ply these roads results to oils and grease polluting
soils and water
Key Environmental Issues
Pollution by waste from industries
Inadequate Ecotourism development in the forest reserve
Inadequate Infrastructure development
Proposed Interventions
Enforce regulations governing waste disposal
Develop ecotourism ventures
Infrastructure development

38
CHAPTER FIVE5.0 ENVIRONMENTAL HAZARDS AND DISASTERS
5.1 Extent and Trends of Environmental Hazards and Disasters
Hazard: A hazard is a potentially damaging physical event, human activity or
phenomenon with a potential to cause loss of life or injury, property damage, social and
economic disruption of life, environmental degradation among other effects.
Disaster: A disaster can be defined as a serious disruption of the functioning of the
society causing widespread human, material or environmental damage and losses, which
exceed the ability of the affected community to cope using their own resources.
Most disasters are climate/weather and tectonic movements related. They can both be
natural or manmade and in most cases lead to destruction of the environment, life and
property. They have the tendency to retard gains made in building meaningful livelihood
and economic development. In the district, there are several forms of disasters.
Some of most frequent disasters in the district include drought, fires and disease
outbreak.
Key Environmental Issues
Droughts
Fires
Landslides occurrence
Disease out breaks
Floods
Interventions Measures
Early warning mechanisms have been put in place to enhance prediction of
various weather conditions.
Dissemination of timely and accurate metrological data has to be recognized as
key to mitigate drought occurrences
Enhancement of the coping mechanism of the district’s population, with regard
to adverse environmental change and reduction of environmental insecurity
Mobilization of domestic financial resources for environmental management
Enhancement of institutional capacity to coordinate, monitor and supervise
environmental management
Improvement of environmental information systems

39
Setting targets and monitoring performances
CHAPTER SIX6.0. ENVIRONMENTAL EDUCATION AND TECHNOLOGIES
6.1. STATUS OF ENVIRONMENTAL EDUCATION
The Formal education system has integrated environmental education into the school
and tertiary level curriculum. This is done through biological, social and physical sciences.
Types of environmental programs in the district include wildlife clubs, environmental
clubs, eco-school programmes, tree planting programmes and school gardens.
Information on environmental issues that have been integrated in the subjects taught in
schools and tertiary colleges include:
Soil and water conservation
Pollution problems
Climate studies
Natural resources studies
Health and hygiene
Pests management
The informal education systems encompasses adult education and outreach programmes,
public barazas and village meetings
Key players in non-formal environmental programs
Department of Adult Education
Ministry of Agriculture
National Environment Management Authority
NGOs
Civil Society Organizations
Environmental issues integrated into non- formal programsThe environmental issues that have been integrated into the non- formal programs in the
district are:
Energy conservation methods through upesi jikos, solar cooker and sawdust
jikos.
Tree nursery, agro- forestry, poultry keeping, zero grazing
Soil and water conservation

40
Land pollution
Health education programmes
Agriculture
Waste management
Challenges of non-formal environmental educationThe non-formal environmental education is challenged:
Inadequate qualified staff.
In adequate teaching materials.
Lack of policy guidelines.
6.2. PUBLIC AWARENESS AND PARTICIPATION
Status of public awareness and participationLead Agencies and some CSOs and NGOs undertake public awareness on environment
and community participation. The channels of information dissemination and awareness
creation include; public barazas, demonstration and field days, CBOs, Environmental
clubs in schools, Electronic and the print media.
Key players in environmental awareness and public participation include:
National Environment Management Authority
Agriculture and Environmental Programme
Office of the President (Provincial Administration)
Ministry of agriculture
Forest department
Ministry of Information
Ministry of health
There is inadequate integration of environmental awareness into development planning
in the district. NEMA initiated award schemes for best practices in environmental
management. However, the programme has encountered challenges due to financial
constrains. Kenya Forest Service occasionally provides free seedlings for planting as an
incentive.
6.3. TECHNOLOGIES
The following are some of the technologies being applied to manage natural resources
and environment in the district.
Grafting in tree planting

41
Plastic and scrap metal recycling
Use of oil receptacles at petrol stations
6.4. ENVIRONMENTAL INFORMATION SYSTEMS
Types and sources of environmental informationData types available in the district include:
Climate
Natural resources
Pollution
Infrastructure
Demography
Diseases
Sources of environmental informationEnvironmental information in the district is found in the following forms.
Annual reports
Research studies and journals
Projects progress reports
Population censuses
Registers and files
District state of environment reports
Data/information in the district is available in the following Institutions
Government departments and local authorities
Non government Organizations
Special government projects and programs
Data Formats and AccessibilityThe available data formats in the district are purpose specific and vary from one source
to another. Most of the available information is in narrative form while a few are in
quantitative formats. Maps and electronic formats of presentation of information are
very rare. Some institutions charge a fee for information access.
Status of Environmental Information Management SystemsThe available information is scattered in various institutions in form of reports. Some of
the challenges include:
Inadequate information sharing between various institutions

42
Inadequate institutional capacity in information management
Some information is obsolete and inaccurate
Limited number of newsletters and magazines in the district
Limited local publications
6.5. INDIGENOUS KNOWLEDGE
There are various types of indigenous knowledge, innovations, and practices in the
district. The level of their applications in environmental management is low. The
indigenous knowledge is not well documented.
Key environmental issues
In adequate environmental reading materials
In adequate clear guidelines on environmental education
Low priority on environmental education within the curriculum
Low funding for environmental education
In adequate documentation of indigenous knowledge
Low levels of networking
Non-formal education programmes are facing difficulties in translating
environmental terminologies into local languages
Inadequate capacity for environmental education
Inadequate environmental awareness materials
High costs of technologies
Lack of policy framework on IK and data sharing
Proposed interventions
Develop environmental awareness materials
Dissemination of environmental awareness materials
Undertake documentation of indigenous knowledge
Mobilization of resources for environmental education
Introduction of rewards and sanctions and recognition
Translation of scientific information into simple format for the general public
Enhance the ICT infrastructure in environmental education
Provide policy guidelines
Integrate environmental awareness into development planning

43
Establish environment information centers
Baseline survey on the existence of environmental technologies and indigenous
knowledge
CHAPTER SEVEN7.0 ENVIRONMENT GOVERNANCE AND INSTITUTIONAL
FRAMEWORKS
7.1 OVERVIEW
Environmental governance in Kenya is through various legislations, standards and
regulations together with institutions that implement them. Before the enactment of
EMCA in 1999 as on overarching framework law, environmental management was
scattered in various sectoral legislations and some were conflicting. Environmental
Management and Coordination Act (EMCA 1999) devolve administration of a number
of environmental and natural resources management issues to communities. It recognizes
community rights, benefit sharing, pastoral land tenure and equitable and sustainable
access to land. The Environmental Management and Coordination Act addresses land
use management issues including sustainable land use, land use planning, and ecosystems
protection and management. The law identifies structures that oversee the equitable
distribution of benefits and devolution of decision making on natural resources. Further
EMCA empowers organised communities to formulate environmental actions and
conservation and management plans, through NEAPC, PECs and DECs.
7.2. STATUS OF ENVIRONMENTAL GOVERNANCE ANDINSTITUTIONAL ARRANGEMENT
Environmental governance in Kenya involves major players who are coordinated by
National Environment Management Authority. There are also sectors of the government
who have aspects of environmental management in their programmes and are referred to
as lead agencies in the EMCA. Environmental Impact Assessment and Environmental
Audit are tools used for planning for upcoming and existing projects respectively
Some of the Lead Agencies in the district
Ministry of Water and Irrigation
The Kenya Forest Service

44
Water Resources Management Authority and related Companies and Boards
Ministry of Works
Ministry of Housing
Ministry of Labour and Human Development
Mines and Geology Department
Ministry of Education, Science and Technology Development
Ministry of Medical Services
Ministry of Public Health and Sanitation
Ministry of Energy
Ministry of Agriculture
Ministry of Local Government
Kenya Wildlife Services
Ministry of Livestock Development
Ministry of Fisheries development
The Committees under EMCA 1999 are:
Public Complaints Committee
National Environment Tribunal
District and Provincial Environment Committees
7.4. REGULATORY INSTRUMENTS
Some environmental tools being employed in the district include
EMCA 1999 and its regulations
Public Health Act,
Forest Act 2004,
Wildlife Act,
Water Act 2002,
Mining Act,
Occupational, Health and Safety Act 2007,
Factories Act

45
7.5. MULTILATERAL ENVIRONMENTAL AGREEMENTS (MEAS)
Kenya has signed and ratified a number of MEAs and thereof is bound by the
requirement of the agreements. Development partners have supported environmental
management activities through these instruments.
Key areas where communities are involved in domestication of MEAs include:
Poverty eradication programmes.
Natural resource conservations and gender issues.
Environmental health.
Capacity building
Access to clean drinking water
Reduced child mortality
Environmental sustainability
However, there is needed to scale up the programmes to include more partners in order
to enhance the community involvement in the domestication of MEAs in the entire
district.International Agreements
Some of the international agreements include:
Convention on Biological Diversity (CBD)
Cartegena Protocol on Biosafety
United Nations Framework Convention on Climate Change (UNFCC)
The Vienna Convention on the Ozone Layer Protection
The Montreal Protocol of the Vienna Convention on Ozone Layer Protection
Kyoto Protocol to the UNFCC
United Nations Convention to Combat Desertification (UNCCD)
Convention on International Trade in Endangered Species (CITES)
Convention for the Protection of the World Cultural and Natural Heritage
Convention on the Wetlands of International Importance especially as Waterfowl
Habitats (Ramsar Convention)
Convention on the Conservation of Migratory Species of Wild Animals (Bonn
Convention)
United Nations Convention on the Law of the Sea (UNCLOS)

46
Convention on the Control of Transboundary Movement of Hazardous Wastes
and their Disposal (Basel Convention)
Regional Agreements
The regional agreements include
Bamako Convention on the hazardous Wastes in Africa
African Convention on the Conservation of Nature and natural Resources
Tripartite Environmental Management Program for Lake Victoria
The Nile Basin Treaty of 1929
Millennium Development GoalsThe MDGs being implemented in district are:
Eradicate extreme poverty
Improve maternal health
Improve access to clean drinking water.
Universal education
Net working and partnership
Reduce child mortality
Combat HIV/AIDS, malaria and other diseases
Environmental sustainability
Key environmental issues Low level of domestication and implementation of MEAs
Inadequate public participation
Misconception on EIA and EA requirements and long term benefits
Proposed interventions
Enhanced MEAs implementation
Enforcement set legislations and regulations
Create awareness on EIA and EA requirements and long term benefits

47
CHAPTER EIGHT8.0 IMPLEMENTATION STRATEGY
8.1 Overview
This chapter focuses on the implementation strategy, monitoring and evaluation systems
that will be used in the management process during the plan period. It also presents
implementation, monitoring and evaluation matrix, that the Embu district will put in
place to ensure that the implementation of the plan is carried out to achieve the
objectives. The District Implementation and Monitoring Action Plans were developed
from intensive consultation workshops at District level.
Implementation of the Action Plan will not be a preserve of NEMA but all Kenyans and
non-Kenyans. It is everybody’s duty to identify any environmental intervention activity
or activities in this report and implement. This will involve resource mobilization from
within the district, Province, nationally and even internationally.
The donor community through registered NGOs and CBOs can support some of the
intervention strategies identified for addressing the challenges in the District. The Kenya
Government through various programmes in other ministries may also play an active role
in addressing the many challenges. Sectors like water, energy, forest, Mining, fisheries,
roads, housing, local authority, education, research and disaster management, agriculture
and livestock may individually or collectively through allocation of funds implement
environmental remedial measures.
8.2 MONITORING AND EVALUATION
Monitoring and evaluation will be carried out using participatory approaches where
stakeholders are involved at all stages. It will be undertaken on continuous basis through
meetings and field visits. Reports will be discussed at all stages but quarterly reports will
be prepared and reviewed. Evaluation will be undertaken periodically preferably on
annual basis in the line with the performance-contracting period in the public service.
The purpose of evaluation is to ensure efficient and effective implementation as well as
ensuring that environmental concerns have been addressed and integrated in
development process. It will involve documentation of best practices for the purpose of
replication. The implementation strategy will be evaluated using the matrix as shown in
table 6.

48
Table 6 : Implementation MatrixPRIORITYISSUES
OBJECTIVES OUTPUT ACTIVITIES STAKEHOLDERS
RESPONSIBLEINSTITUTION
Deforestation and loss of
biodiversity
Raise level of tree cover
in the district
Increase tree seedlings
production
Establishment of tree
nurseries
-Carry out survey on Status
of biodiversity
Forest department
of
Agriculture
-NEMA
-NGOs /CBOs
-KARI
Forest Department
Increase number of trees
planted on farms and
trust lands
-On-farm tree planting
-Hilltops reforestation
-Forest department
-Agriculture
--NGOs/CBOs
Forest Department
Water Pollution -Reduce water borne
diseases’ incidences
-clean water in rivers and
other reservoirs
-River bank protection
-Training on river bank
protection
-Formation and training of
River Users Associations
(RUAs)
Water office
Agriculture
Forest Dept.
MKEPP
ALRMP II
NEMA
Water Office

49
PRIORITYISSUES
OBJECTIVES OUTPUT ACTIVITIES STAKEHOLDERS
RESPONSIBLEINSTITUTION
Degradation of water
catchment areas/Hilltops
cultivation
Stop encroachment of
water catchment areas
-Increased river flow
-Reduced pollution of
water sources
-Hill top forestation
-Delineation and marking of
hilltop boundaries
Forest Dept.
Agriculture
ALRMP II
NEMA
Local Community
Forest Department
Land degradation due to
mining, quarrying and sand
harvesting
Reduce environmental
degradation
Clean and healthy
environment
-Inventorize all mining
/quarrying/sand harvesting
-Regulation of sand
harvesting
-follow up visits on mining
companies to ensure they
implement EMP in their
EIA/EA reports
-County council
-NEMA
-Sand harvesters
County Council

50
PRIORITYISSUES
OBJECTIVES OUTPUT ACTIVITIES STAKEHOLDERS
RESPONSIBLEINSTITUTION
Poor waste (solid/liquid)
management
Improve management
of waste in the district
Clean and healthyenvironment.-Reduced diseaseincidences
Development of dumpsites
in the main urban centers
Acquisition of litterbins by
business community
Sensitization meetings
Garbage collection
Construction of sewerage
system
County council
Public health
CDF
NEMA
Chamber of
commerce
County Council
Land degradation from road
run off
Reduce Pollution of
water sources
-Clean water in rivers
-Reduction in gully
formation
-Stabilization of road
embankment
-Roadside forestation
-Roads and Public
works
-Forest Dpt.
-County council
-NEMA
Roads and Public
Works

51
PRIORITYISSUES
OBJECTIVES OUTPUT ACTIVITIES STAKEHOLDERS
RESPONSIBLEINSTITUTION
Low awareness on
environmental issues
Raise public awareness
on environmental
conservation
Improved management
of the environment
-Sensitization Barazas
-Establishment and training
of environmental clubs in
schools and tertiary
institutions
-Establishment of
environment and safety
committees in
institutions/companies
-Establishment of District
Environmental Information
and Documentation Center
-NEMA
-Education
-Office of the
president
-All GOK
departments
-NGOs/ CBOs
-CDF
-NEMA
-Office of the
president

52
Table 7: Monitoring and evaluation matrixActivity Ovis(Objectively
Verifiable Indicators)Movs(Means OfVerification)
Reporting Schedule Implementers ResponsibleInstitution ForM&E
Remarks
Establishment of
tree nurseries
-No. of nurseries
-No. of seedlings
-Field visits
-Reports
-quarterly, bi-annual,
annual
-KFS., farmers,
stakeholders
-KFS.
Carry out survey on
Status of
biodiversity
-Survey report -Survey report - NEMA,KFS,
KARI,KWS
NEMA
On-farm tree
planting
-No. of seedlings planted
-Ha planted
-Field visits
-Reports
-quarterly, bi-annual,
annual
-KFS Dept., farmers,
stakeholders
-KFS
Hilltops
reforestation
-No. of seedlings planted
-No. of hills forested
-field visits
-Reports
-quarterly, bi-annual,
annual
-forest Dept., farmers,
stakeholders
Forest Dept.
On-farm soil
conservation
-No. of farms conserved
-Meters of terracing done
-field visits
-Reports
-quarterly,bi-
annual,annual
Agriculture, farmers,
stakeholders
Agriculture
Farmers training on
soil conservation.
-No. of farmers trained
-No. of trainings carried out
-List of farmers
-Invitation letters
-training program
Annual Agriculture, farmers,
stakeholders
Agriculture

53
Activity Ovis(ObjectivelyVerifiable Indicators)
Movs(Means OfVerification)
Reporting Schedule Implementers ResponsibleInstitution ForM&E
Remarks
Sensitization onnegative impacts ofslash and burnmethod of landpreparation
-No. of Barazas -Reports
-Field visits
Annual Agriculture, farmers,
stakeholders
Agriculture,
Rehabilitation of badly
eroded areas
No. of sites rehabilitated -Reports
-Field visits
Annual Agriculture, MOLDF
farmers, stakeholders
Agriculture,
Livestock
River bank protection -Meters of river bank
protected
-Field visits
-Reports
Annual Forest, water,
agriculture, NEMA,
Farmers
Agriculture
Development of
dumpsites in the main
urban centers
No. of dumpsites developed -Reports
-Field visits
Annual County council, Public
health, NEMA,
stakeholders
County council
Inventorize all mining/quarrying/sandharvesting
No. and type -Inventory developed
-Field visits
Annual NEMA, County council,
OP, Stakeholders
NEMA
Sensitization Barazason environmentalconservation
-No of Barazas Report
Field visits
Annual NEMA, OP,
Stakeholders
NEMA, OP
Establishment ofDistrictEnvironmentalInformation andDocumentationCenter(DEIDC)
DEIDC established -Reports
-Site visit
- NEMA, Stakeholders NEMA

54
REFERENCESGOK (2004) -Economic Recovery Strategy for Wealth and Employment Creation
GOK (2001) -Poverty Reduction Strategy Paper (PRSP) 2001 - 2004
GOK (2002) -District Development Plans 2002-2008
NEMA 2004 & 2005 -NEMA State of Environment Reports for the years 2003 and 2004GOK (2002) -Economic survey
GOK (2000) -Statistical Abstract
GOK (2004 & 2005) Government District Departments Annual Plans
GOK (1999) Population and Housing Census