report recommending region of waterloo investigate urban living
TRANSCRIPT
8/13/2019 Report recommending Region of Waterloo investigate urban living
http://slidepdf.com/reader/full/report-recommending-region-of-waterloo-investigate-urban-living 1/14
Report: P-14-021/PH-14-006
1564164 Page 1 of 14
Region of Waterloo
Planning, Housing and Community Services
Transportation Planning
Public Health
Healthy Eating and Active Communit ies
To: Chair Sean Strickland and Members of the Community Services Committee
Date: February 11, 2014 File Code: D10-70
Subject: NEWPATH Research Project
Recommendation:
That the Region of Waterloo partner with the NEWPATH research team (consisting ofthe Universities of British Columbia, Alberta and Waterloo) to explore fundingopportunities to complete a follow up study measuring walking, physical activity, dietand health changes resulting from the implementation of Regional policies and masterplans, as described in Report No. P-14-021/PH-14-006, dated February 11, 2014.
Summary:
Walkability has been a focus of research linking land use policies and health outcomesin large cities across North America. Four factors regularly linked to walkability are: 1)street pattern, 2) residential density, 3) variety of potential walking destinations and 4)design of retail stores. More walkable neighborhoods tend to have a grid street pattern,with a mixture of housing including at least some townhomes, mid rise and/or high riseapartments or condominiums. There are many different types of places to walk to
including, retail stores, services, parks, schools, and recreation centers.
Region of Waterloo Public Health is mandated by the Ontario Public Health Standardsto increase the proportion of the population that lives, works, plays, and learns inhealthy environments to contribute to chronic disease prevention. The Regional GrowthManagement Strategy and the Community Building Strategy along with the RegionalOfficial Plan, the Regional Transportation Master Plan and the Active TransportationMaster Plan are health promoting policies and tools. To help measure and monitor theimpact of these policies and tools on the health of citizens within Waterloo Region,

8/13/2019 Report recommending Region of Waterloo investigate urban living
http://slidepdf.com/reader/full/report-recommending-region-of-waterloo-investigate-urban-living 2/14
February 11, 2014 Report: P-14-021/PH-14-006
1564164 Page 2 of 14
Public Health and Planning, Housing and Community Services partnered with academicresearchers from across Canada. This work assessed variations in travel patterns,physical activity rates, diet and health outcomes in the built environment of Cambridge,Kitchener and Waterloo. The results from this baseline study show that walkability issignificantly related to differences in travel mode choices, physical activity and walkingrates.
Regional Council was made aware of this NEPWATH project during the fundingproposal stage. After several years of data collection and analysis, the work issubstantially complete. This report has been tabled to both highlight the results of theproject and to recommend participation in the next stage of the initiative, namelymonitoring trends in health related to changes in the built environment. This work wouldbe co-ordinated with the research team at the University of Waterloo who have beentasked with implement baseline metrics pertaining to transit investment in the CentralTransit Corridor, as described in Report: P-13-123, to ensure no duplication of efforts.
Report:
The Regional Growth Management Strategy outlines a range of initiatives designed tohelp plan and manage growth throughout Waterloo Region in a way that accommodatesa growing population while continuing to support a healthy and prosperous community.The NEWPATH (Nutrition, Environment in Waterloo Region, Physical Activity,Transportation and Health) research project presented a 2009 snapshot of the builtenvironment of Cambridge, Kitchener and Waterloo and described variations in walkingrates and travel patterns that exist across variations in walkability across thecommunity. This project provided an unique opportunity to measure and monitor theimpact of Regional policies and investments on travel choices, physical activity andwalking rates.
The project was led by Dr. Lawrence Frank from the University of British Columbiaalong with Dr. Kim Raine and Dr. Leia Minaker from the University of Alberta, and Dr.Roy Cameron and Dr. Mary Thompson from the University of Waterloo. The Region ofWaterloo acted as a full research partner in the project with input provided from bothPublic Health and Planning, Housing and Community Services throughout the process.Representatives from the planning departments in Cambridge, Kitchener and Waterloowere consulted during the development of the project.
The NEWPATH project included three key elements that are critical to monitoringchanges happening in the Region:
1. A dataset which measured the quality of the built environment and walkability
within the Region.
2. An assessment of the relative quality of the food environment.
3. An extensive survey including a two-day travel diary, assessment ofneighborhood preferences, dietary choices and health outcomes.
While the NEWPATH project addressed how the built environment impacts both dietand physical activity, this report focuses on the impacts of the built environment on

8/13/2019 Report recommending Region of Waterloo investigate urban living
http://slidepdf.com/reader/full/report-recommending-region-of-waterloo-investigate-urban-living 3/14
Februar
156416
walkabilfocus o
Measur
Walkabi Australibeen mby condthings lientire cvarietyusing lamid-sizfrom ththrough
Walkabi
Waterlodensity,IndividuThese r “GettingCambriwalkabilhigher
Figure 1
y 11, 2014
ity, travelhow the q
ing Walka
lity assess, Europe,asured on
ucting wale lightingmmunitiesf places to
nd use datd commun Region ofthe inclusi
lity ratings
o through t2) Resideal walkabilitings are
Around” tge, Kitcheity acrossalkability
: Walkabili
ode choicuality of th
ility
ents havand more r e of two wing auditsnd the co
using lan walk to. T to assess
ity like WaWaterloo,n of pede
were calcu
he measur tial densit
ty ratingsvailable ob where viner, and Wambridge,
nd red indi
y in Camb
and neig food envi
been donecently inys: 1) Smn the qualdition of si use data le NEWP the walkaerloo Regithe resear trian trails
lated for e
ment of fo, 3) Rate oere then g the Regio
sitors can laterloo. Fi Kitchenercates area
idge, Kitc
borhood pronment i
e in large coronto anll scale asity of the pdewalks etike; streetTH studyility of an
on. Due toh team waand pathw
ch postal
ur objectivf mixed larouped intn’s walkinook up walure 1 provand Water s that have
ener and
Rep
referencespacts diet
ities acros Vancouv
sessmentsedestrianc. 2) Largeesign, resas the firsntire com
the high qs able to eays into th
ode in Ca
e land used use andhigh, me
section okability ratiides a maloo. Greenlower wal
aterloo,
ort: P-14-
. A followry choices
the Uniter. Walkabi
of single nnvironmen scale assidential det time the
unity hadality of dat
nhance th walkabilit
bridge, Ki
features: 14) Retail dium and lo the websitng for post of differeindicatesability.
EWPATH,
21/PH-14-
Page
p report wi.
States,lity has useighborhot, lookingssments osity, andethodologbeen useda available processratings.
tchener an
) Intersectisign.
w categorie under thal codes inces inreas that
2009-201
006
3 of 14
ll
allydstf
y ofin a
d
on
s.
ave

8/13/2019 Report recommending Region of Waterloo investigate urban living
http://slidepdf.com/reader/full/report-recommending-region-of-waterloo-investigate-urban-living 4/14
February 11, 2014 Report: P-14-021/PH-14-006
1564164 Page 4 of 14
Walkability ratings along with household income and household size were used torecruit 4,902 individuals from 2,228 households to participate in the research project.Participants completed several survey tools, including a two-day travel diary, to assessneighborhood preferences, walking rates, physical activity, diet and health outcomes.
Key Findings
Walkability was significantly related to differences in walking rates Walkability was significantly related to differences in all travel modes Walkability was significantly related to differences in Body Mass Index (BMI) Residents strongly preferred to live in neighborhoods with more space for
walking and cycling even if this means less space for cars Residents preferred to live in neighborhoods where they can walk or cycle to
shops and services at least some of the time
Walking Rates
Walking rates were significantly affected by the shape of the built environment. People
living in neighbourhoods with high walkable neighborhoods were 50 per cent more likelyto walk than those living in medium walkable neighborhoods and 180 per cent morelikely to walk than those living in low walkable neighborhoods.
Travel Mode
Walkability significantly impacted choices across all travel modes. In addition to higherwalking rates, transit and cycling trips were significantly more common and driving wassignificantly less common among those in high walkable neighborhoods compared tothose living in medium or low walkable neighborhoods. Table 1 presents results duringweekday pm peak travel periods.
Table 1: Travel mode by neighborhood walkability, NEWPATH, 2009-2010
High WalkableNeighborhood
MediumWalkableNeighborhood
Low WalkableNeighborhood
Personal vehicle* 65% 83% 87%
Walk 24% 12% 10%
GRT 5% 3% 2%
Bike 6% 2% 2%*includes both drivers and passengers.
Travel Preferences
While the overall percentage of people cycling or taking transit was low, surveyresponses indicated that a much larger percentage of people across all age categorieswould prefer to walk, cycle or take transit. Overall 58 per cent of respondents indicated

8/13/2019 Report recommending Region of Waterloo investigate urban living
http://slidepdf.com/reader/full/report-recommending-region-of-waterloo-investigate-urban-living 5/14
February 11, 2014 Report: P-14-021/PH-14-006
1564164 Page 5 of 14
they would prefer to walk rather than drive, 28 per cent would prefer to cycle and 17percent would prefer to take transit. The preferences were strongest from those who livein high walkable neighborhoods and among those 19 to 24 years old.
Neighborhood Preferences
Participants were asked to rate the importance of factors that impacted their decision tomove to their present neighborhood. The five most important factors from thoseplanning to move in the next three years were: 1) Ease of Walking, 2) Low Crime rates,3) Living near Public Transit, 4) Closeness to job and 5) Quality of schools.
When asked to choose preferences between a series of different neighborhoodcharacteristics, respondents indicated strong support for:
Neighbourhoods with more space for walking and biking Neighborhoods close to a variety of shops and services Neighborhoods that make it easy to walk or cycle to at least some of their
destinations
Neighborhoods where they would have a shorter commute to work
Health Outcomes
Health outcomes were measured two ways: 1) Through an assessment of the BodyMass Index (BMI) and 2) through measurement of waist circumference of eachparticipant. In addition, one person in each household responded to questions abouttheir health status, specifically if they had been medically diagnosed with high bloodpressure, heart disease, diabetes or asthma. People living in high walkableneighborhoods had statistically significant lower BMI and smaller waist circumferencethan those in medium or low walkable neighborhoods. People living in high walkableneighborhoods also had lower rates of high blood pressure and fewer incidents ofdiabetes than those from low and medium walkable neighborhoods; however thesedifferences were not statistically significant
The World Health Organization developed a tool to estimate the health impacts ofimprovements in walking and cycling rates across a community. According to thesecalculations, if the walking rates of those living in high walkable neighborhoods werereplicated across all of Cambridge, Kitchener and Waterloo, 73,957 additional peoplewould be walking regularly and there were would be approximately 83 fewer deaths inthe Waterloo Region each year.
Conclusions
Walkability has been a focus of research designed to inform land use policy in largecities across North America. This was the first time that significant efforts focussed on amid sized community like Waterloo Region. The results from the NEWPATH studyclearly indicate that even in a mostly suburban community, the way the community isdesigned plays an important role in determining travel behaviour, physical activity andwalking rates. These results reaffirm the Healthy Public Policy directions taken by theRegion of the Waterloo through the Growth Management Strategy, the Regional OfficialPlan and the Regional Transportation Master Plan.
8/13/2019 Report recommending Region of Waterloo investigate urban living
http://slidepdf.com/reader/full/report-recommending-region-of-waterloo-investigate-urban-living 6/14
February 11, 2014 Report: P-14-021/PH-14-006
1564164 Page 6 of 14
Regional staff would like to acknowledge the following people across the country thathave provided meaningful contributions to the project design and analysis presented inthis report: Dr. Lawrence Frank, Dr. Kim Raine, Dr. Mary Thompson, Dr. Roy Cameron,Dr. Leia Minaker, Kathleen McSpurren, Dr. Josh vanLoon, Rehan Waheed, MargaretParkin, Tim Shaw, and Suzanne Kershaw.
Proposed Next StepsThe timing of the NEWPATH project provides a unique opportunity to partner withacademic community to monitor and measure the impact of the Growth ManagementStrategy and the Big Shift toolbox on community design, travel behaviours and healthimpacts across the community in future years.
1. Regional staff will continue to work with Area Municipalities to utilize the datacollected in this project to inform reports, policies, and tools used to shape ourcommunity.
2. Planning, Housing and Community Services and Public Health will work with theNEWPATH research team to explore ways to incorporate findings from
NEWPATH into the Community Building Strategy economic impact study.3. Planning, Housing and Community Service and Public Health along with Area
Municipalities and the NEWPATH research team (Dr. Lawrence Frank, Dr. LeiaMinaker, & Dr. Mary Thompson) will explore funding opportunities to complete afollow up study measuring walking, physical activity, diet and health impactsresulting from the implementation of health promoting land use tools (i.e.Regional Official Plan, Regional Transportation Master Plan, ActiveTransportation Master Plan).
Area Munic ipal Consul tat ion/Coordination
Representatives from the planning departments in Cambridge, Kitchener and Waterlooprovided input into the development of the research project and provided data thathelped inform the creation of the walkability index. Early discussions with AreaMunicipalities have explored how the data could be utilized by Area Municipalities tohelp inform their planning processes.
Corporate Strategic Plan:
Encourage compact, livable urban and rural settlement form.
Develop, optimize and maintain infrastructure to meet current and projected needs.
Develop, promote and integrate active forms of transportation (cycling and walking).
Foster healthy living through information, education, policy development and healthpromotion.
Collaborate with the community to support older adults to live healthy, active lives.
Financial Implications:
A total of $600,000 in project funding was provided by the Canadian Institutes for Health
8/13/2019 Report recommending Region of Waterloo investigate urban living
http://slidepdf.com/reader/full/report-recommending-region-of-waterloo-investigate-urban-living 7/14
February 11, 2014 Report: P-14-021/PH-14-006
1564164 Page 7 of 14
Research and the Heart and Stroke Foundation. The Region of Waterloo contributed$180,000 through direct funding and the purchase of equipment needed to complete theresearch. Specifically, the Region of Waterloo contributed $50,000 per year for 3 yearsand purchased $30,000 worth of accelerometers, which was all funded from withinexisting budgets. Bombardier contributed an estimated $100,000 through fundingprovided to Dr. Lawrence Frank as the Bombardier Chair in Sustainable Transportation
Systems at the University of British Columbia.
Other Department Consultations/Concurrence:
Public Health and Planning, Housing and Community Services worked togetherthroughout the research project. Data developed by this project has been used byPublic Health in physical activity promotion, food systems planning and to inform reportslike the recently released Shifting Gears report and it will be shared with communitystakeholders such as the Waterloo Region Healthy Communities Partnership and theWaterloo Region Active Living Network. The NEWPATH data informed the draft ActiveTransportation Master Plan.
Attachments:
Appendix A – Selected Tables from Research Analysis
Prepared By: Patrick Fisher , Transportation Demand Management Planner
Katherine Pigott, Manager of Healthy Eating and Active Communities
Approved By: Rob Horne, Commissioner, Planning, Housing and Community Services
Dr. Liana Nolan, Commissioner/Medical Officer of Health
8/13/2019 Report recommending Region of Waterloo investigate urban living
http://slidepdf.com/reader/full/report-recommending-region-of-waterloo-investigate-urban-living 8/14
February 11, 2014 Report: P-14-021/PH-14-006
1564164 Page 8 of 14
Appendix A – Selected Tables from NEWPATH project
In 2007, Region of Waterloo recruited academic leaders from across Canada tocomplete a rigorous assessment of the built environment in Waterloo Region and itsimpact on travel patterns, physical activity rates, dietary consumption patterns andhealth. This was the first time in Canada that this level of scrutiny was focussed on a
mid-sized community like Waterloo Region. The NEWPATH (Nutrition, Environment inWaterloo Region, Physical Activity, Transportation and Health) research project wasfunded by the Heart and Stroke Foundation, Canadian Institutes for Health Researchthe Region of Waterloo and Bombardier. The project was led by Dr. Lawrence Frankfrom the University of British Columbia, one of the pioneers in the study of health andthe built environment across North America. Dr. Kim Raine and Dr. Leia Minaker fromthe University of Alberta conducted ground breaking assessment of the quality of thefood environment in Waterloo Region. Local leadership was provided by Dr. RoyCameron and Dr. Mary Thompson who provided direction in research design andknowledge exchange. Region of Waterloo acted as a full partner in the research projectwith input provided from Public Health, Transportation Planning and Community
Planning throughout the process.Walkability assessments have been done in large cities across the United States,
Australia and Europe. Recently, walkability assessments have been completed inToronto and Vancouver. The NEWPATH study was the first time the methodology hadbeen used in a mid-sized community like Waterloo Region. Researchers found workingwith the Region presented an opportunity to improve the assessment methodology dueto the high quality of local land use data. Walkability ratings were created for eachpostal code in Kitchener, Waterloo and Cambridge based on findings in previousresearch that most people are willing to walk about ten to twelve minutes to get to aregular destination. This translates into a distance of about eight hundred metres to onekilometre. Previous research identified that the land uses within one kilometer from
home have the biggest impact on walking behaviour. This is consistent with theresearch findings from NEWPATH where 70 per cent of walking trips taken were onekilometer or less. Staff at Region of Waterloo worked with the NEWPATH researchersto integrate trails and pathway data into the road network. This is the first time we areaware that this type of data has been included in walkability research and represents animportant innovation.
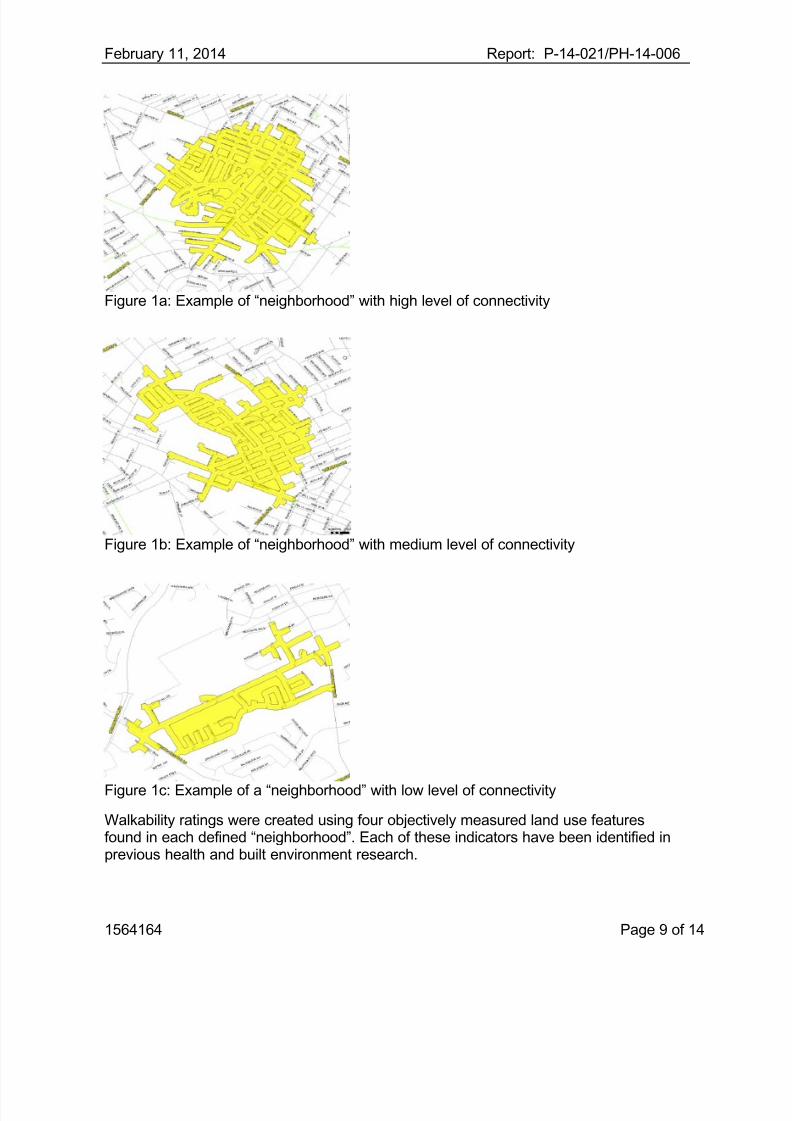
Each household’s “neighborhood” was created using GIS tools starting with the middleof the postal code; a map was created one kilometer long in every direction. Everyproperty within twenty-five metres of a road, pathway or trail was included in theanalysis. The figures below provide some examples of how the walkable
“neighborhoods” differ across different “neighborhoods” in Waterloo Region.
8/13/2019 Report recommending Region of Waterloo investigate urban living
http://slidepdf.com/reader/full/report-recommending-region-of-waterloo-investigate-urban-living 9/14
February 11, 2014 Report: P-14-021/PH-14-006
1564164 Page 9 of 14
Figure 1a: Example of “neighborhood” with high level of connectivity
Figure 1b: Example of “neighborhood” with medium level of connectivity
Figure 1c: Example of a “neighborhood” with low level of connectivity
Walkability ratings were created using four objectively measured land use featuresfound in each defined “neighborhood”. Each of these indicators have been identified inprevious health and built environment research.

8/13/2019 Report recommending Region of Waterloo investigate urban living
http://slidepdf.com/reader/full/report-recommending-region-of-waterloo-investigate-urban-living 10/14
Februar
156416
a)i
c
it
bb)
oet
c)ss
d)g
et
This meadditionpresent
Figure 1
y 11, 2014
treet patt walking r onversely,reate longegion manquicker an
een studieesidentialn the streenable retaie neighboariety of dhops, resttores, andalking rateetail stor enerally n
ntrances aerefore co
thodologyal element the relati
: Walkabili
rn . Neighutes, mor neighborhr, loopiery cul-de-sd easier to
.density.
t” which rel stores anrhood alsoestinationurants, ser places ofs.design. N
t very app
nd more linsidered
nd appro, includinge walkabili
y in Camb
orhoods w direct rouods with f ays to getcs have pget to des
ore peoplults in an i transit roencourages. Havingvices, enteorship in t
eighborhoaling to p
ited parkiore walka
ch can beemploymy across
idge, Kitc
ith more foes to destiewer intersto destinatthway coninations th
living in amproved stes to flous others tohe option trtainment,e neighbo
ds with bidestrians.
g usuallyle.
built upon int densityambridge,
ener and
Rep
ur-way stonations, anections oftions. Inter nections tan in other
neighborhense of saish. Seeinoutside ao walk toparks, recrhood is as
box storeHowever,
ave store
n the futur and affordKitchener
aterloo,
ort: P-14-
s provided smalleren have custingly, intrail netwcommuniti
ood providety. Highe more ped active.ore destineation censociated w
s or largeetail areas
closer tog
to measuble housin
and Waterl
EWPATH,
21/PH-14-
Page 1
extra choiclock sizes.l de sacs t
aterloorks that mes that ha
e more “ey densitiesple active i
ations likeres, groceith higher
arking lotswith side
ether and
re and mog. Figure 1oo.
2009-201
006
0 of 14
es
at
kee
es
n
y
arealk
re
itor

8/13/2019 Report recommending Region of Waterloo investigate urban living
http://slidepdf.com/reader/full/report-recommending-region-of-waterloo-investigate-urban-living 11/14
February 11, 2014 Report: P-14-021/PH-14-006
1564164 Page 11 of 14
NEWPATH Survey
Variations in walkability along with household income and household size were used into recruit participants for a survey. The surveys were administered by the SurveyResearch Centre at the University of Waterloo. Participants were recruited from across
Cambridge, Kitchener and Waterloo. In total, 4902 individuals in 2228 householdsparticipated in the survey answered questions about their family’s demographics,normal physical activity patterns, walking rates, preferred features of the neighborhood,and motivations for shopping at different types of food stores. They also completed atravel diary of where and how they travelled on two specific days. A subset ofparticipants also completed a two-day dietary diary. Together they recorded details on36,398 trips that took place between 2009 and 2010.
Table 1: Characteristics of participants, NEWPATH, 2009-2010Household Income Gender Age (years)
Under 35,000 11%35-000-85,000 38%
Over 85,000 50%
Male 47%Female 53%
Under 18 15%19-24 8%
25-44 32%45-65 34%Over 65 11%
Commuting distance to work or school :
Overall, 90 per cent of respondents reported living within 30 kilometres of work orschool. As Table 2 illustrates, those living in more walkable neighborhoods live evencloser to work or school.
Table 2: Commuting distance to work or school by neighbourhood walkability,
NEWPATH, 2009-2010
% ofrespondents
Low WalkableNeighborhood
Medium WalkableNeighborhood
High WalkableNeighborhood Overall
50% 8km or less 7km or less 4km or less 6km or less
80% 20km or less 17 km or less 13km or less 18km or less
90% 32km or less 27 km or less 23 km or less 30km or less
Factors that influenced walking rates
1) Car ownership: Those who did not own a motor vehicle were over six timesmore likely to walk than those in households with two vehicles. Those with onlyone vehicle were 1.6 times more likely to walk than those with two vehicles.
2) Walkability: People living in high walkable neighborhoods were 2.8 times morelikely to walk than those in low walkable neighborhoods and 1.5 times more likelyto walk than those living in medium walkable neighborhoods.
3) Sex: Women were 1.4 times more likely to walk then men.

8/13/2019 Report recommending Region of Waterloo investigate urban living
http://slidepdf.com/reader/full/report-recommending-region-of-waterloo-investigate-urban-living 12/14
February 11, 2014 Report: P-14-021/PH-14-006
1564164 Page 12 of 14
4) Age: Young people (19 to 24 years) were 1.6 times more likely to walk thanthose over 65 years.
5) Household s ize: People living on their own were 1.4 times more likely to walkthan those in two person households. Households with three or more peoplewere 1.2 times more likely to walk than two person households.
6) Household income: Those in higher income households (over $85,000) were
1.2 times more likely to walk than those in medium income homes and 1.3 timesmore likely to walk than those in low income (below $35,000) households.
Travel Patterns
Everyone 10 years of age or older in each household was asked to complete a two-daydiary of where they went, how they got there and what they did when they got there.Overall, 79 per cent of reported trips were taken for a specific purpose, 21per cent werefor recreation or leisure.
Table 3: Travel mode during weekday peak travel period by neighbourhood walkability,NEWPATH, 2009-2010
High
WalkableNeighborhood
Medium
WalkableNeighborhood
Low WalkableNeighborhood
Personalvehicle* 65% 83% 87%
Walk 24% 12% 10%
GRT 5% 3% 2%
Bike 6% 2% 2%
*includes both drivers and passengers
Travel preferences
While the overall percentage of people cycling or taking transit was low, surveyresponses indicated that a much larger percentage of people across all levels ofwalkability (Table 4) and age categories (Table 5) would prefer to walk, cycle or taketransit.
Table 4: Travel mode preferences by neighbourhood walkability, NEWPATH, 2009-2010
High WalkableNeighborhood
MediumWalkableNeighborhood
Low WalkableNeighborhood
Overall Average
I prefer to take transitrather than drivewhenever possible 27% 13% 11% 17%

8/13/2019 Report recommending Region of Waterloo investigate urban living
http://slidepdf.com/reader/full/report-recommending-region-of-waterloo-investigate-urban-living 13/14
February 11, 2014 Report: P-14-021/PH-14-006
1564164 Page 13 of 14
I prefer to walk ratherthan drive wheneverpossible 72% 53% 52% 58%
I prefer to bike ratherthan drive whenever
possible 36% 22% 25% 28%I need a car to domany of the things Ilike to do 74% 89% 93% 86%
Those aged 19 to 24 years showed the strongest interest in cycling and taking transit.(Table 5) This preference is reinforced by the fact that 78 per cent of those 19 to 24years indicate that they have a driver’s licence compared to 93 per cent of peoplebetween 25 and 65 years.
Table 5: Travel mode preferences by age, NEWPATH, 2009-201019 to 24years
25 to 44years
45 to 64years
65+ years
I prefer to take transitrather than drivewhenever possible 48% 14% 14% 18%
I prefer to walk ratherthan drive wheneverpossible 65% 62% 57% 58%
I prefer to bike rather thandrive whenever possible 46% 32% 14% 16%
I need a car to do manyof the things I like to do 54% 85% 91% 90%
Neighborhood PreferencesThe survey asked respondents about their neighborhood preferences in a couple ofdifferent ways. First respondents were asked to identify how important differentneighborhood features were when choosing where they presently live. (Table 6)

8/13/2019 Report recommending Region of Waterloo investigate urban living
http://slidepdf.com/reader/full/report-recommending-region-of-waterloo-investigate-urban-living 14/14
February 11, 2014 Report: P-14-021/PH-14-006
1564164 Page 14 of 14
Table 6: Importance of neighborhood features in choosing where they live, NEWPATH,2009-2010
Rank OverallSample
Planning tomove in next3 years
High WalkableNeighborhoods
MediumWalkableNeighborhoods
Low WalkableNeighborhoods
1 Low crimerates
Ease ofwalking
Ease of walking Low crime rates Low crime rates
2 Near shops &services
Low crime Near shops &services
Near shops &services
Near shops &services
3 Ease ofwalking
Near publictransit
Low crime rates Ease of walking Quality ofschools
4 Near majorroads &
highways
Closeness to job
Closeness to job
Near majorroads &
highways
Near majorroads &
highways5 Closeness to
jobQuality ofschools
Lowtransportationcosts
Near outdoorrecreation
Near outdoorrecreation
6 Near outdoorrecreation
Lowtransportationcosts
Near publictransit
Quality ofschools
Ease of walking
7 Quality ofschools
Near shops &services
Near outdoorrecreation
Closeness to job
Closeness to job
8 Lowtransportationcosts
Near majorroads &highways
Near majorroads &highways
Near publictransit
Lowtransportationcosts
9 Near publictransit
Near parks &recreation
Quality ofschools
Lowtransportationcosts
Near publictransit
Respondents were then asked to identify their preference for seven differentneighborhood design elements (i.e., ability to walk to shops and services, lot size, mix of
housing, street pattern, travel distance, house size, and street design). Using a series ofimages they were asked to indicate which best represent the neighborhood they live inright now and which ones represent the type of neighborhood they would like to live in.
Overall respondents indicated more support for neighborhoods:
With more space for walking and cycling even if this means less space for cars Where they can walk to stores, libraries or restaurants, Where they can walk, cycle or take transit for some of their trips