recommending job ads to people
TRANSCRIPT

Recommending Job Ads to People
December 2014 @wisdelft & @RecSysNL
Fabian Abel, http://xing.com


Job recommendations

Recommender REST Service Returns a ranked list of items
4
User ID
[ {“item”: “urn:x-xing:job:5463323”, “score”: 0.87, “reasons”: […]}, {“item”: “urn:x-xing:job:5463267”, “score”: 0.87, “reasons”: […]}, {“item”: “urn:x-xing:job:5464812”, “score”: 0.87, “reasons”: […]}, {“item”: “urn:x-xing:job:5462781”, “score”: 0.87, “reasons”: […]}, ]
Response:
GET /rest/recommendations/jobs/user/4320245 Request::

Deployment infrastructure Infrastructure on which we deploy recommender services
5
Search indices
XIN
G
Sources / XING services
MySQL NoSQL
live updates
Batch processing
batch updates
Infrastructure for recommenders R
ecom
men
der R
EST
serv
ice
XING Products

RecSys Infrastructure Infrastructure on which we deploy recommender services
6
Search indices
XIN
G
Sources / XING services
MySQL NoSQL
live updates
Batch processing
batch updates
Infrastructure for recommenders R
ecom
men
der R
EST
serv
ice
XING Products

Pointers
7
• Scala, Play, Akka: https://playframework.com/ - https://typesafe.com/ (à start e.g. with some Activator template: https://typesafe.com/activator)
• Elasticsearch: http://www.elasticsearch.org/ (à start e.g. with “Getting started” on https://github.com/elasticsearch/elasticsearch)
• Hadoop & Co., e.g. Hortonworks distributionà e.g. https://github.com/hortonworks/hadoop-tutorials):
• Hive: https://cwiki.apache.org/confluence/display/Hive/LanguageManual+UDF
• Spark: https://spark.apache.org/
• Deployment, e.g.: https://www.docker.com/
Technologies

Building/enhancing a recommender service Typical steps within the development cycle
8
1. Analyze (click) data to identify potential features. Technologies: Hive, R, Excel
2. Implement batch jobs for creating “indexes” that build the basis for the chosen features. Technologies: Hive, MapReduce, Oozie, Elasticsearch, Cassandra, MySQL
3. Implement service logic that queries the “indexes” and implements the actual recommender interface (à def getRecos(userId: Long): Future[Seq[Reco[T]]]). Technologies: Scala, Play framework
4. Analysis and offline evaluation of recommender: quantitative statistics, manual assesment, leave-n-out-evaluation. Technologies: R, Scala
5. Deployment and A/B test phase with in-depth analyses. Technologies: R, Hive, Scala, Excel

Job Recommendation Framework

Challenge Identifying job postings that match the demands of the user and company
10
Job Recommender
0.92 0.8 0.76
… User
Job postings Companies
Job postings on XING
11
Title
Company
Employment type and career level
Full-text description
Employees of the company
Social benefits
Location
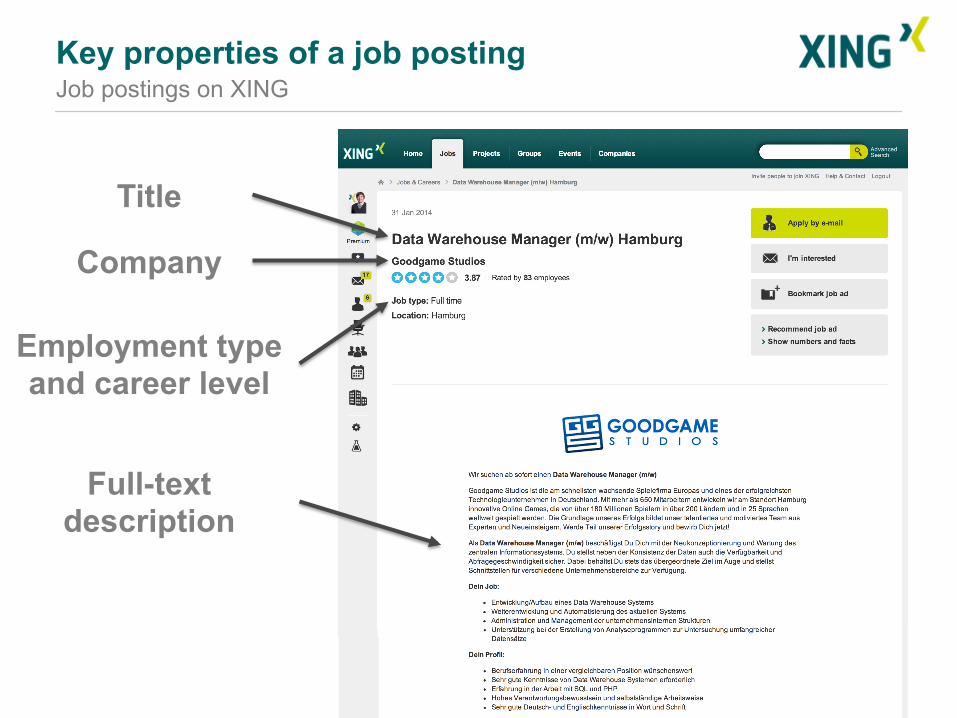
Key properties of a job posting

Job postings on XING
12
Title
Company
Employment type and career level
Full-text description
Employees of the company
Social benefits
Location
Key properties of a job posting

Key sources for understanding user demands Exploiting patterns that are found in the data(graph)
13
Social Network
explicit and implicit connections
Careerpath
Senior Data Scientist
Data Scientist
Engineer
Researcher
Data Strategist Manager
next career options
Profile Fabian Abel Data Scientist
Haves:
Interests:
web science
big data, hadoop skills & co.
Interactions
data
web
social media
clicks, shares, ratings
big data
kununu

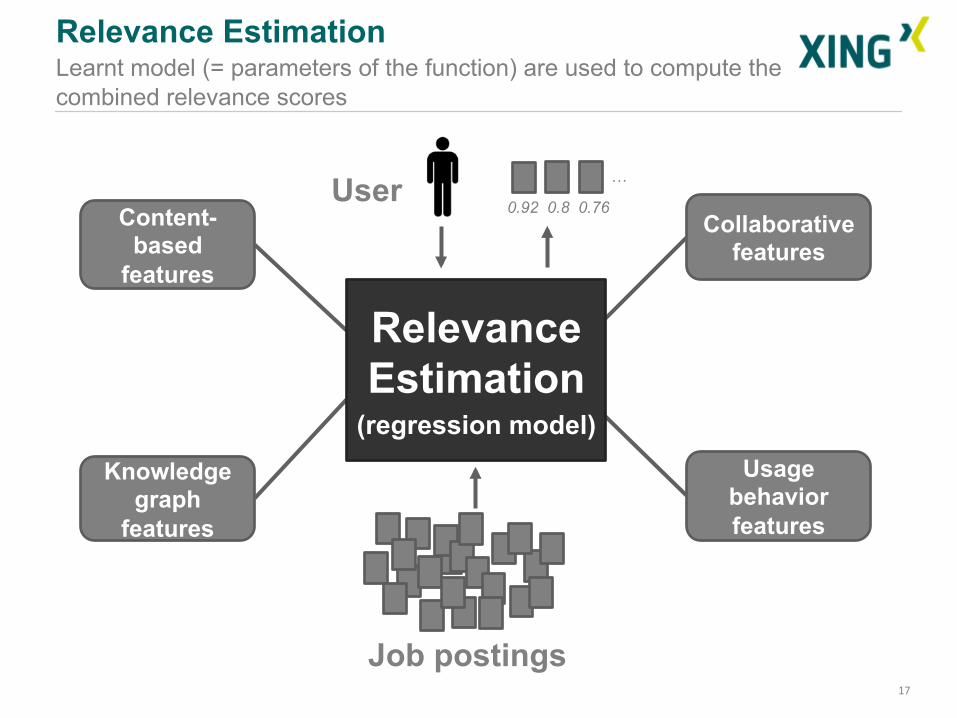
Relevance Estimation Final relevance score of an item is obtained by combining the scores coming from the “sub-recommenders” (= features)
14
Social Network
explicit and implicit connections
Careerpath
Senior Data Scientist
Data Scientist
Engineer
Researcher
Data Strategist Manager
next career options
Profile Fabian Abel Data Scientist
Haves:
Interests:
web science
big data, hadoop skills & co.
Interactions
data
web
social media
clicks, shares, ratings
big data
kununu
Content-based
features
Knowledge graph
features
Collaborative features
Usage behavior features
Relevance Estimation
(regression model)
Logistic Regression
P(relevant | x) = 1
1 + e -(b0 + bi xi) i n
feature vector impact of feature xi

Learning the model for relevance estimation
15
user i (was confronted with item x at Jme t)
x1: profile match
x2: interestg graph match
x3: cf score
x4: LocaJon match
x5: career level match
... relevant?
u1 (t1) 0.87 0 0.81 1.0 0.75 ... 0
u2 (t2) 0.0 0.76 0.61 0.15 1.0 ... 1
u3 (t3) 0.13 0.42 0 0 1.0 ... 0
u4 (t4) 0.5 0 0 0.0 0.0 ... 1
... ... ... ... ... ... ... ...
Model: b1 = 0.12 b2 = 0.05 b2= 0.5 b3 = 0.8 b4 = 0.65 .. b0 =1.43
u2 (t5) 0.0 0.76 0.61 0.15 1.0 ... 0
u3 (t6) 0.15 0.67 0.9 1.0 1.0 ... 1
... ... ... ... ... ... ... ...
... ... ... ... ... ... ...
P(relevant | x) = 1
1 + e -(b0 + bi xi) i n

Learning the model for relevance estimation
16
user i (was confronted with item x at Jme t)
x1: profile match
x2: interestg graph match
x3: cf score
x4: LocaJon match
x5: career level match
... relevant?
u1 (t1) 0.87 0 0.81 1.0 0.75 ... 0
u2 (t2) 0.0 0.76 0.61 0.15 1.0 ... 1
u3 (t3) 0.13 0.42 0 0 1.0 ... 0
u4 (t4) 0.5 0 0 0.0 0.0 ... 1
... ... ... ... ... ... ... ...
Model: b1 = 0.12 b2 = 0.05 b2= 0.5 b3 = 0.8 b4 = 0.65 .. b0 =1.43
u2 (t5) 0.0 0.76 0.61 0.15 1.0 ... 0
u3 (t6) 0.15 0.67 0.9 1.0 1.0 ... 1
... ... ... ... ... ... ... ...
... ... ... ... ... ... ...
! Model with highest predic4on accuracy wins the game
Training data
Test & validaJon data correct?
P(relevant | x) = 1
1 + e -(b0 + bi xi) i n
Relevance Estimation Learnt model (= parameters of the function) are used to compute the combined relevance scores
17
Social Network
explicit and implicit connections
Careerpath
Senior Data Scientist
Data Scientist
Engineer
Researcher
Data Strategist Manager
next career options
Profile Fabian Abel Data Scientist
Haves:
Interests:
web science
big data, hadoop skills & co.
Interactions
data
web
social media
clicks, shares, ratings
big data
kununu
Content-based
features
Knowledge graph
features
Collaborative features
Usage behavior features
Relevance Estimation
(regression model)
0.92 0.8 0.76
… User
Job postings

Relevance Estimation + Additional Filters Filtering (rules) may dampen the relevance scores or filter out items
18
Content-based
features
Knowledge graph
features
Collaborative features
Usage behavior features
Relevance Estimation
(regression model)
Job Reco. Service
Location-based
filtering
Social filtering
Filter out declined/
known
Career Level filtering
Filter

Mining for features Example: career path mining

Properties of career path steps Analyzing the CV (= professional experience + education)
20
Professional experience
Job title
Company
Time range
Career level Industry
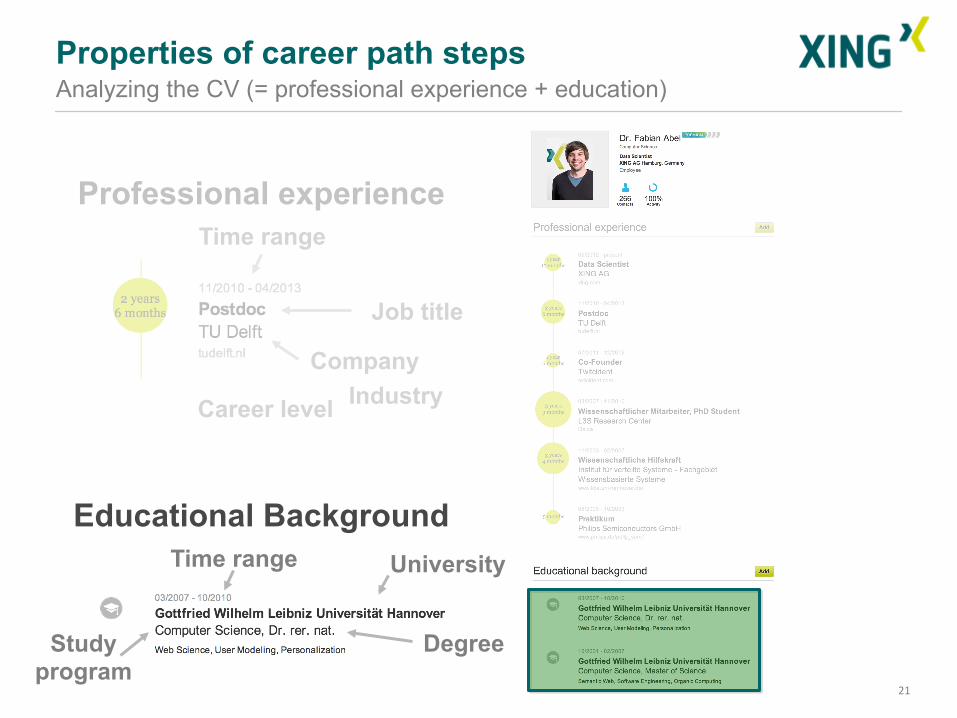
Properties of career path steps Analyzing the CV (= professional experience + education)
21
Educational Background Time range University
Degree Study program
Professional experience
Job title
Company
Time range
Career level Industry

Career path transitions Understanding transitions in the career path graph
22
Web Developer
J2EE Developer
Data Scientist
Machine Learning Expert
MSc Computer Science
CV:
MSc Computer Science
Web Developer
J2EE Developer
Data Scientist
Machine Learning Expert

Career path transitions Understanding transitions in the career path graph
23
Web Developer
J2EE Developer
Data Scientist
Machine Learning Expert
MSc Computer Science
CV:
MSc Computer Science
Web Developer
J2EE Developer
Data Scientist
Machine Learning Expert
Data Scientist
Machine Learning Expert
PhD Data Mining
CV:
J2EE Developer
Data Scientist
Machine Learning Expert
MSc Computer Science
CV:
PhD Data Mining

Career path graph Weighted directed graph with different types of nodes (job roles, education)
24
Association rule mining for constructing the career path graph:
• Association rules (= edges):
Job role A à Job role B
Education X à Job Role Y
...
• Minimum support (e.g. at least k transitions with A and B have to occur in the data)
• Minimum confidence (= probability(B | A) = weights of edges)
MSc Computer Science
Web Developer
J2EE Developer
Data Scientist
Machine Learning Expert
PhD Data Mining
Similarly, graphs are constructed for:
Industry X à Industry Y Job role Aà Company C
...
Thresholds for min-‐support and min-‐confidence need to be learned (ideally individually per “industry segment”)

Career path hypergraph Mining association rules with multiple premises
25
Association rule mining for constructung the career path graph:
• Association rules with more than one premise:
Job role A, Job role B à Job role C
Education X, Job role A à Job Role B
• Minimum support (e.g. at least k transitions with A and B and C have to occur in the data)
• Minimum confidence (= probability(C | A,B))
Data Scientist
Machine Learning Expert
PhD Data Mining
J2EE Developer

Inferring Features from Career path graph(s) Probabilities that the job role is appropriate for the user
26
User
Machine Learning Expert
PhD Data Mining
Job posting
Data Scientist
P( | , ) Data Scientist
Machine Learning Expert
= 0.79 F2: PhD Data Mining
P( | ) Data Scientist
Machine Learning Expert
= 0.52 F1:
Features:
P( | , ) Data Scientist
Machine Learning Expert
= 0.6 F3: 5 years experience
…
Career path
graph

27
futureme.xing.com futureme.xing.com
spin-off project which allows for browsing the career-path graph

28
futureme.xing.com

Evaluation of recommender systems

Evaluation of Recommender Systems Metrics & Methods
30
Key Metrics: Precision@k, “Success-Rates@k” (e.g. CTR)
Evaluation methods: • Quantitative statistics: count total number of recommendations per user,
measure overlap between old and new recommender, … • Ad-hoc assessments: UI for assessing the quality of individual
recommendations and comparing two lists • Leave-n-out cross validation: hide parts of the historic data, run the
recommender and try to predict the “hidden data” • A/B testing: x% of users are served with strategy A, 100-x% with strategy
Track history of interacJons: User X performs AcJon Y:
Training Data ValidaJon Data
Leave-‐n-‐out cross valida3on
Strategy X
Strategy Y
Measure Prediction X
Measure Prediction Y
A/B Tes3ng
Strategy X
Strategy Y
KPIs X
KPIs Y
Compare
Users
Group A
Group B

Is Strategy A better than strategy B?
31
0
0.1
0.2
0.3
0.4
0.5
0.6
0.7
0.8
A B
Success@4
Success@20
Based on 1 Million samples
Based on 1000 samples

Significance tests Example: t-tests
32
Null Hypothesis H0: performance of strategy A = performance of strategy B
Alternative H1: performance of A > performance of B
t-‐test computes p-‐value: probability that the staJsJcal result is – under the given null hypothesis – at least as extreme as the one that was observed ! reject H0 with p-‐value < α (= significance level)
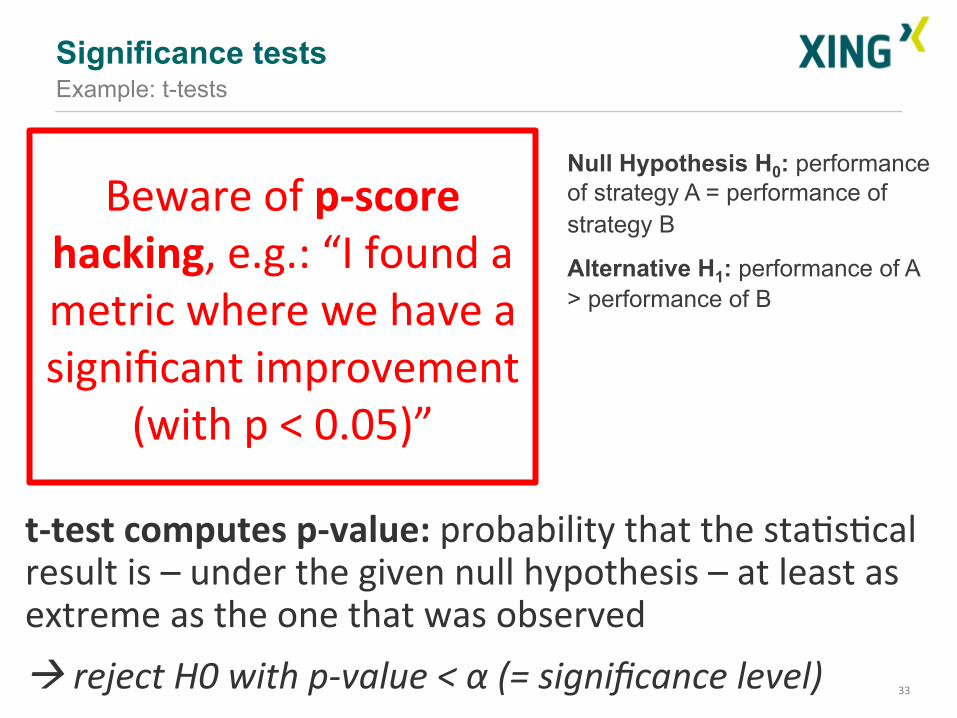
Significance tests Example: t-tests
33
Null Hypothesis H0: performance of strategy A = performance of strategy B
Alternative H1: performance of A > performance of B
t-‐test computes p-‐value: probability that the staJsJcal result is – under the given null hypothesis – at least as extreme as the one that was observed ! reject H0 with p-‐value < α (= significance level)
Beware of p-‐score hacking, e.g.: “I found a metric where we have a significant improvement
(with p < 0.05)”

Challenges regarding the evaluation Understanding the performance of a recommender system is not easy
34
Challenges:
• Tracking clicks/interactions, e.g. not all recommendation clicks/interactions can easily be tracked (e.g. email, third party apps are not properly tracked)
• Changes on the platform, e.g. A/B tests in the UI, marketing campaigns, etc. may impact the perfrormance of the recommender
• “Novelty” effect: if recommendations change strongly then users are curious and interact with recommendations, but after a while the curiosity may drop again which leads again to decreasing click-through-rates
• “Position bias”: top-ranked recommendations are more likely to be clicked “by defaut”
• “p-score hacking”: http://en.wikipedia.org/wiki/P-hacking

The professional network www.xing.com
Thank you
@fabianabel
xing.com futureme.xing.com