report department for transport and highways agency · department for transport and highways agency...
TRANSCRIPT

Reportby the Comptroller and Auditor General
Department for Transport and Highways Agency
Maintaining strategic infrastructure: roads
HC 169 SESSION 2014-15 6 JUNE 2014

Our vision is to help the nation spend wisely.
Our public audit perspective helps Parliament hold government to account and improve public services.
The National Audit Office scrutinises public spending for Parliament and is independent of government. The Comptroller and Auditor General (C&AG), Amyas Morse, is an Officer of the House of Commons and leads the NAO, which employs some 860 staff. The C&AG certifies the accounts of all government departments and many other public sector bodies. He has statutory authority to examine and report to Parliament on whether departments and the bodies they fund have used their resources efficiently, effectively, and with economy. Our studies evaluate the value for money of public spending, nationally and locally. Our recommendations and reports on good practice help government improve public services, and our work led to audited savings of almost £1.2 billion in 2012.

Report by the Comptroller and Auditor General
Ordered by the House of Commons to be printed on 5 June 2014
This report has been prepared under Section 6 of the National Audit Act 1983 for presentation to the House of Commons in accordance with Section 9 of the Act
Amyas Morse Comptroller and Auditor General National Audit Office
3 June 2014
HC 169 | £10.00
Department for Transport and Highways Agency
Maintaining strategic infrastructure: roads

This study examines the planned reductions to road maintenance budgets and the consequences for the network; and the systems and processes needed to achieve value for money on road maintenance.
© National Audit Office 2014
The material featured in this document is subject to National Audit Office (NAO) copyright. The material may be copied or reproduced for non-commercial purposes only, namely reproduction for research, private study or for limited internal circulation within an organisation for the purpose of review.
Copying for non-commercial purposes is subject to the material being accompanied by a sufficient acknowledgement, reproduced accurately, and not being used in a misleading context. To reproduce NAO copyright material for any other use, you must contact [email protected]. Please tell us who you are, the organisation you represent (if any) and how and why you wish to use our material. Please include your full contact details: name, address, telephone number and email.
Please note that the material featured in this document may not be reproduced for commercial gain without the NAO’s express and direct permission and that the NAO reserves its right to pursue copyright infringement proceedings against individuals or companies who reproduce material for commercial gain without our permission.
Links to external websites were valid at the time of publication of this report. The National Audit Office is not responsible for the future validity of the links.
10436 06/14 NAO

The National Audit Office study team consisted of: Alison Terry, Tracey Payne, Tristan Buckley, Lewis Egan and Ayanle Ali, under the direction of Geraldine Barker.
This report can be found on the National Audit Office website at www.nao.org.uk
For further information about the National Audit Office please contact:
National Audit Office Press Office 157–197 Buckingham Palace Road Victoria London SW1W 9SP
Tel: 020 7798 7400
Enquiries: www.nao.org.uk/contact-us
Website: www.nao.org.uk
Twitter: @NAOorguk
Contents
Key facts 4
Summary 5
Part OneImplementing budget reductions 10
Part TwoAchieving long-term value for money 27
Appendix OneOur audit approach 38
Appendix TwoOur evidence base 40

4 Key facts Maintaining strategic infrastructure: roads
Key facts
£344bn estimated value of England’s roads
187,000miles in England’s road networks
£4bnspent on maintaining England’s roads, 2012-13
4,400 miles of carriageway and 9,000 bridges
in the strategic road network maintained by the Highways Agency. It is 2 per cent of all roads, but carries a third of all vehicle traffi c and two-thirds of all road freight movements in England
152 local highway authorities, including Transport for London, which maintain the local road network
183,000 miles and more than 52,000 bridges
in the local road network, including 113,000 miles of streets and lanes (unclassifi ed roads)
£10.3 billion central government funding allocated to road maintenance, April 2015 to March 2021

Maintaining strategic infrastructure: roads Summary 5
Summary
1 England’s strategic and local road networks are our most highly valued infrastructure asset, at around £344 billion. The two networks comprise over 187,000 miles of roads. They include more than 61,000 bridges, numerous other features, such as embankments and retaining walls, and drainage systems. This infrastructure supports 90 per cent of passenger traffic and 68 per cent of freight movements. Maintaining it so that it is safe, serviceable and reliable is vital for the economy and the social well-being of communities.
2 The Department for Transport (the Department) is responsible for:
• operating, maintaining and improving the strategic road network in England (2 per cent of the road network), through the Highways Agency (the Agency); and
• providing guidance on network management, setting the legislative and policy framework for road maintenance and allocating capital funding and private finance initiative grants to local highway authorities.
3 The local road network, which is 98 per cent of all roads, is managed and maintained by 152 local highway authorities, including Transport for London.
4 In 2011, we reported on the planned reductions to road maintenance budgets in Reducing costs in the Department for Transport following the Spending Review 2010. The Department proposed to cut budgets by £1.2 billion. The Department for Communities and Local Government planned to reduce its grant to local authorities by 28 per cent in real terms over the four-year period. We concluded that these reductions risked deterioration in road quality and higher long-term costs, and might not be sustainable. The Committee of Public Accounts was also concerned that the Department:
• did not fully understand the likely impact of reducing road maintenance budgets; and
• expected local highway authorities to find savings of £223 million but was not clear how they would do this.

6 Summary Maintaining strategic infrastructure: roads
Scope of the report
5 In this report we examine whether highways authorities have:
• reduced road maintenance budgets as planned, how they have done so, and the consequences for the networks (Part One); and
• the right structures and information to achieve long-term value for money on road maintenance (Part Two).
6 We focused on the Department’s activities, and the local authority sector as a whole. Our audit approach and methods are in Appendices One and Two.
Key findings
Balance of funding
7 Injections of capital funding offset the reductions in revenue budgets. The overall budgets for road maintenance have not decreased as much as planned because of the government’s announcements of supplementary funding, often in the last quarter of the financial year, to address traffic bottlenecks and repair winter damage. The actual reduction in the Agency’s budget will now be 7 per cent, rather than the 19 per cent announced in the Spending Review 2010, despite a cut in the revenue budget of 27 per cent. Capital funding for local highway authorities has increased by 3 per cent instead of the planned reduction of 15 per cent. However, revenue funding, which is for all local authority services, has fallen by more than planned – around 33 per cent rather than 28 per cent (Figures 2 to 4 and paragraphs 1.12 to 1.13).
8 The change in the mix of funding and lack of predictability had practical implications and may cost more in the longer term. The Agency’s capital spending exceeded its revenue spending in 2012-13. Local highway authorities still spend more revenue on maintenance, but they told us that they were carrying out less routine activities, such as clearing gullies and inspection, which is essential to prevent water seeping into the road substructure. Highways authorities said that reducing the proportion of revenue to capital budgets further would make it difficult to maintain the condition of the networks (paragraphs 1.18, 1.19 and Figures 1, 5 and 6).
9 The condition of the strategic road network has improved but there is insufficient data to conclude on the local road network. The most recent data showed that the surface condition of the strategic network improved between 2003 and 2013. However deterioration may not yet be visible because the network is made of many materials and complex structures, some of which are hidden. The Department collects less data on the local road network. Public dissatisfaction about the surface and appearance of the networks has increased however (paragraphs 1.32 to 1.35).

Maintaining strategic infrastructure: roads Summary 7
10 The pattern of funding announcements and the planning cycle for maintenance, combined with having to spend money within the financial year, means that work peaks between September and March. Highways authorities plan their work programmes on indicative budgets, provided annually in December by central government. Actual funding is agreed in the spring and highways authorities revise their plans to fit budgets and do detailed design for the schemes. This means that most maintenance is done in the autumn and winter, which is less efficient because materials can be more difficult to handle in cold and wet conditions and daylight hours are shorter. As a result of the additional funding for emergency repairs, which is made available at the end of the financial year, almost all highways authorities need extra capacity from the market at the same time, which makes it less likely that they will get value for money (paragraphs 2.5 and 2.6 and Figure 14).
Optimising effort
11 Funding pressures have encouraged the Agency and local highway authorities to increase efficiency and innovation, but some measures may create long-term problems. The Agency’s contractors are using incident support units to carry out small maintenance tasks rather than keeping them on standby and using depots and equipment across multiple contracts for the public sector. In local authorities, there was a mixed picture, with examples given of savings from changing methods for repairing potholes and refreshing road markings more regularly so that motorists can see clearly when street lights were dimmed. However, some services were being stopped, for example structural maintenance on drainage assets, and there were reductions in skilled maintenance staff (paragraphs 1.21 to 1.24 and Figure 8).
12 Changes to budgets in-year do not promote value for money. Infrastructure UK has reported that certainty of funding is associated with cost savings of 10 to 20 per cent for routine maintenance. ‘Stop/start’ funding makes long-term planning more difficult for highways authorities and contractors cited unpredictable income as a disincentive to invest in improving efficiency (paragraphs 2.5 to 2.6 and Figure 13).
13 The Agency has a robust inventory and data about the condition of road surfaces which it used to target its maintenance efforts, but there are gaps in the information or quality issues which mean it was not used well to make decisions. For example, the Agency has introduced a national maintenance programme so it can make decisions based on the entire network. However, its data and deterioration modelling on some assets, such as drainage systems, still requires improvement. The Agency has increased staff’s commercial and asset management skills. There is further work to do and the Agency has begun to develop a detailed picture of what affects the costs of maintenance (paragraphs 2.8 to 2.11 and 2.13 to 2.15).

8 Summary Maintaining strategic infrastructure: roads
14 The extent to which local highway authorities use information to optimise road maintenance varied. The most effective authorities use information about their road network and the condition of their assets to help councillors make well-informed maintenance decisions. This helps counteract local pressure to do ‘worst first’ maintenance. However, at least 45 local highway authorities had not yet completed an asset management plan when surveyed in early 2014 (paragraphs 2.4, 2.12, 2.16 to 2.17 and Figure 16).
15 There are good examples of highway authorities working together locally to reduce costs and make improvements. Over half of local highway authorities are now members of maintenance alliances. These help them to share best practice and make savings on procurement. The London Highways Alliance Contract, developed as a joint initiative between Transport for London and London’s boroughs, extends collaboration by encouraging the four area-based contractors and 34 highway authorities to work together across boundaries, provide joint support, share best practice and success factors in performance and encourage innovation across and through the supply chain (paragraph 1.30 and Figure 9).
The Department’s response to these challenges
16 The Department is seeking to tackle the problems that are hindering cost-effective road maintenance. In June 2013, the government set out plans to change the Agency’s status to a limited company wholly publicly owned by the government, with six-year funding certainty for capital projects and maintenance, which has the potential to secure better value for money. The Department is also looking at how it allocates the annual grant of £976 million (April 2015 to March 2021) for maintenance to local highway authorities. It is, however, unable to guarantee that further ad hoc funding announcements will not be made throughout that period (paragraphs 2.19 and 2.21).
17 The Department has promoted best practice in local highways maintenance through the Highways Maintenance Efficiency Programme. This has also improved collaboration, but how far local highways authorities are involved varies widely. The Department has identified that it needs to target the Programme at those local highway authorities that need most help and give a more compelling, quantitative case for preventative maintenance (paragraphs 1.25 to 1.26 and 2.22 to 2.23).
Conclusion on value for money
18 There are positive signs of innovation by highways authorities in response to funding pressures on road maintenance. We believe that the Department understands the threat to value for money from uncertainty of funding. It is setting up a government company to address the problems in maintaining the strategic road network. However, this measure in itself will not be enough. Unless funding for both road networks is made more predictable and the allocation between capital and revenue balanced better, public value will be lost.

Maintaining strategic infrastructure: roads Summary 9
Recommendations
19 The Department should build on the steps that it has already taken to improve value for money by:
a working with HM Treasury and the Department for Communities and Local Government to address the barriers to long-term planning for road maintenance, such as the lack of predictability of funding for local highway authorities and the split between revenue and capital funding;
b improving its understanding of the current condition and future needs of the local road network, including structures; and
c identifying criteria to target the Highways Maintenance Efficiency Programme at those local highway authorities that need the most help, and develop evidence for local highway authorities to justify planned preventative maintenance.
The Agency should:
d have in place better data and modelling of deterioration for all its assets for the new government company.
20 In this report we evaluate the Department’s and the Agency’s performance. We have, however, seen that there is scope for some local authorities to become more efficient by:
• using information to build clearer cases for programmes of preventative maintenance; and
• increasing collaboration with other authorities and industry to make best use of constrained capacity and capability.

10 Part One Maintaining strategic infrastructure: roads
Part One
Implementing budget reductions
Introduction
1.1 England’s strategic and local road networks are our most highly valued infrastructure asset, at around £344 billion.1 The two networks comprise over 187,000 miles of roads. They include more than 61,000 bridges, numerous other features, such as embankments and retaining walls, and drainage systems. This infrastructure supports 90 per cent of passenger traffic and 68 per cent of freight movements.2 Maintaining them so that they are safe, serviceable and reliable is vital to the economy and the social well-being of communities.
1.2 The Department for Transport (the Department) is responsible for:
• operating, maintaining and improving the strategic road network in England (2 per cent of the road network) through the Highways Agency (the Agency); and
• providing guidance on network management to local highway authorities, setting the legislative and policy framework for road maintenance and allocating capital funding and private finance initiative grants to local highway authorities.3
1.3 Local highway authorities manage and maintain the local network – some 98 per cent of all roads. There are 152 local highway authorities in England, including Transport for London, which maintains London’s most important roads.
1 The value of the strategic road network was £109 billion at 31 March 2013. Local authorities use different accounting methods to central government to value their roads so there is no equivalent valuation data for the local network. In order to derive an estimate we have taken the Office for National Statistics valuation for the UK local road network (£275.3 billion at 31 December 2012), and apportioned it based on the relative local authority valuations for UK roads and English roads (£235 billion) from the draft Whole of Government Accounts data for 2012-13.
2 Available at: www.gov.uk/government/statistical-data-sets/tsgb04-freight (table TSGB0401 for 2010 which is the latest available data).
3 Local highway authorities can also use funding from the Department for Communities and Local Government, council tax and business rates income for road maintenance.

Maintaining strategic infrastructure: roads Part One 11
1.4 We commented on the potential effect of cuts to road maintenance budgets in two recent reports. Reducing costs in the Department for Transport,4 examined the Department’s response to the Spending Review 2010. Funding for local transport: an overview,5 looked at national and local government responsibilities for providing local transport in England. In this Part, we examine whether highways authorities have reduced road maintenance budgets as planned, how they have done so, and the consequences for the networks.
Funding for road maintenance
1.5 All funding from central government for road maintenance to highways authorities is allocated as either capital or revenue. Highways authorities6 use capital funding for significant renewal of assets that will have a life of many years. They use revenue for spending on day-to-day items to run services or to carry out routine maintenance (Figure 1).
4 Comptroller and Auditor General, Reducing costs in the Department for Transport, Session 2010–2012, HC 1700, National Audit Office, December 2011.
5 Comptroller and Auditor General, Funding for local transport: an overview, Session 2012-13, HC 629, National Audit Office, October 2012.
6 Where we refer to the Agency and local highway authorities together we use the term ‘highways authorities’.
Figure 1Description of capital and revenue road maintenance activities
Maintenance Purpose Budget Description
Winter and severe weather
Network safety and availability Revenue Salting, gritting, activities to combat heat, high winds, flooding and drought
Reactive or emergency Network safety and availability or short-term repair
Revenue Repairing potholes, patching, clearing incidents and traffic management
Routine Maintaining the condition of the asset and collecting data needed to plan efficient maintenance programmes
Revenue Cyclic maintenance, including inspections, minor repairs, cleaning drains, fixing street lighting, repainting road markings
Planned renewals Maintaining the value of the asset and reducing the need for maintenance expenditure in the future
Mainly capital, some revenue
Schemes to prevent water ingress including resurfacing
Structural renewals/ improvements
Increasing the value of the asset or its capacity and reducing the need for maintenance expenditure in the future
Mainly capital, some revenue
Generally larger projects for road reconstruction and repair to structures
Note
1 Capital funding cannot be used for revenue activities.
Source: National Audit Offi ce

12 Part One Maintaining strategic infrastructure: roads
Highways Agency
1.6 Most of the Agency’s funding is from HM Treasury via the Department.7 In 2012-13, the Agency received £2 billion from the Department. It got an additional £68 million from other sources, such as fees and charges to external customers, claims for damage to the network by third parties and interest. It spent £720 million (£818 million in 2011-12) on maintaining the network, which was split 60:40 between capital and revenue spending (47:53 split in 2011-12).
Local highway authorities
1.7 In 2012-13, the Department gave local authorities around £1 billion for road maintenance, most of which was for capital purposes. This was equivalent to around 30 per cent of local authorities’ total spending on road maintenance and included the following:
Capital
• A ‘formula’ grant of £779 million that all local authorities receive. The Department sets the formulae based on the size and condition of each authority’s highways. However local authorities can use the funds for purposes other than road maintenance or transport.
• Funding allocated through bid-based competitions, which local highway authorities must spend on the projects for which it is awarded. No such funding was allocated in 2012-13. However, from 2013-14, the Department gave money to alleviate bottlenecks on the local road network from its ‘Local Pinch Point Fund’ (£270 million total value). Successful bids have included essential maintenance work, which if not carried out would have created congestion.
Revenue
• Ring-fenced payments for specific private finance initiative schemes for highways maintenance and street lighting (£200 million).
1.8 Local authorities’ revenue funding comes mainly from three sources: the Department for Communities and Local Government, council tax and a share of business rates income that they retain. They use the funding for a range of services, including road maintenance but also education and social care.
1.9 Using all funding sources, local highway authorities spent £3.3 billion on maintaining the local network in 2012-13 (£3.5 billion in 2011-12). This was one-third capital and two-thirds revenue.
7 The Agency’s funding is parliamentary supply while local highway authorities receive grants from central government.

Maintaining strategic infrastructure: roads Part One 13
Spending Review 2010 budget reductions
1.10 In Reducing costs in the Department for Transport we reported that the Department planned to cut budgets for road maintenance.8 We showed this was a reduction of 15 per cent (£557 million) for local highway authorities and 19 per cent (£672 million) for the Agency by 2014-15 in cash terms. The total reduction was to be £1.2 billion over four years, which comprised:
• £571 million from efficiencies across all highways authorities, including £237 million from the Agency making changes to maintenance contracts;
• £435 million by reducing road condition standards and by cutting routine maintenance on the strategic road network; and
• £223 million of unspecified efficiencies in local highway authorities.
In addition, the Department for Communities and Local Government planned to cut its grant by 28 per cent in real terms over the same period.
1.11 We concluded in Reducing costs in the Department for Transport and Funding for local transport that these cuts risked deterioration in road quality and higher long-term costs to the Department or local authorities, and might be unsustainable. The Committee of Public Accounts was also concerned that the Department:
• did not fully understand the likely impact of reducing road maintenance budgets; and
• expected local authorities to find savings of £223 million but was not clear how they would do this.
Changes to budgets
1.12 During the 2010 Spending Review period, the Department announced several batches of additional capital funding for highways maintenance and small improvement works, partly to stimulate the economy (Figure 2 overleaf). The extra money totalled some £1.1 billion (Figure 3 on page 15).9 Therefore, while the Department’s budgets for road maintenance have decreased overall from April 2010 to March 2015, these announcements have reduced the extent of the cuts:
• For the Agency, the actual budget reductions will now be 7 per cent (£233 million) rather than the reduction of 19 per cent announced in the Spending Review 2010.
• Local highway authorities’ capital funding for road maintenance from the Department is actually increasing by £97 million (3 per cent) in the four years instead of the planned reduction of 15 per cent.
8 Comptroller and Auditor General, Reducing costs in the Department for Transport, Session 2010–2012, HC 1700, National Audit Office, December 2011.
9 This does not include additional funding to relieve bottlenecks, known as ‘pinchpoint’ funding.

14 Part One Maintaining strategic infrastructure: roads
Figure 2The government announced additional funding intermittently since April 2010
2010 2011 2012 2013 2014
Notes
1 All funding is for the fi nancial year commencing after the announcement unless otherwise stated.
2 Local highway authorities bid for specifi c schemes to be funded from the Local Pinch Point Fund. The Department has announced four tranches of approved schemes totalling £266 million: £26 million (2 March 2013), £165 million (22 May 2013), £26 million (27 September 2013) and £49 million (13 December 2013).
Source: National Audit Offi ce analysis of Department for Transport announcements
24 Mar 2010
Budget 2010
+ £100m capital (local formula grant)
17 Jan 2014
+ £3.5m in-year revenue funding for local highways authorities affected by severe flooding
12 Feb 2014
+ £30m in-year revenue for local highways authorities affected by the severe weather
9 Mar 2014
+ £70m revenue + £70m capital in-year for additional maintenance and flood recovery by local authorities
19 Mar 2014
Budget 2014
+ £169m capital for pothole repairs in local roads
5 Dec 2012
Autumn Statement 2012
Local
+ £140m capital formula grant for 2013-14+ £75m capital formula grant for 2014-15+ £170m from ‘Local Pinch Point Fund’ (competitive bids)
Agency
+ £76.2m capital for 2013-14+ £41.8m capital for 2014-15+ £100m capital pinch point funding
29 Nov 2011
Autumn Statement 2011
Capital for the Agency to alleviate bottlenecks (known as ‘pinch points’)
+ £9.5m for 2012-13+ £97.5m for 2013-14+ £115m for 2014-15
27 Sep 2013
Local Pinch Point Fund+ £80m
26 Jun 2013
2013 spending round
Allocations for 2015-16 to 2020-21
26 Oct 2010
2010 spending review
Allocations for 2011-12 to 2014-15
23 Mar 2011
Budget 2011
+ £200m capital (local formula grant)
This includes £100m announced on 23 Feb 2011 to repair winter damage to roads (funded from DfT savings)

Maintaining strategic infrastructure: roads Part One 15
Figure 3Additional Funding
The Department has given an extra £1.1 billion for road maintenance since the Spending Review 2010
Notes
1 All in cash terms.
2 Includes all Agency funding for maintenance and capital funding provided by the Department to local highway authorities.
3 Does not include the Local Pinch Point Fund. The Department has awarded £9 million from the Fund for schemes due to be completed in 2013-14, £158 million for schemes completing in 2014-15, and £99 million for later years.
4 2014-15 includes £169 million for the pothole challenge fund.
5 Does not include £103.5 million revenue funding in 2013-14 for severe weather repairs to local roads.
Source: National Audit Office analysis of Department for Transport and Highways Agency data
Additional funds
2010 Spending Review settlement
2,000
0
200
400
600
800
1,000
1,200
1,400
1,600
1,800
£ million
2010-11 2012-13
2010 spending review
2011-12 2013-14 2014-15
100
1,579
9.5
1,500
200
1,639
1,397
484401
1,361

16 Part One Maintaining strategic infrastructure: roads
1.13 The opposite is true for local authorities’ revenue funding from the Department for Communities and Local Government, which was set to fall by 28 per cent under the 2010 spending review. Figure 4 shows the announcements on changes to local authorities’ revenue budgets. The Local Government Association estimates that the scheduled cut to councils’ funding from central government was around 33 per cent over the four-year period.10
10 Local Government Association, Future funding outlook for councils from 2010/11 to 2019/20, July 2013.
Figure 4Local government funding changes since April 2010
2010 2011 2012 2013
Note
1 All funding is for the fi nancial year commencing after the announcement unless otherwise stated.
Source: National Audit Offi ce analysis of Department for Communities and Local Government announcements
9 Aug 2010
New homes bonus scheme aiming to incentivise local authorities to encourage new homes locally
The bonus is funded from £950m (over four years) in specific grant and from an additional amount top sliced from formula grant
The redistribution from (and reduction in) formula grant totalled £599m in the first three years and is estimated to be £655m in 2014-15
24 Mar 2010
Budget 2010
Government allocates £26bn funding to local authorities
17 Mar 2011
Local government resource review
Business rates retention scheme announced moving local authorities away from formula grant funding based on need. Local authorities will retain 50 per cent of the business rates they collect, the remaining half will be distributed by central government according to a baseline funding level set at 2012-13 levels. Local authority income from business rates may increase or decrease according to the prosperity, number and type of businesses in their area. A safety net to limit the falls in income that a local authority may see that will activate once income falls below 7.5 per cent of an authority’s baseline funding
26 Jun 2013 spending round
Further 10 per cent real terms reduction in central government funding to local government in 2015-16 anticipated to result in a decrease in local government spending of 2.3 per cent
Council tax freeze grant announced to continue for 2 years, equivalent to a 1 per cent increase in council tax rates
26 Oct 2010 spending review
A 26 per cent real terms reduction, over four years, to central government funding to local authorities. The overall reduction in local government income was forecast to be 14 per cent in real terms
The end of ring-fencing for most grants, with a large number of separate grants being rolled into the formula grant
Council tax freeze grant equivalent to a 2.5 per cent increase in council tax revenue if tax rates frozen at their 2010-11 level
Reduction and localisation of council tax support from 2013-14 along with a reduction of 10 per cent in how much is paid to local authorities for this
18 Dec 2012
Autumn Statement 2012
Further reduction of £445m to central government funding to local government
26 Mar 2013
Budget 2013
Further council tax grant announced for 2013-14

Maintaining strategic infrastructure: roads Part One 17
1.14 This funding trend is set to continue. The Department announced that £10.3 billion capital funding would be available from 2015-16 to 2020-21 (£1.7 billion a year on average compared to £1.5 billion a year on average allocated in the 2010 Spending Review), while revenue funding from the Department for Communities and Local Government is set to fall by 10 per cent in real terms in the same period. The Local Government Association and the supply chain projected that revenue budgets for road maintenance would have to be cut by 60 per cent in cash terms by 2019-20, if local authorities felt they had first to allocate funding for their statutory responsibilities, including social care, waste management and concessionary travel, and contractual commitments, such as capital financing.11
Spending on road maintenance
1.15 The Agency has reduced its actual expenditure by more than the amount the Department set out. Between 2010-11 and 2012-13 its total expenditure on maintenance decreased by 9 per cent (Figure 5). An additional pressure on the Agency’s revenue budget has been private finance initiative costs, electricity charges and inflation which were higher than the original estimates.
11 Local Government Association, Future funding outlook for councils from 2010/11 to 2019/20, July 2013.
Figure 5Agency expenditure
Source: National Audit Office analysis of Highways Agency spending
2010-11 2011-12 2012-13
900
800
700
600
500
400
300
200
100
0
Road maintenance expenditure was 9 per cent lower in cash terms in 2012-13 than 2010-11
£ million
Revenue 417.9 444.7 298.2
Capital 374.3 373.4 421.5

18 Part One Maintaining strategic infrastructure: roads
1.16 Local highway authorities’ expenditure on maintenance overall fell by 10 per cent between 2010-11 and 2012-13 (Figure 6). Nevertheless, their capital spending on maintenance has continued to exceed the funding they receive from the Department.
1.17 The main impact of the changes in budgets has been that highways authorities have spent less revenue on road maintenance. This is significant, as some activities can only be financed by revenue funding (paragraph 1.5 and Figure 1).
1.18 In 2012-13, the Agency spent more capital than revenue on its maintenance activities, with a 60:40 split. This was a change from 2010-11 and 2011-12 when it spent more revenue than capital (Figure 5). In cash terms its revenue spending fell by 29 per cent from 2010-11 to 2012-13. The Agency’s senior management told us that a further reduction in its revenue budget would affect whether the Agency could maintain the strategic road network in a safe, cost-effective way.
1.19 Typically local highways authorities split their spend two-thirds revenue to one-third capital (Figure 6). Their revenue spend on road maintenance fell 7 per cent between 2010-11 and 2012-13.
Figure 6Local highway authority expenditure
£ billion
Road maintenance expenditure decreased by 10 per cent in cash terms
Note
1 Figures include expenditure on bridges, winter service maintenance and highways maintenance planning, policy and strategy. Expenditure on street lighting maintenance is not included.
Source: National Audit Office analysis of local government financial statistics
2010-11 2011-12 2012-13
4.0
3.5
3.0
2.5
2.0
1.5
1.0
0.5
0
xx.x
Revenue 2.3 2.3 2.1
Capital 1.3 1.2 1.1

Maintaining strategic infrastructure: roads Part One 19
How reductions were achieved
1.20 We found that expenditure was reduced by a mix of:
• innovations that improved efficiency or eliminated wasteful activities;
• reclassifying work, to fund it out of capital budgets; and
• stopping some services.
Highways Agency’s revised approach
1.21 The Agency took a range of actions to achieve the efficiency savings and budget reductions set by the Department in the Spending Review 2010. For routine maintenance, it renegotiated its contracts to give an affordable level of service and developed a new type of contract in which it specified outcomes rather than prescribing maintenance activities. This includes:
• changing the requirements for landscaping so that grass is only cut for safety reasons and to keep the network serviceable;
• ending the specification for contractors to provide incident support units – instead the Agency requires contractors to act to restore the traffic flow after an incident;
• reduced or stopped communications with the public on litter, road safety, travel, journey planning and driver education; and
• encouraging contractors to innovate – in one area the contractor shared resources, such as depots, plant and staff, across the new Agency contract and its pre-existing local highway authority contracts. Contractors are also using staff for a wider range of repairs, for example incident support unit staff cut grass, when not attending incidents.
1.22 The Agency was required to save more than £230 million through the outcome specification and improved rates in the new contracts. However, it was not going to be able to complete the contract renewal programme quickly enough to generate all the savings. It therefore renegotiated ten existing contracts to make savings as early as possible. Figure 7 overleaf shows the Agency’s original and revised savings profile of £153 million from the new and renegotiated contracts. It also shows how by using fewer contractors and consultants and more in-house staff for commercial and asset management the Agency plans to make the remainder of the savings (current forecast £85 million) to achieve the required total. The Agency reported that from April 2011 to March 2014 it saved £136 million and forecasts achieving £238 million by March 2015. The scope of our audit has not allowed us to verify what proportion of the savings is due to improved efficiency.

20 Part One Maintaining strategic infrastructure: roads
1.23 For more major repairs, like network renewals, the Agency has delivered more schemes for the budget than otherwise would have been the case. This is due to the following actions:
• contracts with improved pricing mechanisms and requiring contractors to achieve year-on-year cost savings;
• additional price competitions for contractors on framework agreements; and
• improving in-house asset management skills and scrutiny of contracts. For example, by growing engineering and technical capability and giving training to improve staff’s commercial aptitude and confidence to challenge contractors’ plans and costings. This has included developing some standard models and benchmarks to help staff assess proposed maintenance schemes, such as approximate costs for a 10 kilometre stretch of road.
1.24 The amount spent on renewal schemes is determined by the volume of work required. The Agency has been tracking efficiencies on this form of maintenance since 2009-10. Contractors should submit a schedule of unit costs for each scheme, 13 weeks after completion. This schedule covers 18 activities, for example planning and installing safety barriers. The Agency is improving the quantity and quality of the data. It has analysed over 3,000 schemes over the four-year period, adjusting the prices for inflation.12 The Agency can show that unit costs reduced by 0.8 per cent in 2011-12, 4.4 per cent in 2012-13 and 2 per cent in 2013-14. The savings were reinvested in additional maintenance.
12 Using the Department for Business, Innovation & Skills road construction cost index.
Figure 7Highways Agency savings from its 12 area maintenance contracts
Actual and forecast savings vary from planned savings
2011-12 (£m)
2012-13(£m)
2013-14(£m)
2014-15(£m)
Total(£m)
Profile of planned savings 11.7 68.9 75.7 77.0 233.2
Actual/forecast savings on maintenance contracts
(5.9) 33.5 51.5 73.6 152.7
Actual/forecast savings on contractors or consultants
18.5 18.6 19.3 28.4 84.8
Total actual/forecast savings 12.6 52.1 70.8 102.0 237.5
Source: National Audit Offi ce analysis of unaudited Highways Agency data

Maintaining strategic infrastructure: roads Part One 21
Local highway authorities’ revised approach
1.25 In April 2011, the Department set up the Highways Maintenance Efficiency Programme in response to the challenging efficiency savings required by the 2010 spending review. This is a ‘sector-led transformation programme’ to promote best practice in highways maintenance and provide practical solutions for local authorities to help them to be more efficient. The Department set aside £6 million to support the Programme until March 2013. It has since extended the end date for the funding to March 2015.
1.26 In the first three years, the Programme team researched and developed a range of resources to help local highway authorities. For example, it published guidance on potholes and managing highways drainage assets, and toolkits for collaborative working, lean processes and procurement. Figure 8 includes examples of some measures used by local highway authorities to live within their budgets and their likely impact on road users and the condition of the network.
Figure 8Examples of local authority measures to reduce maintenance spend and their effect on the network and road users
Improve efficiency – no effect on road users and the network:
• introduced new contracts to encourage more preventative maintenance; increased collaboration by integrating Council and contractor teams so that staff sit together; and reduced duplication by using common processes;
• changed methods to repair potholes:
a used a ‘hot box’, which allows old tarmac to be recycled and kept at optimal temperature for longer periods. It also means the asphalt takes the shape of the pothole better, making it less susceptible to freeze/thaw conditions and less likely to spread across the road as traffic increases; and
b replaced several vehicles and processes with a multi-purpose vehicle, that planes the road surface to the exact depth required, which gives a sound base for patch repairs. It also reduces the health and safety risks to staff from machinery vibrations.
Eliminating wasteful activities – provided the changes are planned using a risk-based approach and the minimum statutory and core safety requirements are met, there is no effect on the network, but road users may notice a reduced service:
• increased the time allowed to repair potholes, leading to more permanent and effective repairs first time;
• refreshed road markings with reflective paint more regularly to allow motorists to see the road clearly enabling street lights to be dimmed or turned off; and
• changed inspection regimes from an automatic cyclic programme to a ‘needs’ basis.
Transfers – no effect on road users and the network:
• Minor improvement works which would have traditionally been paid for in-year are capitalised and the costs charged over the life of the asset.
Stopping services – network safety is unaffected but there is a reduction in service and the actions may have consequences for the networks as work may be crucial to protect their condition in the long term:
• When budgets were top-sliced activities like structural maintenance on drainage assets and gully clearing were cut and fewer inspections done.
Source: National Audit Offi ce visits, survey and desk research

22 Part One Maintaining strategic infrastructure: roads
1.27 There are no government-wide data on efficiency or savings in local highway authorities. In 2013-14, local government estimated it had saved £37 million by using the products from the Programme. These included toolkits for asset management, shared services and deterioration modelling, and a standard specification and contract for highways maintenance.
Staff cuts
1.28 Industry representatives and senior staff from local highway authorities told us of cuts in the number of maintenance staff. This was supported by the Local Government Financial Statistics.13 These show that the cost of the staff working on road maintenance for local highway authorities was cut by 30 per cent from £567 million in 2011-12 to £399 million in 2012-13.
1.29 The Agency also employs fewer civil engineers for network maintenance. We reported that it had reduced the number of civil engineers to 161 between 2004 and 2009 in Contracting for Highways Maintenance.14 As at 31 March 2013, the number of civil engineers working solely on network maintenance was 146. However, some of this reduction is explained by a reorganisation in November 2011. The civil engineers from the maintenance commercial team joined a central team, which supports non-maintenance activities as well. The central team of 21 civil engineers spent around half its time on maintenance in 2012-13.
Collaboration
1.30 We found good examples of collaboration in local government. In our survey of local highway authorities, 26 respondents judged themselves to be good or very good at identifying opportunities to collaborate with other local highway authorities. At least 102 of the 152 local highway authorities were part of a highways alliance. Members share best practice and can make savings on procurement through framework agreements. Collaboration could be extended, as under the London Highways Alliance Contract, in which participating highways authorities will be able to benchmark the four area-based contractors’ prices and performance against each other (Figure 9).
1.31 Local highway authorities rated themselves much less favourably at collaborating with the Agency than with each other. However, there was evidence of cooperation in relation to schemes to remove ‘pinch points’ on the networks. This collaboration could be developed further particularly as the Agency’s new ‘route-based strategies’ will require it to work with local authorities and Local Enterprise Partnerships, when identifying maintenance schemes across the strategic network and planning for longer-term investment, to take account of local priorities for growth.
13 Available at: www.gov.uk/government/collections/local-government-finance-statistics-england 14 Comptroller and Auditor General, Contracting for Highways Maintenance, Session 2008-09, HC 959,
National Audit Office, October 2009.

Maintaining strategic infrastructure: roads Part One 23
Figure 9London Highways Alliance Contract
This contract was developed as a joint initiative between Transport for London and London’s boroughs. During the first year 12 boroughs signed up and as more boroughs’ individual highways service contracts come up for renewal, more are expected to join the London Highways Alliance Contract. The objectives for the eight-year contract are to:
• understand the true costs and drivers and make the link between service levels, cost and risk clearer; improve service on highways maintenance and reduce the cost;
• stop the constant state of retendering across the 34 highways authorities in London, which was estimated to cost £9 million per annum;
• provide more consistent customer experience by minimising congestion and delays through joint forward planning, rapid construction techniques and improved collaboration;
• use resources and skills better through common specifications and sharing technical expertise and specialist equipment; and
• create up to 250 new apprenticeship opportunities, encouraging young people into engineering and tackling local workforce skills gaps.
• Contractor performance is monitored against 26 indicators and ‘preventative maintenance is effective’ is one of the five primary performance indicators. The information on how each of the contractors are performing is disclosed to all and the highways authorities using the London Highways Alliance Contract to highlight strong and weak performance through a league table. The contractors are encouraged to share their good practice and innovate to improve the overall standard of service and give greater consistency for road users.
In the annual review of performance, the contractor could have its contract reduced by six months if it has failed to achieve the targets against any of the 26 indicators. It has the opportunity to win back these months by improving its performance against the failing indicator(s) in the following year.
Notes
1 Although the new requirement was drawn up jointly by Transport for London and Borough highways personnel, with input from industry, Transport for London retains the responsibility for asset management, project conception and day-to-day contract management.
2 The contract is not restricted to local authorities; any organisation needing highways related services within the capital can sign up and benefi t. This includes all utility providers and any other highway authority.
Source: National Audit Offi ce interviews with, and presentations by, Transport for London
North east area
South area
Central area
North west area
24 Part One Maintaining strategic infrastructure: roads
Impact on the networks
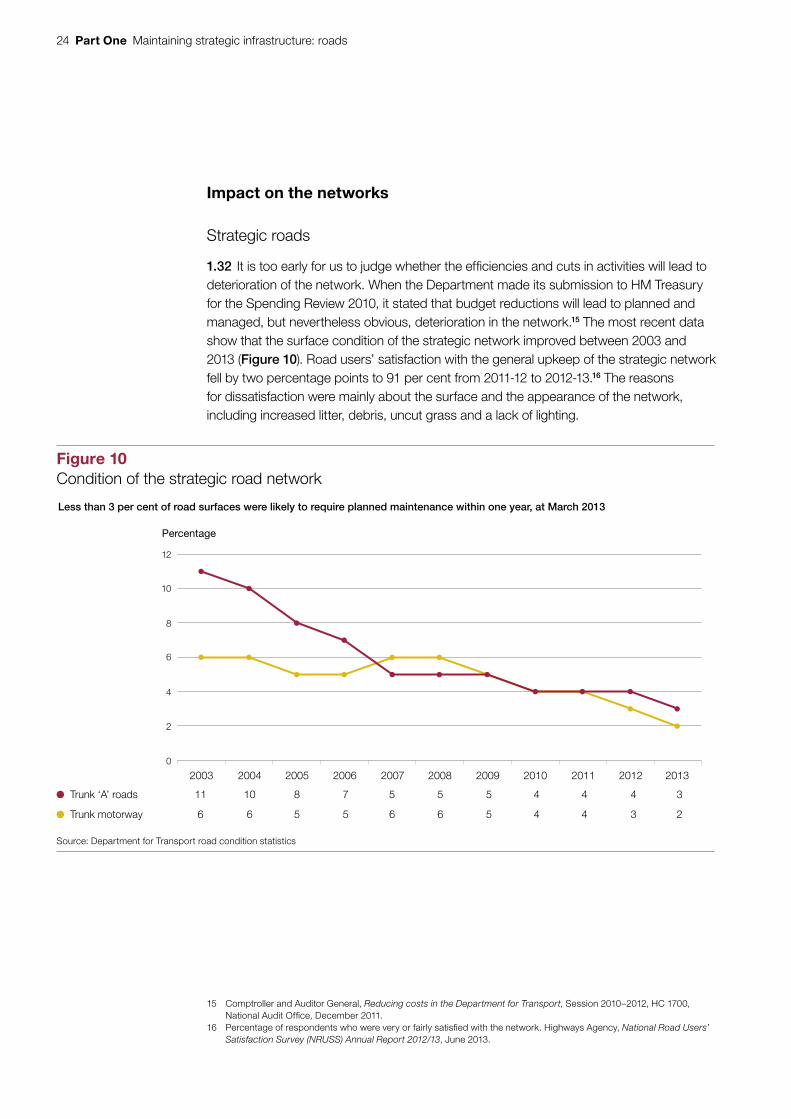
Strategic roads
1.32 It is too early for us to judge whether the efficiencies and cuts in activities will lead to deterioration of the network. When the Department made its submission to HM Treasury for the Spending Review 2010, it stated that budget reductions will lead to planned and managed, but nevertheless obvious, deterioration in the network.15 The most recent data show that the surface condition of the strategic network improved between 2003 and 2013 (Figure 10). Road users’ satisfaction with the general upkeep of the strategic network fell by two percentage points to 91 per cent from 2011-12 to 2012-13.16 The reasons for dissatisfaction were mainly about the surface and the appearance of the network, including increased litter, debris, uncut grass and a lack of lighting.
15 Comptroller and Auditor General, Reducing costs in the Department for Transport, Session 2010–2012, HC 1700, National Audit Office, December 2011.
16 Percentage of respondents who were very or fairly satisfied with the network. Highways Agency, National Road Users’ Satisfaction Survey (NRUSS) Annual Report 2012/13, June 2013.
Figure 10Condition of the strategic road network
Less than 3 per cent of road surfaces were likely to require planned maintenance within one year, at March 2013
Trunk ‘A’ roads 11 10 8 7 5 5 5 4 4 4 3
Trunk motorway 6 6 5 5 6 6 5 4 4 3 2
Source: Department for Transport road condition statistics
2003 2004 2005 2006 2007 2008 2009 2010 2011 2012 2013
Percentage
0
2
4
6
8
10
12

Maintaining strategic infrastructure: roads Part One 25
1.33 It may also be that network deterioration has not yet become visible. Defects in the road surface condition become apparent relatively quickly, but the network is composed of various materials and components, some of which are hidden as shown by Figure 11. Furthermore the network does not deteriorate in a linear fashion because the subsurface layers and earthworks have a near indefinite life if adequately maintained, while other assets last for between 20 and 120 years.
Local roads
1.34 The picture is not as clear for local roads. The government wanted a less burdensome approach to holding local authorities to account. The Department therefore collects less information on unclassified roads, which represent more than 60 per cent of all local roads, than it does for classified roads.
Figure 11The network consists of complex assets
Source: Highways Agency
Piles
WatercourseHighway
Abutment
Bearings
Foundations
Central column Wing wall
Expansion joint
Beams (Primary Deck Element)
Slab (Secondary Deck Element)
Restraint system, e.g. metal fence
Superstructure, e.g. longitudinal reinforced concrete beams and a reinforced concrete deck slab
Substructure, e.g. bearings, central columns, abutments, foundations and piles

26 Part One Maintaining strategic infrastructure: roads
1.35 The Department published the trend data collected from local highway authorities in April 2014,17 but this does not include an analysis as in Figure 10. Surveys of road users and local highway authorities showed that it is their perception that the state of local roads have deteriorated:
• National Highways and Transport Survey
This showed that public satisfaction in highway condition and the speed and quality of repair to damaged roads and pavements is at 30 per cent, the lowest level since the survey began in 2008. It also shows that the condition of local roads is both the most important issue to residents and, when compared to other road transport services, is most in need of improvement.
• Asphalt Industry Alliance
It reported that 18 per cent of local roads in England were classed by local authorities as being in poor condition. This was an improvement of three percentage points from the previous year. However, the average number of claims received by local authorities for compensation for damage to person or vehicle as a result of poor road condition increased in England by nearly 20 per cent between 2013 and 2014 (452 applications compared to 540).18
• Institution of Civil Engineers
It told Parliament19 that the recent severe winters have resulted in damage which has contributed to the deterioration of the network.
• Our survey
Although 20 respondents from local highway authorities said that they had managed to keep all types of their roads in broadly the same state in the last year, 18 thought that the condition of their roads was worse.20
17 Department for Transport, Road conditions in England: 2013, Statistical release 30 April 2014.18 Available at: www.asphaltindustryalliance.com/alarm-survey.asp. In London the trend on condition was the same but
there was no change in the number of claims.19 Transport Committee, Keeping the UK moving: The impact on transport of the winter weather in December 2010,
HC 794, Fifth Report of Session 2010-11, May 2011. Written evidence from vol. 2, para. 29.20 Seven authorities reported that the condition had improved, one had insufficient data to comment.
Maintaining strategic infrastructure: roads Part Two 27
Part Two
Achieving long-term value for money
2.1 Achieving value for money in the long term requires:
• an asset maintenance plan covering 20 to 30 years which identifies the appropriate points for different types of repairs;
• certainty and timeliness of funding decisions to allow robust planning and implementation; and
• information and modelling to optimise maintenance.
In this Part we focus on whether the Highways Agency (the Agency) and local highway authorities have these structures and information and on the challenges to achieving value for money.
Long-term asset management plans
2.2 Like all infrastructure, roads require maintenance to keep them safe, serviceable and reliable. The key to providing value for money is performing timely and appropriate maintenance that will:
• limit the effect on road users;
• prevent further deterioration; and
• minimise the whole-life cost of the assets.
2.3 Planned maintenance at a suitable point during an asset’s life can often restore it to a good condition and extend its use (Figure 12 overleaf). Contractors and highways authorities emphasised the importance of intervening at the right time for road repairs. Particularly carrying out preventative maintenance to stop water penetrating the surface saves significant costs in later years. The Audit Commission reported that two councils had estimated preventative maintenance would cost around a third of the price to reconstruct a road if it had been allowed to fail.21
21 Audit Commission, Going the Distance: Achieving better value for money in road maintenance, May 2011.

28 Part Two Maintaining strategic infrastructure: roads
2.4 There is a narrow time period in which to undertake preventative maintenance if it is to be effective. Given the long lives of some assets in the road networks, and the varying cyclic intervention points, highways authorities need a long-term management plan for each type of asset to allow them to schedule maintenance at the optimal time and minimise whole-life costs. We found this was an area that highways authorities needed to improve:
• According to returns the Asphalt Industry Alliance 2014 survey, at least 45 local highway authorities did not have an asset management plan.
• Although the Agency has an asset management plan, it does not currently extend across the whole life of the network. The Agency is trialling the development of a 30-year asset management plan in its East Midlands area.
Surface
Foundation
Figure 12An infrastructure deterioration model
Asset condition
Poor
Excellent
Source: National Audit Office analysis
Earthworks
Time
Optimal condition
Repair is not practicable below this point and replacement is necessary
Asset deterioration
Renewal
Maintenance treatments Failure level
Intervention level

Maintaining strategic infrastructure: roads Part Two 29
Certainty of funding
2.5 Infrastructure UK has reported that certainty of funding is associated with unit cost savings of 10 to 20 per cent for routine maintenance in other sectors and countries.22 As shown in Part One, there is a pattern of changing budgets for road maintenance, often at short notice. This creates uncertainty for highways authorities making it difficult for them to plan their activities. Thirty-five out of 46 local highway authorities that responded to our survey stated that this pattern of ‘stop/start’ funding hindered them from getting value for money. Furthermore, we found a consensus of opinion among the representatives of individual companies, the Highways Term Maintenance Association and the Civil Engineering Contractors Association. These bodies said that uncertainty was not conducive to maintaining the road network in a cost-effective manner (Figure 13). For example, it prevents companies from making long-term investments in training local workforces.
22 Alan Cook, A fresh start for the Strategic Road Network: Managing our roads better to drive economic growth, boost innovation and give road users more for their money, November 2011.
Figure 13Industry’s views on the factors that undermine value for money
• Maintenance contracts were important because they gave stable turnover during austerity and contractors prefer predictable spend. However, central government funding, even through formula grants, was perceived as too changeable.
• By having greater certainty of funding in the long term:
a collaboration would be encouraged because it would be worthwhile for companies and highways authorities to invest time and resources in establishing relationships and contractual arrangements; and
b contractors would invest in training local workforces – the average age of civil engineers is around 50 and apprentice schemes are not replacing the staff that are retiring or moving into the rail sector and abroad.
• An increased volume of schemes during ‘mad March’ – a term used by the supply chain to describe when highways authorities rush to spend maintenance budgets by the year-end – increases the risk to the quality and cost of the works because the contractor may have to use subcontractors which it has not tried and tested previously, the number of daylight hours is lower and weather disruptions are near their peak.
• Temporary mending of small patches of road is at least 20 times more expensive to undertake than planned, preventative maintenance, such as resurfacing long-lengths of roads at regular intervals. This is because small jobs have large overheads in terms of site set-up costs and traffic management.
Source: National Audit Offi ce analysis of interviews and workshops with road maintenance contractors

30 Part Two Maintaining strategic infrastructure: roads
2.6 In addition to changes to budgets at short notice, planning maintenance activities is made difficult by the timing of budget announcements and the requirement to spend the money by the end of March the following year.23 Highways authorities plan their work programmes on indicative budgets, provided annually in December by central government. Actual funding is agreed in the spring and highways authorities revise their plans to fit budgets and do the detailed design for schemes. Consequently most road maintenance is done between September and March (Figure 14). Although less disruptive to motorists, doing work in the winter months is less efficient because it is colder and wetter, which effects how materials like asphalt behave. It also makes traffic management more expensive because of the lack of daylight. As a result of the additional funding for emergency repairs being made available at the end of the financial year, almost all local highway authorities will need extra capacity from the market at the same time.
23 Highways authorities do have some flexibility to carry over funding into the next financial year, but this is limited.
Figure 14Percentage of annual capital maintenance expenditure spent each month
The Agency’s spend on maintenance is concentrated in the winter
2010-11 9.2 7.3 6.9 7.5 7.3 6.6 6.5 7.7 5.6 8.0 11.1 16.2
2011-12 2.9 4.0 6.1 5.7 5.5 6.9 8.3 9.1 7.3 8.9 14.4 20.9
2012-13 2.7 5.6 3.7 6.8 7.0 7.6 9.8 9.7 9.0 10.9 12.8 14.5
Source: Highways Agency
Apr May Jun Jul Aug Sep Oct Nov Dec Jan Feb
0
5
10
15
20
25
Percentage
Mar

Maintaining strategic infrastructure: roads Part Two 31
Using information to optimise road maintenance
2.7 All resources available for road maintenance should be used to maximise public value. To achieve this, highways authorities must understand the needs of their network and the most cost-effective approach to maintaining it. This requires:
• current, comprehensive and accurate information on what assets exist, their location, performance and condition;
• a full understanding of how different assets are likely to deteriorate over time; and
• highways authorities must apply this knowledge of the network to support good decision-making.
Highways Agency
2.8 In previous reports, we observed the Agency had made considerable efforts to capture condition data on its assets, which contractors held. However, the information was incomplete, especially for drainage assets and the subsurface condition of pavements. Furthermore, the Agency had inadequate information to develop an optimal programme of planned maintenance.24
2.9 This is in contrast to the Canal and River Trust, which looks after 2,000 miles of waterways in England and Wales, including bridges and aqueducts which are over 200 years old. In the mid 2000s, its predecessor organisation, British Waterways integrated asset data into its day-to-day business management system. This gives it a comprehensive picture of the condition of each asset and supports the planning of its maintenance programme. As the strategic road network is 4,300 miles long and comprises motorways and trunk ‘A’ roads, which have been designed or rebuilt to modern engineering standards since the late 1950s, the Agency should have a fully populated and integrated asset management system.
24 Comptroller and Auditor General, Contracting for Highways Maintenance, Session 2008-09, HC 959, National Audit Office, October 2009.

32 Part Two Maintaining strategic infrastructure: roads
2.10 The Agency expected to be operating its integrated asset management information system by November 2013. However, at the end of 2013 the Agency’s data were still held in 17 separate systems, five of its own and one in each of 12 of its area-based contractors. There was an issue with the database when the Agency rolled the integrated asset management system out to the first area in April 2012. Consequently, the contractor had to record its inspections, maintenance and improvement works on paper until October 2012. This hampered the timely and effective flow of information between the Agency and its contractors. By June 2014, a third of contractors were using the integrated asset management information system. As each new contract starts the Agency will own more asset data, which it believes will give it better control.
2.11 The Agency has made some progress and improved the quality of the information it holds. Since 2012, it has been using a new laser scanning system, which lets it capture 360° high definition images of all visible elements of the network, including barriers, lighting, signs and bridge pillars. The Agency can use this more detailed 3-D data to produce plans of the network accurate to 30 millimetres in less time than before. Also it now has good knowledge of its structures and has increased the data it holds on drainage systems. The Agency estimated that spending funding on obtaining information on the remaining 70 per cent of its drainage systems however would have given only a modest payback. It could not be justified during a period of constrained budgets.
Local highway authorities
2.12 In contrast to the strategic network, the local road network developed over centuries from tracks or turnpike roads.25 It is therefore more difficult for local highway authorities to develop a good understanding of the network’s construction and condition. Collecting data is an expensive process but some local highway authorities made it a priority to improve their knowledge of their assets. In our survey 34 respondents rated themselves as having a good or very good inventory and information about the condition of their roads. However, less than half of these local highway authorities felt this was true for their footways, bridges, tunnels, drainage systems, lighting and signage.
25 A public or private roadway for which a fee or toll was payable to use it.

Maintaining strategic infrastructure: roads Part Two 33
Decision-making
Highways Agency
2.13 The Agency has improved its decision-making since we reported in 2009. It has extended the remit of its central asset management office so that it now approves a national maintenance programme. This means the Agency prioritises maintenance schemes across the entire network rather than by area as it did before.
2.14 The Agency’s model to show how road surfaces deteriorate is mature. This has enabled the Agency to predict the network’s future maintenance needs and forecast the additional funding required to replace 80 per cent of road surfaces in the strategic network over the next four to six years (Figure 15 overleaf). The Agency said that this increased activity is necessary because it laid ‘hot rolled asphalt’ surfaces with a life expectancy of 25 years in the 1990s, and used ‘thin surface course systems’ with a life expectancy of 10 to 15 years in the 2000s. As a result the Agency’s capital maintenance budget will be £750 million in 2020-21.
2.15 Although the Agency has developed a decision support tool for structures, modelling for other assets was not as well developed. The Agency does not yet understand sufficiently what affects the cost and time of maintenance work for optimal planning. It recognises this and it has begun to develop a detailed picture of the cost-drivers for maintenance.
Local highway authorities
2.16 Once central government has notified local authorities of their capital and revenue grants each year, councillors decide how to allocate this money and their other resources between all the services they have to provide. Local highway officers can find it difficult to resist pressure to direct resources to the immediate repair of roads that are visibly damaged. That is unless they have a clear evidence base on which to justify doing other preventative maintenance as well as, or instead of, fixing potholes. Also reducing such activities as those below can be poor value for money:
• Cleaning drainage systems to prevent water seeping into nearby roads and structures.
• Inspections and data collection to generate the intelligence to develop the forward maintenance programme will all counteract asset deterioration.
2.17 A number of local highway authorities are using modelling to underpin their asset management plans and reduce long-term costs. Figure 16 on page 35 is an example of a well-developed asset management system.

34 Part Two Maintaining strategic infrastructure: roads
Fig
ure
15
Dem
and
for
resu
rfac
ing
Leng
th (l
ane
km)
The
Ag
ency
pr e
dic
ted
dem
and
will
incr
ease
sub
stan
tially
No
te
1 P
red
icte
d re
surf
acin
g is
like
ly to
use
the
thin
sur
faci
ng s
yste
m.
Sou
rce:
Hig
hway
s A
genc
y
1960
3,20
0
3,00
0
2,80
0
2,60
0
2,40
0
2,20
0
2,00
0
1,80
0
1,60
0
1,40
0
1,20
0
1,00
0
800
600
400
200 0
Year
laid
Thin
sur
faci
ng s
yste
m
Hot
rolle
d as
phal
t
Pre
dict
ion
The
Nat
iona
l R
esur
faci
ng
Pro
gra
mm
e w
ill ad
dres
s th
e hi
gher
de
man
d fo
r re
surfa
cing
This
leve
l of
dem
and
is c
over
ed
thro
ugh
norm
al
asse
t mai
nten
ance
pr
ogra
mm
e
1963
1966
1969
1972
1975
1978
1981
1984
1987
1990
1993
1996
1999
2002
2005
2008
2011
2014
2017
2020
1970

Maintaining strategic infrastructure: roads Part Two 35
Figure 16Cornwall Council bases its maintenance decisions on an analysis of its local network
As part of its asset management approach Cornwall Council identified the key asset types and set performance standards which it thinks are realistic and affordable. It has grouped its highways and the associated assets into a hierarchy which reflects their relative importance as shown below
Hierarchy and class Description A road(km)
B road(km)
C road(km)
U road(km)
Total(km)
2a strategic routes Heavily trafficked between primary destinations 222.8 222.8
2b strategic routes All other classified A roads 342.8 342.8
3a main distributor Busy rural roads providing routes between strategic network and heavily trafficked urban roads
480.9 216.8 20.8 718.5
3b secondary distributor
As above but with lighter traffic conditions 102.8 684.0 147.0 933.8
4a local roads Roads linking main and secondary distributor networks, for example urban connectors between residential and industrial areas and rural connectors serving villages and schools
0.1 549.9 95.1 645.1
4b local access roads Roads serving a limited number of properties 0.1 747.4 2,606.0 3,353.5
5 minor roads and lanes
Roads with a limited width and lanes serving agricultural needs
438.5 488.6 927.1
6a tracks Unsuitable for vehicular traffic but used as a footpath, cycle trail or bridleway
1.2 25.3 26.5
6b abandoned tracks 1.3 72.7 74.0
The Council can then define its maintenance priorities better. For example, service levels for its urban roads (20 per cent of the network) are:
Hierarchy Carriageways Footpaths, cycleways and drainage gullies
Drainage other Verges, fences and barriers
Traffic signs and road markings
2a urbanService level 1 – safety, serviceability and sustainability
2b urban
Service level 2 – safety and immediate level of serviceability
3a urban
3b urban
Service level 3 – safety andminimal level of serviceability
4a urban
4b urban
5a urban
Service level 4 – safety only Service level 4 – safety only5b urban
The Council uses life-cycle planning to highlight funding gaps and to make a case for investment or to protect existing budgets. If resources are constrained then the highway authority is able to appraise a range of maintenance options to produce a programme of work which is affordable in the short term, as well as being an efficient use of resources in the longer term.
Source: Cornwall Council

36 Part Two Maintaining strategic infrastructure: roads
Improving highways maintenance
2.18 The Department for Transport (the Department) is aware of the challenges that the Agency and local highway authorities face in achieving value for money in maintenance expenditure. It has taken steps to address them.
Highways Agency reform
2.19 After the Cook review,26 the government concluded that several factors contributed towards cost inefficiencies and poor outcomes for motorists. These were the lack of long-term certainty about investment in the strategic road network, and a working culture dominated by civil service processes. There was also a need to support economic growth. In June 2013, it set out plans to change the Agency’s status to a limited company wholly publicly owned by the government, with six-year funding certainty for capital projects and maintenance.
2.20 The Agency believes this should make it easier to maintain its network efficiently. However, these measures in themselves may not be sufficient to guarantee improvement. Network Rail has a five-year funding period, year-end flexibility and independence from government and has made substantial progress to increase maintenance efficiency. However, this has required sustained commitment over a decade and the company has highlighted significant challenges which it still needs to address, for example, through further investment in asset information systems and condition-based monitoring as well as a whole-life approach to asset management with greater emphasis on planned rather than reactive maintenance. The Office of Rail Regulation has confirmed the importance of these improvements.27
26 Alan Cook, A fresh start for the Strategic Road Network: Managing our roads better to drive economic growth, boost innovation and give road users more for their money, November 2011.
27 Office of Rail Regulation, Annual efficiency and finance assessment of Network Rail 2012-13, September 2013.

Maintaining strategic infrastructure: roads Part Two 37
Consultation on funding for local highway authorities
2.21 The Department launched a discussion document in January 2014.28 It was seeking views on how to best allocate the annual capital grant of £976 million for local highways maintenance from 2015-16 to 2020-21 (an increase of 38 per cent from the 2014-15 baseline budget, with no allowance for inflation). Local highway authorities told us the following:
• There were perverse incentives in the current formula as it uses asset age as a proxy measure for their condition. This could reward authorities that have neglected their assets or lead to authorities replacing assets that are in a satisfactory state simply because they are old.
• They want to be rewarded for effective performance and innovation rather than compliance, for example, with producing an asset management plan.
• Four- or five-year budgets which are updated each year were preferable because authorities could then plan a long-term preventative maintenance programme.
The Highways Maintenance Efficiency Programme
2.22 We found local highway authorities were positive about the Department’s Programme because it raised the profile of maintenance, reinforced the need to use asset management principles and provided the opportunity to collaborate with other local highway authorities and industry. However, uptake was variable. Eighty-seven local highway authorities reported to the Asphalt Industry Alliance in 2014 that they were engaged with the Programme. All but one of 46 respondents to our survey cited examples of their involvement. However, they said that how much they were involved depended on staff having time to attend events or familiarise themselves with the toolkits (see paragraph 1.26).
2.23 In December 2013, the Department announced that the Programme would continue for a further five years. However, the Department wants the Programme to move towards self-sufficiency after March 2015. The Programme board has since committed to work with the sector to make 15 per cent savings by 2015 and 30 per cent or more by 2020. It will do this by providing a more compelling case for change from the current ways of working, building capacity and offering targeted support. This new focus is in line with the opinions of local highway authorities responding to our survey. They said they wanted the Programme team to develop benchmarks and quantitative measures, such as the economic case that links network condition to local growth, to help them make a more persuasive argument for preventative maintenance to local communities and councillors.
28 Department for Transport, Gearing up for efficient highway delivery and funding, January 2014.

38 Appendix One Maintaining strategic infrastructure: roads
Appendix One
Our audit approach
1 This study examined whether highways authorities have reduced road maintenance budgets as planned, how they have done so, and the consequences for the networks (Part One). We also looked at the systems and processes needed to achieve value for money on road maintenance (Part Two).
2 We focused on the Department’s activities, and the local authority sector as a whole. We have not done detailed fieldwork at individual local highway authorities, nor worked directly with local auditors to see how each local authority has responded to the recent budget cuts. We summarise our audit approach in Figure 17 and our evidence base in Appendix Two.

Maintaining strategic infrastructure: roads Appendix One 39
Figure 17Our audit approach
The government’s objective
How this will be achieved
Our study
Our evaluative criteria
Our evidence
(see Appendix Two for details)
Our conclusions
We drew on our previous published work.
We reviewed published and internal client documents.
We analysed the Agency’s and local government’s data on maintenance budgets and spend.
We conducted semi-structured interviews with key staff at the Department, the Agency, the Department for Communities and Local Government, a sample of local highway authorities and a range of stakeholders.
We reviewed the Agency’s and local highway authorities’ published and internal documents.
We conducted semi-structured interviews with staff at the Department, the Agency and a selection of local highway authorities.
We consulted local highway authorities and stakeholders via a survey, interviews and workshops with local highway authorities and consultations with a wide range of stakeholders.
We engaged independent consultants to advise us.
Whether highways authorities have reduced budgets as planned, how they have done so, and the consequences for the road networks.
Whether highways authorities have the right structures and information to achieve long-term value for money.
The government wants to equip the UK with world-class infrastructure that ensures the country can compete globally. This means it needs safe, serviceable and reliable road networks to support the economy.
The Department operates, maintains and improves the strategic road network through the Agency and provides guidance and advice on local network management to 152 local highway authorities.
This study examined the planned reductions to road maintenance budgets and the consequences for the network; and the systems and processes needed to achieve value for money on road maintenance.
There are positive signs of innovation by highways authorities in response to funding pressures on road maintenance. We believe that the Department understands the threat to value for money from uncertainty of funding. It is setting up a government company to address the problems in maintaining the strategic road network. However, this measure in itself will not be enough. Unless funding for both road networks is made more predictable and the allocation between capital and revenue balanced better, public value will be lost.

40 Appendix Two Maintaining strategic infrastructure: roads
Appendix Two
Our evidence base
1 We reached our independent conclusion on whether the approach taken by highways authorities to maintaining England’s roads is achieving value for money, following our analysis of the data collected between September 2013 and January 2014.
2 We used quantitative and qualitative techniques in our examination. We also engaged consultants to provide independent scrutiny and advice during the study. Our audit approach is outlined in Appendix One.
3 We assessed whether highways authorities reduced budgets as planned, how they have done so, and the consequences for the road networks by:
• drawing on our past work on Reducing costs in the Department for Transport29 and Funding for local transport: an overview;30
• examining the Department’s spending review settlement up to 2014-15 and the changes made to this in subsequent announcements;
• analysing the Agency’s data on maintenance and national datasets for local authority finances;
• conducting semi-structured interviews with key staff at the Department, the Agency and the Department for Communities and Local Government to get more information about the implementation and oversight for the cost reduction programme; and
• analysing national datasets on the size and condition of the road networks.
29 Comptroller and Auditor General, Reducing costs in the Department for Transport, Session 2010–2012, HC 1700, National Audit Office, December 2011.
30 Comptroller and Auditor General, Funding for local transport: an overview, Session 2012–13, HC 629, National Audit Office, October 2012.

Maintaining strategic infrastructure: roads Appendix Two 41
4 We assessed the structures and information needed to achieve value for money by:
• reviewing published and internal departmental documents;
• reviewing published literature that sets out the principles of good asset management;
• carrying out semi-structured interviews with staff at the Agency to understand the rationale behind and their approach to asset management;
• visiting three of the Agency’s areas for semi-structured interviews with key staff and senior representatives from their service providers to establish their views on the operation of the maintenance contracts;
• reviewing a range of published and internal Agency documents setting out the details of its approach to asset management and its contract management;
• interviewing senior highways managers in nine local authorities (Birmingham City Council, Leicestershire County Council, Rutland County Council, Stoke-on-Trent City Council, Northamptonshire County Council, Warwickshire County Council, Norfolk County Council, Cheshire West and Chester Council, and North Somerset Council);
• asking directors of local highways services about their approach to road maintenance, how the Department supports them and the challenges they faced (46 survey returns out of a maximum of 152);
• conducting desk-based research on local authorities’ approaches to road maintenance;
• consulting the Association of Directors of Environment, Economy, Planning and Transport; Association for Public Service Excellence; Local Government Technical Advisers Group; Bridges Board of the UK Roads Liaison Group; Civil Engineering Contractors Association; Highways Term Maintenance Association and the AA;
• reviewing the results of the Asphalt Industry Alliance’s Annual Local Authority Road Maintenance (ALARM) survey, which covers the levels of funding required, the condition of local roads and the approach to maintenance. The most recent survey ran from January to February 2014, and was completed by local authorities in England and Wales. The response rate was 75 per cent from English local authorities and 75 per cent from London boroughs;
• interviewing representatives from Network Rail, the Nuclear Decommissioning Authority and Transport for London to understand how they maintain their strategic infrastructure; and
• engaging Professor Nigel Smith, Professor of Project and Transport Infrastructure Management; Dr Kevin Reilly, Senior Lecturer in Economics; and Krisen Moodley, Senior Lecturer in Engineering Project Management, from the University of Leeds, to provide independent scrutiny and advice during the study.


This report has been printed on Evolution Digital Satin and contains material sourced from responsibly managed and sustainable forests certified in accordance with the FSC (Forest Stewardship Council).
The wood pulp is totally recyclable and acid-free. Our printers also have full ISO 14001 environmental accreditation, which ensures that they have effective procedures in place to manage waste and practices that may affect the environment.

£10.00
9 781904 219194
ISBN 978-1-904219-19-4
Design and Production by NAO Communications DP Ref: 10436-001