new zealand transport agency resilience of state … zealand transport agency resilience of state...
TRANSCRIPT
New Zealand Transport Agency
Resilience of State Highways Lessons from the 2016 Kaikoura Earthquake for Resilience Studies

New Zealand Transport Agency
Resilience of State Highways
Lessons from the 2016 Kaikoura Earthquake for Resilience Studies
© Opus International Consultants Ltd 2017
Prepared by
Opus International Consultants Ltd
P Brabhaharan L10, Majestic Centre, 100 Willis St National Technical Director - Geotechnical P O Box 12 003, Wellington 6144 Engineering New Zealand
. Telephone: +64 4 471 7000 Doug Mason Facsimile: +64 4 471 1397 Senior Engineering Geologist Report No GER 2017 - 29 Date: June 2017 Jasmin Callosa-Tarr Status: Issue 1 Senior GIS Analyst
Approved for Release by
P Brabhaharan Reference: 5C2934.01 Project Director
Resilience of State Highways - National Methodology i
5C2934.01 | June 2017 | Issue 1 Opus International Consultants Ltd
Contents
Summary ................................................................................................................... 1
1 Introduction ....................................................................................................... 2
2 Resilience ........................................................................................................... 3
3 Methodology ...................................................................................................... 4
4 The Kaikoura earthquake ................................................................................... 5 4.1 The event ........................................................................................................................... 5 4.2 Ground shaking ................................................................................................................. 6 4.3 Fault rupture ..................................................................................................................... 8
5 Damage to highways from earthquake ............................................................... 9 5.1 Observed earthquake damage ........................................................................................... 9 5.2 Storm damage after earthquake ...................................................................................... 14 5.3 Observations from Failures ............................................................................................. 16
6 Mapping of Resilience ...................................................................................... 20 6.1 2016 National State Highway Resilience Study .............................................................. 20 6.2 Updated 2001 Resilience Study ...................................................................................... 20 6.3 Mapping of the Performance in the Kaikoura Earthquake ............................................. 20 6.4 Outage ............................................................................................................................. 21
7 Gap Analyses .................................................................................................... 22 7.1 Comparison of Earthquake Shaking ............................................................................... 22 7.2 Comparison of Availability State..................................................................................... 22 7.3 Comparison of Outage .................................................................................................... 23 7.4 Post-restoration Level of Service .................................................................................... 25
8 Conclusions ...................................................................................................... 26
9 Recommendations ........................................................................................... 28
10 References ....................................................................................................... 29 Appendices Appendix A .......................................................................................... Resilience States Appendix B ................................... Availability State Maps – 2001 Resilience and Actual Appendix C ..................... Availability State Maps – 2016 National Resilience and Actual
Resilience of State Highways – Lessons from Kaikoura Earthquake 1
5C2934.01 | June 2017 | Issue 1 Opus International Consultants Ltd
Summary The New Zealand Transport Agency is developing its strategy for resilience of its state highway network in New Zealand. This is part of its strategy to understand and enhance the resilience of its state highway network to natural hazards.
As part of this strategy the agency engaged Opus International Consultants (Opus) to assess the resilience of the state highway network at a broad national level, and develop a methodology for implementation at regional level. This was completed in December 2016.
The 14 November 2016 Kaikoura earthquake severely affected SH1 and other roads in the area, and severely impacted on the availability of the state highway. This provided an opportunity to calibrate the resilience studies against observations from this earthquake and bring together key learnings for future resilience studies. This has been carried out by comparing the observed resilience in the Kaikoura event with the resilience assessed for the Kaikoura Coast section of SH1 in the 2016 National resilience assessment of state highways (Opus, 2016) and the 2001 road network risk research which included a case study of the Kaikoura coast section of SH1.
The 2001 corridor level resilience study was carried out as a case study as part of the research carried out in road network risk management strategy (Brabhaharan et al, 2001). This was more detailed than the 2016 national state highway resilience assessment, and has allowed comparison between the expected performance and the actual damage from the Kaikoura earthquake at a more detailed level.
This study has generally confirmed that the resilience studies provide a good reflection of the resilience of the route in earthquakes such as the 2016 Kaikoura earthquake.
One key observation from previous earthquake reconnaissance studies and reinforced in this study is that earthquakes loosen the slopes and generate debris in the catchments due to slope failures, and this leads to a greater potential for landslides and debris flows in future storm events, and associated reduction in the resilience of the route. The landsliding and debris flows from the April 2017 storms confirm this to be the case. It would be prudent to ensure that this is taken into consideration in considering the resilience of state highways, particularly at a regional level.
The recovery after the Kaikoura earthquake confirms that recovery is likely to happen in stages to reflect community needs and practicalities rather than a once over recovery to full access. This means that in such events recovery may provide restricted or limited access sometimes sooner, but achievement of full pre-event level of service may take much longer.
A number of other observations are made which are documented in this report, and provide valuable information for future resilience studies. It is recommended that these learnings be included in the regional resilience methodology developed for the NZ Transport Agency by Opus.
Resilience of State Highways – Lessons from Kaikoura Earthquake 2
5C2934.01 | June 2017 | Issue 1 Opus International Consultants Ltd
1 Introduction
The New Zealand Transport Agency is developing its strategy for resilience of its state highway network in New Zealand. This is part of its strategy to understand and enhance the resilience of its state highway network to natural hazards.
As part of this strategy, the agency has engaged Opus International Consultants (Opus) to assess the resilience of the state highway network at a broad national level, and develop a methodology for implementation at regional level. This was completed in December 2016 (Opus, 2016).
Following the November 2016 Kaikoura earthquake, Opus suggested that 2016 national level and 2001 corridor level resilience assessments be calibrated against the resilience impacts from the earthquake, to draw lessons for future resilience assessments, and were engaged to carry out this work. The 2016 national level resilience assessment has been calibrated against the observations following the 14 November 2016 Kaikoura earthquake.
The 2001 corridor level resilience study was more detailed than the 2016 national state highway resilience assessment, as that was carried out at a more detailed corridor level than the broader national level study in 2016. Consideration of the 2001 study has allowed comparison between the expected performance and the actual damage from the Kaikoura earthquake in discrete sections.
The resilience of the SH1 corridor between Ward and Hundalee was assessed as a case study as part of the road network risk management study carried out by Opus, to illustrate the methodology developed (Brabhaharan et al, 2001). This was used in this calibration as it was the only corridor level resilience assessment that had been carried out for the Kaikoura section of the state highway.
Information on the impact on the highway was collated as part of this study and compared to a previous resilience assessments for the Ward to Hundalee section of State Highway 1 through Kaikoura. This was reviewed to draw observations and lessons for future resilience assessments for transportation routes.
This brief report presents our review of the observations of the performance of the highway following the November 2016 Kaikoura earthquake, and lessons drawn from comparison of the previously assessed resilience against the actual observations for future assessments of the resilience of transportation routes.
Resilience of State Highways – Lessons from Kaikoura Earthquake 3
5C2934.01 | June 2017 | Issue 1 Opus International Consultants Ltd
2 Resilience
This section sets out the resilience context and so supports the definitions and metrics used in the remaining report.
Resilience is the ability to readily recover and return to its original level of service from adversity. Knowledge of the resilience of the road network in natural hazard events is important to understand the impact on society – the people, emergency services, economic activity etc. This would also enable the expected resilience to be compared against desired level of service targets, and help develop resilience enhancement measures.
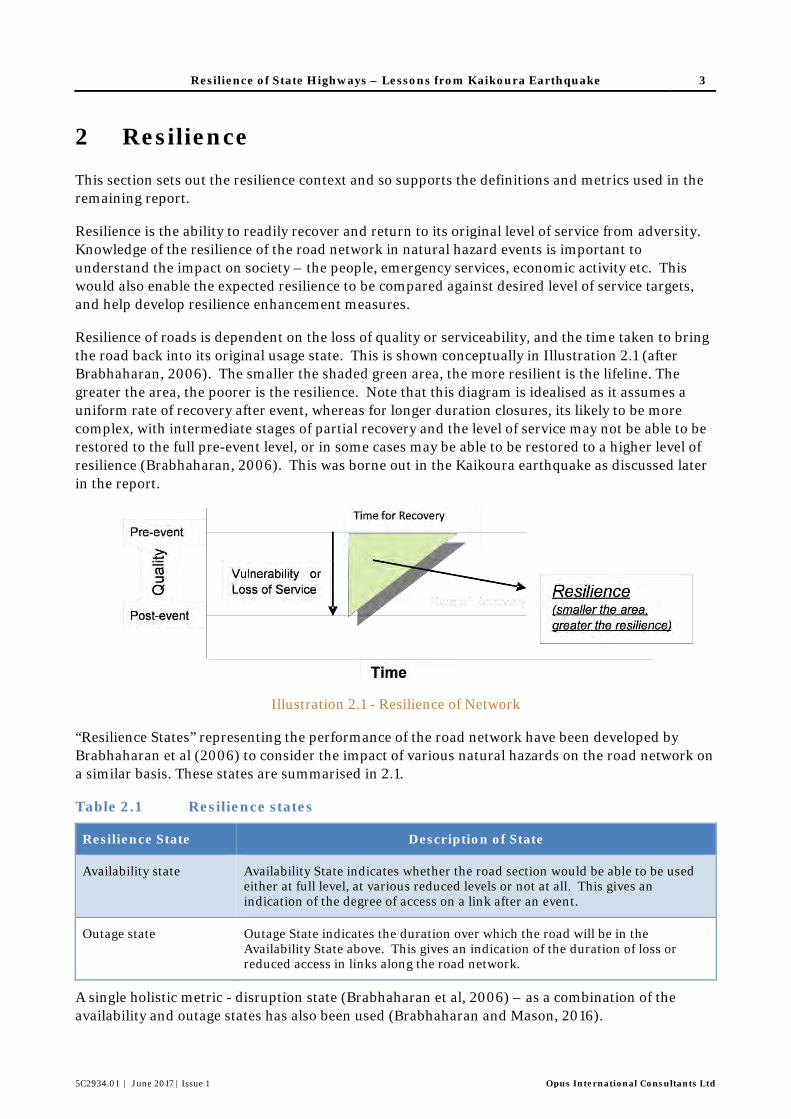
Resilience of roads is dependent on the loss of quality or serviceability, and the time taken to bring the road back into its original usage state. This is shown conceptually in Illustration 2.1 (after Brabhaharan, 2006). The smaller the shaded green area, the more resilient is the lifeline. The greater the area, the poorer is the resilience. Note that this diagram is idealised as it assumes a uniform rate of recovery after event, whereas for longer duration closures, its likely to be more complex, with intermediate stages of partial recovery and the level of service may not be able to be restored to the full pre-event level, or in some cases may be able to be restored to a higher level of resilience (Brabhaharan, 2006). This was borne out in the Kaikoura earthquake as discussed later in the report.
Illustration 2.1 - Resilience of Network
“Resilience States” representing the performance of the road network have been developed by Brabhaharan et al (2006) to consider the impact of various natural hazards on the road network on a similar basis. These states are summarised in 2.1.
Table 2.1 Resilience states
Resilience State Description of State
Availability state Availability State indicates whether the road section would be able to be used either at full level, at various reduced levels or not at all. This gives an indication of the degree of access on a link after an event.
Outage state Outage State indicates the duration over which the road will be in the Availability State above. This gives an indication of the duration of loss or reduced access in links along the road network.
A single holistic metric - disruption state (Brabhaharan et al, 2006) – as a combination of the availability and outage states has also been used (Brabhaharan and Mason, 2016).
Resilience of State Highways – Lessons from Kaikoura Earthquake 4
5C2934.01 | June 2017 | Issue 1 Opus International Consultants Ltd
3 Methodology
The methodology used for the review comprised:
1) Characterisation of the 14 November 2016 Kaikoura earthquake.
2) Review of previous work, comprising:
a) Retrieval of the regional level resilience assessment carried out for the Ward to Hundalee section of SH1S (Brabhaharan et al, 2001), and updating for current resilience metrics used in the National State Highway Resilience study (Brabhaharan and Mason, 2016).
b) Review of lessons from the geotechnical performance of the state highways prepared based on post-earthquake reconnaissance of the damage from the 14 November 2016 Kaikoura Earthquake (Brabhaharan, 2017).
3) Gathering of data, including:
a) Review of LiDAR maps taken immediately after the earthquake, and map areas of highway damage from the earthquake.
b) Helicopter and limited land reconnaissance (by P Brabhaharan and Doug Mason) of the earthquake damaged sections of SH1 between Kaikoura and Waipapa Bay, and the Inland Route to Kaikoura, some 5 months after the earthquake. This supplemented observations from site reconnaissance by Brabhaharan and Doug Mason in the days and weeks immediately after the earthquake, and the detailed mapping by Doug Mason as part of North Canterbury Transportation Infrastructure Recovery (NCTIR) alliance between February and April 2017.
c) Learning about post-earthquake response and durations by interviewing selected Opus and NCTIR staff involved in the recovery operations.
4) Mapping of the availability state of the Kaikoura section of State Highway 1 after the earthquake.
5) Gap analyses by reviewing and comparing the previous resilience assessments with the observed post-earthquake resilience of SH1 in the Kaikoura earthquake, subsequent after-shocks and storm events.
6) Preparation of report with observations and recommendations for future resilience assessments.
Resilience of State Highways – Lessons from Kaikoura Earthquake 5
5C2934.01 | June 2017 | Issue 1 Opus International Consultants Ltd
4 The Kaikoura earthquake
4.1 The event
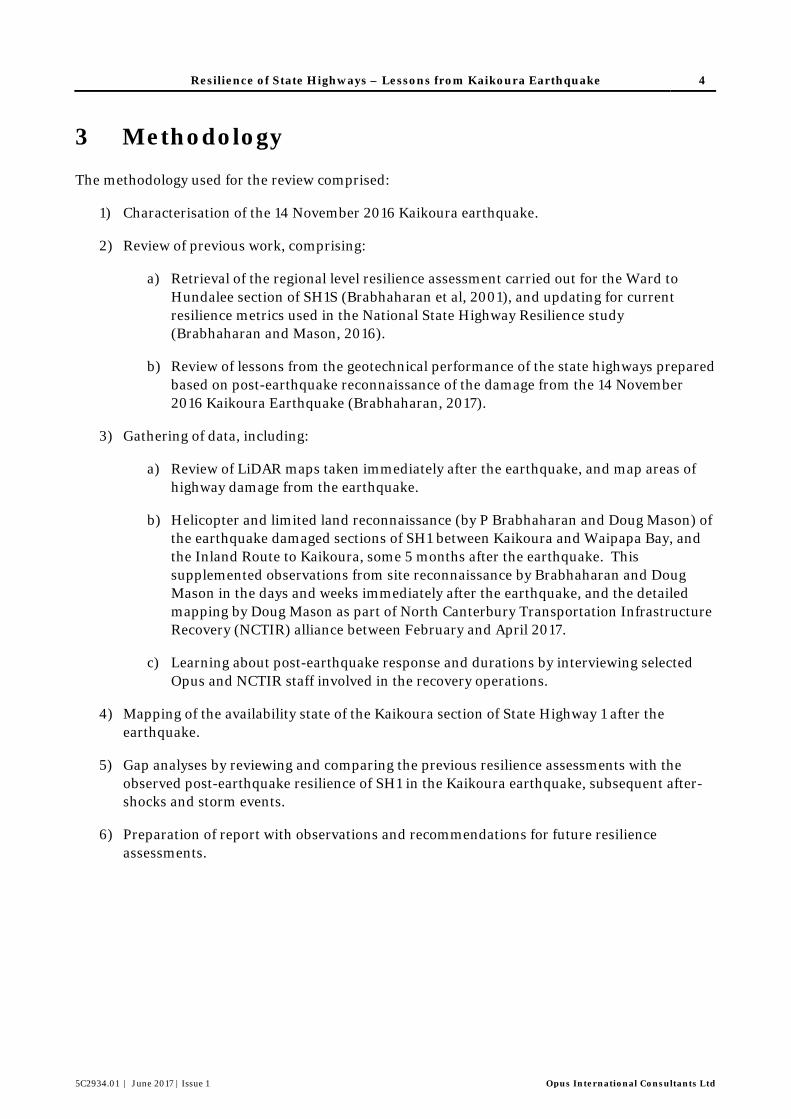
A severe magnitude 7.8 earthquake struck 15 km north-east of Culverden in the South Island of New Zealand, at 12:02 am on Monday 14th November 2017. This was followed by numerous aftershocks, see Illustration 4.1. The earthquake caused closure of State Highway 1 South (SH 1S) between Ward and Cheviot, and other local roads due to numerous landslides, fault rupture and failure of highway structures. Two people died in the earthquake.
(Source: GNS Science)
Illustration 4.1. Location of M 7.8 Kaikoura earthquake of 14 November 2016
Although a recurrence interval hasn’t been assigned for this event, it is likely to be larger than 1,000 years for the event. However, the return period of shaking at any one location will vary, as
Resilience of State Highways – Lessons from Kaikoura Earthquake 6
5C2934.01 | June 2017 | Issue 1 Opus International Consultants Ltd
the ground shaking is less in some areas of the Kaikoura coast and larger in some areas than the 1,000 year return period ground shaking used in the 2016 National level resilience study.
The location of the main 7.8 event, the aftershocks including the magnitude 6.2 and 6.3 events, the so far identified fault rupture zones and active faults in the region are shown on Illustration 4.1.
The rupture started about 15 km north-east of Culverden (and 60 km south-west of Kaikoura town) at a depth of about 15 km, with the rupture largely propagating to the north, leading to the largest proportion of energy released significantly north of the epicentre. The complex earthquake rupture occurred on multiple faults, and had a duration of about 120 seconds. The cumulative magnitude of these ruptures contributed to the overall magnitude 7.8 earthquake.
4.2 Ground shaking
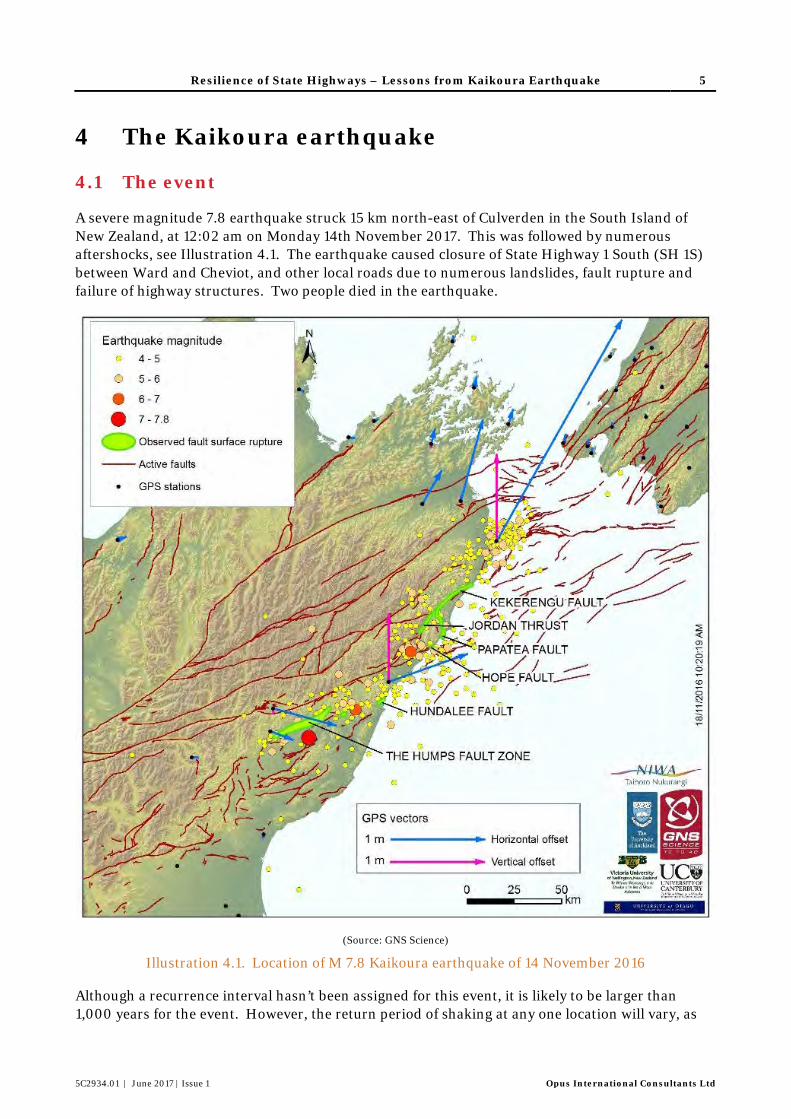
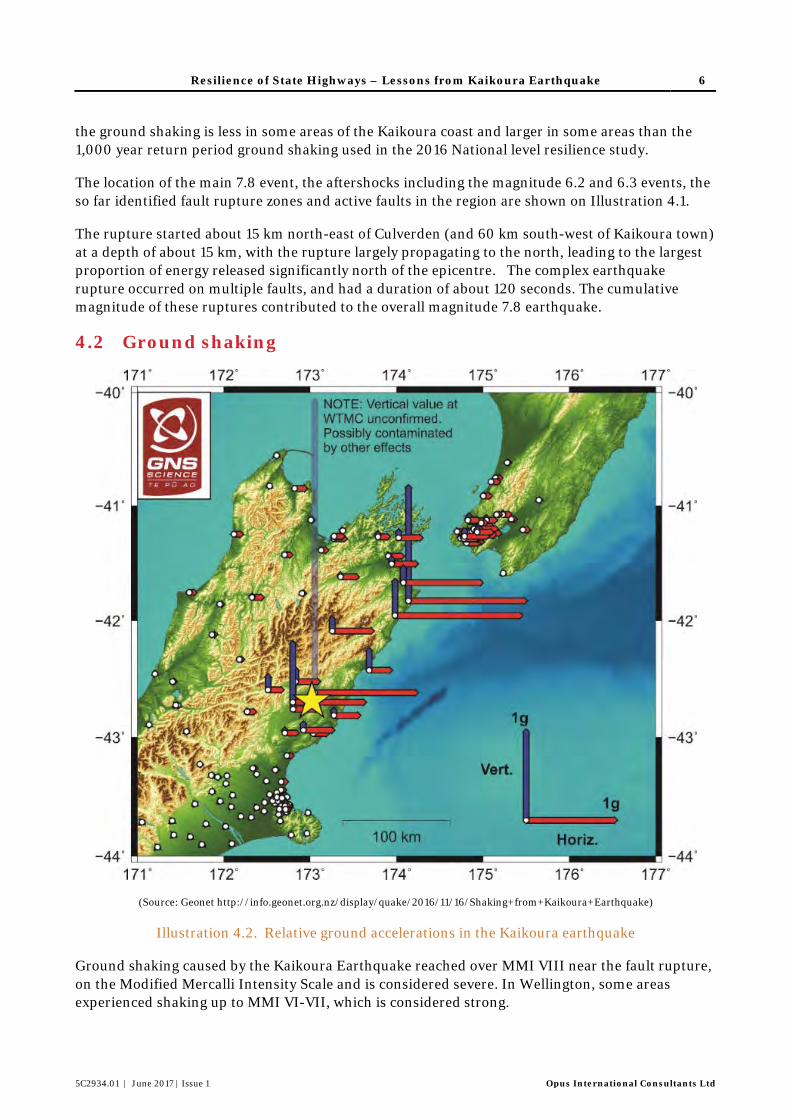
(Source: Geonet http://info.geonet.org.nz/display/quake/2016/11/16/Shaking+from+Kaikoura+Earthquake)
Illustration 4.2. Relative ground accelerations in the Kaikoura earthquake
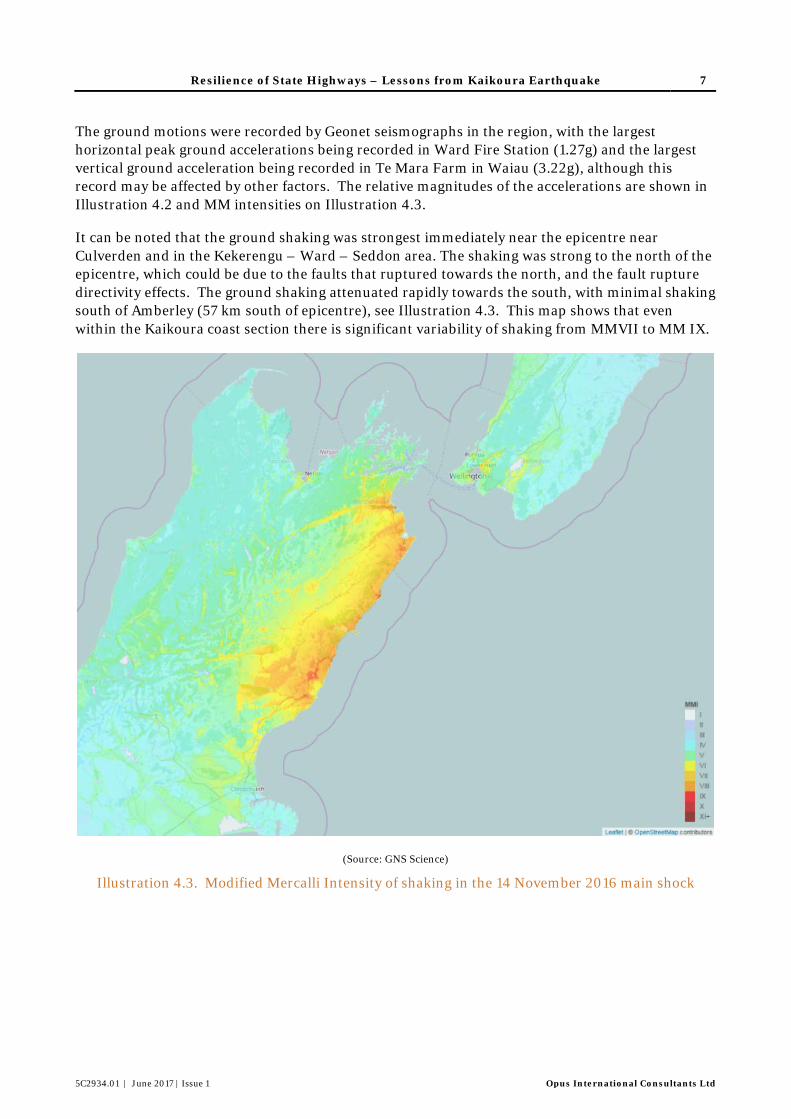
Ground shaking caused by the Kaikoura Earthquake reached over MMI VIII near the fault rupture, on the Modified Mercalli Intensity Scale and is considered severe. In Wellington, some areas experienced shaking up to MMI VI-VII, which is considered strong.
Resilience of State Highways – Lessons from Kaikoura Earthquake 7
5C2934.01 | June 2017 | Issue 1 Opus International Consultants Ltd
The ground motions were recorded by Geonet seismographs in the region, with the largest horizontal peak ground accelerations being recorded in Ward Fire Station (1.27g) and the largest vertical ground acceleration being recorded in Te Mara Farm in Waiau (3.22g), although this record may be affected by other factors. The relative magnitudes of the accelerations are shown in Illustration 4.2 and MM intensities on Illustration 4.3.
It can be noted that the ground shaking was strongest immediately near the epicentre near Culverden and in the Kekerengu – Ward – Seddon area. The shaking was strong to the north of the epicentre, which could be due to the faults that ruptured towards the north, and the fault rupture directivity effects. The ground shaking attenuated rapidly towards the south, with minimal shaking south of Amberley (57 km south of epicentre), see Illustration 4.3. This map shows that even within the Kaikoura coast section there is significant variability of shaking from MMVII to MM IX.
(Source: GNS Science)
Illustration 4.3. Modified Mercalli Intensity of shaking in the 14 November 2016 main shock
Resilience of State Highways – Lessons from Kaikoura Earthquake 8
5C2934.01 | June 2017 | Issue 1 Opus International Consultants Ltd
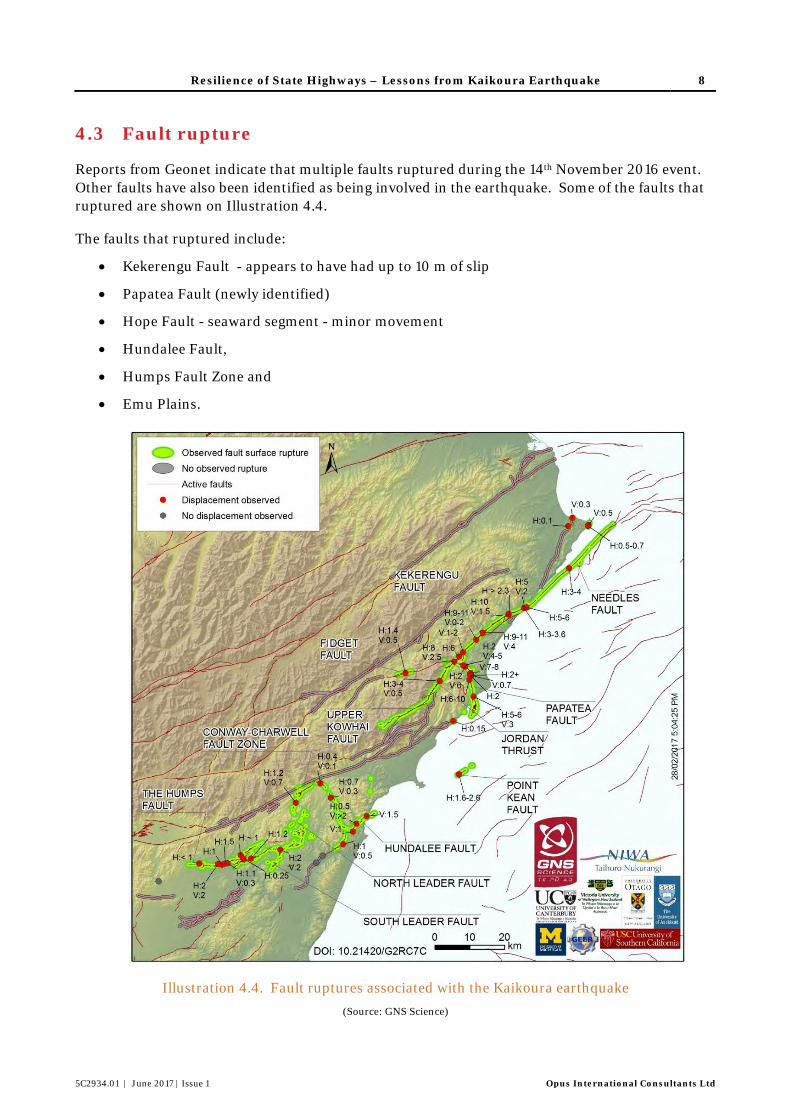
4.3 Fault rupture
Reports from Geonet indicate that multiple faults ruptured during the 14th November 2016 event. Other faults have also been identified as being involved in the earthquake. Some of the faults that ruptured are shown on Illustration 4.4.
The faults that ruptured include:
• Kekerengu Fault - appears to have had up to 10 m of slip
• Papatea Fault (newly identified)
• Hope Fault - seaward segment - minor movement
• Hundalee Fault,
• Humps Fault Zone and
• Emu Plains.
Illustration 4.4. Fault ruptures associated with the Kaikoura earthquake (Source: GNS Science)
Resilience of State Highways – Lessons from Kaikoura Earthquake 9
5C2934.01 | June 2017 | Issue 1 Opus International Consultants Ltd
5 Damage to highways from earthquake
5.1 Observed earthquake damage
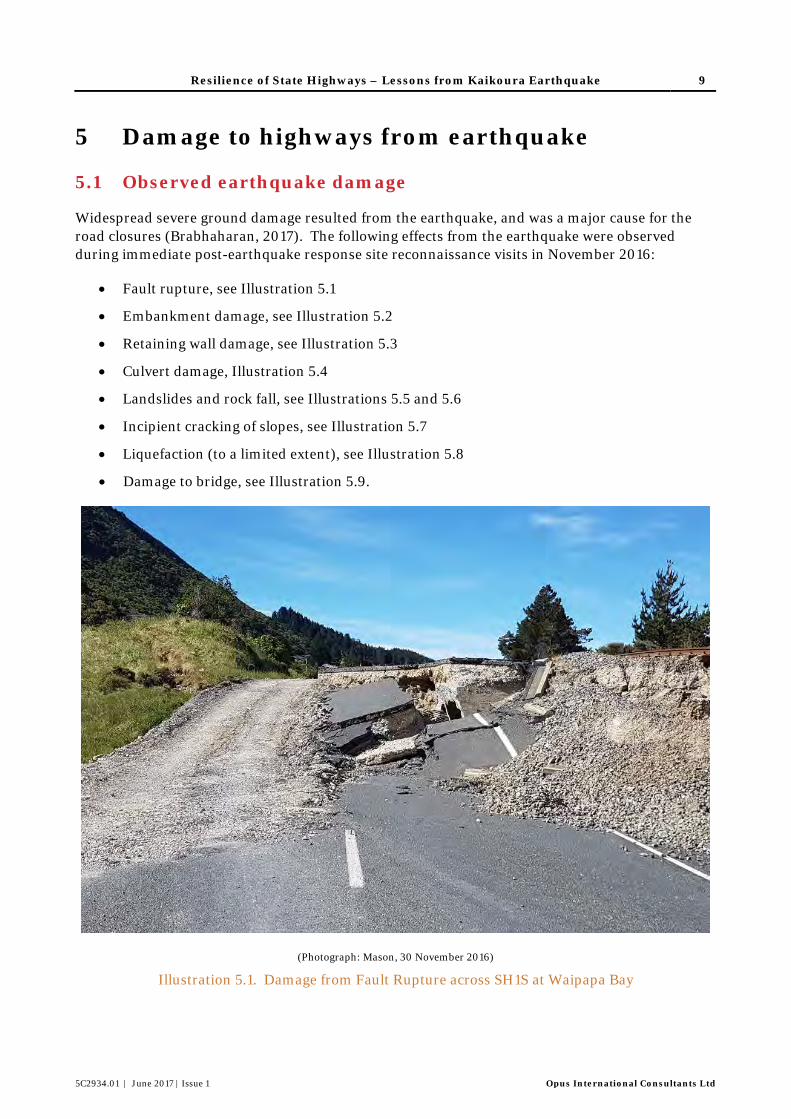
Widespread severe ground damage resulted from the earthquake, and was a major cause for the road closures (Brabhaharan, 2017). The following effects from the earthquake were observed during immediate post-earthquake response site reconnaissance visits in November 2016:
• Fault rupture, see Illustration 5.1
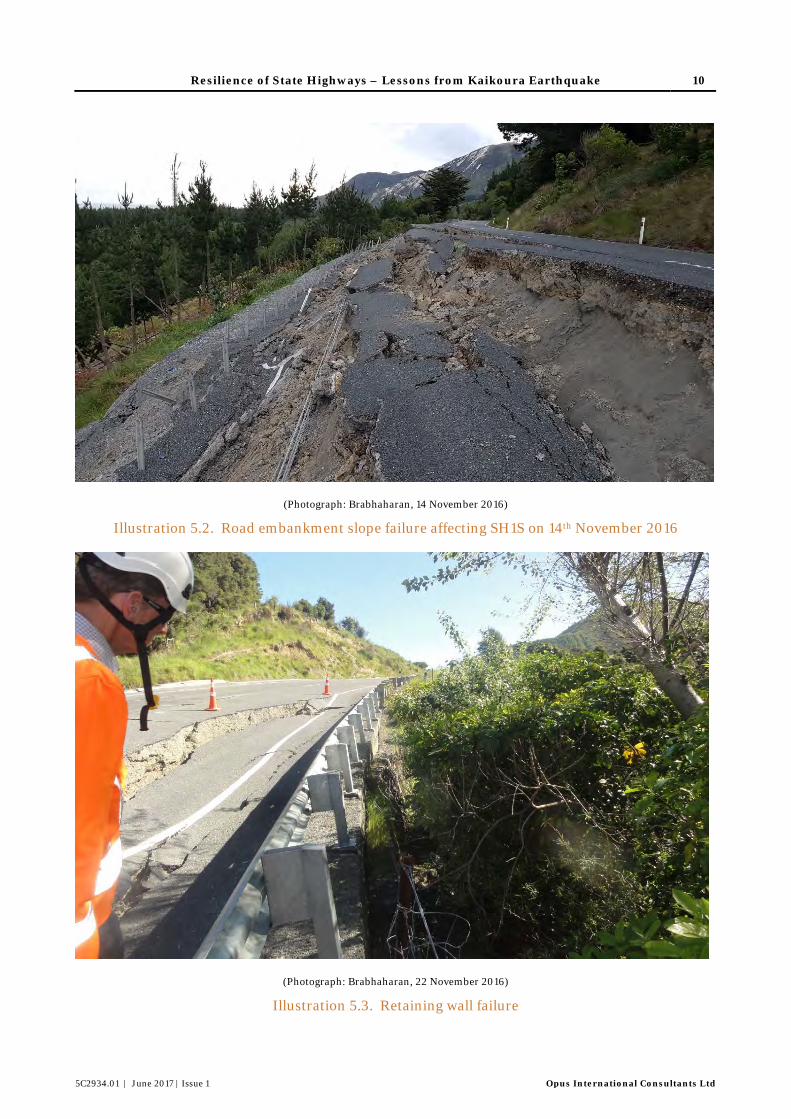
• Embankment damage, see Illustration 5.2
• Retaining wall damage, see Illustration 5.3
• Culvert damage, Illustration 5.4
• Landslides and rock fall, see Illustrations 5.5 and 5.6
• Incipient cracking of slopes, see Illustration 5.7
• Liquefaction (to a limited extent), see Illustration 5.8
• Damage to bridge, see Illustration 5.9.
(Photograph: Mason, 30 November 2016)
Illustration 5.1. Damage from Fault Rupture across SH1S at Waipapa Bay
Resilience of State Highways – Lessons from Kaikoura Earthquake 10
5C2934.01 | June 2017 | Issue 1 Opus International Consultants Ltd
(Photograph: Brabhaharan, 14 November 2016)
Illustration 5.2. Road embankment slope failure affecting SH1S on 14th November 2016
(Photograph: Brabhaharan, 22 November 2016)
Illustration 5.3. Retaining wall failure
Resilience of State Highways – Lessons from Kaikoura Earthquake 11
5C2934.01 | June 2017 | Issue 1 Opus International Consultants Ltd
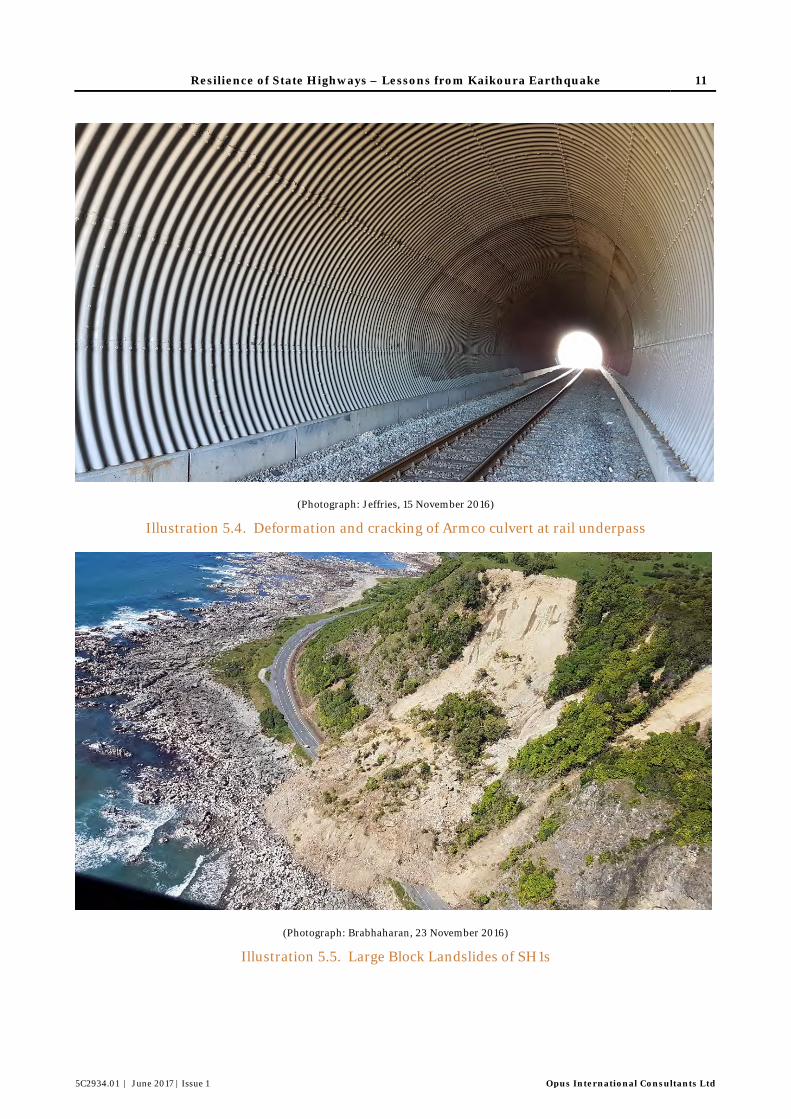
(Photograph: Jeffries, 15 November 2016)
Illustration 5.4. Deformation and cracking of Armco culvert at rail underpass
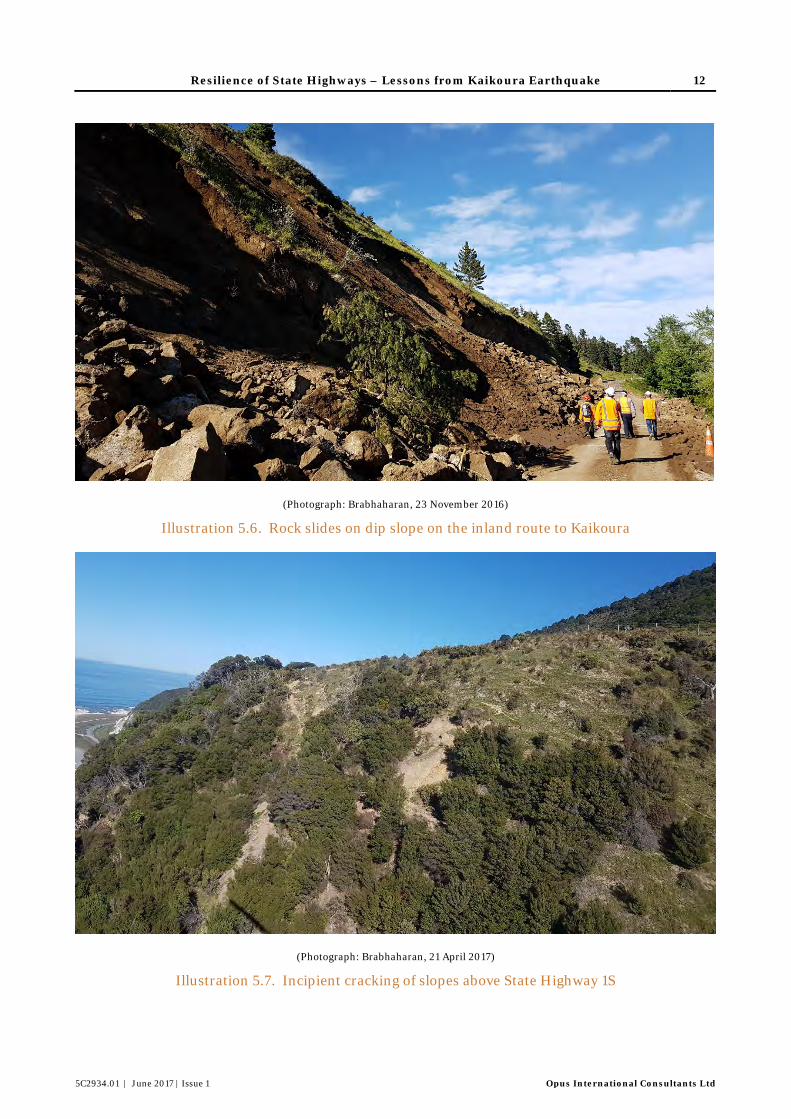
(Photograph: Brabhaharan, 23 November 2016)
Illustration 5.5. Large Block Landslides of SH1s
Resilience of State Highways – Lessons from Kaikoura Earthquake 12
5C2934.01 | June 2017 | Issue 1 Opus International Consultants Ltd
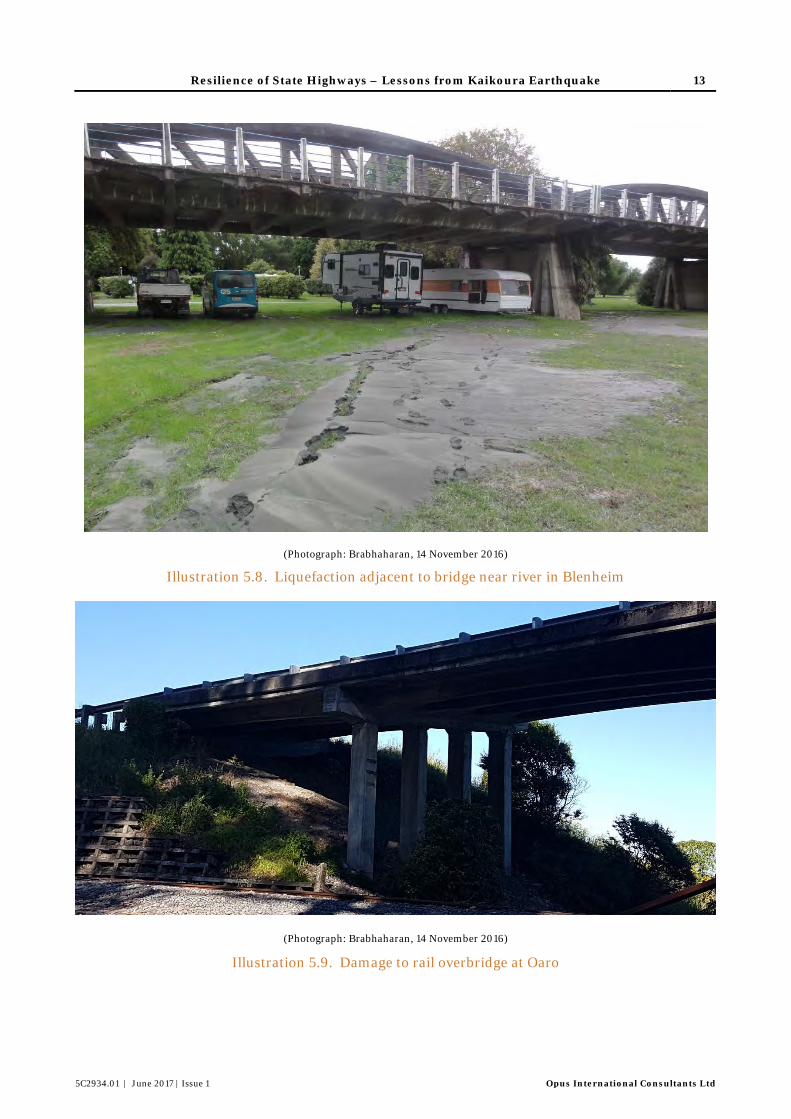
(Photograph: Brabhaharan, 23 November 2016)
Illustration 5.6. Rock slides on dip slope on the inland route to Kaikoura
(Photograph: Brabhaharan, 21 April 2017)
Illustration 5.7. Incipient cracking of slopes above State Highway 1S
Resilience of State Highways – Lessons from Kaikoura Earthquake 13
5C2934.01 | June 2017 | Issue 1 Opus International Consultants Ltd
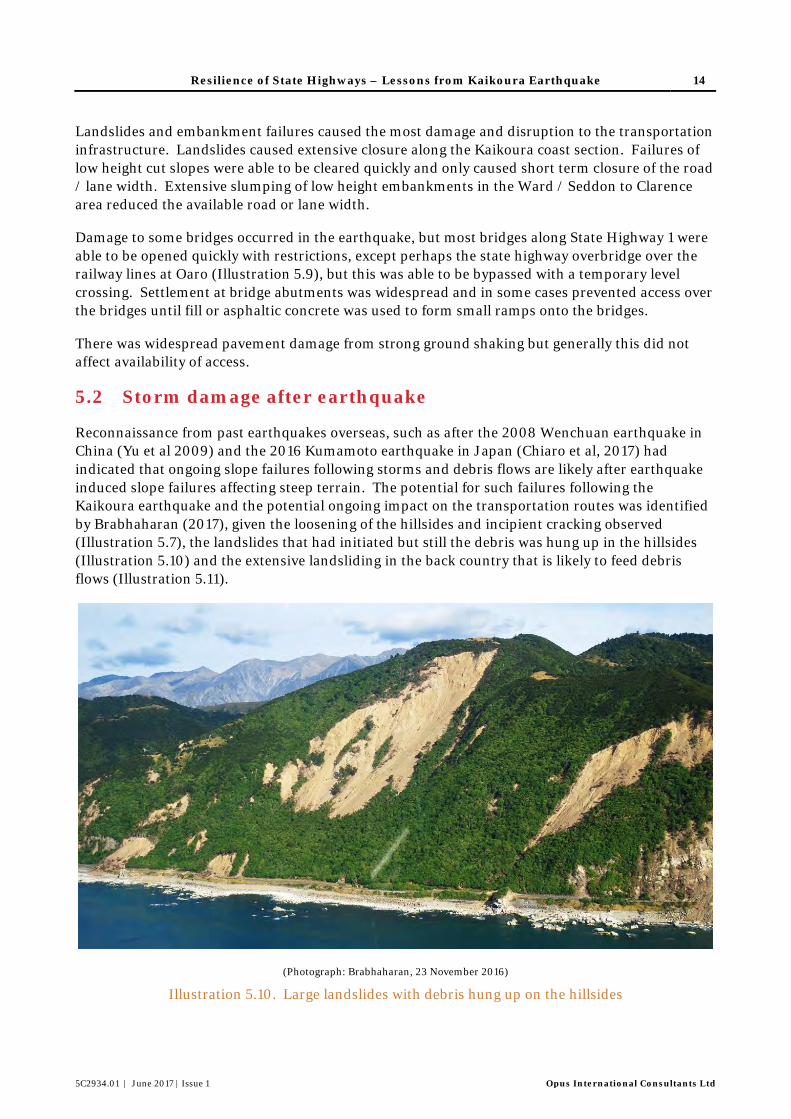
(Photograph: Brabhaharan, 14 November 2016)
Illustration 5.8. Liquefaction adjacent to bridge near river in Blenheim
(Photograph: Brabhaharan, 14 November 2016)
Illustration 5.9. Damage to rail overbridge at Oaro
Resilience of State Highways – Lessons from Kaikoura Earthquake 14
5C2934.01 | June 2017 | Issue 1 Opus International Consultants Ltd
Landslides and embankment failures caused the most damage and disruption to the transportation infrastructure. Landslides caused extensive closure along the Kaikoura coast section. Failures of low height cut slopes were able to be cleared quickly and only caused short term closure of the road / lane width. Extensive slumping of low height embankments in the Ward / Seddon to Clarence area reduced the available road or lane width.
Damage to some bridges occurred in the earthquake, but most bridges along State Highway 1 were able to be opened quickly with restrictions, except perhaps the state highway overbridge over the railway lines at Oaro (Illustration 5.9), but this was able to be bypassed with a temporary level crossing. Settlement at bridge abutments was widespread and in some cases prevented access over the bridges until fill or asphaltic concrete was used to form small ramps onto the bridges.
There was widespread pavement damage from strong ground shaking but generally this did not affect availability of access.
5.2 Storm damage after earthquake
Reconnaissance from past earthquakes overseas, such as after the 2008 Wenchuan earthquake in China (Yu et al 2009) and the 2016 Kumamoto earthquake in Japan (Chiaro et al, 2017) had indicated that ongoing slope failures following storms and debris flows are likely after earthquake induced slope failures affecting steep terrain. The potential for such failures following the Kaikoura earthquake and the potential ongoing impact on the transportation routes was identified by Brabhaharan (2017), given the loosening of the hillsides and incipient cracking observed (Illustration 5.7), the landslides that had initiated but still the debris was hung up in the hillsides (Illustration 5.10) and the extensive landsliding in the back country that is likely to feed debris flows (Illustration 5.11).
(Photograph: Brabhaharan, 23 November 2016)
Illustration 5.10. Large landslides with debris hung up on the hillsides
Resilience of State Highways – Lessons from Kaikoura Earthquake 15
5C2934.01 | June 2017 | Issue 1 Opus International Consultants Ltd
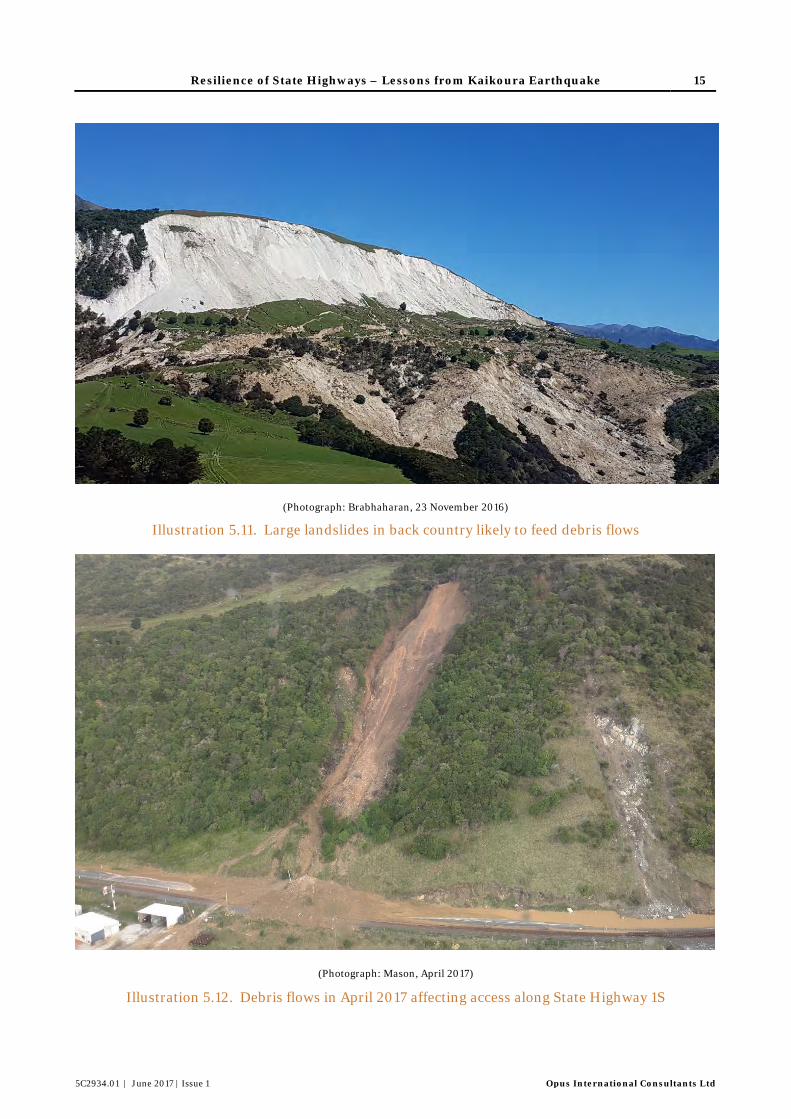
(Photograph: Brabhaharan, 23 November 2016)
Illustration 5.11. Large landslides in back country likely to feed debris flows
(Photograph: Mason, April 2017)
Illustration 5.12. Debris flows in April 2017 affecting access along State Highway 1S
Resilience of State Highways – Lessons from Kaikoura Earthquake 16
5C2934.01 | June 2017 | Issue 1 Opus International Consultants Ltd
The site reconnaissance planned for this study was delayed due to logistical constraints associated with access following the formation of NCTIR and the storms in March / April 2017. However the delays to the site reconnaissance proved to be fortuitous as the post-storm reconnaissance provided further valuable lessons for resilience impact due to the post-earthquake storms.
Recent storms such as Cyclone Debbie and Cyclone Cook in April 2017 caused further landsliding and debris flows that have affected State Highway 1 (Illustration 5.12). In particular a new landslide in mid-April near Rosy Morn south of Kaikoura on a section of hillside that had not failed in the earthquake. The state highway from the south to Kaikoura remains closed by this landslide.
5.3 Observations from Failures
The observation of damage in the Kaikoura earthquakes and follow-on storms has enabled a number of lessons to be drawn that have an influence on resilience. These observations and their implications for the State Highway resilience studies are discussed below.
5.3.1 Topographical amplification effects
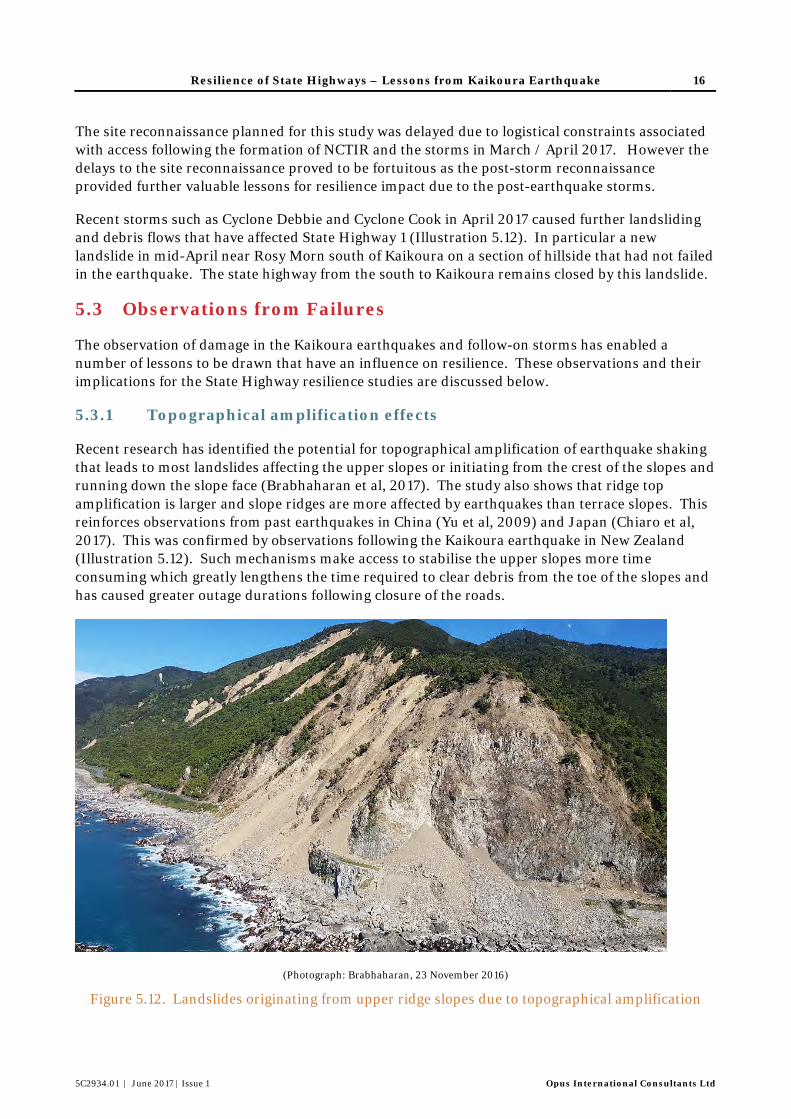
Recent research has identified the potential for topographical amplification of earthquake shaking that leads to most landslides affecting the upper slopes or initiating from the crest of the slopes and running down the slope face (Brabhaharan et al, 2017). The study also shows that ridge top amplification is larger and slope ridges are more affected by earthquakes than terrace slopes. This reinforces observations from past earthquakes in China (Yu et al, 2009) and Japan (Chiaro et al, 2017). This was confirmed by observations following the Kaikoura earthquake in New Zealand (Illustration 5.12). Such mechanisms make access to stabilise the upper slopes more time consuming which greatly lengthens the time required to clear debris from the toe of the slopes and has caused greater outage durations following closure of the roads.
(Photograph: Brabhaharan, 23 November 2016)
Figure 5.12. Landslides originating from upper ridge slopes due to topographical amplification
Resilience of State Highways – Lessons from Kaikoura Earthquake 17
5C2934.01 | June 2017 | Issue 1 Opus International Consultants Ltd
The potential for such prolonged outages were taken into consideration in the 2016 national state highway resilience assessments, where these locations are identified as likely to result in long term closure. This observation would be of value in more detailed regional or corridor level assessments or project specific assessments, where more detailed assessment of the resilience and in particular outage may be required.
5.3.2 Slope height
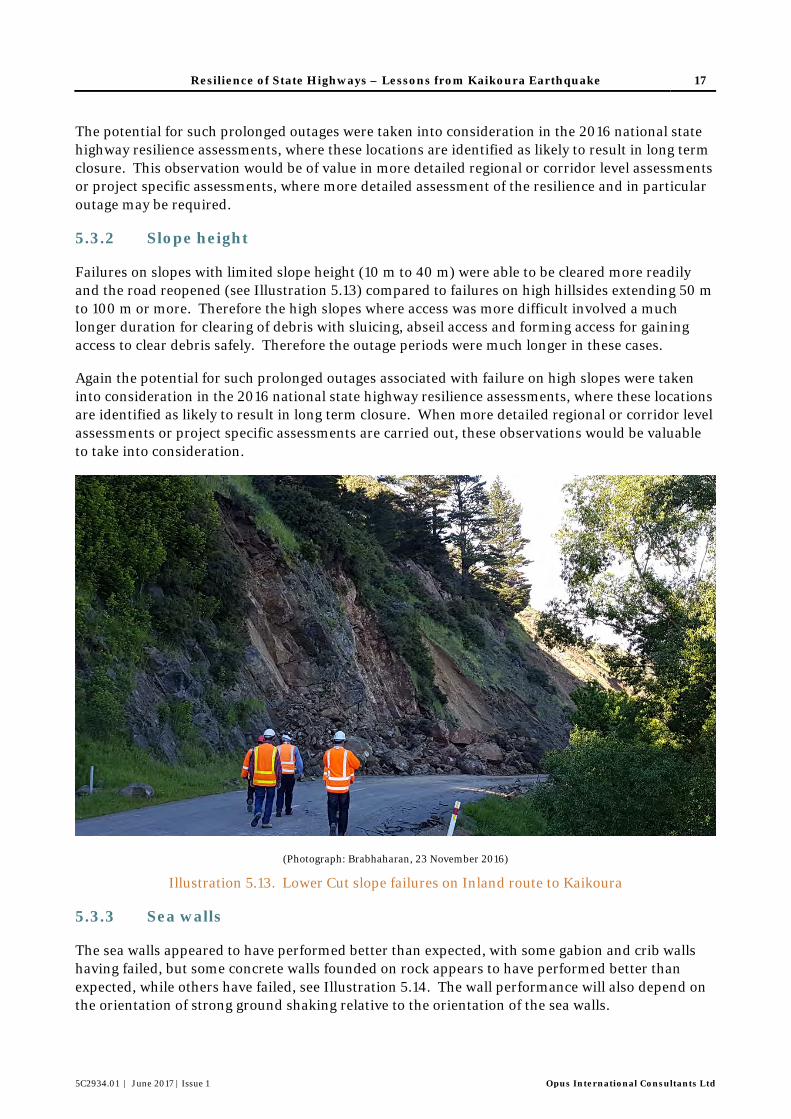
Failures on slopes with limited slope height (10 m to 40 m) were able to be cleared more readily and the road reopened (see Illustration 5.13) compared to failures on high hillsides extending 50 m to 100 m or more. Therefore the high slopes where access was more difficult involved a much longer duration for clearing of debris with sluicing, abseil access and forming access for gaining access to clear debris safely. Therefore the outage periods were much longer in these cases.
Again the potential for such prolonged outages associated with failure on high slopes were taken into consideration in the 2016 national state highway resilience assessments, where these locations are identified as likely to result in long term closure. When more detailed regional or corridor level assessments or project specific assessments are carried out, these observations would be valuable to take into consideration.
(Photograph: Brabhaharan, 23 November 2016)
Illustration 5.13. Lower Cut slope failures on Inland route to Kaikoura
5.3.3 Sea walls
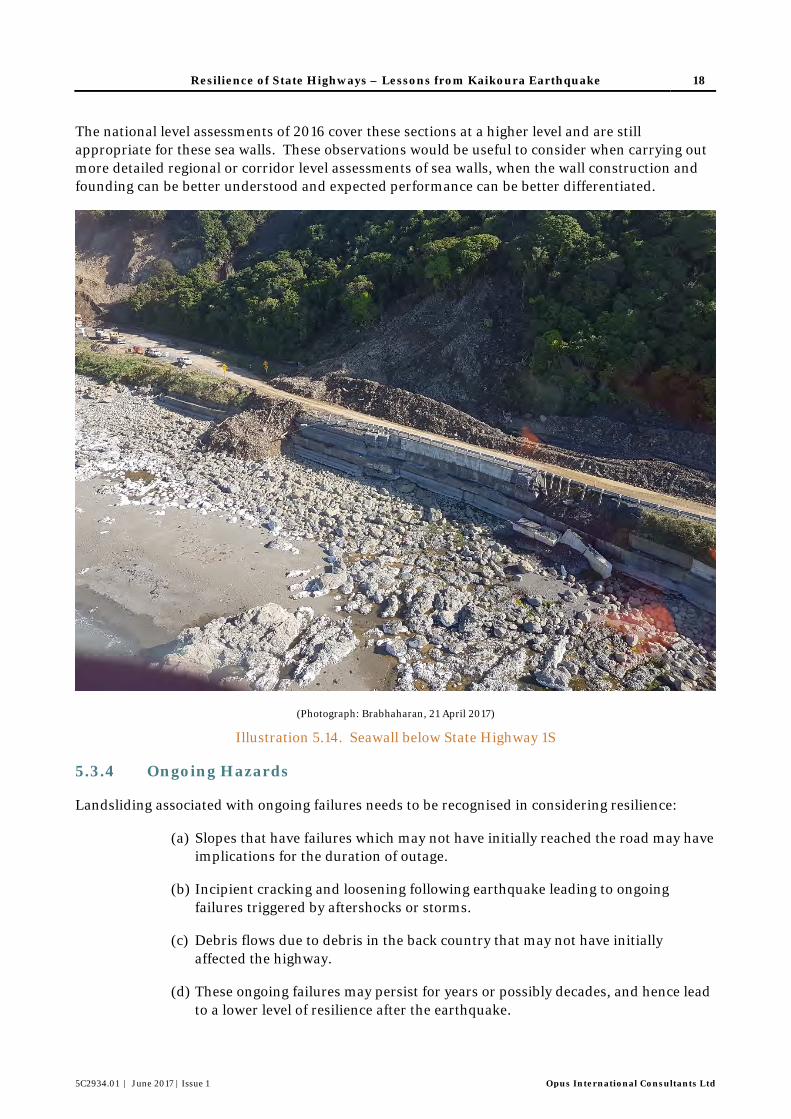
The sea walls appeared to have performed better than expected, with some gabion and crib walls having failed, but some concrete walls founded on rock appears to have performed better than expected, while others have failed, see Illustration 5.14. The wall performance will also depend on the orientation of strong ground shaking relative to the orientation of the sea walls.
Resilience of State Highways – Lessons from Kaikoura Earthquake 18
5C2934.01 | June 2017 | Issue 1 Opus International Consultants Ltd
The national level assessments of 2016 cover these sections at a higher level and are still appropriate for these sea walls. These observations would be useful to consider when carrying out more detailed regional or corridor level assessments of sea walls, when the wall construction and founding can be better understood and expected performance can be better differentiated.
(Photograph: Brabhaharan, 21 April 2017)
Illustration 5.14. Seawall below State Highway 1S
5.3.4 Ongoing Hazards
Landsliding associated with ongoing failures needs to be recognised in considering resilience:
(a) Slopes that have failures which may not have initially reached the road may have implications for the duration of outage.
(b) Incipient cracking and loosening following earthquake leading to ongoing failures triggered by aftershocks or storms.
(c) Debris flows due to debris in the back country that may not have initially affected the highway.
(d) These ongoing failures may persist for years or possibly decades, and hence lead to a lower level of resilience after the earthquake.
Resilience of State Highways – Lessons from Kaikoura Earthquake 19
5C2934.01 | June 2017 | Issue 1 Opus International Consultants Ltd
Deferred Impact from Slope Failures
The items (a) and (b) above refer to slope cracking or failures that are caused by the earthquake, but the landslides don’t fully impact on the highway below immediately after the earthquake. These failures are further mobilised by storm events or after-shocks.
In the 2016 national resilience assessments, such section would have been identified as being subject to closure together with adjacent sections where slope failures actually occurred immediately in an earthquake event. This is appropriate as some sections get affected immediately and some later. The resilience impact on the overall length of highway is similar.
Debris Flows
The potential for debris flows in storm events were identified in the 2016 national resilience study, under storm impact, and therefore these resilience effects are covered. Observations following the Kaikoura earthquake reinforce this, and show that earthquake induced landslides and loosening of hillsides in the earthquake can increase the debris load available in catchments, and therefore increase the likelihood and frequency of debris flows in these catchments for many years after the earthquake.
Ongoing Impacts
The potential for follow on effects such as landslides and debris flows in storms following earthquakes have not been specifically identified in the national resilience assessments. This is because the assessments have been on the basis of the impact from each hazard separately. It would be prudent to ensure that we are cognisant of the potential for reduced resilience in storms after major earthquakes. And that this enhanced hazard can persist for many years or decades.
Resilience of State Highways – Lessons from Kaikoura Earthquake 20
5C2934.01 | June 2017 | Issue 1 Opus International Consultants Ltd
6 Mapping of Resilience
6.1 2016 National State Highway Resilience Study
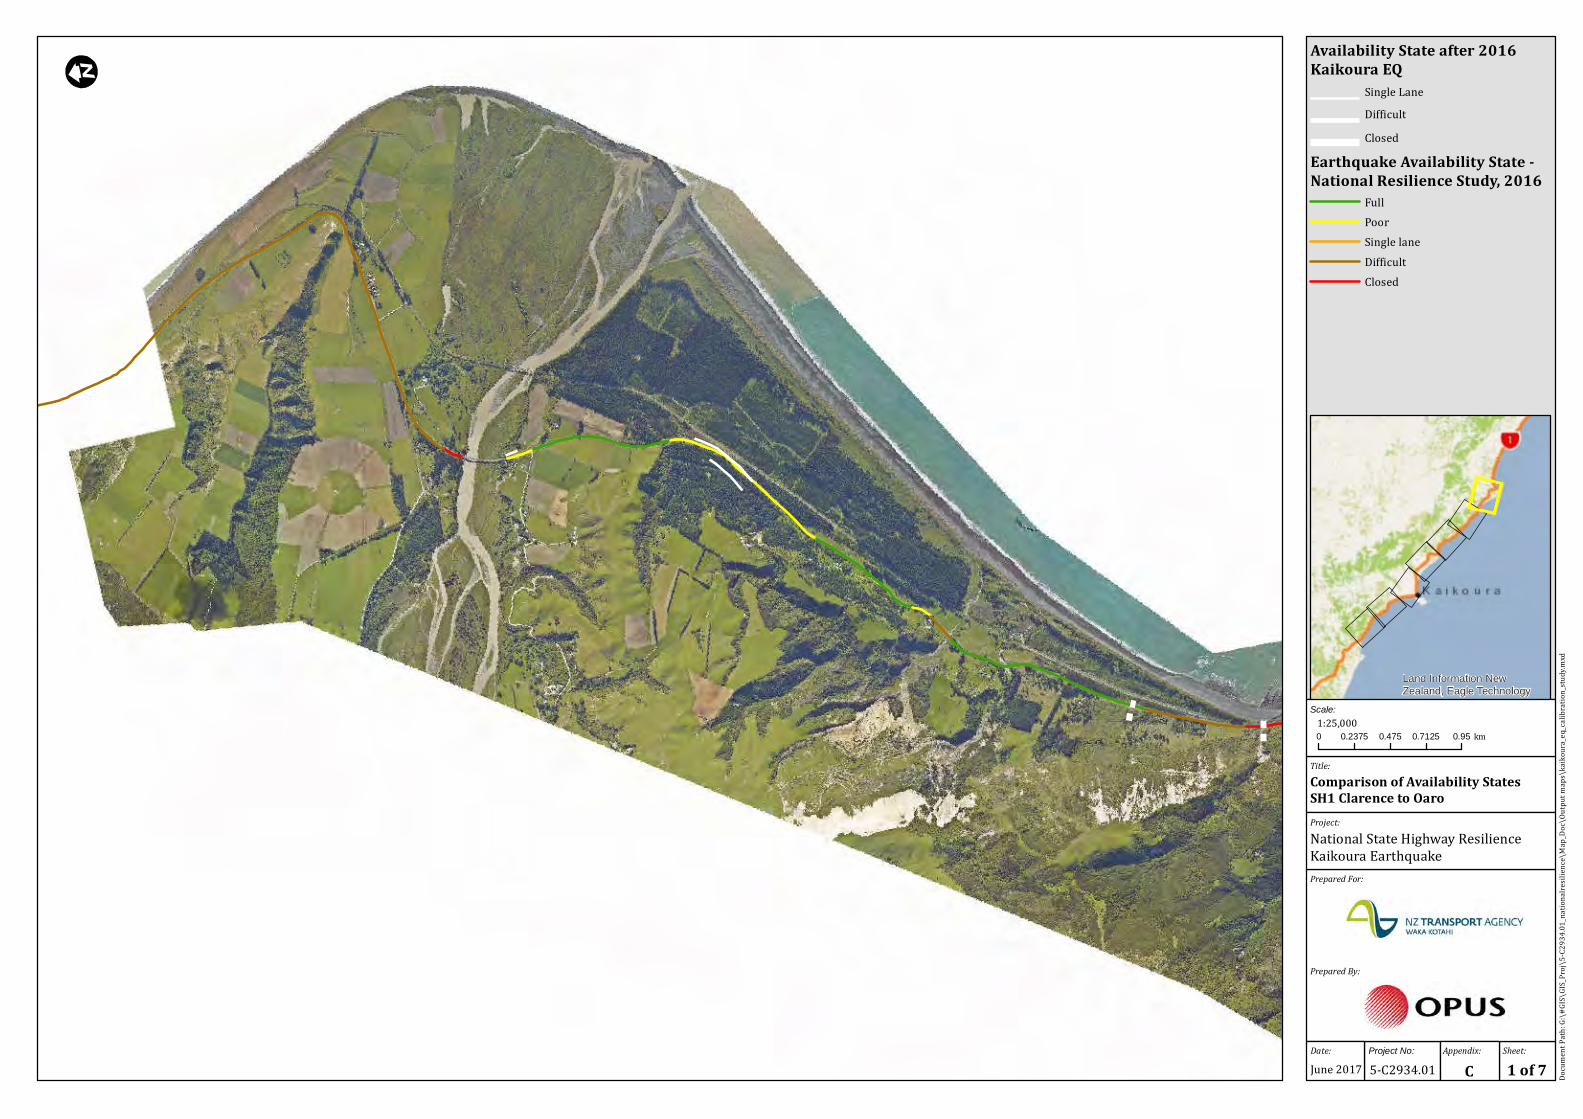
The 2016 national resilience study was completed in December 2016, largely before the Kaikoura earthquake. The resilience of the Kaikoura section of SH 1S was also mapped as part of that study, well before the Kaikoura earthquake of 14 November 2016.
The resilience was mapped in a nominal major 1,000 year return period earthquake as part of the national state highway resilience study (Opus, 2016). This was mapped as availability and outage states, and a combined disruption state.
The resilience metrics are presented in Appendix A, and the resilience maps are presented in Appendix C.
6.2 Updated 2001 Resilience Study
The resilience of the Kaikoura section of State Highway 1S was mapped as part of the 2000-2001 research into resilience (Brabhaharan et al, 2001). This study covered the section of SH1 from Ward to Hundalee. Although the resilience metrics used at that time were different, and the resilience approach using the metrics of availability, outage and disruption states wasn’t developed till later (Brabhaharan et al, 2006), the basic characterisation approach for the road network was broadly similar. Therefore this enabled the resilience assessment to be updated to reflect the metrics used in the national state highway resilience study (Brabhaharan and Mason, 2016).
The 2001 corridor level resilience study was also calibrated against the observations of resilience after the Kaikoura earthquake, as that was carried out at a more detailed level than the broader national level study in 2016 and allowed comparison between the expected performance and the actual damage from the Kaikoura earthquake in discrete sections.
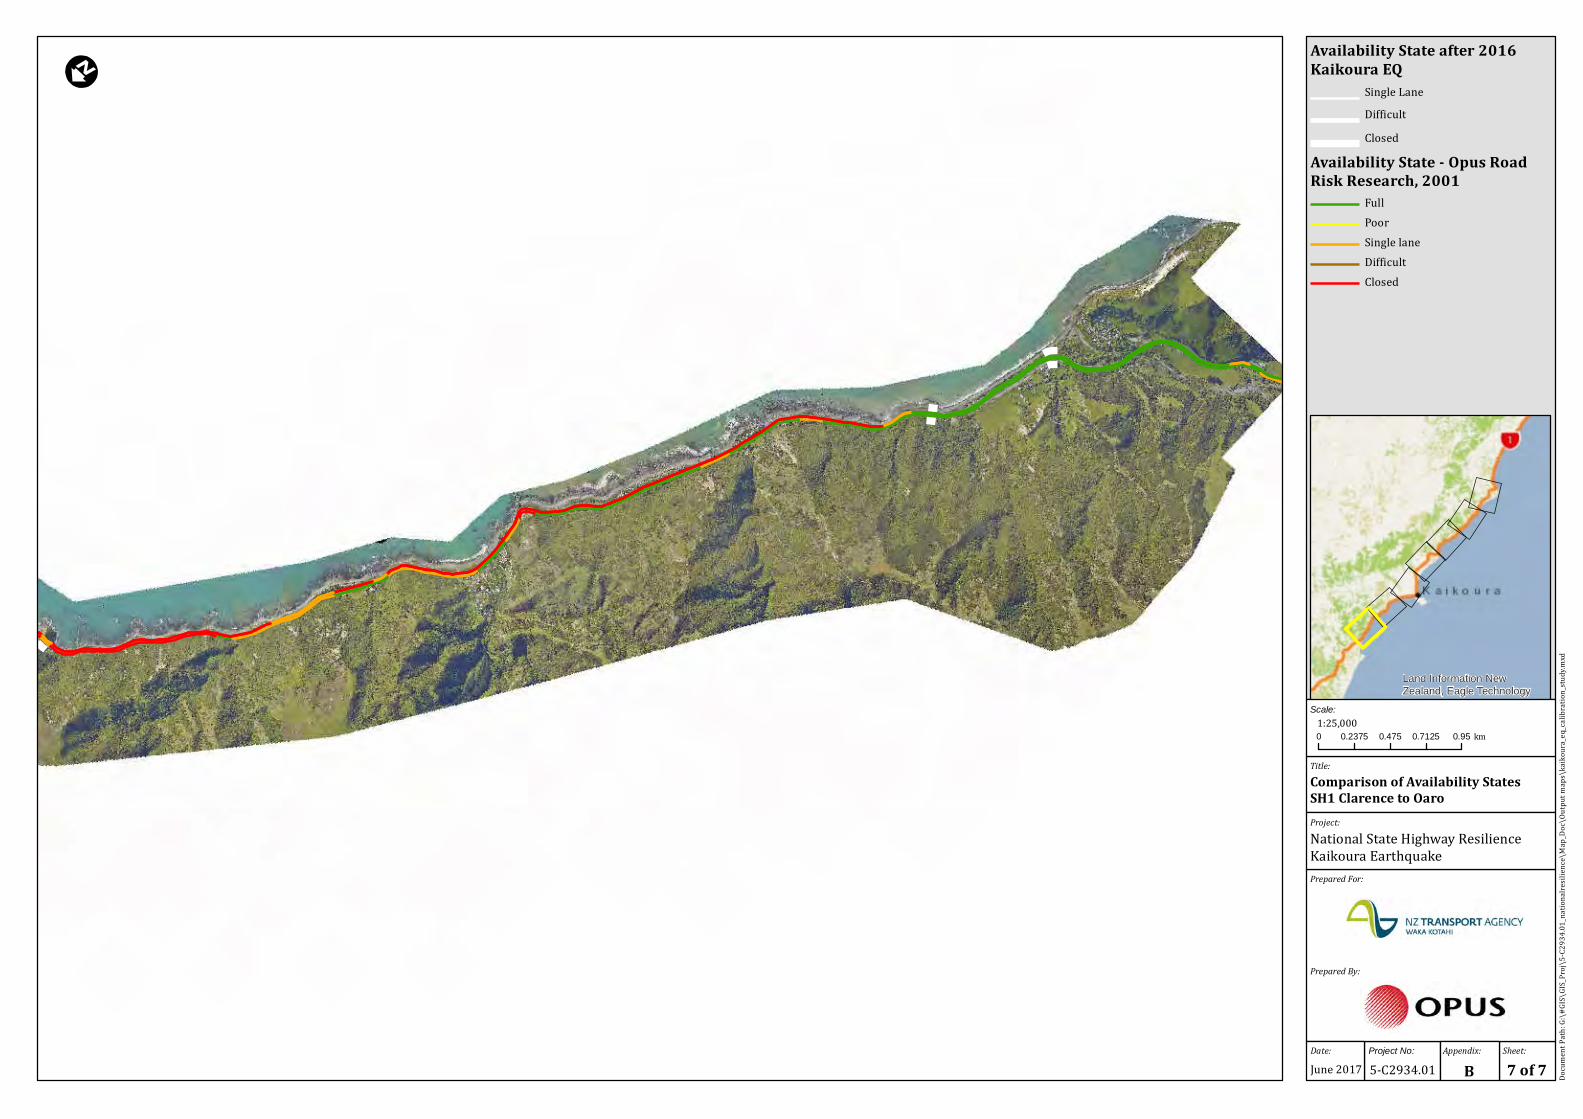
The updated resilience metrics are presented in Appendix A, and the resilience maps are presented in Appendix B. The mapping of the resilience was carried out for both sides of the road, as these have vastly different forms and hence resilience, and both sides are presented in the maps.
6.3 Mapping of the Performance in the Kaikoura Earthquake
The performance of the Kaikoura section of SH1S was mapped using LiDAR photography maps and the observations during the post-earthquake response in November 2016 and the recent site reconnaissance in April 2017. These were mapped separately for both sides of the highway.
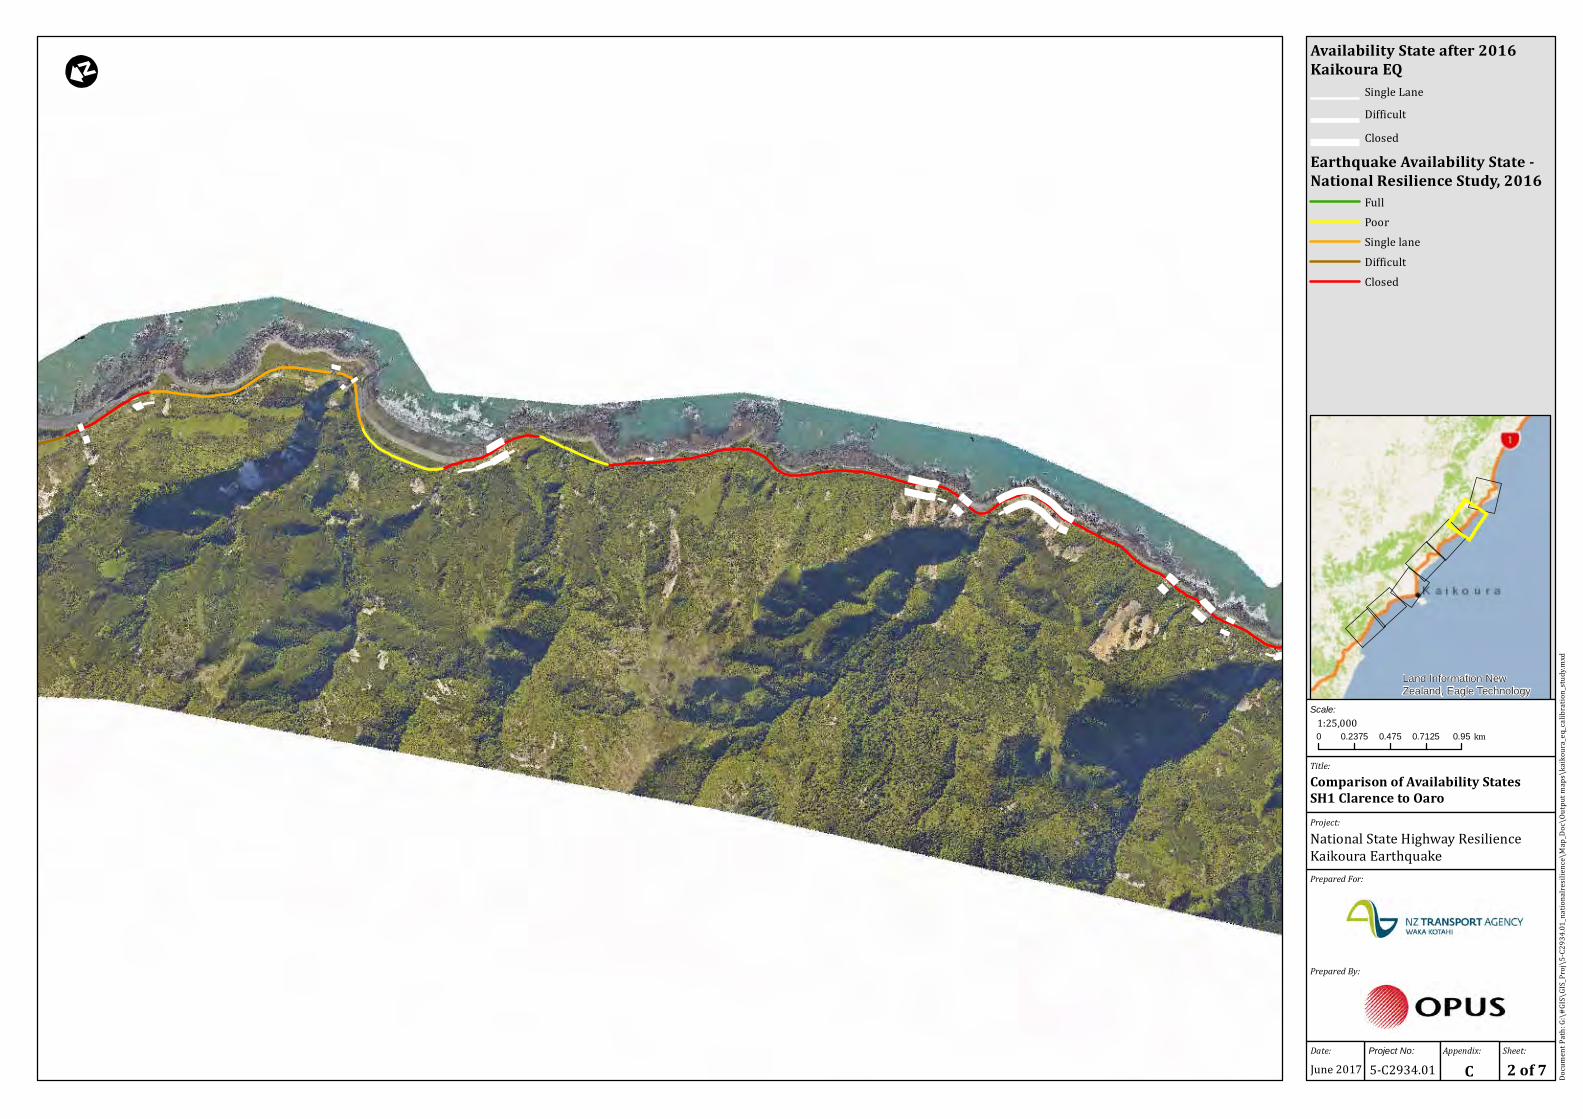
The availability of the highway has been mapped using the same availability state metric used for the resilience assessment, but for clarity of presentation the more critical single lane, difficult and closed states are shown, and the full and poor access are not shown.
The availability state performance is shown on the same maps as the resilience assessment in 2016, for ease of comparison and is presented in Appendix C. These show the observed performance from hazards on both sides of the highway. The availability state maps from the Kaikoura earthquake are also shown on the same maps as the 2001 research study in Appendix B, to enable comparison with that more detailed corridor level assessment.
Resilience of State Highways – Lessons from Kaikoura Earthquake 21
5C2934.01 | June 2017 | Issue 1 Opus International Consultants Ltd
6.4 Outage
The outage states of individual sites are more difficult to ascertain and not possible to map at the current stage of the earthquake recovery. The outage of each site depends on the ability or time to reach that site, which depends on restoring access through other failure sites. This is also limited by plant and equipment availability, helicopter sluicing and abseil scaling. This will be the reality of outage in long, constrained access routes, such as along the Kaikoura coast, and is important to note for emergency response planning in areas with roads through similar terrain.
It would be more reasonable to look at cumulative outage periods for stretches of road.
Considering cumulative outage:
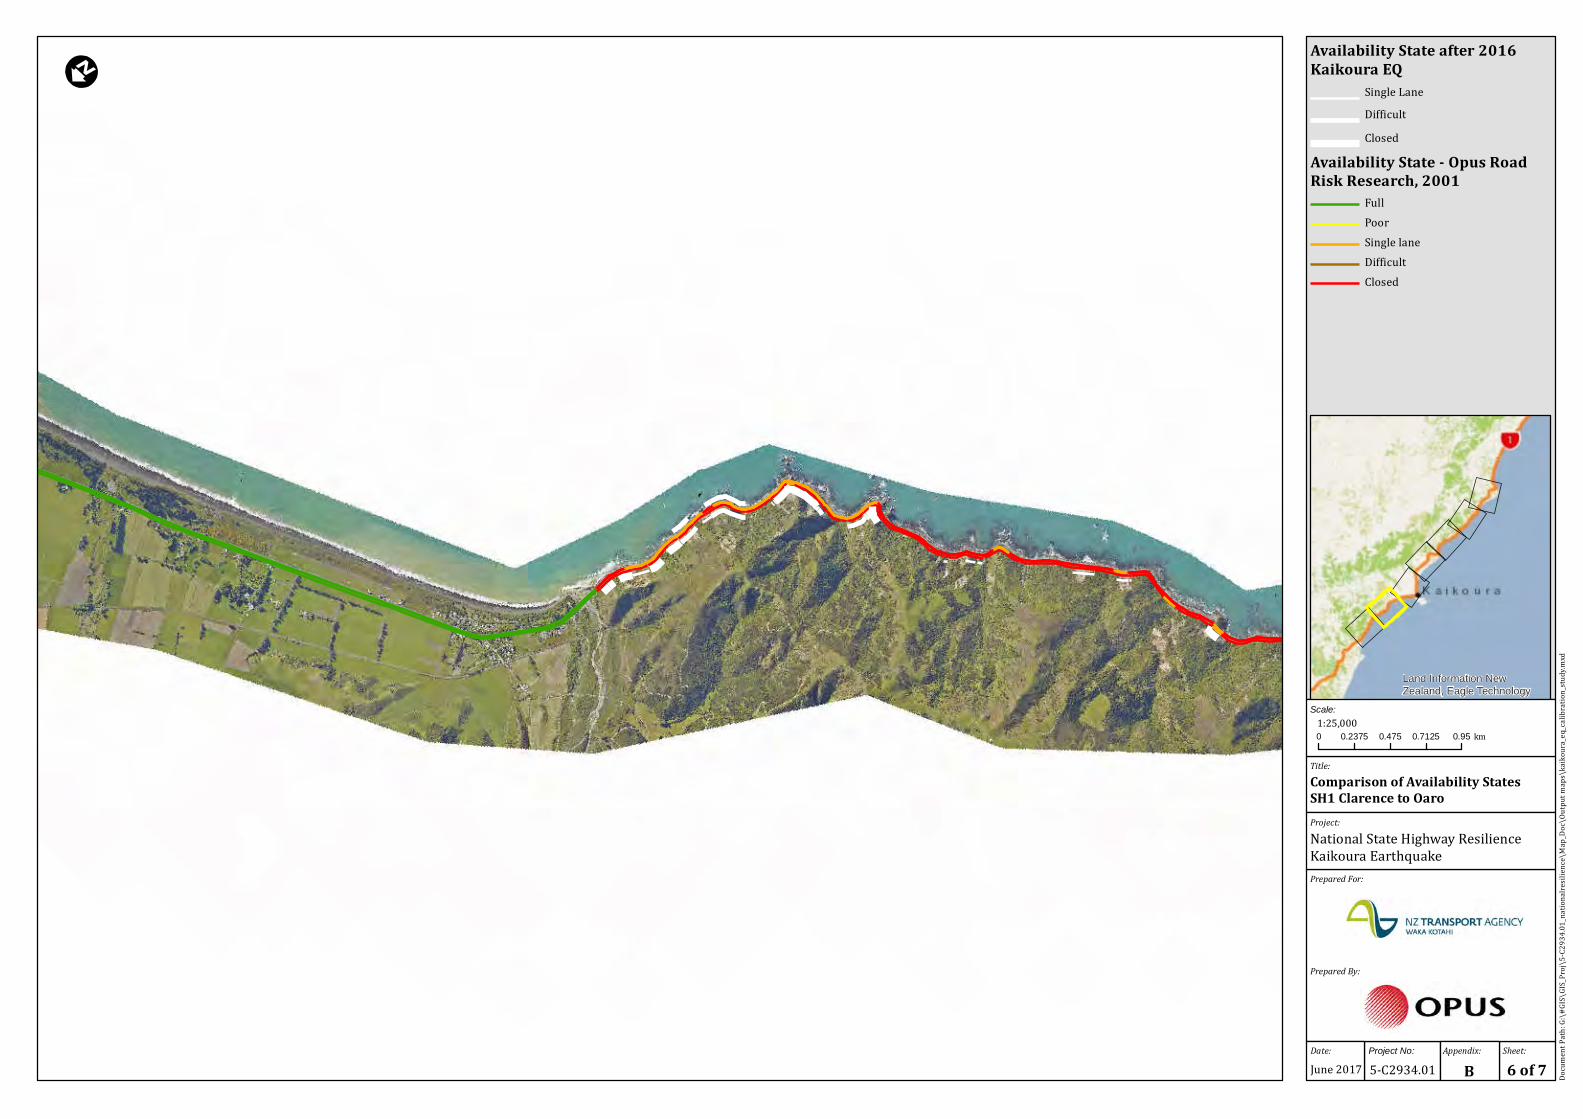
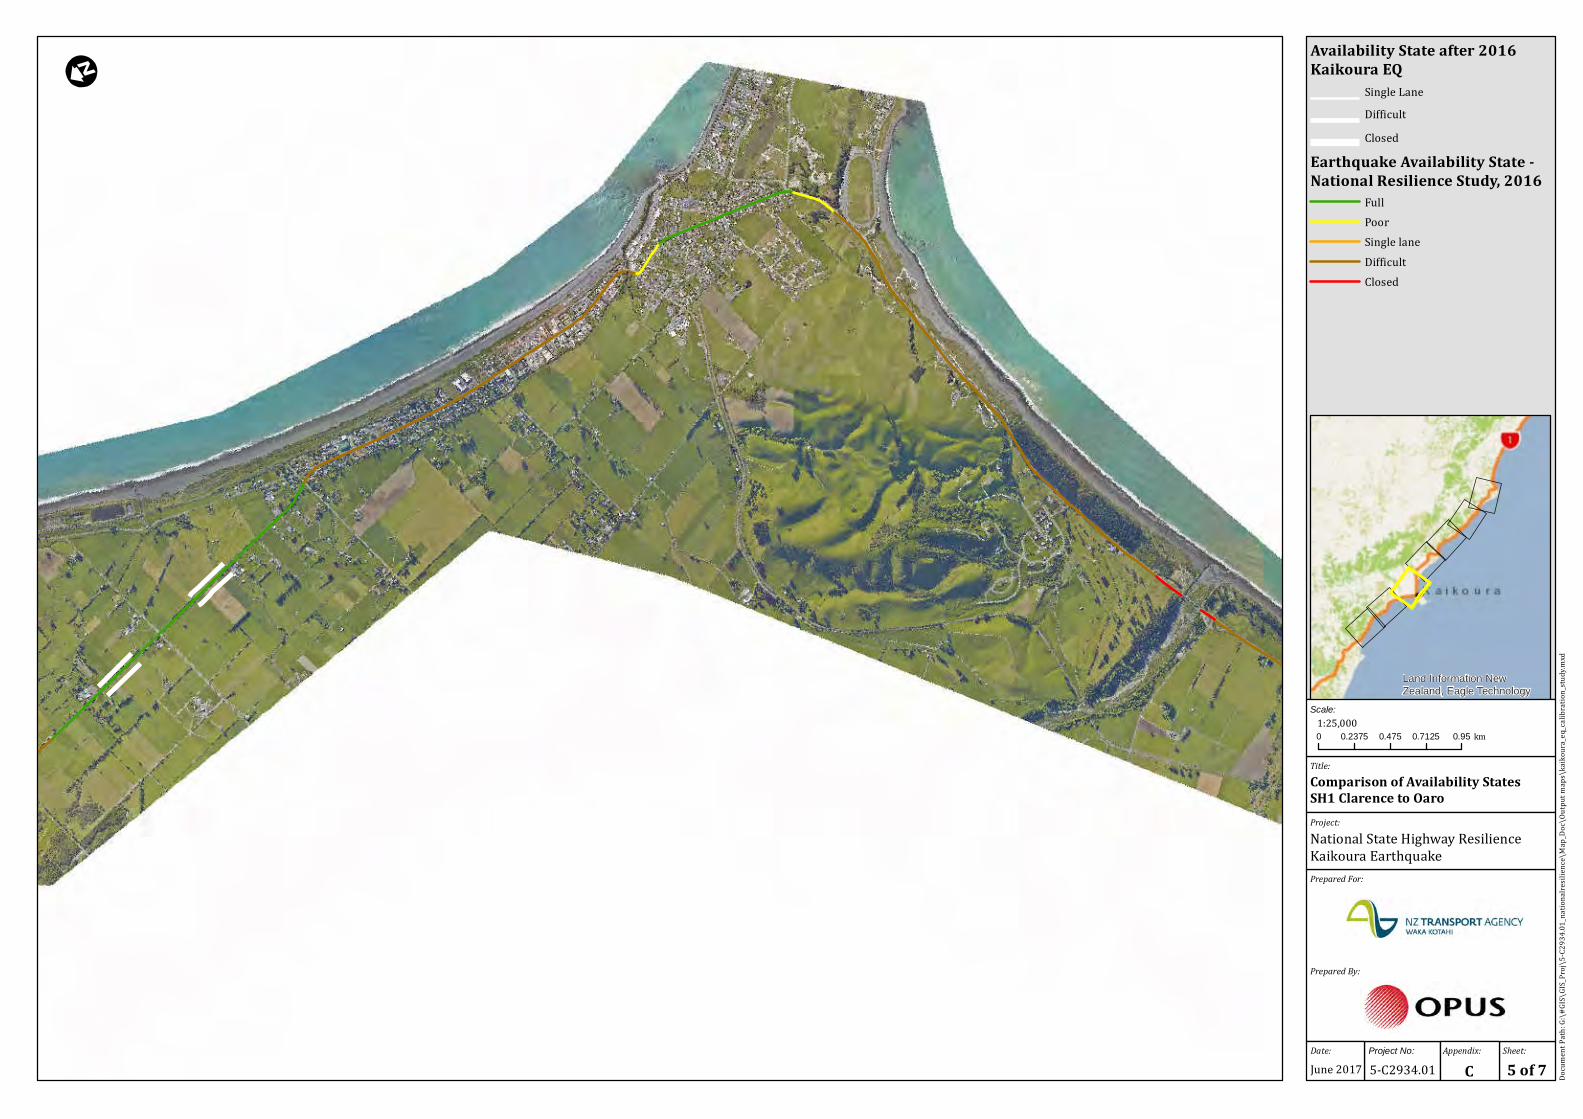
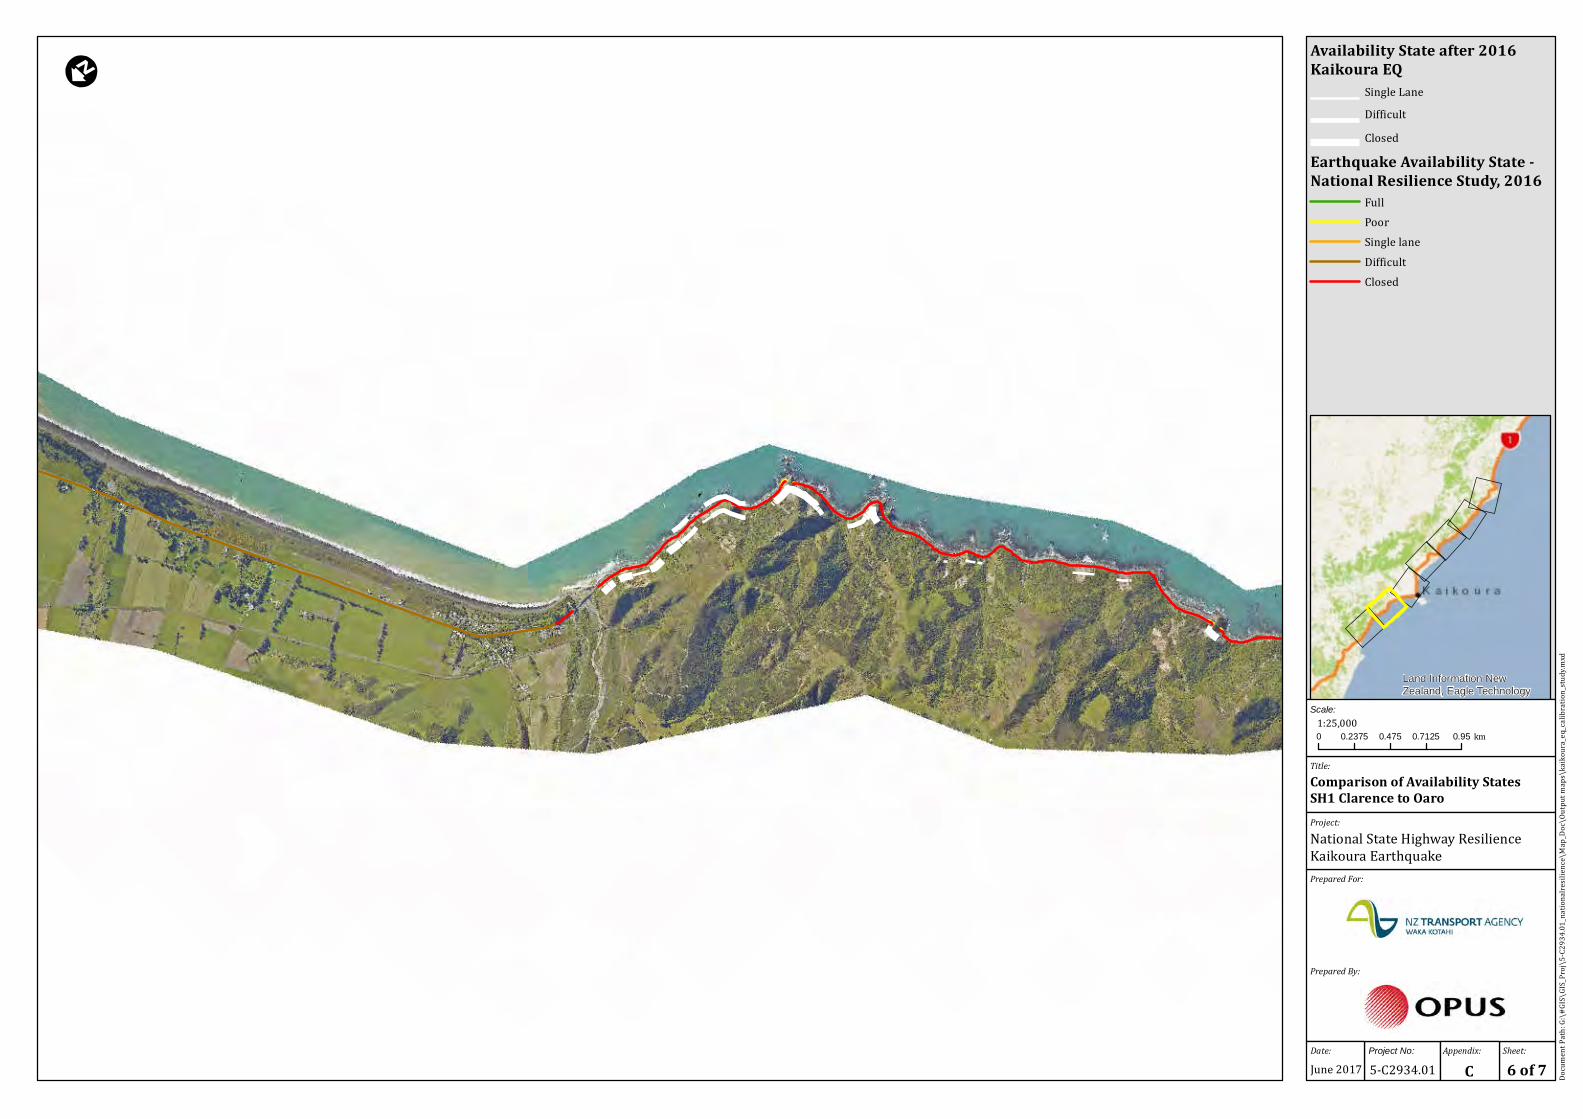
1) Time taken to reopen the southern access into Kaikoura from Oaro was about six weeks, with access being restored from the south. This access is also limited to single lane access with ongoing rock fall and landslide risks, and therefore the pre-earthquake level of availability has not been restored for the whole section. The slip near Rosy Morn closed the southern section between Oaro and Kaikoura in mid-April 2017 and remains closed at the time of writing. So although some access was opened after the event in six weeks, full access is yet to be restored almost six months after the event.
2) The section north of Kaikoura has not been able to be opened yet after more than six months after the earthquake. Construction of temporary access through this section has not been achieved due to the long time required for sluicing and scaling of large landslides at the tops of high (300 m +) hillslopes, and recovery has also been hampered by ongoing instability from storms and debris flows.
Resilience of State Highways – Lessons from Kaikoura Earthquake 22
5C2934.01 | June 2017 | Issue 1 Opus International Consultants Ltd
7 Gap Analyses
7.1 Comparison of Earthquake Shaking
The 2016 National resilience study was carried out for a nominal 1,000 year return period earthquake ground shaking. As discussed in Section 4.1, the return period of shaking in the Kaikoura earthquake on 14 November 2016 at any one location will vary, as the ground shaking was less in some areas along the Kaikoura Coast (MM VII) and larger in other areas (MM IX at Ohau Point), see Illustration 4.3. Therefore the return period of shaking in the Kaikoura earthquake is likely to be smaller or comparable in some locations and larger in some areas along the general Kaikoura section of SH1S than the 1,000 year return period ground shaking used in the 2016 National resilience study.
7.2 Comparison of Availability State
7.2.1 2016 National Resilience Study
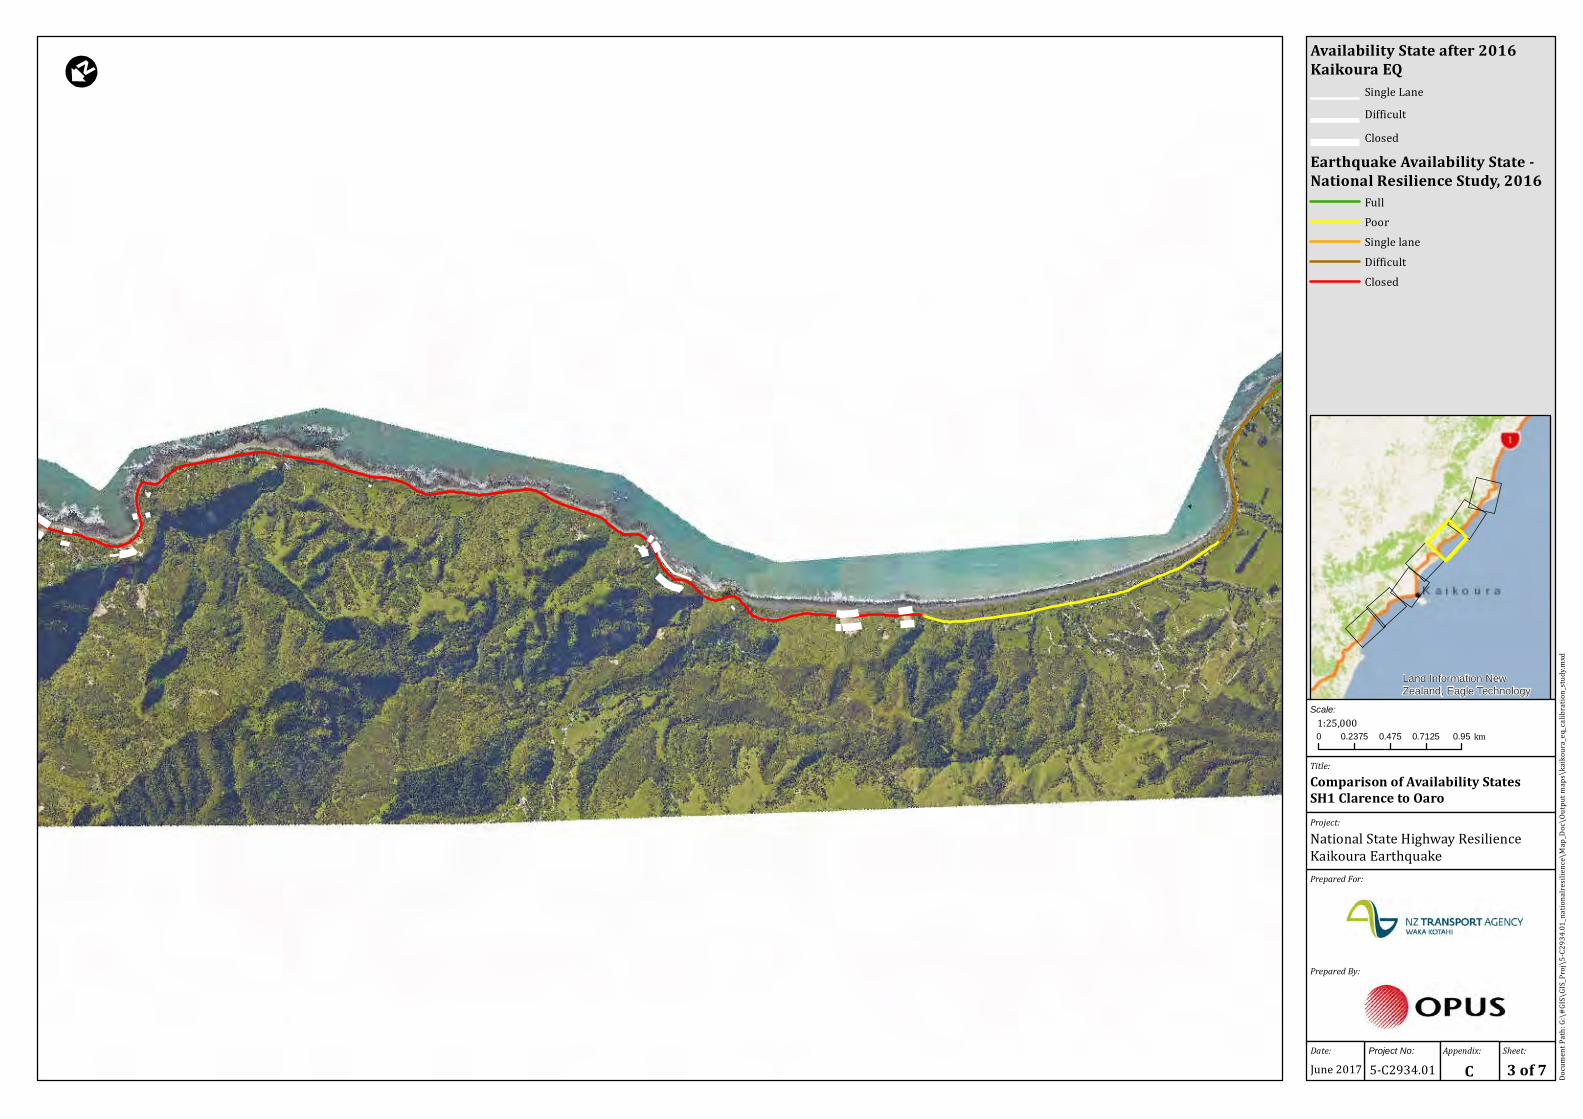
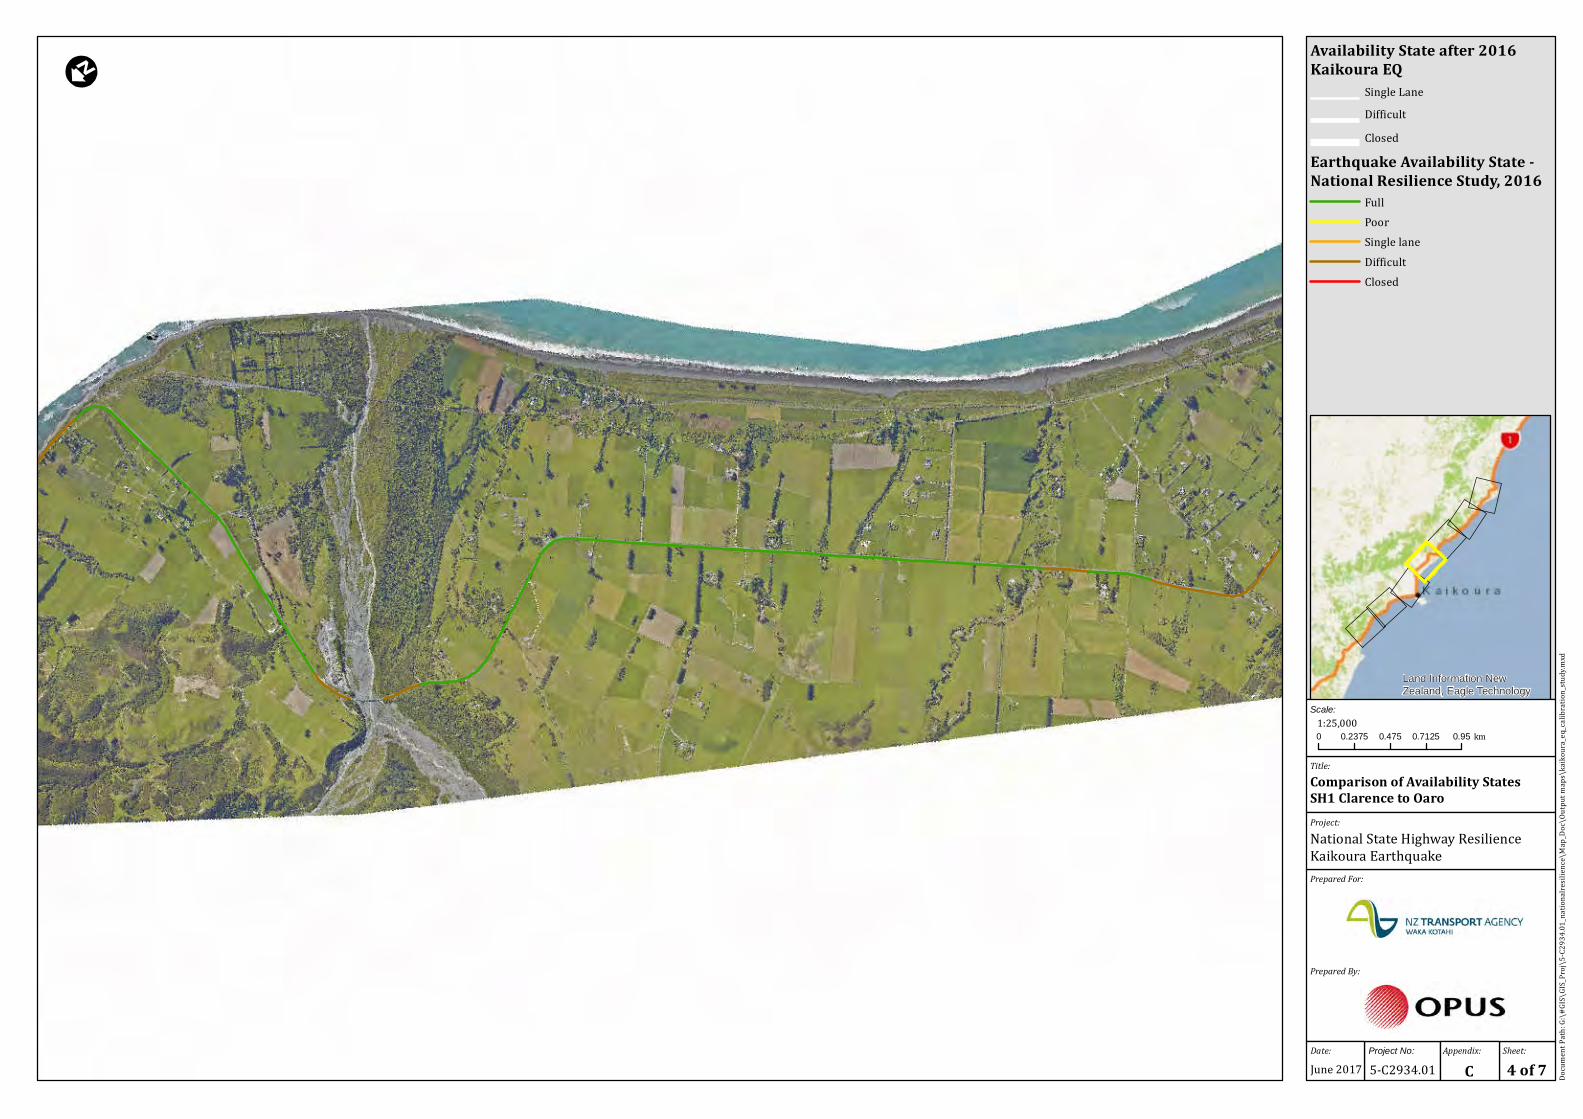
The national resilience study at a high level assessed the availability state of the road to be closed due to the vulnerability of the high steep hillsides along large coastal sections both south and north of Kaikoura Township, see Appendix C. In the Kaikoura earthquake, these sections of highway were closed due to landslides, rock fall and in cases sea wall failures. Not all sections of the vulnerable hillslopes identified in the 2016 study failed. For example, north of Oaro there were less landslides in the Kaikoura earthquake than predicted in the resilience study, but this is consistent with the lower ground shaking of MM VII in this area indicated in Illustration 4.3 from GNS Science. This is also consistent with the objectives of the resilience study to show the potential resilience issues at a broad level. Some of these sections that did not fail, could also have been loosened by the earthquake, or have slope failures that have not reached the highway, and could fail in subsequent storm events, as observed in some areas during Cyclone Debbie and Cyclone Cook in April 2017.
Long sections of the highway both north and south of Kaikoura were predicted to be affected by liquefaction, but were predicted to not close the highway. Only short sections were affected by liquefaction, and this is understandable because there had been no liquefaction hazard study carried out for the area. Such refinements may be possible if local area liquefaction studies are carried out. The national resilience study was conservative in this instance, but correctly predicted that the highway would not be closed due to liquefaction.
Overall, the national resilience study predicted the outcome of a large earthquake to close the highway both north and south of Kaikoura and this has been validated by the 2016 Kaikoura earthquake.
7.2.2 2001 Road Network Research Study
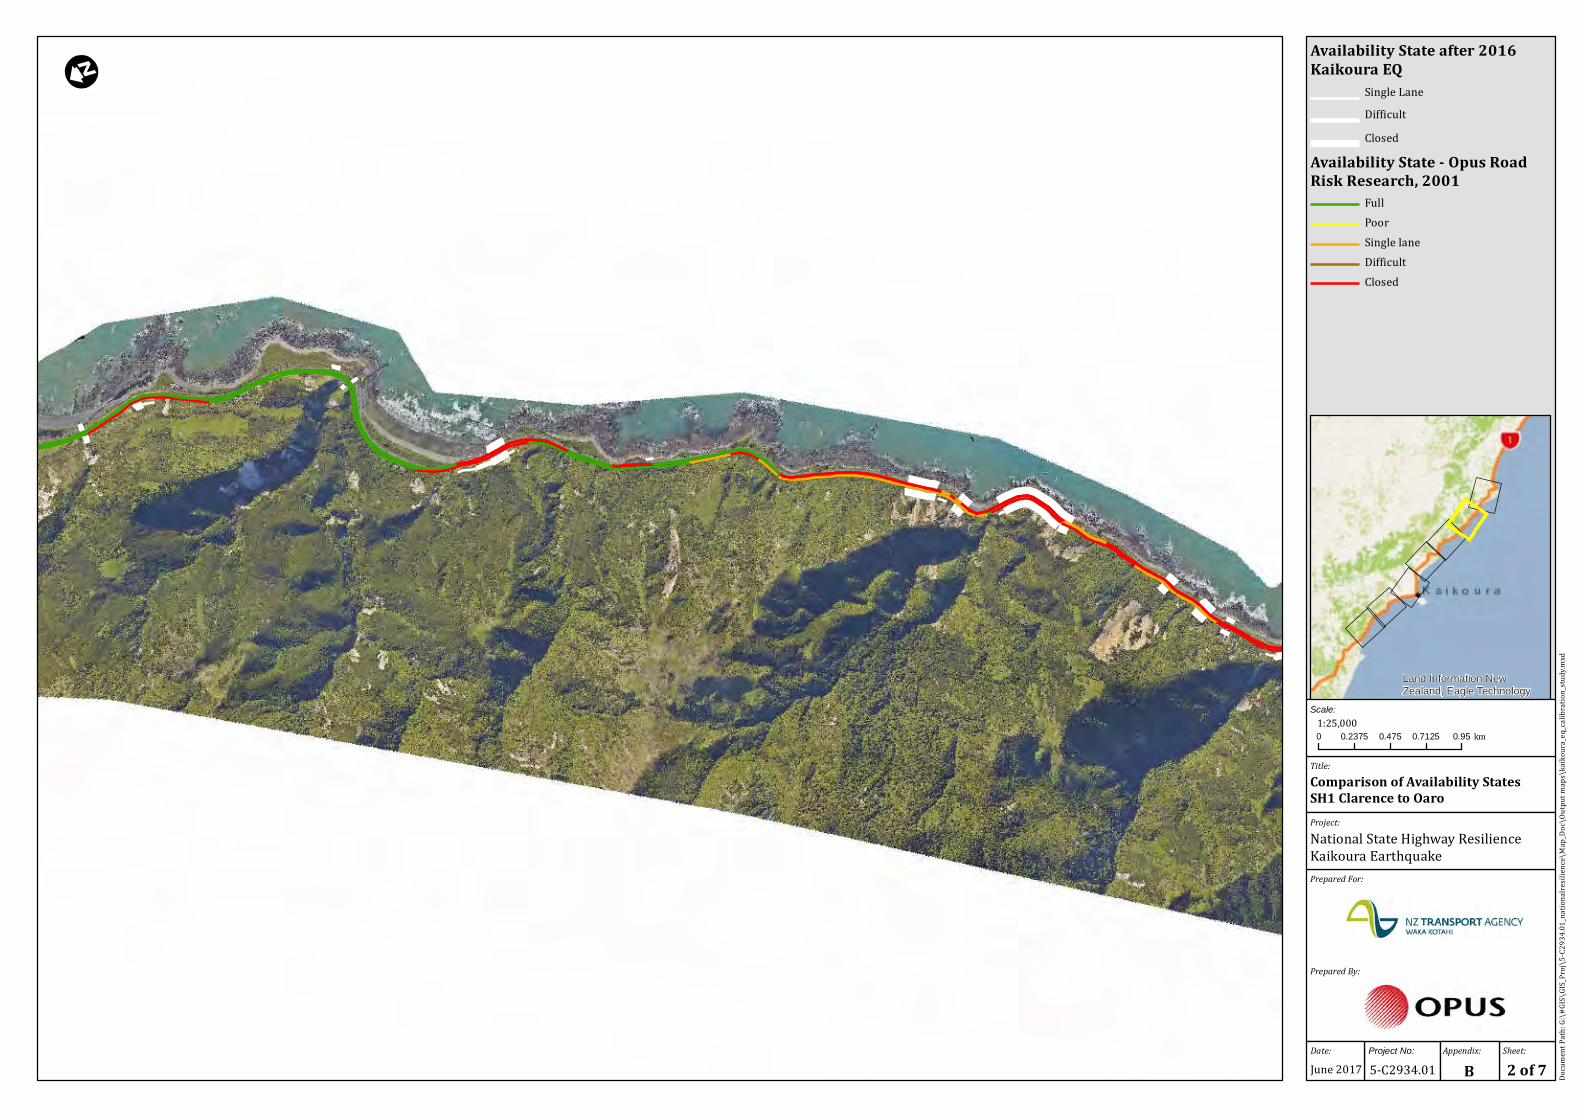
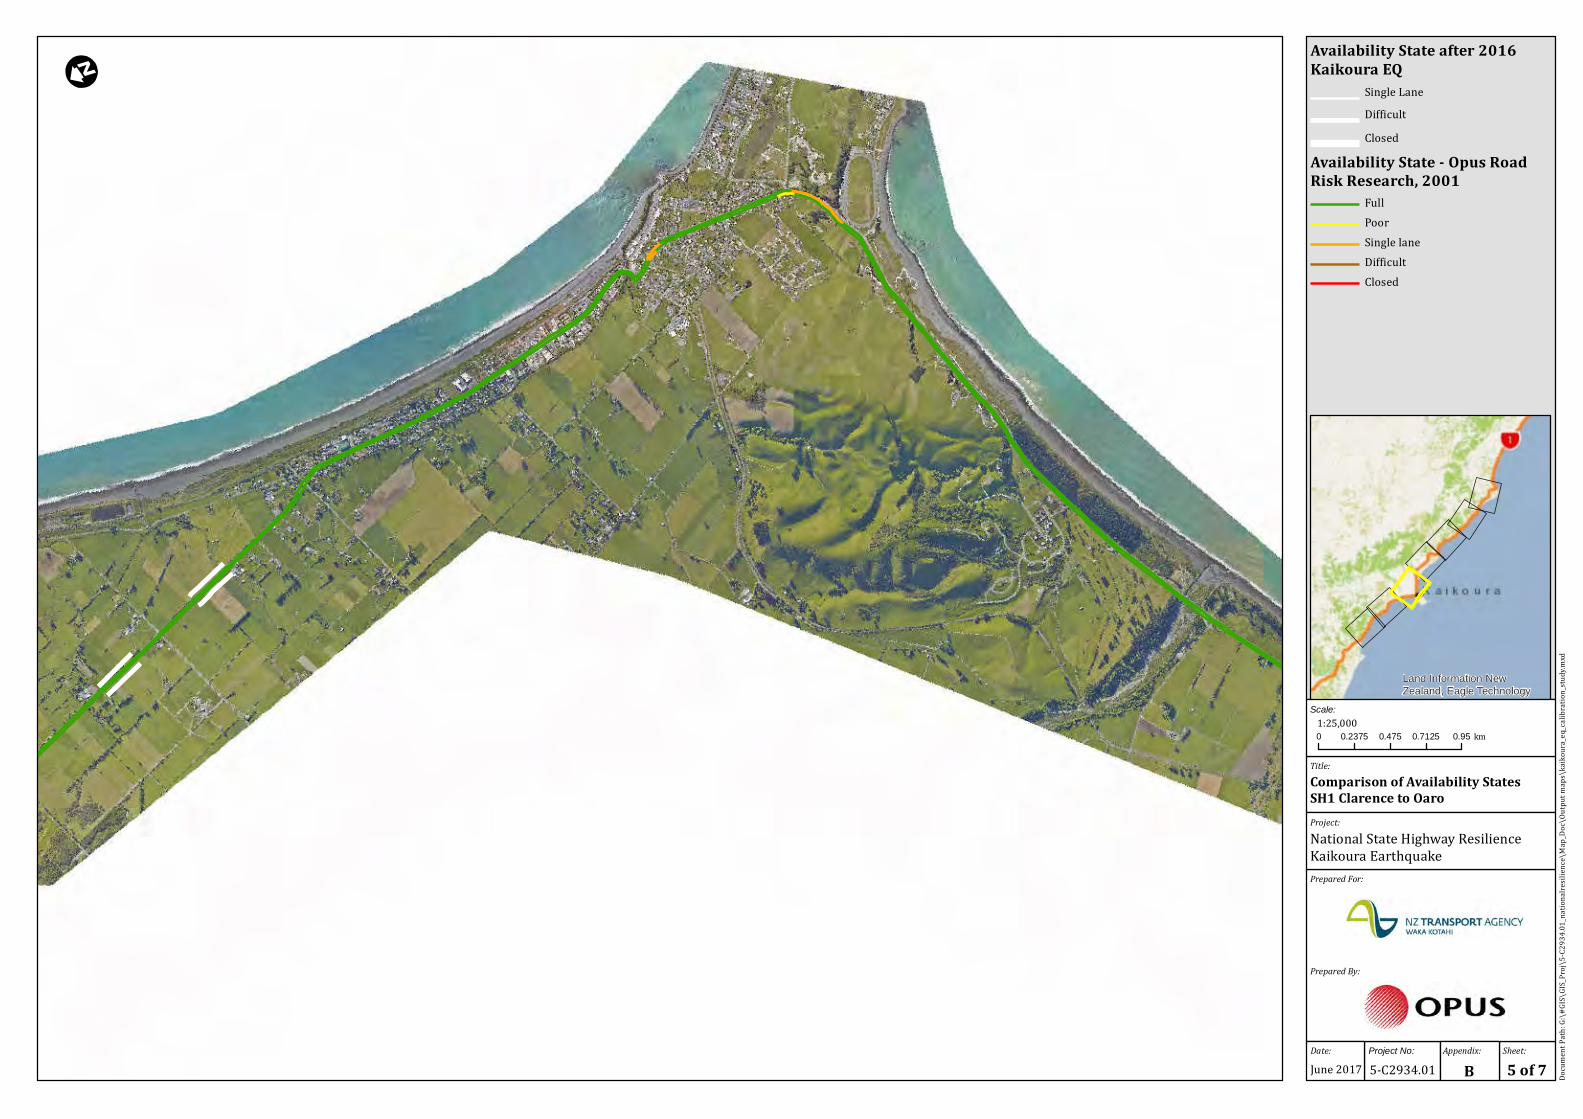
The availability state assessed in the 2001 study was compared with the actual performance of the state highway in the Kaikoura Earthquake and the resultant availability state. The availability states assessed from the 2001 study were also assessed for a similar nominal 1,000 year return period earthquake ground shaking as the 2016 national resilience study. These are shown side-by-side on the maps presented in Appendix B.

Resilience of State Highways – Lessons from Kaikoura Earthquake 23
5C2934.01 | June 2017 | Issue 1 Opus International Consultants Ltd
The following observations are made from this review:
1) Generally the observed availability state ties in with that assessed based on the 2001 study, although not every section assessed as single lane, difficult or closed correlated with the performance in this particular earthquake event.
2) In long sections assessed as being vulnerable to closure or reduction to single lane, the full length has predictably not failed. Failure of the full section would not be expected in any one event.
3) Some sections identified as being vulnerable to closure did not get closed in this particular event. Although in some areas, there is slope instability above the road, and the debris may in due course reach the road and reduce the availability. And also as noted in Section 7.2.1 above, the ground shaking in the Kaikoura earthquake varied along the coastal section of SH1S, and in some areas the shaking was lesser than the nominal 1,000 year ground shaking assumed in the 2001 study.
4) There are a few small sections of highway that were reduced to single lane or were closed, where this was not predicted by the 2001 resilience study, and these are due to a greater run out from landslides and debris flows from gullies that were not recognised in the 2001 study. The debris flows following earthquakes are more recognised after learnings from the 2008 Wenchuan earthquake in China (Yu et al 2009) and the 2016 Kumamoto earthquake in Japan (Chiaro et al 2017), and this has been reinforced by the observations in the 2016 Kaikoura earthquake.
5) Lesser extents of state highway were assessed to be prone to liquefaction from this more detailed corridor level study of 2001, and this was consistent with the observations in the Kaikoura earthquake.
6) A lower extent of seawalls failed and led to lane closure in the Kaikoura earthquake than predicted from the 2001 study and this appears to reflect the lesser shaking along some areas of the state highway, better foundation conditions and probably the direction of shaking compared to the orientation of the walls.
7) Overall the route was closed over most of the coastal sections of the highway, as predicted in the 2001 resilience study as well as the 2016 national state highway resilience study.
7.3 Comparison of Outage
The outage state was not assessed in the 2001 study, but the outage expected based on the recent National Resilience study (Mason and Brabhaharan, 2016), see Appendix C, has been compared to the current outage following the Kaikoura earthquake.
The following observations are made from this review:
1) The 2016 national state highway resilience study predicted long to very long term closure (2 to 6 months or more) following a large earthquake along the Kaikoura coast. The section of SH1S south of Kaikoura was opened to limited one lane access after six weeks, but has again been closed due to landslides following the storms in April 2017. So full access is yet to be restored after some six months after the November 2016 earthquake.
Resilience of State Highways – Lessons from Kaikoura Earthquake 24
5C2934.01 | June 2017 | Issue 1 Opus International Consultants Ltd
2) The SH1S section north of Kaikoura along the coast is yet to be opened even for limited single lane access more than 6 months after the earthquake event. It may take many more months to reopen this section of state highway. The current prediction is to have the highway open by December 2017, giving a predicted outage period of 12-13 months.
3) The Outage state is more useful to consider holistically along sections of corridor, rather than at each individual location, as clearance at any individual section does not provide access.
4) Also access to clear and restore a site depends to access being available to that site after clearance of other sites along the way, when in a large event multiple failures occur.
5) Records obtained from Opus staff involved in clearance indicate that the time taken to clear small landslides has taken a few days to a few weeks for larger landslides south of Kaikoura. This has included reconnaissance, developing a plan, sluicing and abseil scaling to remove safety hazards followed by earthmoving. Larger landslides are taking many months to clear to restore access.
6) The seawalls are yet to be repaired where these have failed and therefore confirms the assessment that these structures take a long time to investigate, design and repair.
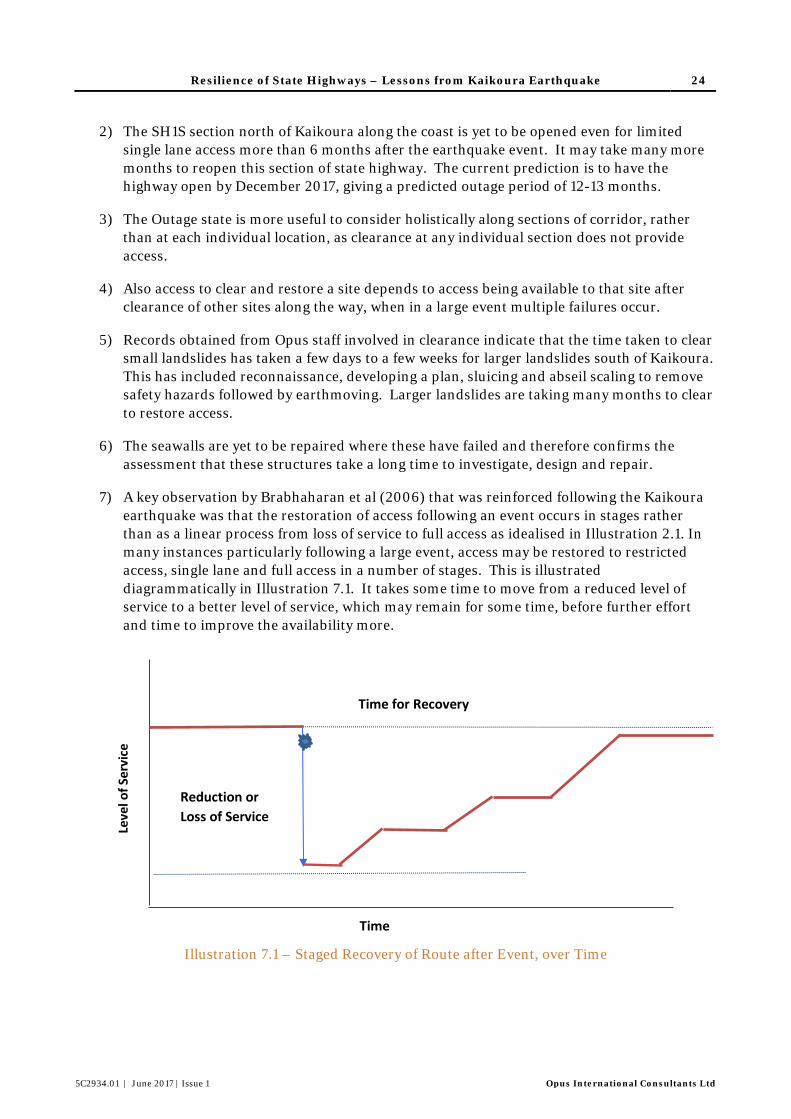
7) A key observation by Brabhaharan et al (2006) that was reinforced following the Kaikoura earthquake was that the restoration of access following an event occurs in stages rather than as a linear process from loss of service to full access as idealised in Illustration 2.1. In many instances particularly following a large event, access may be restored to restricted access, single lane and full access in a number of stages. This is illustrated diagrammatically in Illustration 7.1. It takes some time to move from a reduced level of service to a better level of service, which may remain for some time, before further effort and time to improve the availability more.
Illustration 7.1 – Staged Recovery of Route after Event, over Time
Time
Reduction or Loss of Service
Time for Recovery
Leve
l of S
ervi
ce
Resilience of State Highways – Lessons from Kaikoura Earthquake 25
5C2934.01 | June 2017 | Issue 1 Opus International Consultants Ltd
7.4 Post-restoration Level of Service
The level of service after restoration could be lower than the pre-event level of service, because of impairment of the route by the event.
In this instance, the earthquake had loosened the ground and led to cracking of the areas above the slope. These cracked or loosened slope can fail much more easily in storm events after the earthquake compared to the relatively greater stability in storms before the earthquake. In addition, debris from landslides in the back country away from the highway, has led to a greater debris loads available in the gullies and valleys in the back country and these can be mobilised more easily by run-off flows in storm events, as observed in Cyclone Debbie and Cook in April 2017. Such ongoing failures and debris flows can lead to greater vulnerability of poorer resilience of the highway for a long period - years and perhaps decades, after the event.
This was also observed after the Wenchuan earthquake in China (Yu et al, 2009), and early indications from the April 2017 storms confirm that this is likely to be the case along SH1S in Kaikoura. This leads to a lower resilience of the route after an event, and perhaps a lower level of service. Alternatively understanding this may lead to different strategic responses in the recovery. Partially damaged bridges could also contribute to this lower level of service.
The level of service after restoration could also be higher than the pre-event level of service in some instances, where the road is repaired to a higher standard than previously.
Resilience of State Highways – Lessons from Kaikoura Earthquake 26
5C2934.01 | June 2017 | Issue 1 Opus International Consultants Ltd
8 Conclusions
The lessons from the Kaikoura earthquake for resilience assessments for state highways has been considered based on observation of the effects of the earthquake and the progression of recovery, and comparing with the resilience assessments previously made for the Kaikoura coast section of State Highway 1S. The recurrence interval of the Magnitude 7.8 Kaikoura earthquake on 14 November 2016 is likely to have been greater than 1,000 years. The ground shaking in different sections along the Kaikoura section of SH1 in this earthquake are indicated to have been variable from the GNS assessment, with some sections experiencing a lower level of shaking MMVII while others such as Ohau Point experiencing a similar or possibly higher level of ground shaking than the nominal 1,000 year return period ground shaking assumed in the resilience studies.
The following observations and learnings have been drawn from this review:
1) Overall Comparison of Resilience assessments against Kaikoura earthquake performance:
a) The 2016 national state highway resilience study gave a good characterisation of the resilience of the Kaikoura section of SH1S at a national level. It correctly characterised the type of damage likely along the route, the likely availability of the route (that it would be closed after such an earthquake event) and that the outage would be longer than 6 months.
b) The availability states mapped previously are generally consistent with the observed failures, and the earthquake reinforced the fact that every section of road with poor availability state does not get affected or closed. This is also consistent with the variable ground shaking along the highway caused by the Kaikoura earthquake. However, this has little effect on the assessed availability of the route. That is the route was closed after the Kaikoura earthquake, as assessed in the resilience study.
c) The overall outage periods of SH1S following the Kaikoura earthquake are generally consistent with the predicted outage periods from the 2016 National Resilience study. The coastal section of the SH1S Kaikoura routes was assessed to be likely to be closed for over six months, and after almost six months, the route remains closed with recovery operations continuing.
d) Restoration of access and availability is often carried out in a staged manner rather than the idealised uniform rate of recovery. For example achieving restricted access, single lane access for periods of time before full access is restored.
e) Outage of the route is more meaningful at a corridor level rather than individual sections in a large event, because access is restricted by a series of closures and need to be accessed in sequence depending on other access routes.
f) Therefore in planning response, the Outage states assessed for individual sections in the resilience study, needs to then be considered for highway corridors taking into consideration the access available for repairing the route.
g) The more detailed corridor level resilience assessment based on the 2001 research study was also compared to the performance in the 2016 Kaikoura earthquake, and
Resilience of State Highways – Lessons from Kaikoura Earthquake 27
5C2934.01 | June 2017 | Issue 1 Opus International Consultants Ltd
indicated that the corridor level assessment of resilience also gave a good prediction of the level of resilience in major earthquake events.
2) The following observations in the Kaikoura earthquake reinforced the assessments made in the 2016 national resilience study:
a) Low height cut slopes experienced damage in the areas of strong ground shaking leading to partial or full closure, but were able to be readily cleared to reinstate partial access within a few days and full access within a few weeks.
b) High steep cut slopes, particularly along the Kaikoura coast, but also elsewhere (eg Awatere Valley) suffered severe damage leading to closure of the routes for long periods of time.
c) The high slopes experienced damage predominantly in the upper parts of cut slopes, likely due to topographical amplification of shaking, and this led to run out of debris and associated energy led to the failure debris inundating the full road width and closure of the route.
d) Embankments experienced deformation and cracking and partial loss of access, more than was expected in the prior resilience studies. However, partial access was able to be restored quickly.
e) Retaining walls, particularly low height gabion and crib walls, performed poorly leading to loss of part of the road. Concrete sea walls performed better than expected, though some failed leading to partial loss of the road.
3) The following observations are made with respect to the resilience associated with bridges and culverts, which were not included in the 2016 national resilience assessments, and are recorded to benefit future bridge resilience assessments:
a) Bridges generally performed well, although they experienced damage, and partial access was able to be restored in most instances with weight and lane restrictions. Some bridges were closed such as the Oaro rail overbridge.
b) Access to bridges was affected by settlement of the approaches, and required ramps to be formed using fill and asphalt.
c) Culverts were affected by ground deformation.
4) Fault rupture and the resultant ground displacement of few to several metres cut off access along the route. Temporary access was able to be restored quickly within days by ramping up the fault scarp by forming earth embankments. Full restoration will take much longer. These were generally not considered in the 2016 resilience assessments as the study considered a nominal 1,000 year return period earthquake, and not specific earthquakes associated with rupture of specific faults.
5) The following observations should be taken into consideration in earthquake response planning using the resilience assessments made for the state highways:
Resilience of State Highways – Lessons from Kaikoura Earthquake 28
5C2934.01 | June 2017 | Issue 1 Opus International Consultants Ltd
a) Safety hazards such as potential for rockfall can compromise availability of the route, even when the route is not closed, until the source areas for rock fall can be made safe, by scaling, sluicing or rock anchoring. This needs to be considered in response planning.
b) Ongoing aftershocks can cause further failures affecting the outage duration after an earthquake. This is not specifically considered in the 2016 national resilience study, as the aftershock sequence varies from earthquake to earthquake, but is generically reflected in the outage associated with high slopes.
6) Ongoing Post-earthquake Resilience issues identified are:
a) Debris from landslides and loosened ground in the back country above but away from the road corridors can lead to debris flows for long periods of time after an event, and lead to closures and increased outages and maintenance disruption.
b) Loosened slopes are likely to lead to ongoing failures for many years and possibly decades after an event leading to reduced resilience and further closures.
c) The current resilience assessments do not adequately reflect the earthquake caused vulnerability to storms, where storms lead to debris flows and landslides due to loosened ground.
d) The post-restoration level of service for the route affected by an event such as the Kaikoura earthquake could be lower than the pre-event level of service, due to reduced stability, resilience and ongoing potential for closures.
e) The post restoration resilience and level of service could also be higher than the pre-event level, where a greater level of design and stability is achieved in the restoration. For example, a retaining wall could be designed to a higher earthquake design standard, providing greater resilience in future events, or a wider road corridor could be achieved after the event.
9 Recommendations
The following recommendations are made based on the lessons from the Kaikoura earthquake:
1) The 2016 national resilience assessments for individual hazards, should be accompanied by the observation that the highways in steep terrain are likely to experience greater susceptibility to landslides and debris flows in storm events (and hence lower resilience) for a period of many years to decades, after being subject to major earthquake shaking events.
2) The conclusions from this study should be incorporated into the methodology developed for regional level resilience studies, to inform future regional or corridor level resilience assessments.
3) The observations on post-earthquake resilience and response planning should be made available to regional land transport teams involved in planning post-earthquake response.
Resilience of State Highways – Lessons from Kaikoura Earthquake 29
5C2934.01 | June 2017 | Issue 1 Opus International Consultants Ltd
10 References
Brabhaharan, P (2006). Recent Advances in Improving the Resilience of Road Networks. Remembering Napier 1931 – Building on 75 Years of Earthquake Engineering in New Zealand. Annual Conference of the New Zealand Society for Earthquake Engineering. Napier, 10-12 March 2006.
Brabhaharan, P, Fleming, MJ and Lynch, R (2001). Natural hazard risk management for road networks. Part I : Risk management strategies. Prepared by Opus International Consultants. Transfund New Zealand Research Report 217. 75pp.
Brabhaharan, P., Wiles, L.M., Freitag, S. (2006). Natural Hazard Road Risk Management Part III: Performance Criteria. Land Transport New Zealand Research Report 296. 117p.
Brabhaharan, P, Mason, D and Gkeli, E (2015). Research into Seismic Design and Performance of High Cut Slopes in New Zealand. 6th International Conf. Earthquake Geotechnical Engineering, Christchurch. November 2015.
Brabhaharan and Mason (2016). National State Highway Resilience Study. Methodology. Prepared for the NZ Transport Agency. April 2016.
Brabhaharan, P, Mason, D and Gkeli, E (2017). Seismic design and performance of high cut slopes. February 2017. NZ Transport Agency research report 613. Prepared by Opus International Consultants. 149pp.
Chiaro, G, Alexander, G, Brabhaharan, P, Massey, C, Koseki, J, Yamada, S and Aoyagi, Y (2017). Report on Geotechnical and Geological aspects of the 2016 Kumamoto Earthquakes. Submitted to the Bulletin of the NZ Society for Earthquake Engineering.
Opus International Consultants (2016). National state highway resilience study. Prepared by Mason, D and Brabhaharan, P. December 2016.
Wood, JH, Chapman, HE and Brabhaharan, P (2012). Performance of Highway Structures during the Darfield and Christchurch Earthquakes of 4 September 2010 and 22 February 2011. Report prepared for the New Zealand Transport Agency. February 2012.
Yu, J, Yong, P, Reid, S, Brabhaharan, P and. Meng, P (2009). The Ms 8.0 Wenchuan Earthquake of 12 May 2008 Reconnaissance Report. NZSEE Bulletin. Vol. 43. Issue 1.

Resilience of State Highways – Lessons from Kaikoura Earthquake 30
5C2934.01 | June 2017 | Issue 1 Opus International Consultants Ltd
Appendix A
Resilience States
1
DRAFT | January 2017 Opus International Consultants Ltd
Appendix A
Resilience States
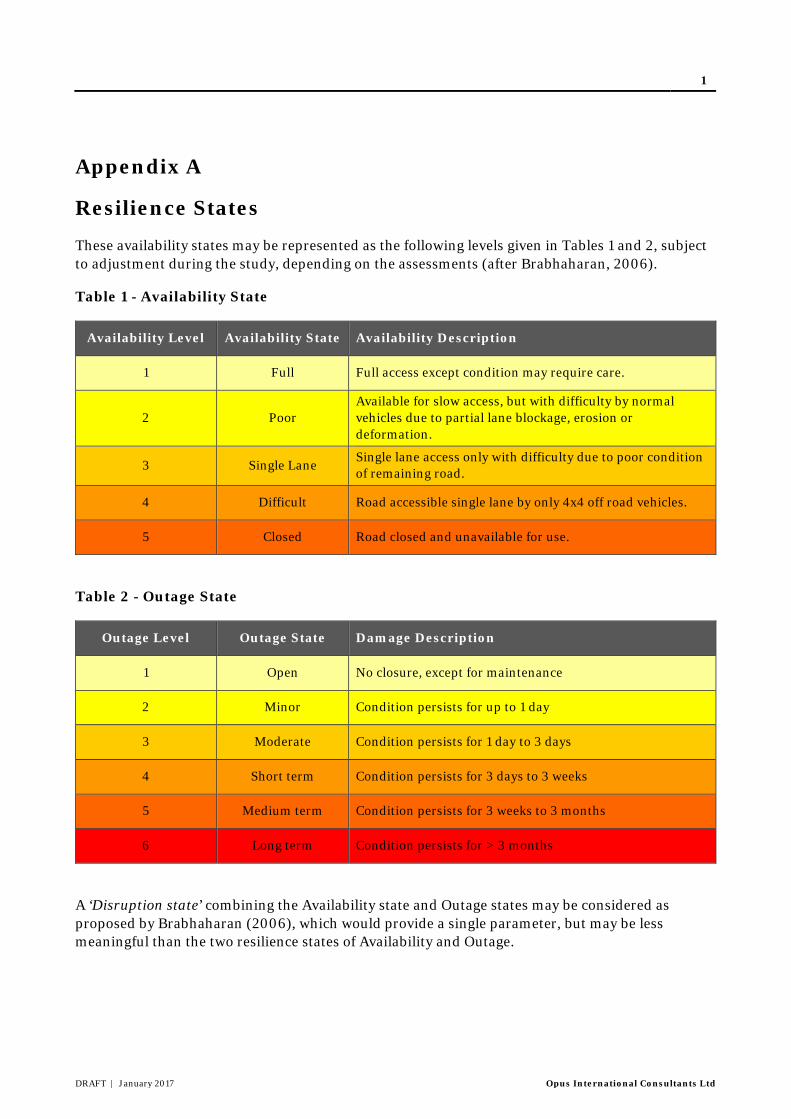
These availability states may be represented as the following levels given in Tables 1 and 2, subject to adjustment during the study, depending on the assessments (after Brabhaharan, 2006).
Table 1 - Availability State
Availability Level Availability State Availability Description
1 Full Full access except condition may require care.
2 Poor Available for slow access, but with difficulty by normal vehicles due to partial lane blockage, erosion or deformation.
3 Single Lane Single lane access only with difficulty due to poor condition of remaining road.
4 Difficult Road accessible single lane by only 4x4 off road vehicles.
5 Closed Road closed and unavailable for use.
Table 2 - Outage State
Outage Level Outage State Damage Description
1 Open No closure, except for maintenance
2 Minor Condition persists for up to 1 day
3 Moderate Condition persists for 1 day to 3 days
4 Short term Condition persists for 3 days to 3 weeks
5 Medium term Condition persists for 3 weeks to 3 months
6 Long term Condition persists for > 3 months
A ‘Disruption state’ combining the Availability state and Outage states may be considered as proposed by Brabhaharan (2006), which would provide a single parameter, but may be less meaningful than the two resilience states of Availability and Outage.
Resilience of State Highways – Lessons from Kaikoura Earthquake 1
5C2934.01 | May 2017 | Draft Opus International Consultants Ltd
Appendix B
Availability State Maps
– Resilience Research 2001 and Actual
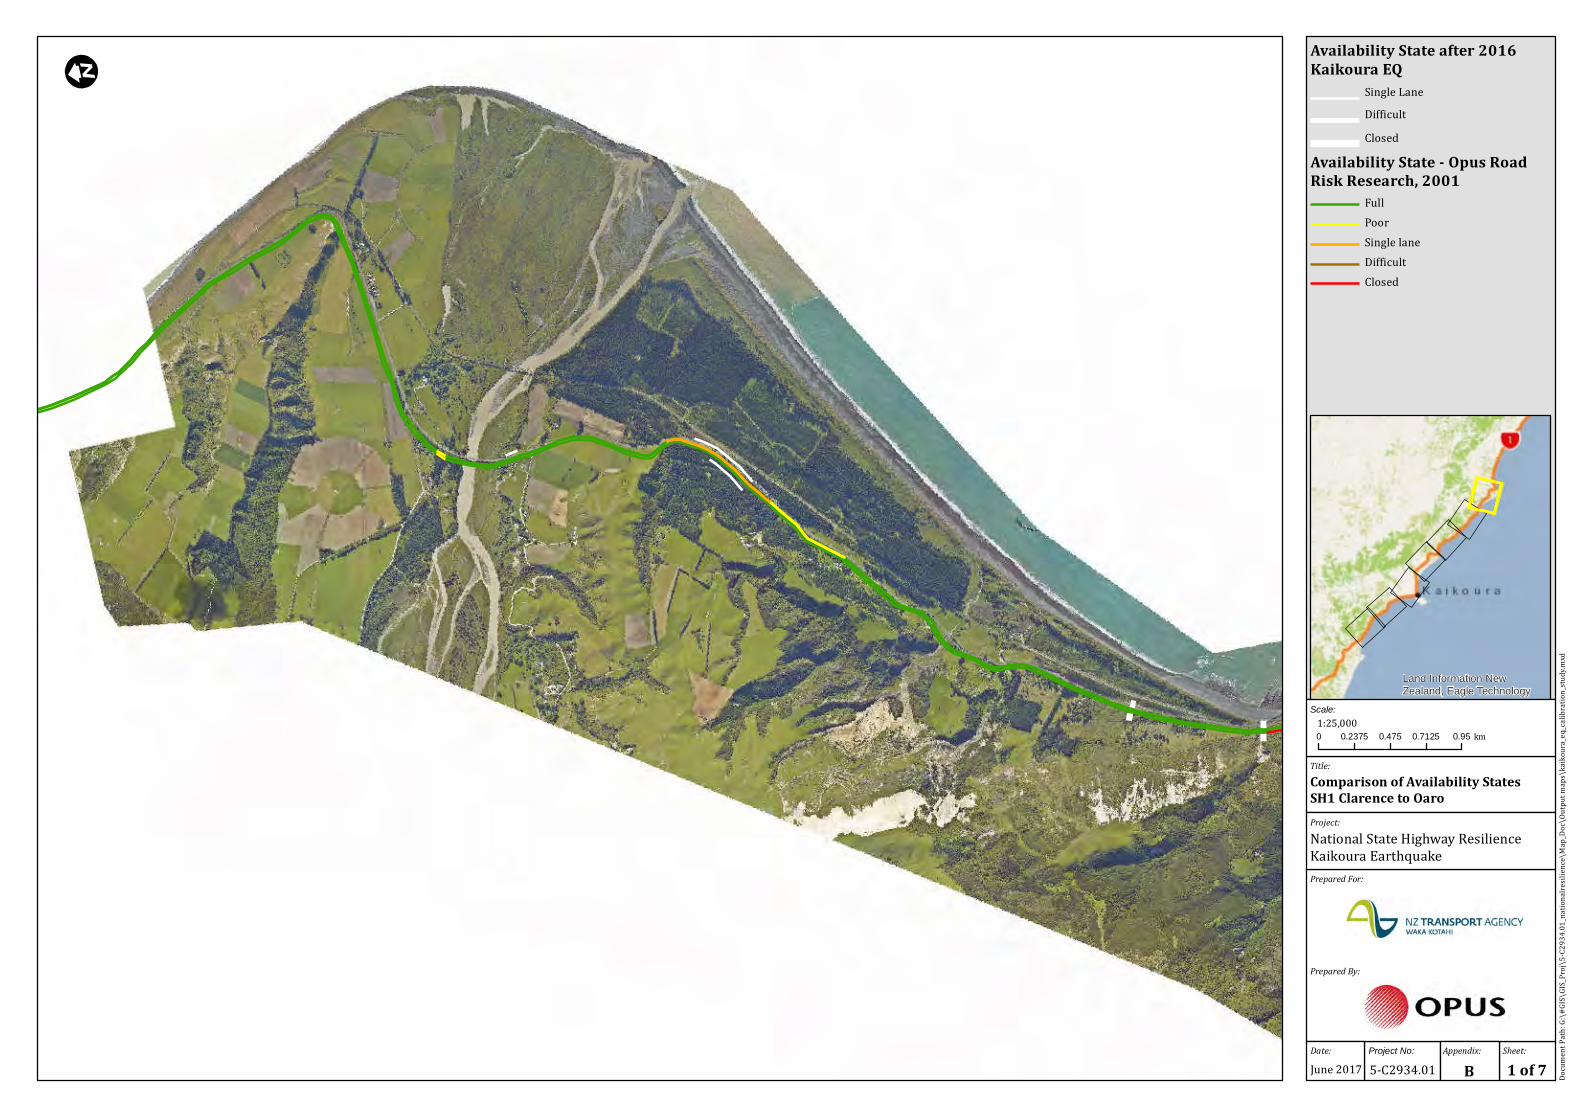
Availability State after 2016Kaikoura EQ
Single LaneDifficultClosed
Availability State - Opus RoadRisk Research, 2001
FullPoorSingle laneDifficultClosed
Docu
ment
Path:
G:\#
GIS\G
IS_Pro
j\5-C2
934.0
1_nati
onalr
esilie
nce\M
ap_D
oc\Ou
tput m
aps\k
aikou
ra_eq
_calib
ration
_stud
y.mxd
0 0.950.2375 0.475 0.7125 km1:25,000
Scale:
Date: Sheet:
Project:
Title:
National State Highway ResilienceKaikoura Earthquake
June 2017 5-C2934.01Project No:
1 of 7
Prepared By:
Prepared For:
Land Information NewZealand, Eagle Technology
Comparison of Availability StatesSH1 Clarence to Oaro
Appendix:BB
Availability State after 2016Kaikoura EQ
Single LaneDifficultClosed
Availability State - Opus RoadRisk Research, 2001
FullPoorSingle laneDifficultClosed
Docu
ment
Path:
G:\#
GIS\G
IS_Pro
j\5-C2
934.0
1_nati
onalr
esilie
nce\M
ap_D
oc\Ou
tput m
aps\k
aikou
ra_eq
_calib
ration
_stud
y.mxd
0 0.950.2375 0.475 0.7125 km1:25,000
Scale:
Date: Sheet:
Project:
Title:
National State Highway ResilienceKaikoura Earthquake
June 2017 5-C2934.01Project No:
2 of 7
Prepared By:
Prepared For:
Land Information NewZealand, Eagle Technology
Comparison of Availability StatesSH1 Clarence to Oaro
Appendix:BB

Availability State after 2016Kaikoura EQ
Single LaneDifficultClosed
Availability State - Opus RoadRisk Research, 2001
FullPoorSingle laneDifficultClosed
Docu
ment
Path:
G:\#
GIS\G
IS_Pro
j\5-C2
934.0
1_nati
onalr
esilie
nce\M
ap_D
oc\Ou
tput m
aps\k
aikou
ra_eq
_calib
ration
_stud
y.mxd
0 0.950.2375 0.475 0.7125 km1:25,000
Scale:
Date: Sheet:
Project:
Title:
National State Highway ResilienceKaikoura Earthquake
June 2017 5-C2934.01Project No:
3 of 7
Prepared By:
Prepared For:
Land Information NewZealand, Eagle Technology
Comparison of Availability StatesSH1 Clarence to Oaro
Appendix:BB

Availability State after 2016Kaikoura EQ
Single LaneDifficultClosed
Availability State - Opus RoadRisk Research, 2001
FullPoorSingle laneDifficultClosed
Docu
ment
Path:
G:\#
GIS\G
IS_Pro
j\5-C2
934.0
1_nati
onalr
esilie
nce\M
ap_D
oc\Ou
tput m
aps\k
aikou
ra_eq
_calib
ration
_stud
y.mxd
0 0.950.2375 0.475 0.7125 km1:25,000
Scale:
Date: Sheet:
Project:
Title:
National State Highway ResilienceKaikoura Earthquake
June 2017 5-C2934.01Project No:
4 of 7
Prepared By:
Prepared For:
Land Information NewZealand, Eagle Technology
Comparison of Availability StatesSH1 Clarence to Oaro
Appendix:BB
Availability State after 2016Kaikoura EQ
Single LaneDifficultClosed
Availability State - Opus RoadRisk Research, 2001
FullPoorSingle laneDifficultClosed
Docu
ment
Path:
G:\#
GIS\G
IS_Pro
j\5-C2
934.0
1_nati
onalr
esilie
nce\M
ap_D
oc\Ou
tput m
aps\k
aikou
ra_eq
_calib
ration
_stud
y.mxd
0 0.950.2375 0.475 0.7125 km1:25,000
Scale:
Date: Sheet:
Project:
Title:
National State Highway ResilienceKaikoura Earthquake
June 2017 5-C2934.01Project No:
5 of 7
Prepared By:
Prepared For:
Land Information NewZealand, Eagle Technology
Comparison of Availability StatesSH1 Clarence to Oaro
Appendix:BB
Availability State after 2016Kaikoura EQ
Single LaneDifficultClosed
Availability State - Opus RoadRisk Research, 2001
FullPoorSingle laneDifficultClosed
Docu
ment
Path:
G:\#
GIS\G
IS_Pro
j\5-C2
934.0
1_nati
onalr
esilie
nce\M
ap_D
oc\Ou
tput m
aps\k
aikou
ra_eq
_calib
ration
_stud
y.mxd
0 0.950.2375 0.475 0.7125 km1:25,000
Scale:
Date: Sheet:
Project:
Title:
National State Highway ResilienceKaikoura Earthquake
June 2017 5-C2934.01Project No:
6 of 7
Prepared By:
Prepared For:
Land Information NewZealand, Eagle Technology
Comparison of Availability StatesSH1 Clarence to Oaro
Appendix:BB
Availability State after 2016Kaikoura EQ
Single LaneDifficultClosed
Availability State - Opus RoadRisk Research, 2001
FullPoorSingle laneDifficultClosed
Docu
ment
Path:
G:\#
GIS\G
IS_Pro
j\5-C2
934.0
1_nati
onalr
esilie
nce\M
ap_D
oc\Ou
tput m
aps\k
aikou
ra_eq
_calib
ration
_stud
y.mxd
0 0.950.2375 0.475 0.7125 km1:25,000
Scale:
Date: Sheet:
Project:
Title:
National State Highway ResilienceKaikoura Earthquake
June 2017 5-C2934.01Project No:
7 of 7
Prepared By:
Prepared For:
Land Information NewZealand, Eagle Technology
Comparison of Availability StatesSH1 Clarence to Oaro
Appendix:BB

Resilience of State Highways – Lessons from Kaikoura Earthquake 2
5C2934.01 | May 2017 | Draft Opus International Consultants Ltd
Resilience of State Highways – Lessons from Kaikoura Earthquake 3
5C2934.01 | May 2017 | Draft Opus International Consultants Ltd
Appendix C
Availability State Maps
– National Resilience 2016 and Actual
Availability State after 2016Kaikoura EQ
Single LaneDifficultClosed
Earthquake Availability State -National Resilience Study, 2016
FullPoorSingle laneDifficultClosed
Docu
ment
Path:
G:\#
GIS\G
IS_Pro
j\5-C2
934.0
1_nati
onalr
esilie
nce\M
ap_D
oc\Ou
tput m
aps\k
aikou
ra_eq
_calib
ration
_stud
y.mxd
0 0.950.2375 0.475 0.7125 km1:25,000
Scale:
Date: Sheet:
Project:
Title:
National State Highway ResilienceKaikoura Earthquake
June 2017 5-C2934.01Project No:
1 of 7
Prepared By:
Prepared For:
Land Information NewZealand, Eagle Technology
Comparison of Availability StatesSH1 Clarence to Oaro
Appendix:BC
Availability State after 2016Kaikoura EQ
Single LaneDifficultClosed
Earthquake Availability State -National Resilience Study, 2016
FullPoorSingle laneDifficultClosed
Docu
ment
Path:
G:\#
GIS\G
IS_Pro
j\5-C2
934.0
1_nati
onalr
esilie
nce\M
ap_D
oc\Ou
tput m
aps\k
aikou
ra_eq
_calib
ration
_stud
y.mxd
0 0.950.2375 0.475 0.7125 km1:25,000
Scale:
Date: Sheet:
Project:
Title:
National State Highway ResilienceKaikoura Earthquake
June 2017 5-C2934.01Project No:
2 of 7
Prepared By:
Prepared For:
Land Information NewZealand, Eagle Technology
Comparison of Availability StatesSH1 Clarence to Oaro
Appendix:BC
Availability State after 2016Kaikoura EQ
Single LaneDifficultClosed
Earthquake Availability State -National Resilience Study, 2016
FullPoorSingle laneDifficultClosed
Docu
ment
Path:
G:\#
GIS\G
IS_Pro
j\5-C2
934.0
1_nati
onalr
esilie
nce\M
ap_D
oc\Ou
tput m
aps\k
aikou
ra_eq
_calib
ration
_stud
y.mxd
0 0.950.2375 0.475 0.7125 km1:25,000
Scale:
Date: Sheet:
Project:
Title:
National State Highway ResilienceKaikoura Earthquake
June 2017 5-C2934.01Project No:
3 of 7
Prepared By:
Prepared For:
Land Information NewZealand, Eagle Technology
Comparison of Availability StatesSH1 Clarence to Oaro
Appendix:BC
Availability State after 2016Kaikoura EQ
Single LaneDifficultClosed
Earthquake Availability State -National Resilience Study, 2016
FullPoorSingle laneDifficultClosed
Docu
ment
Path:
G:\#
GIS\G
IS_Pro
j\5-C2
934.0
1_nati
onalr
esilie
nce\M
ap_D
oc\Ou
tput m
aps\k
aikou
ra_eq
_calib
ration
_stud
y.mxd
0 0.950.2375 0.475 0.7125 km1:25,000
Scale:
Date: Sheet:
Project:
Title:
National State Highway ResilienceKaikoura Earthquake
June 2017 5-C2934.01Project No:
4 of 7
Prepared By:
Prepared For:
Land Information NewZealand, Eagle Technology
Comparison of Availability StatesSH1 Clarence to Oaro
Appendix:BC
Availability State after 2016Kaikoura EQ
Single LaneDifficultClosed
Earthquake Availability State -National Resilience Study, 2016
FullPoorSingle laneDifficultClosed
Docu
ment
Path:
G:\#
GIS\G
IS_Pro
j\5-C2
934.0
1_nati
onalr
esilie
nce\M
ap_D
oc\Ou
tput m
aps\k
aikou
ra_eq
_calib
ration
_stud
y.mxd
0 0.950.2375 0.475 0.7125 km1:25,000
Scale:
Date: Sheet:
Project:
Title:
National State Highway ResilienceKaikoura Earthquake
June 2017 5-C2934.01Project No:
5 of 7
Prepared By:
Prepared For:
Land Information NewZealand, Eagle Technology
Comparison of Availability StatesSH1 Clarence to Oaro
Appendix:BC
Availability State after 2016Kaikoura EQ
Single LaneDifficultClosed
Earthquake Availability State -National Resilience Study, 2016
FullPoorSingle laneDifficultClosed
Docu
ment
Path:
G:\#
GIS\G
IS_Pro
j\5-C2
934.0
1_nati
onalr
esilie
nce\M
ap_D
oc\Ou
tput m
aps\k
aikou
ra_eq
_calib
ration
_stud
y.mxd
0 0.950.2375 0.475 0.7125 km1:25,000
Scale:
Date: Sheet:
Project:
Title:
National State Highway ResilienceKaikoura Earthquake
June 2017 5-C2934.01Project No:
6 of 7
Prepared By:
Prepared For:
Land Information NewZealand, Eagle Technology
Comparison of Availability StatesSH1 Clarence to Oaro
Appendix:BC
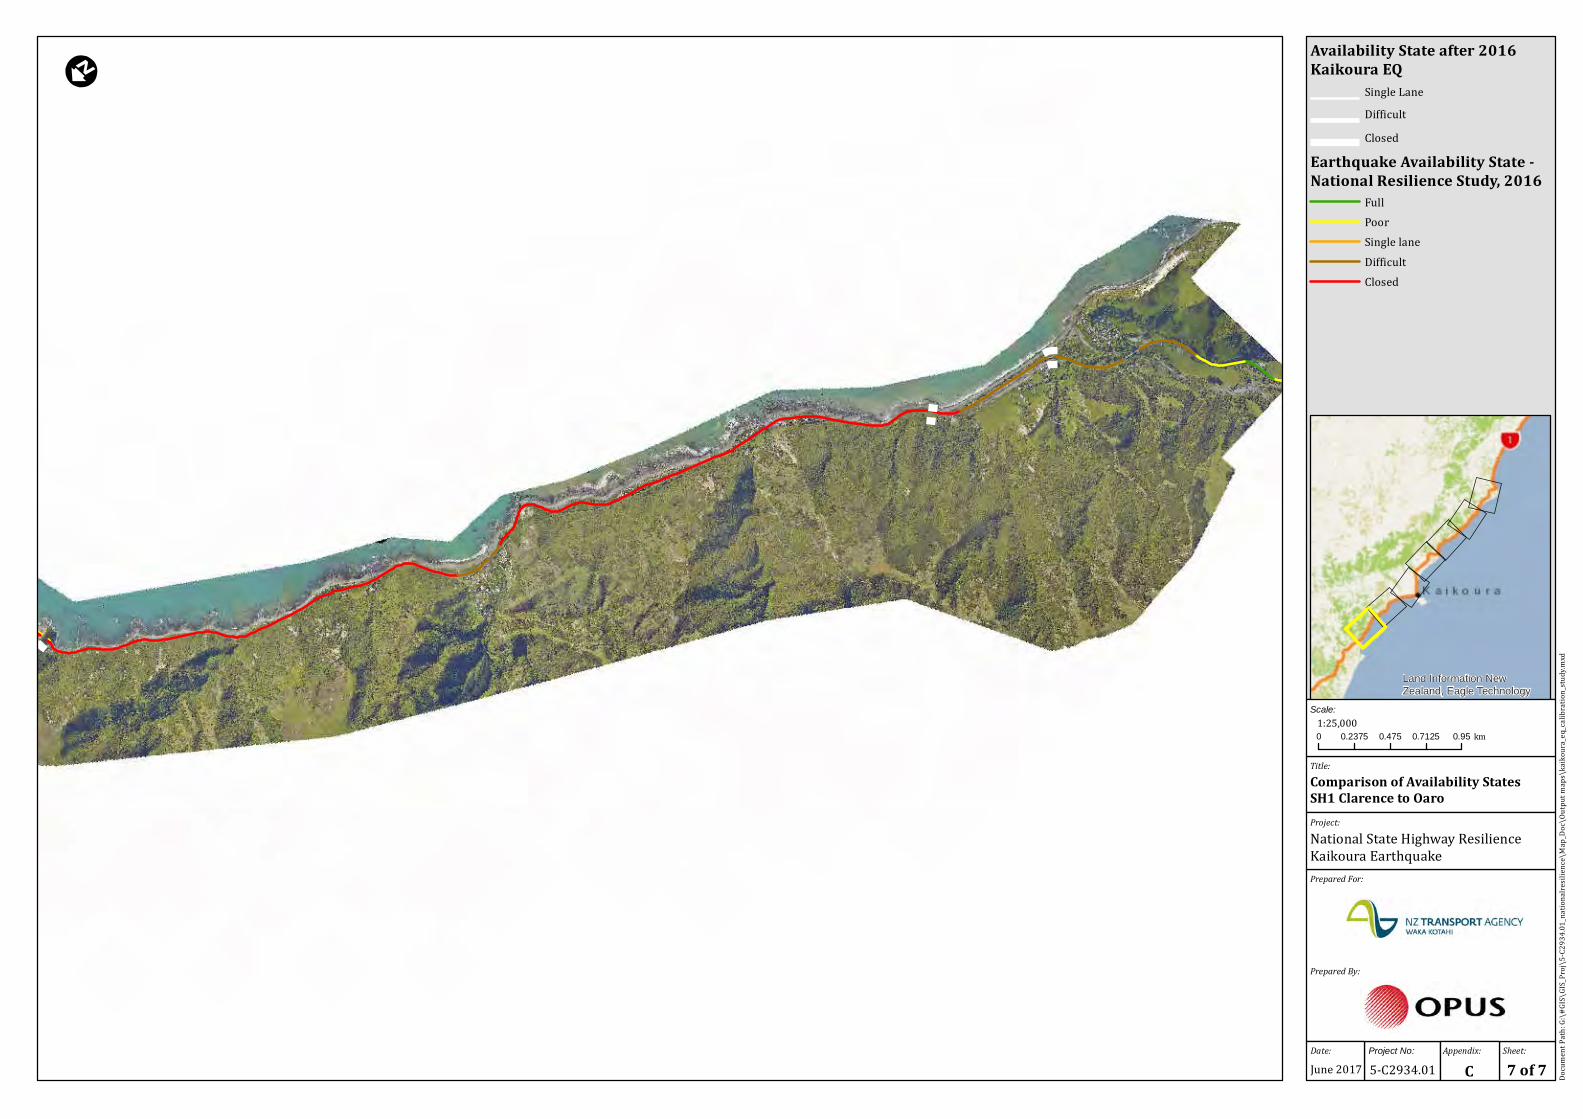
Availability State after 2016Kaikoura EQ
Single LaneDifficultClosed
Earthquake Availability State -National Resilience Study, 2016
FullPoorSingle laneDifficultClosed
Docu
ment
Path:
G:\#
GIS\G
IS_Pro
j\5-C2
934.0
1_nati
onalr
esilie
nce\M
ap_D
oc\Ou
tput m
aps\k
aikou
ra_eq
_calib
ration
_stud
y.mxd
0 0.950.2375 0.475 0.7125 km1:25,000
Scale:
Date: Sheet:
Project:
Title:
National State Highway ResilienceKaikoura Earthquake
June 2017 5-C2934.01Project No:
7 of 7
Prepared By:
Prepared For:
Land Information NewZealand, Eagle Technology
Comparison of Availability StatesSH1 Clarence to Oaro
Appendix:BC

Resilience of State Highways – Lessons from Kaikoura Earthquake 4
5C2934.01 | May 2017 | Draft Opus International Consultants Ltd

Opus International Consultants Ltd L10, Majestic Centre, 100 Willis St PO Box 12 003, Wellington 6144 New Zealand t: +64 4 471 7000 f: +64 4 471 1397 w: www.opus.co.nz