replacing gluten as a functional constituent in baked ...doc/e-arendt.pdf · elke k. arendt school...
TRANSCRIPT

Elke K. Arendt
School of Food and Nutritional SciencesUniversity College Cork
Ireland
Replacing gluten as a functional constituent in baked goods

Marketing study
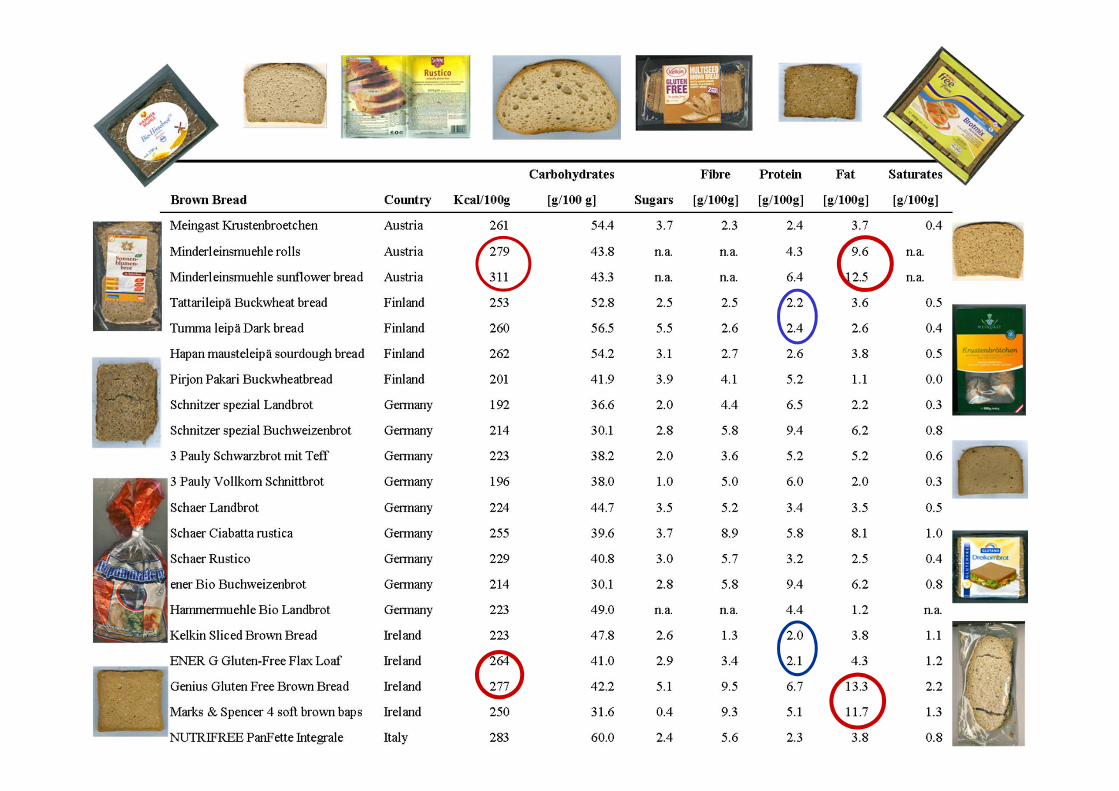
Gluten free bread

Gluten free Market
100 bread products from 15 countries
Nutritional InformationVolume
Texture Sensory evaluation
Price
Free-from market: 300% growth since 2000US market for GF products: 1,6 billion $ (2010) –predicted to be 2.6 billion $ (2012)Growth rate of 25% per yearOnly 1 out of 10 consumers buying GF-products are Coeliac patients
Marketing study UCC
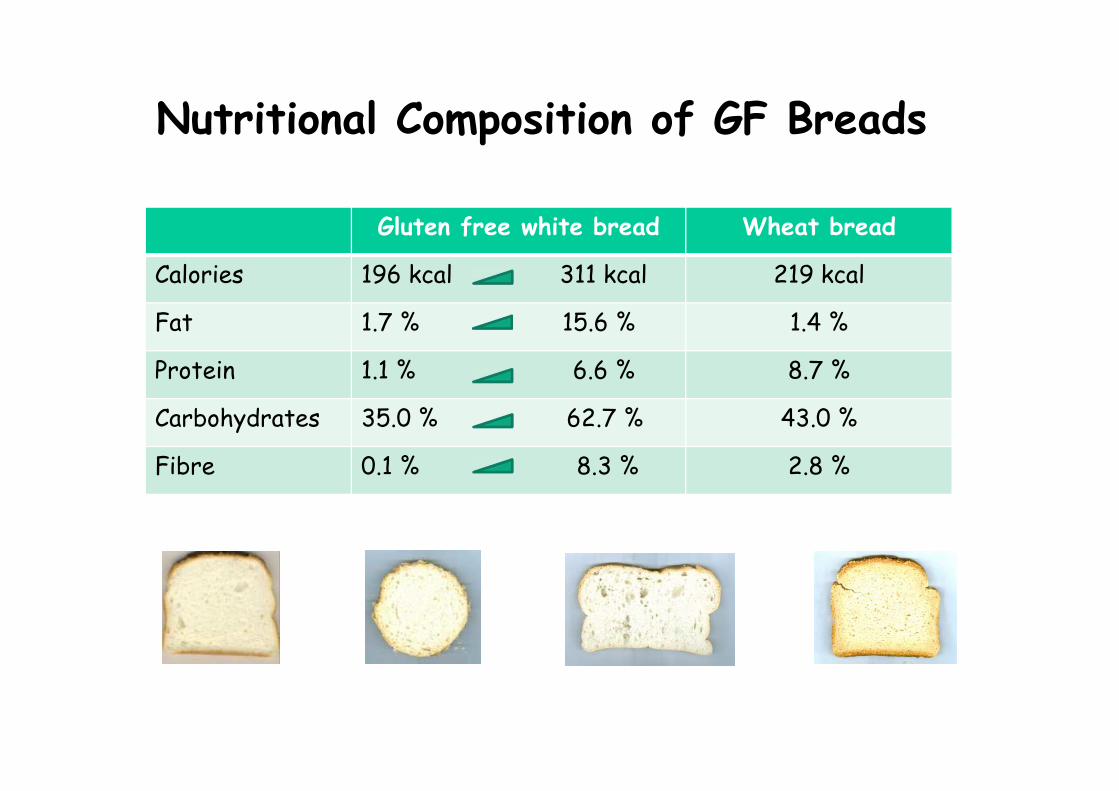
Nutritional Composition of GF Breads
Gluten free white bread Wheat bread
Calories 196 kcal 311 kcal 219 kcal
Fat 1.7 % 15.6 % 1.4 %
Protein 1.1 % 6.6 % 8.7 %
Carbohydrates 35.0 % 62.7 % 43.0 %
Fibre 0.1 % 8.3 % 2.8 %

A Bite of GF BreadMarketing Study
• Dry, crumbly mouth feel and off-flavor
• Lack of Nutrients, high in fat
• Rapid staling (mostly starch based)
•Expensive
Evaluation of over 100 gluten free cereal products
from 15 different countries

Marketing study
Gluten free pasta

Market study
Nutritional InformationTexture Taste Price
36 pasta samples from 8 European countries
Result• Calorie content similar to wheat• Protein content lower than wheat• Carbohydrate level similar or higher than wheat• GF-pasta often higher in fat• Price 3 to 5 Euro per 500 g

Market study on gluten-free pasta
Gluten-free De Cecco
Calorie content [kcal] 338-384 346
Protein [g/100g] 3-11 13
Carbohydrates [g/100g] 70-86 70.2
Fat [g/100g] 0.3-3 1.5
Dietary fibre [g/100g] 1.1-4.6 2.9
What is gluten ?
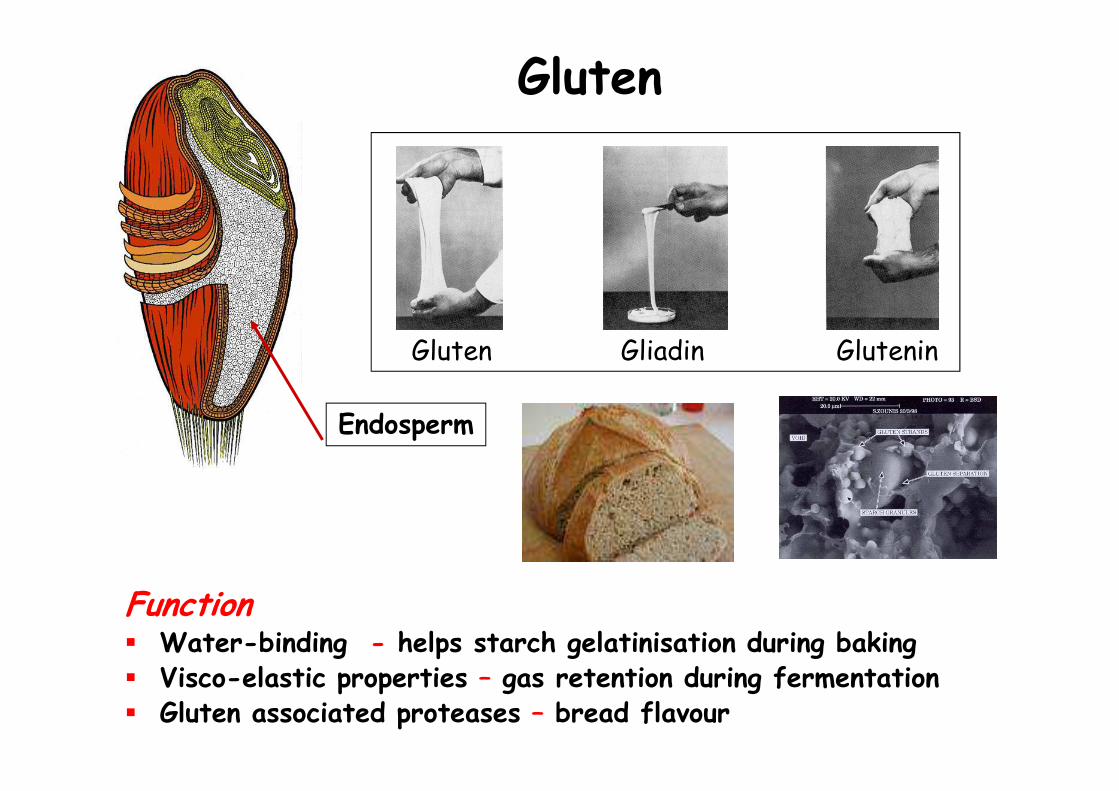
Gluten
Gluten Gliadin Glutenin
Function� Water-binding - helps starch gelatinisation during baking� Visco-elastic properties – gas retention during fermentation� Gluten associated proteases – bread flavour
Endosperm
Gluten free cereals and their characterisation

Eragrostis tef Teff
Eleusin coracanaFinger millet
Gluten free cereals
OryzoidaeRice
Panicoideaezea maysMaize
Sorghum bicolorSorghum
Pennisetumglaucum
Proso Millet
Avena sativa L.
Oats
Fagopyrum esculentumBuckwheat
Amaranthus cruentusAmaranth
Chenopodium quinoaQuinoa
Pseudocereals

Gluten free flours -Evaluation
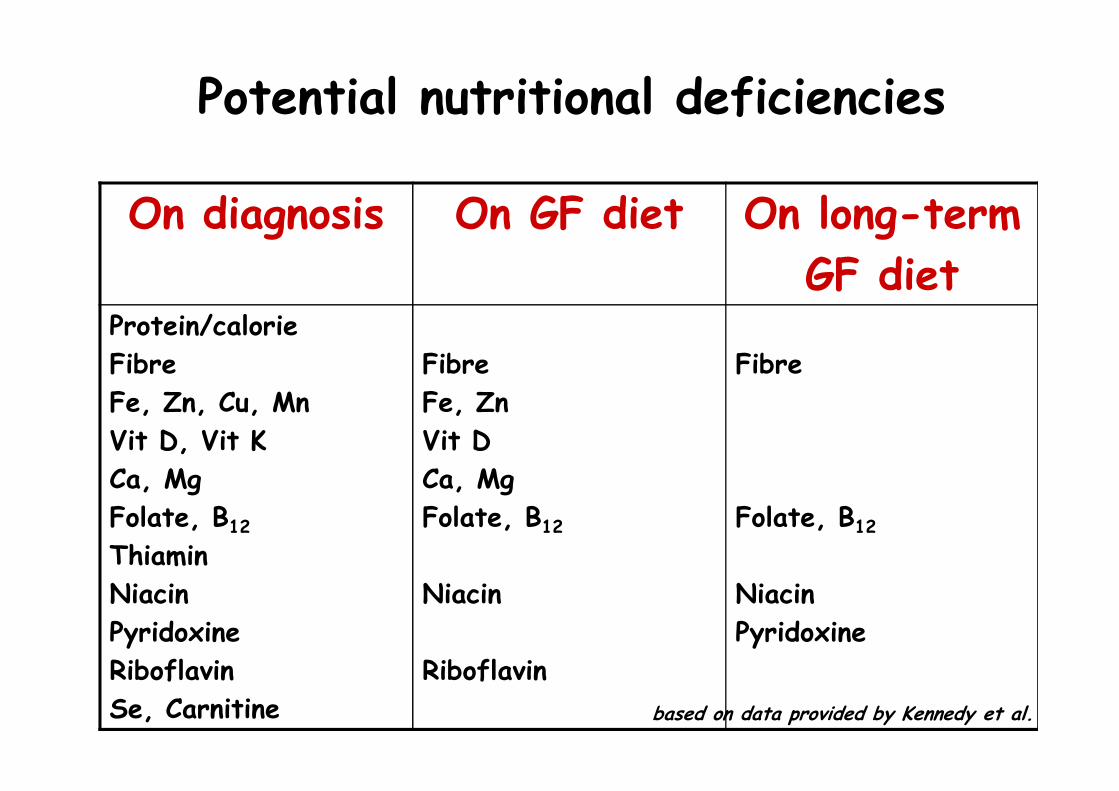
Potential nutritional deficiencies
On diagnosis On GF diet On long-term
GF dietProtein/calorie
Fibre
Fe, Zn, Cu, Mn
Vit D, Vit K
Ca, Mg
Folate, B12
Thiamin
Niacin
Pyridoxine
Riboflavin
Se, Carnitine
Fibre
Fe, Zn
Vit D
Ca, Mg
Folate, B12
Niacin
Riboflavin
Fibre
Folate, B12
Niacin
Pyridoxine
based on data provided by Kennedy et al.

Compositional analysis
2% 6%
14%
78%
0%
Maize
4%
10%
13%
72%
1%
Whole wheat
4%
12%
13%
69%
2%
Buckwheat
9%
14%
12%63%
2%
Quinoa3% 5%
11%
80%
1%
Sorghum
1%
7%
13%
78%
1%
Rice4%
13%
10%
71%
2%
Teff
7%7%
10%
75%
1%
Oat
2%
11%
13%
73%
1%
Wheat

Protein content g/100g

Mineral characterisationWheat Wholewheat Rice Oat Quinoa Buckwheat Sorghum Maize Teff
Ash§ 0.92 1.32 0.51 0.82 2.43 1.65 0.97 0.37 2.15
Calcium* 179.80 30.80 5.10 22.50 49.80 14.80 9.80 3.30 154.30
Iron* 1.34 2.69 0.60 1.64 5.35 2.85 0.27 0.91 8.53
Sodium* 3.80 2.00 1.50 1.70 3.70 1.10 0.50 0.50 6.00
Potassium* 152.00 399.80 97.40 174.40 553.80 402.30 258.10 148.70 382.80
Copper* 0.15 0.40 0.22 0.27 0.77 0.51 0.18 0.09 0.93
Manganese* 0.83 2.34 0.73 2.77 1.35 1.18 1.13 0.15 3.45
Zinc* 0.76 1.75 1.78 1.13 3.28 1.88 1.00 0.66 4.15
Chloride* 82.60 99.80 35.10 67.00 43.40 14.40 40.30 48.40 48.10
Phosphorus* 90.90 204.10 95.50 147.60 441.60 278.70 163.10 81.40 361.70
§ g/100g* mg/100g

Folate levels µg/100g

Dietary fibre contentTotal fibre* Insoluble fibre* Soluble fibre* Total starch*
Wheat 3.44 ± 0.01 2.10 ± 0.12 1.34 ± 0.11 68.06 ± 2.34
Wholewheat 11.42 ± 1.27 9.82 ± 0.88 1.60 ± 0.40 57.24 ± 0.26
Rice 0.43 ± 0.15 0.28 ± 0.10 0.14 ± 0.06 77.52 ± 0.42
Oat 4.05 ± 0.40 3.69 ± 0.41 0.36 ± 0.02 69.38 ± 1.66
Quinoa 7.14 ± 0.23 5.18 ± 0.26 1.77 ± 0.14 48.88 ± 2.07
Buckwheat 2.18 ± 0.11 1.70 ± 0.14 0.48 ± 0.17 61.35 ± 2.15
Sorghum 4.51 ± 0.01 3.79 ± 0.05 0.72 ± 0.04 73.20 ± 1.52
Maize 2.62 ± 0.45 3.79 ± 0.05 0.64 ± 0.14 71.52 ± 0.42
Teff 4.54 ± 0.57 1.98 ± 0.31 0.85 ± 0.17 57.77 ± 5.94
* g/100g

Resulting loaves

Wheat
Rice
Maize
Wholemeal Sorghum Teff
Buckwheat Oat Quinoa
Laser scanning microscopy
40 x magnification
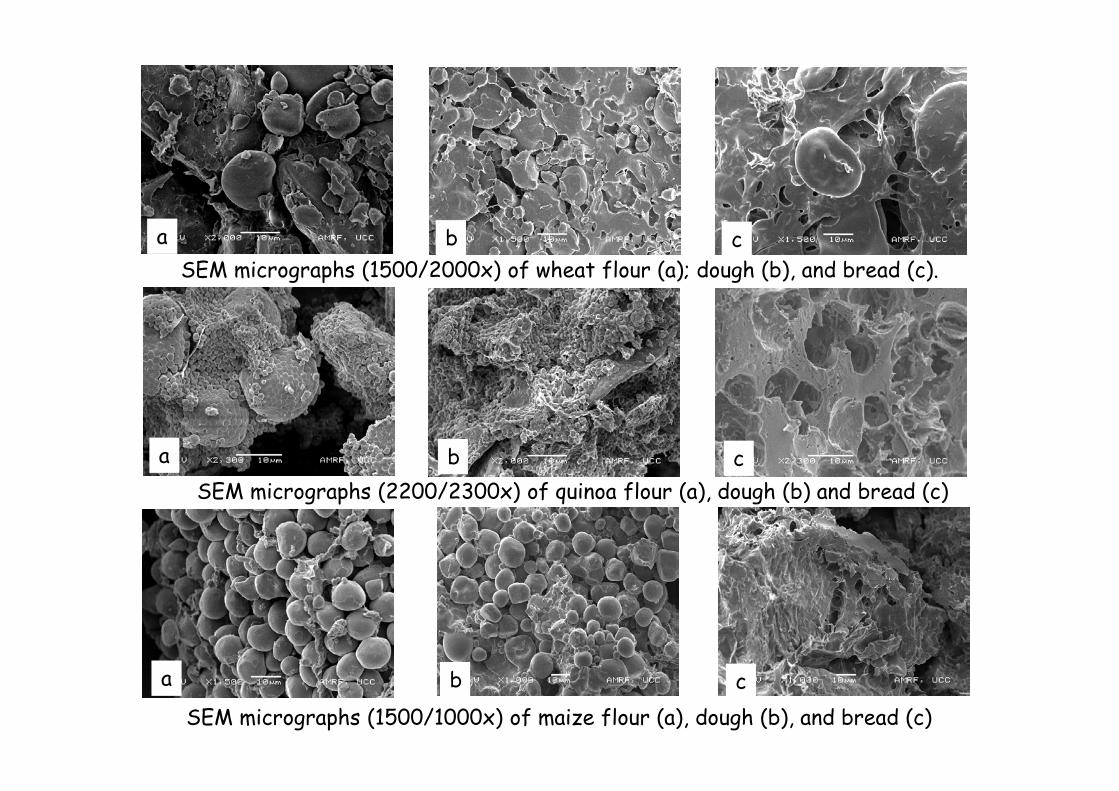
SEM micrographs (1500/2000x) of wheat flour (a); dough (b), and bread (c).
a b c
SEM micrographs (1500/1000x) of maize flour (a), dough (b), and bread (c)
a b c
•c
SEM micrographs (2200/2300x) of quinoa flour (a), dough (b) and bread (c)
a b c
Gluten free pasta

Ingredients
Mixing
Extrusion
10 min
Pasta Production

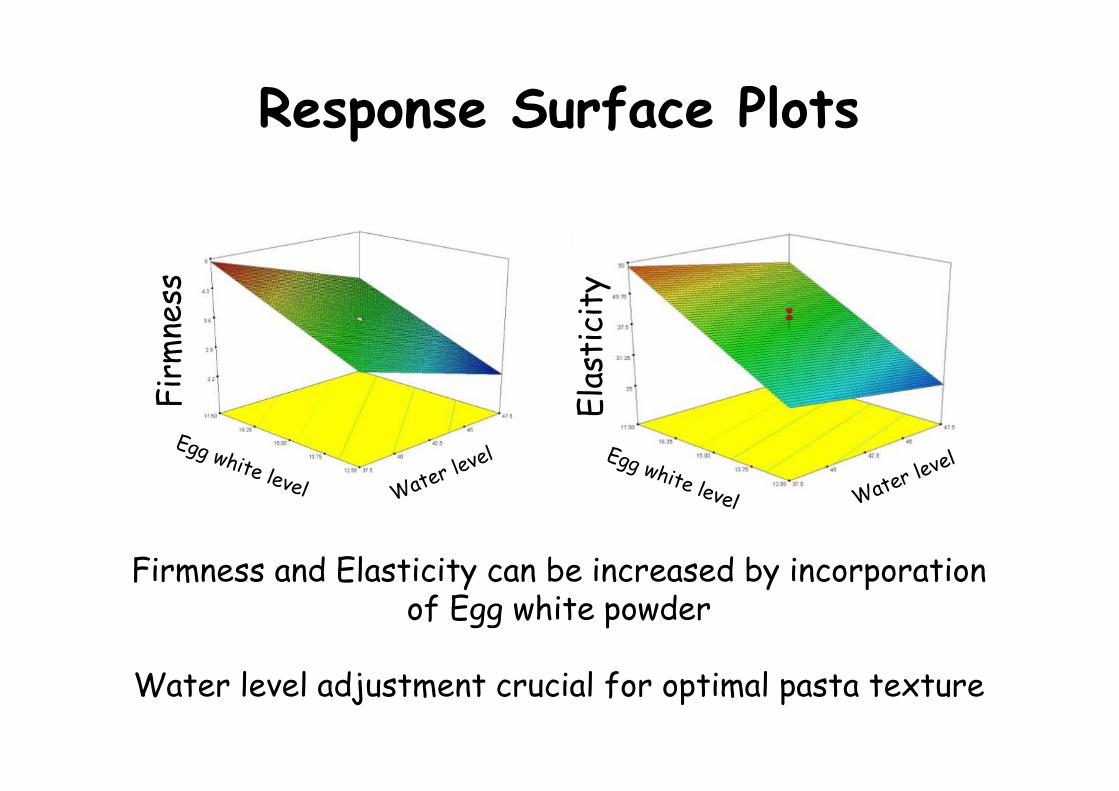
Response Surface Methodology (RSM) investigates relationship between:
Response variables
Explanatory variables
Egg white powder
Emulsifier
Water level
Cooking lossElasticityFirmness
Recipe development
Ela
stic
ity
Fir
mne
ss
Firmness and Elasticity can be increased by incorporation of Egg white powder
Water level adjustment crucial for optimal pasta texture
Response Surface Plots
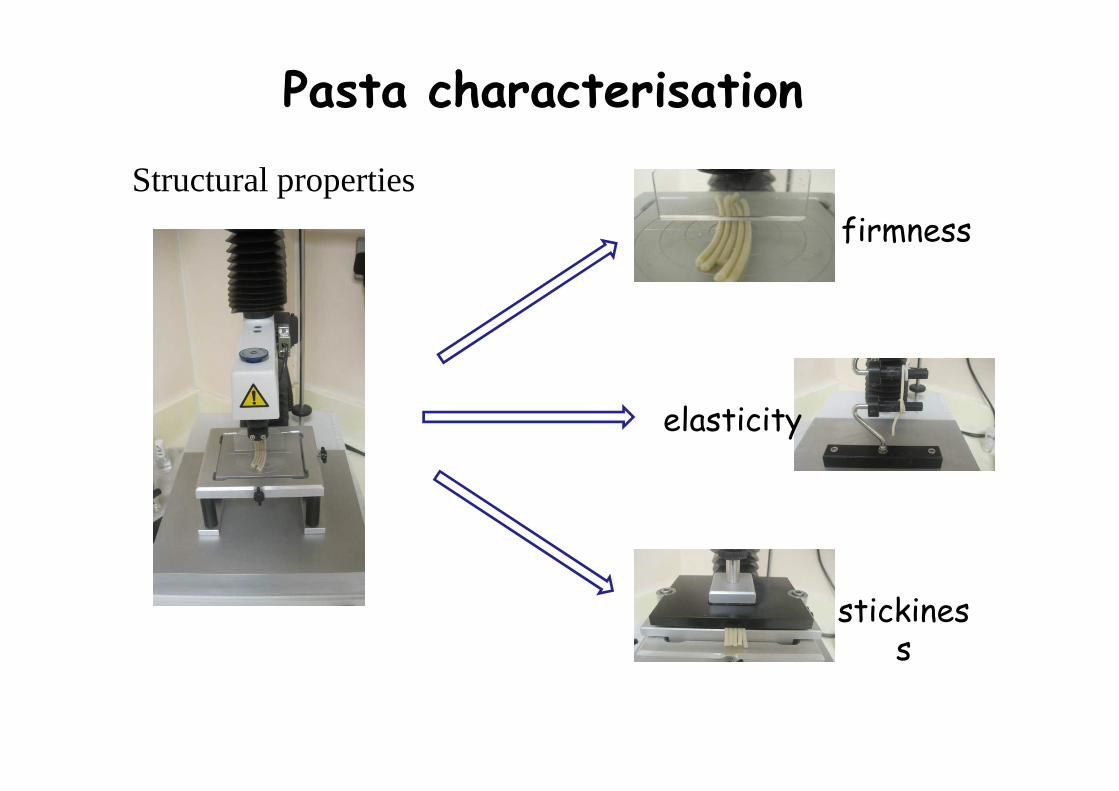
Structural properties
elasticity
stickiness
firmness
Pasta characterisation

Gluten free pasta
Ingredients [%] Oat Teff Wheat
Flour 100 100 100
Water 37.5 39.9 32.6
Egg white powder 14.9 17.5 10
Emulsifier 2 1.7 0.5
Product Firmness [N] Elasticity [g] Cooking loss [%]
Wheat pasta 6.28 75.43 2.08
Oat pasta 4.31 39.34 3.23
Teff pasta 4.52 43.18 4.06
Oat and teff fresh egg pasta developed by response surface methodology
Pasta quality evaluation

Cooked Wheat Spaghetti(DeCecco)
Ultra structureLaser scanning microscope
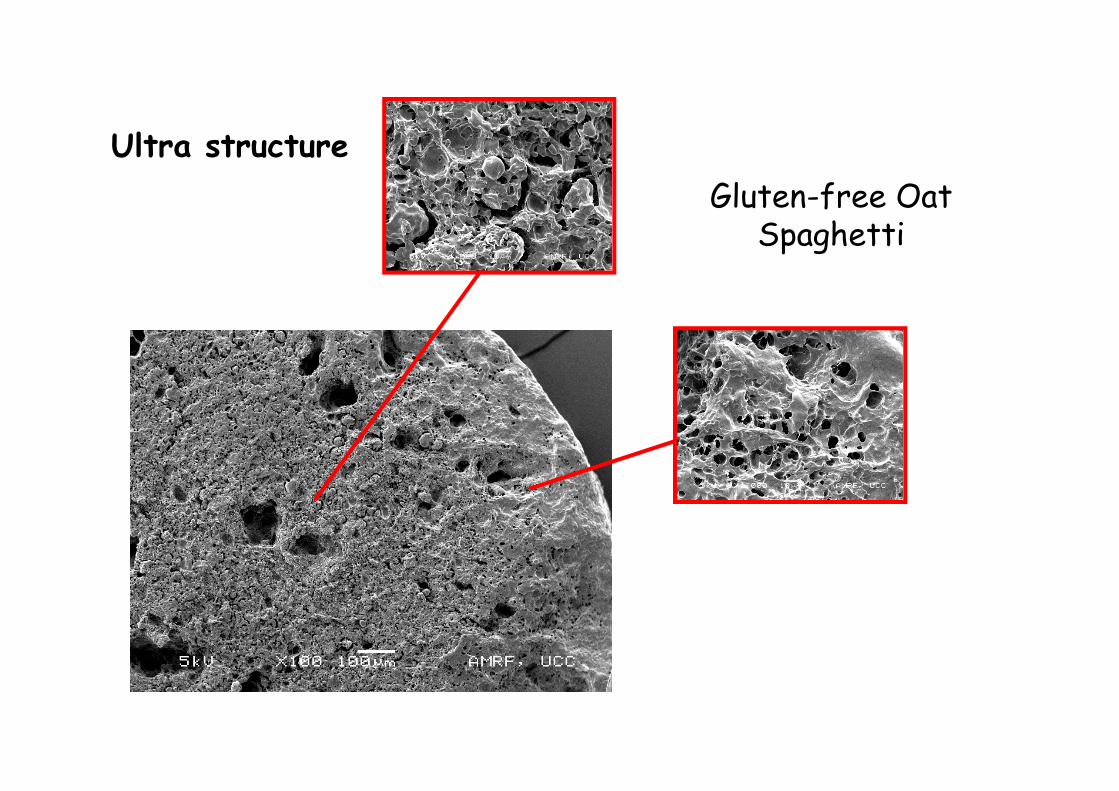
Gluten-free Oat Spaghetti
Ultra structure

Gluten free cereal products
Objective
To produce a gluten-free products, which is of comparable quality to
wheat products
To produce a GF-products which takes the safety and nutritional
requirements of Coeliac patients into account
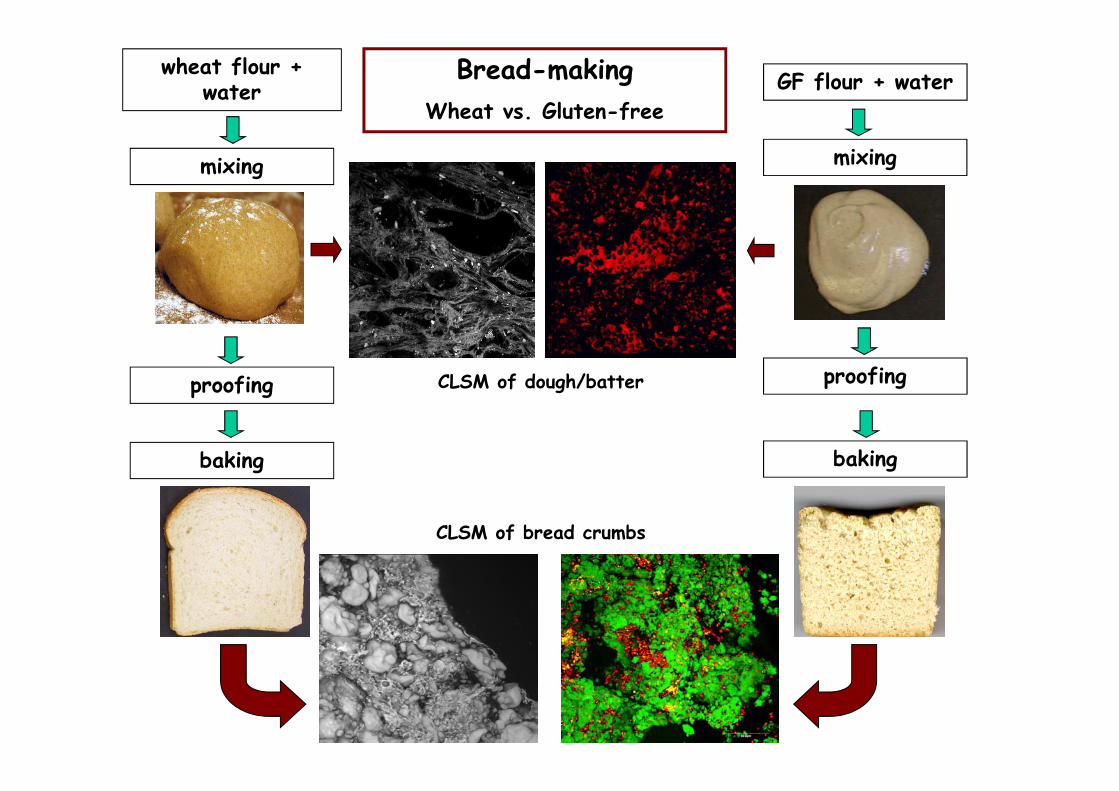
wheat flour + water
mixing
proofing
baking
GF flour + water
mixing
proofing
baking
Bread-making
Wheat vs. Gluten-free
CLSM of bread crumbs
CLSM of dough/batter

Gluten-free flours
New Generation Gluten-free bread development
Functional ingredients
Novel processing approaches
EnzymesLactic acid bacteria
Hydrocolloids Dough improversCereals Pseudo-cereals
High fibreingredients
High pressure
Starches

Lactic acid bacteria and their role in Gluten free bakery
products

An answer from the past: sourdough
AromaOrganic Acids
Amino Acids (proteolysis)Flavor (precursor) Compounds
TextureSolubilization of Pentosans
Gluten Modification and HydrolysisExopolysaccharides (EPS)
Shelf lifeOrganic Acids
Antifungal compounds
Nutritional Properties
Phytate HydrolysisStarch BioavailabilityDietary Fiber (EPS)
Does this apply for GF bread?
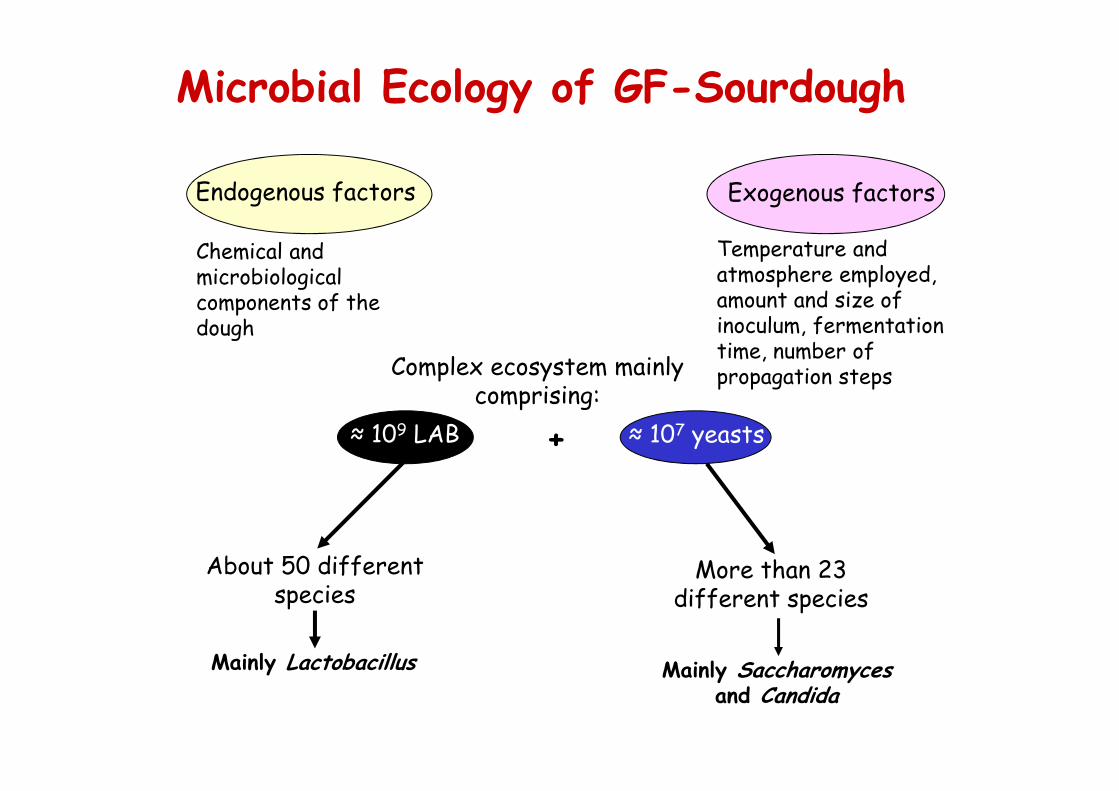
Microbial Ecology of GF-Sourdough
Endogenous factors
Chemical and microbiological components of the dough
Exogenous factors
Temperature and atmosphere employed, amount and size of inoculum, fermentation time, number of propagation stepsComplex ecosystem mainly
comprising:
About 50 different species
≈ 109 LAB
Mainly Lactobacillus
≈ 107 yeasts+
More than 23 different species
Mainly Saccharomyces and Candida
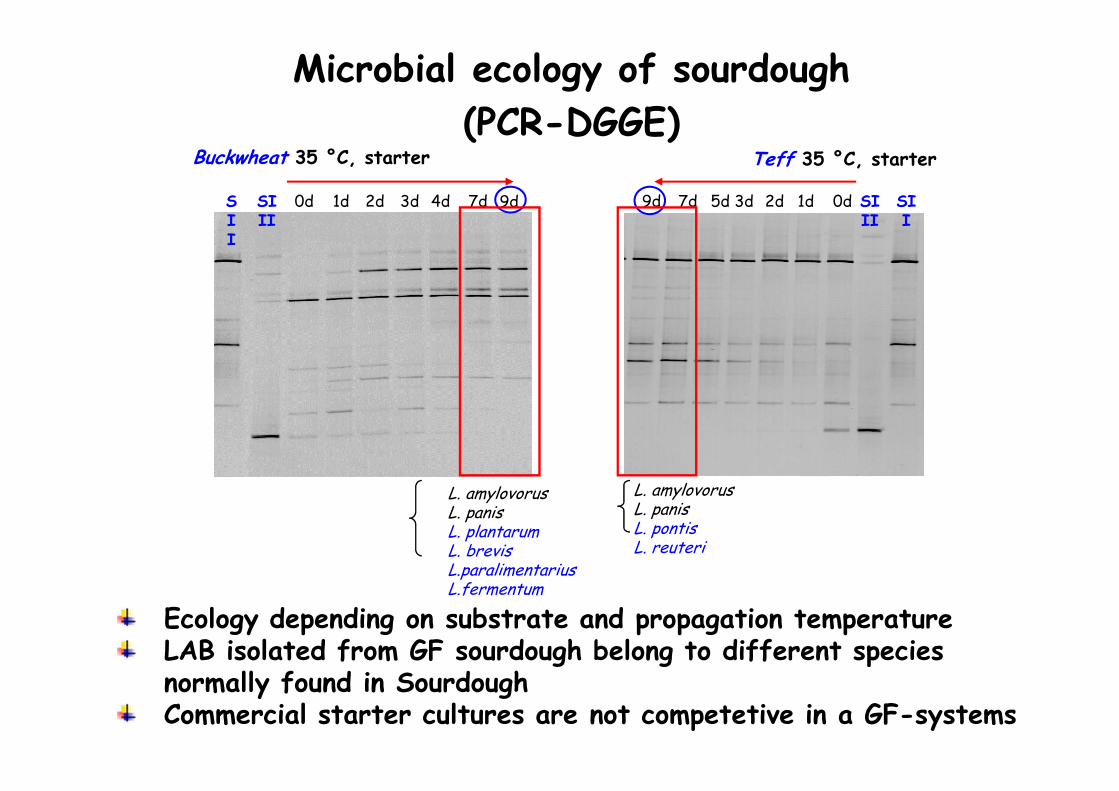
Microbial ecology of sourdough
(PCR-DGGE)
L. amylovorusL. panisL. plantarumL. brevis L.paralimentariusL.fermentum
Buckwheat 35 °C, starter
SII
SIII
0d 1d 2d 3d 4d 7d 9d 9d 7d 3d 2d 1d 0d SIII
SII
5d
Teff 35 °C, starter
L. amylovorusL. panis L. pontisL. reuteri
Ecology depending on substrate and propagation temperatureLAB isolated from GF sourdough belong to different species normally found in SourdoughCommercial starter cultures are not competetive in a GF-systems

Lactic acid bacteria producing EPS and their application

ExopolysaccharidesEPS
EPS are extracellularly secreted microbial polysaccharidesTheir amount and chemical structure depend on microorganism and substrateCereal associated lactic acid bacteria (LAB) are known to
produce EPS in large quantities
Two classes of EPS: homo- and heteropolysaccharides
HeteropolysaccharideComposed of repeated subunitsRepeating units consists of three to eight monosaccharidesSynthesised intracellularly from sugar nucleotide precursorsLow yield: <2g/l
HomopolysaccharideComposed of one type of monosaccharides (Glucose or Fructose)Synthesised by extracellular glycansucrases using sucroseUp to 50g/l
Laser-scanning electron microscopy of EPS LAB producing EPS
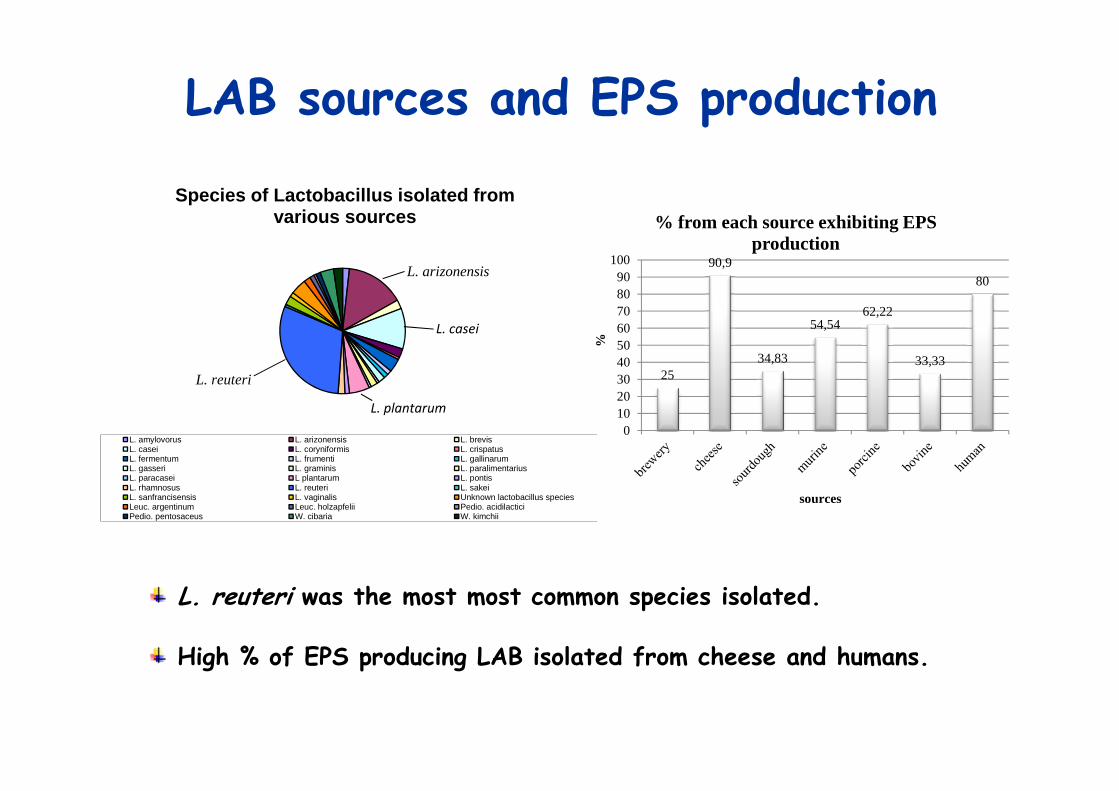
LAB sources and EPS production
Species of Lactobacillus isolated from various sources
L. amylovorus L. arizonensis L. brevisL. casei L. coryniformis L. crispatusL. fermentum L. frumenti L. gallinarumL. gasseri L. graminis L. paralimentariusL. paracasei L plantarum L. pontisL. rhamnosus L. reuteri L. sakeiL. sanfrancisensis L. vaginalis Unknown lactobacillus speciesLeuc. argentinum Leuc. holzapfelii Pedio. acidilacticiPedio. pentosaceus W. cibaria W. kimchii
L. reuteri
L. arizonensis
L. casei
L. plantarum
25
90,9
34,83
54,5462,22
33,33
80
0102030405060708090
100
%
sources
% from each source exhibiting EPS production
High % of EPS producing LAB isolated from cheese and humans.
L. reuteri was the most most common species isolated.

Experimental design - EPS
Characterization of EPS
Monomer composition
Molecular weight
Cell growth, pH
EPS-formation
Oligosaccharide-formation
Organic acids
Sorghum and wheat sourdough fermentation
Screening of LAB for EPS production
and isolation of EPS
Rheology
Type of linkage

W.cibaria MG1 in wheat and sorghum
Addition of EPS producing LAB in wheat
Increases in volume Decreases Hardness
Control MG1 con MG1 + suc
Addition of EPS producing LAB in sorghum
No effect on volume Decreases Hardness
36 g/l EPS(MRS-Suc)

Use of sourdough in GF baking -Conclusions
The use of sourdough in GF baking addition can lead to:
Increased Quality
specific sourdoughs are required for the different GF breads, and technologies have to be adapted accordingly
… but keep in mind that …
Volume
Crumb texture
Softness
Reduced staling
Nutritional benefits
Lower costsHigher Safety
Mould-free shelf life
Gluten removalReduced
complexity of recipe
e.g. no need of hydrocolloids
Gluten Free Bread -The New Generation

Objective
To produce a gluten-free products, which is of comparable quality to
wheat products
To produce a GF-products which takes the safety and nutritional
requirements of Coeliac patients into account

New Generation of Gluten free bread
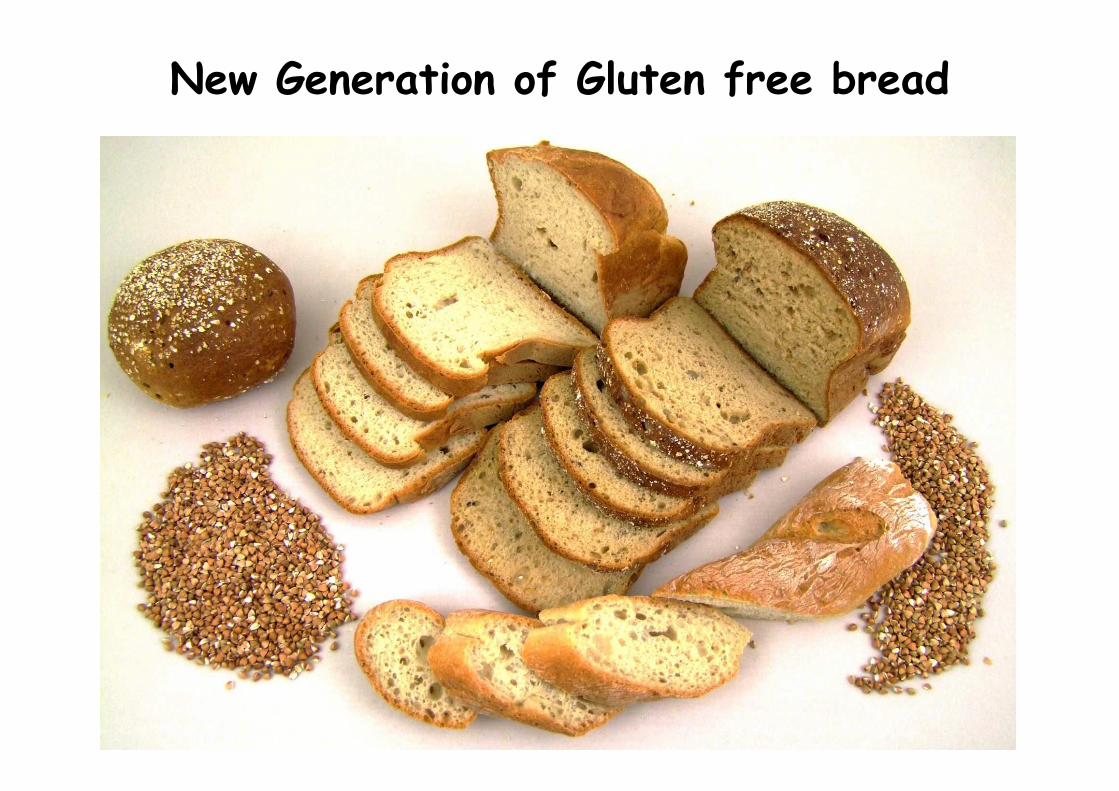
New Generation of Gluten free bread

NG-Gluten-free bread is softer and has a lower staling rate than wheat bread –
stays fresh for longer
Comparison of wheat and NG GF bread
0
5
10
15
20
25
30
35
0 1 2 3 4 5 6
Time [days]
Ha
rdn
ess
[N
]
Wheat
UCC
NG- Gluten free bread: specfic volume 3,5 ml/gcomparable to wheat and higher than most GF on
the market

Sensory evaluation
Comparison of new generation GF- bread with GF-Market leaders from different EU-countries (Panel 70
non celiacs and 35 celiacs)
65 % of both panels preferred UCC GF Bread
Comparison of Wheat bread and New Generation GF-bread (Panel of 70 non celiacs)
Panel could not distinguish between UCC GF and Wheat bread

Compositional analysis
Nutritional Information
Typical values per 100g of dry
product
Energy 219 kcal 296 kcal 204 kcal 196 – 311 Kcal
Protein 8.7g 8.4g 6.6 g 1.1 – 8.4 g
Carbohydrates
Of which sugar
43g
2.42g41.1g
3.0g
34.2 g 35.0 – 62.7
1.13 g
Fat
Of which saturates
1.4g
0.4g13.0g
0.9g
2.8 g 1,7 -15,6
Fibre 2.8g 9.7g 8.0 g 0,1 – 8.3
Sodium 0.45g 0.63g 0.62 g
Range based on market study
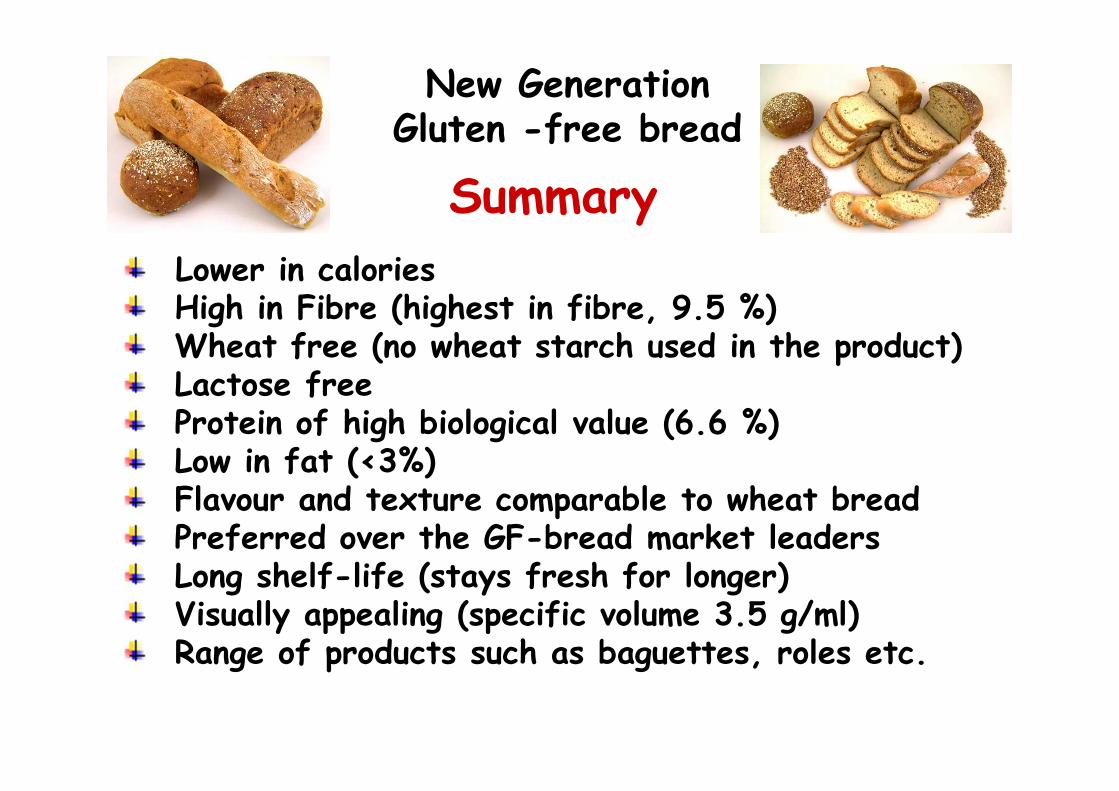
Summary
Lower in calories High in Fibre (highest in fibre, 9.5 %)Wheat free (no wheat starch used in the product)Lactose freeProtein of high biological value (6.6 %)Low in fat (<3%)Flavour and texture comparable to wheat breadPreferred over the GF-bread market leadersLong shelf-life (stays fresh for longer)Visually appealing (specific volume 3.5 g/ml)Range of products such as baguettes, roles etc.
New Generation Gluten -free bread

It is possible to produce a Gluten free bread comparable to wheat
bread
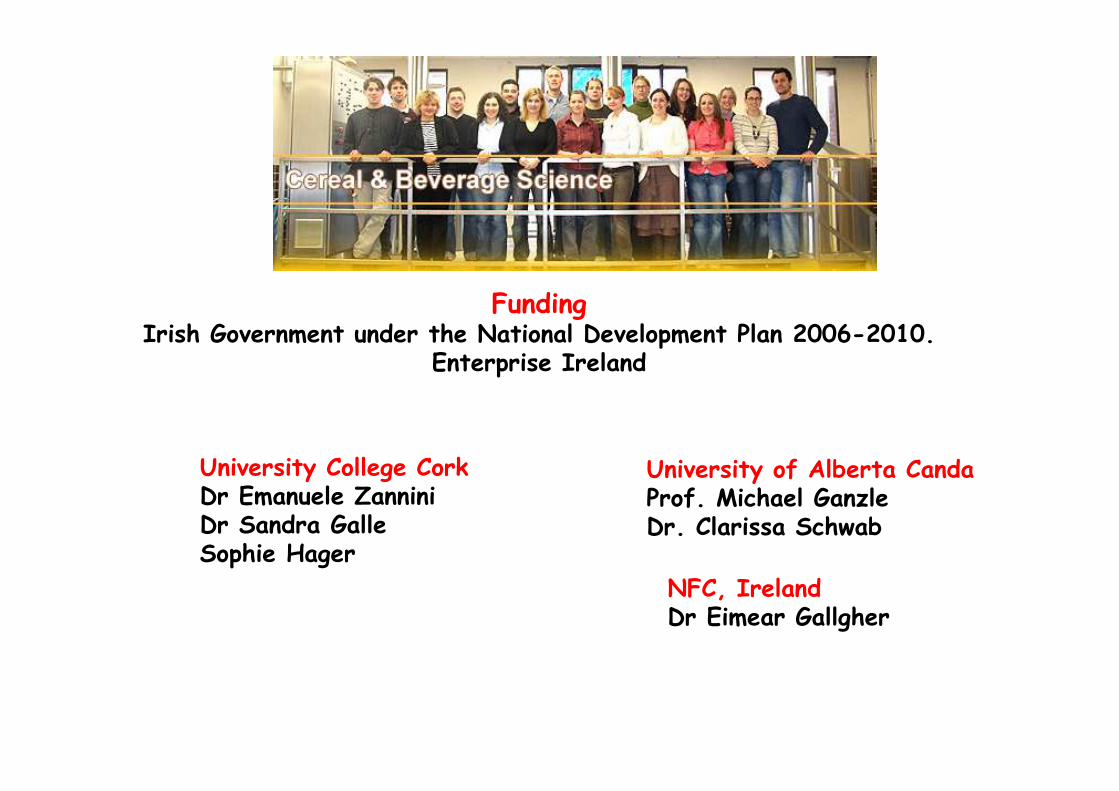
FundingIrish Government under the National Development Plan 2006-2010.
Enterprise Ireland
University College CorkDr Emanuele ZanniniDr Sandra GalleSophie Hager
University of Alberta CandaProf. Michael GanzleDr. Clarissa Schwab
NFC, IrelandDr Eimear Gallgher

School of Food and Nutritional Sciences, University College Cork, Ireland
Thank you very much
for your attention!