renew nsrp executive housing market · renew nsrp executive housing market september 2010 prepared...
TRANSCRIPT

RENEW NSRP Executive Housing Market September 2010 Prepared for Joanne Tyzzer, Darren Jones, Brian Davies North Staffordshire Regeneration Partnership Renew North Staffordshire Stoke City Council email: [email protected]
Arc4 contact David Cumberland / Ross Tolmie-Thomson Arc4 Ltd Beehive Mill Jersey Street Ancoats Manchester M4 6JG Tel +44 (0) 161 228 1689 email [email protected] [email protected]

arc4 RENEW NSRP Executive Housing Market Research Sept 2010 2 of 80
arc4 Beehive Mill Jersey Street Ancoats Manchester M4 6JG T: 0161 228 1689 F: 0161 228 6514 Email: [email protected] Website: www.arc4.co.uk Contents

arc4 RENEW NSRP Executive Housing Market Research Sept 2010 3 of 80
Section 1.0 Report Overview 4 Introduction 4 Section 2.0 Methodology 7 Current Executive Housing Market
Future Executive Housing Market Research Framework
8 9 9
Section 3.0 Executive Housing Market Definition 12 Section 4.0 Executive Housing Market Assessment 14 Current Executive Housing Market
Current high-end property market context Wider Housing Reference Area
14 17 22
Section 5.0 Strategic Policy context for housing delivery 25 Section 6.0 Demand for Executive Housing 31 Household income and ACORN profiles
Demographic and population projections Changes in employment and incomes
31 33 37
Section 7.0 Primary Fieldwork 38 Estate agent testimonies
Focus group attitudes and aspirations Developer perceptions
38 43 45
Section 8.0 Current supply of new build executive housing 48 Section 9.0 Developing an executive housing market 50 Section 10.0 Conclusions
Including recommendations 56 63
Appendices 65

arc4 RENEW NSRP Executive Housing Market Research Sept 2010 4 of 80
Section 1 Report overview 1.1 Introduction 1.1.1 Arc4 Ltd. has been commissioned by RENEW and NSRP to undertake an assessment of the
Executive Housing Market (EHM) in the North Staffordshire regeneration Partnership (NSRP) area, including the local authorities of Stoke, Newcastle-under-Lyme and Staffordshire Moorlands. The assessment framework is split into two distinctive areas: a review of the current EHM in terms of housing supply and demand profiles, then secondly an assessment of the future EHM in terms of market demand and developer potential. Stakeholder and consumer consultation has been an important component of this research, which ensures a wide range of views and expertise is captured in the research.
1.1.2 Under the aegis of the NSRP Business Plan, there is a priority within the housing and
regeneration frameworks to diversify the stock profile. Limited supply of high value executive housing assets (properties in the higher Council Tax bands G and H) is weakening the housing offer. Testing the housing markets appetite for increasing the supply of properties in tax bands E to H will feature heavily in the assessment process.
1.1.3 In summary this research
• Provides a definition of an executive housing market and the attributes of an exclusive housing product
• Explores the size and profiles of the current executive housing market in North Staffordshire
• Provides material on future executive housing aspirations based on market testing of the demand group and housing agents
• Reviews the potential for future executive housing delivery across the district based on developer and local planning authority perspectives.
1.1.4 There is a requirement to produce an evidence-based, focussed review of opportunities and identify issues pertaining to the suitability of developing executive housing on land both owned and identified with potential for this supply type.
1.1.5 The adopted Newcastle-under-Lyme and Stoke-on-Trent Core Spatial Strategy outlines that
in order to achieve the strategic aims both regionally and sub-regionally, substantial restructuring of the employment and residential offer in North Staffordshire is required. Although the Regional Spatial Strategy has been abolished, Stoke City Council are still working to the same housing growth numbers as before, since they have been included within the Core Strategy and were arrived at through thorough research of the evidence base.
1.1.6 The latest available indicators suggest that the existing provision for the executive market is
limited in North Staffordshire, specifically so within the city of Stoke-on-Trent. As outlined by the RENEW North Staffordshire Regeneration Partnership Business Plan 2008 – 2011, the sub region has a constrained supply of high-end market housing and the imbalance of housing supply is closely allied to the socio-economic profile and under performance of the area in retaining and attracting economically independent households.

arc4 RENEW NSRP Executive Housing Market Research Sept 2010 5 of 80
1.1.7 The latest Strategic Housing Market Assessment identified Stoke-on-Trent as a unique market in continuing to suffer population loss, in particular to neighbouring authorities Newcastle-under-Lyme and Staffordshire Moorlands (SHMA 2008). A contributory factor is the limited residential offer across the spectrum of the housing market, one of the main SHMA recommendations identifying the requirement for ‘more executive housing in the housing sectors shown to be disproportionately dominated by terraced dwellings’.
1.1.8 One of the principal objectives of the RENEW North Staffordshire Regeneration Partnership
Business Plan 2008 – 2011 in recognising the limited housing choice, is to provide a diversified residential offer. Providing the right type of dwellings, in the right location and environment will be key to addressing and reversing the trend of net population loss. An important factor for competitiveness in the knowledge economy is the extent to which places have a skilled, creative and entrepreneurial workforce. Employers will choose to locate partly on the basis of where this workforce is located and therefore the residential offer must be closely aligned with the aspirations of economically independent households.
1.1.9 We note that ‘top end of the market’ executive housing can also have a further significant
impact on the economy. The evidence suggests that residents of executive housing include a high proportion of entrepreneurs, with a consequent high level of business start-ups. This leads to establishment of new employment opportunities, often in locations convenient to the home of the entrepreneur.
1.1.10 One of the NSRP Business Plan priorities, in providing a portfolio of high quality/specification
detached houses or luxury apartments, seeks to meet the aspirations of existing and future residents on higher incomes, both in the interests of greater social inclusivity and to remove a barrier to the pursuit of economic prosperity. A broader housing choice is essential to accommodate the changing aspirations of the resident population and to retain graduates and attract new economically active households into the area.
1.1.11 Current housing supply throughout areas of Stoke-on-Trent, Newcastle-under-Lyme and
Staffordshire Moorlands, reflect an earlier pattern of economic structure and development that does not meet the current, nor future needs, for a balance of dwellings types and choice and the need to develop mixed communities.
1.1.12 Much of the offer within the constituent authorities competes for skilled workforce and
economically independent households with a limited residential offer. Issues of deprivation, worklessness and social exclusion are inextricably linked with poor quality housing and less desirable environments. Therefore, an improved residential offer and quality of place is essential to the creation of mixed and balanced communities and fundamental to improving the economic performance of the area (RENEW NSPR BP).
1.1.13 Creating sustainable, mixed communities coupled with high design quality and place making
is a key part of the Government’s approach to housing and planning policy going forward. Providing a quality residential offer is not about ‘gentrification’ alone, but about creating quality places through new development and interventions in existing neighbourhoods to provide a range of house types and tenures. It is the aim of RENEW and the NSRP that opportunities are identified to address the need for provision of a broader mix of housing supply across the intervention areas in the sub region.
1.1.14 This research provides an intelligence report examining the issues around the provision of
executive housing and developing a meaningful definition framed within a North Staffordshire context. The report provides an examination of both the local and regional housing market (in

arc4 RENEW NSRP Executive Housing Market Research Sept 2010 6 of 80
terms of depth of the potential market) and the planning supply context for the provision of executive housing. The report focuses in particular at recent experience of developing executive housing framed in the context of the local potential market demand, competing sites, migration, travel to work patterns, sales performance and land/site supply.
1.1.15 Our perspective is holistic. We do not see development and the supply of housing in
isolation. As such, we have examined the objectives of recent spatial planning policy at both the (now abolished) Regional Spatial Strategy and emerging Local Development Framework levels. This research paper looks to test the potential demand and requirement for larger executive developments within North Staffordshire.
1.1.16 Much has changed in the national and regional arenas since this report was commissioned, including the election of the Coalition Government and its abolition of whole swathes of regional governance including the Regional Development Agencies, Regional Assemblies and planned regional Leaders’ Boards, together with Regional Spatial Strategies. Further clarity around the new Local Economic Partnerships and the extent of their remit is awaited.

arc4 RENEW NSRP Executive Housing Market Research Sept 2010 7 of 80
Section 2 Methodology 2.1 Methodology 2.1.1 The research methodology has been mainly desk-based, with primary input from discussions
with the client on previous work and telephone interviews with local agents and relevant development stakeholders with specific delivery experience within this market. These include officers from the local authority planning departments, developers (both specialist and mainstream), estate and land agents. Linkages have also been drawn from feedback received from the focus group work undertaken as part of the wider contract brief.
2.1.2 Stage I – Strategic policy context for housing delivery in North Staffordshire.
Note that in this report, unless specifically stated otherwise, the description “North Staffordshire” is used to refer to the three Local Authorities that comprise the NSRP. Consolidation and review of literature outlining strategic planning policy for housing delivery in North Staffordshire, draws on the Local Development Frameworks, the (now abolished) Regional Economic, Housing and Spatial Strategies and findings of the Strategic Housing Market Assessment (SHMA). This is supplemented by a critique of the underlying vision for residential development in North Staffordshire. It is important that this analysis is provided in the context of the wider economic climate and the likely impact upon development of any kind going forward. A shift in market conditions and economic fundamentals has called into question the established development framework that operated previously, shown to be dependent upon the availability of credit for development and mortgage liquidity. Development across all market tenures now operates in a constrained marketplace, therefore it is important that the research draws clear links to the economic model update work for North Staffordshire being undertaken simultaneously by Experian. Consideration of the wider economic environment will provide an indication of potential quantum and viability for selected sites.
2.1.3 Stage II - Demand side trends
Market research of the local and sub-regional household profiles and secondary data analysis to establish a target market definition, the potential pool of demand and its share of the overall market. We have analysed population and household projections, migration and travel-to-work patterns, including identifying key local employers identified as sources of potential target market for this housing, demographic and household change and the findings of the latest Strategic Housing Market Assessment. This provides the context on the current and future demand profile for proposed executive housing development in North Staffordshire.
2.1.4 Stage III – Supply side trends and review of the experience and impact of executive housing
development elsewhere
In this stage we examine historic completion rates by type of property (including new build and conversions), outlining the relatively narrow supply within North Staffordshire in recent years compared to neighbouring locations. This analysis includes discussions with the

arc4 RENEW NSRP Executive Housing Market Research Sept 2010 8 of 80
respective planning departments to identify sources of existing property stock with potential for delivering executive type housing.
We undertook an examination of future supply to ascertain competing areas and developments through the SHLAA process, National Land Use Database schedule, Five Year Land Supply and current outstanding permissions data.
Desk-based, case study review of experience and impact of executive housing development in comparable housing markets. We appreciate that a comparable market to North Staffordshire may not exist explicitly, however the key success factors can be identified from executive housing development case studies and an analysis provided of the factors to be in place to underpin development of this type in the North Staffordshire market.
This element primarily aims to consolidate understanding and provision of a workable definition of executive housing in the North Staffordshire context. We have undertaken previous analysis of executive housing case studies and are well aware that this does not necessarily include volume-built, higher-end detached market housing. As noted above, provided the right location and environment, executive housing may include;
• Mix of bespoke detached properties at low density ie, Wynard, Stockton-on-Tees • Individual architect designed properties ie, Tutti Frutti Urban Splash, Manchester • Self build developments ie, Ashley Vale, Bristol • Environmentally sustainable developments ie, Accordia, Cambridge; Upton,
Northampton; Great Bow Yard, Somerset • New build period townhouses ie, The Square, York
2.1.5 Stage IV – Site locations and agent interviews
Analysis of the strategic potential sites is supplemented with local agent interviews examining the aspirations of those purchasing executive housing and areas of search for such housing to understand the depth of the potential market.
2.2 Current Executive Housing Market 2.2.2 The first phase of the assessment investigates the extent of housing in the North
Staffordshire sub-region, which fits the broad definition of an Executive product. Several secondary data sources were used to identify the extent of high property values and high incomes. This has included:
• Council Tax banding information for 2008 (based on property valuations at 1991);
• Land registry property sale values;
• Household Income 2008 (Annual Survey of Hours and Earnings).
2.2.3 The following variables are identified; the proportions of properties in Band ‘E to H’, property
values ‘£350-500k, £500k-£750k, £750+’ and household incomes of ‘£900+pw and £1k+pw’. Where data is available, results have been analysed on a number of geographical scales:
• Address level

arc4 RENEW NSRP Executive Housing Market Research Sept 2010 9 of 80
• Postcode sector • Lower SOAs • Wards
2.2.4 This information has been triangulated to produce a series of maps and tables identifying the
spatial extent of the current executive housing markets and the numbers in the market. 2.2.5 The second phase of the assessment has involved identifying households from the ASHE
data 2008 who command sufficient incomes and access to equity or savings, therefore form the primary target market for property deemed to be of executive housing standard. Detailed analysis of the selected market profile looks at the current property and household characteristics.
2.2.6 The third phase of the assessment was to define distinctive market typologies through a
process of qualitative and quantitative methods (see definition of executive housing below). This process brings together selective property and household characteristics to define executive housing products and demand behaviour.
2.2.7 A number of variables were used to develop market typologies. A series of profiles or short
case studies have been developed to illustrate these typologies with the context of North Staffordshire and its surrounding area. A number of case study examples from a range of national perspectives are provided in section 9.
2.3 Future Executive Housing Market 2.3.2 It is essential that the proposed market typologies are rigorously tested with housing
practitioners, who have a practical understanding of high value housing markets. A series of interviews, market area observations, and discussions with a range of stakeholders has taken place to test the emerging findings.
2.3.3 Aspirations for future development from the housing supplier and planning control
perspectives state the requirements necessary for future executive housing.
2.4 Research Framework 2.4.2 Our research approach is structured as follows and has been split into sections for ease of
access. Section Topic Background review
Stage 1 Strategic policy context for housing delivery in Stoke-on-Trent
Review of existing plans and strategies
• Examination of latest regional and local planning strategy;
• Examination of latest regional and local economic strategy;
• Adopted Stoke-on-Trent and Newcastle-under-Lyme Core Strategy; Staffordshire Moorlands Submission Core Strategy.
• RSS, The Regional Economic Strategy, NSRP Business Plan 2008-11; SHMA, Stoke-on-Trent AMR, Newcastle under Lyme AMR, Staffordshire Moorlands AMR,

arc4 RENEW NSRP Executive Housing Market Research Sept 2010 10 of 80
RENEW AMR 2008/09.
What is the existing position? • Where are the high value dwellings
located? • Executive housing supply in the planning
pipeline ie, benefit of detailed consent? • How do the constituent local authorities
stand in valid comparison within NSHMA and to adjacent markets?
• Where do current high earners live? • Correlation between the two
• Land Registry house price indices;
• Council Tax Register; • Mapping correlation of
properties and earners at ward and / or output area geographies;
• Latest NSHMA; • ONS neighbourhoods; • Supply pipeline data; • Travel to work data
comparison of resident and workplace based incomes;
• Income data by Lower Super Output Area / ward;
• Focus group feedback; • Estate agent feedback; • Council planning
departments feedback. Local housing market overview
• Overview of local market trends and differentiation of local housing markets.
• Land Registry; • New build market data. • Local economic drivers.
Demand analysis • Forecasts for current and future population
and household change; • Drivers and dynamics of population and
household change; • Migration and travel to work trends; • Socio-economic profiling; • What type of households? Neighbourhood
statistics analysis of socio-economic composition;
• Demand for executive housing, fuelled by demographic changes;
• Where are the gaps between demand and supply?;
• Growth of working age population; • Key areas of economic growth now and
forecast; • Potential constraints unique to the local
market, lifestyle offer etc.
• Population and household projections;
• Migration statistics into and within the Stoke Housing Market area and the sub-region;
• GDP statistics; • Local economic drivers; • ACORN profiling; • Neighbourhood
Statistics and NOMIS; • 2001 Census, ONS; • Population estimates,
ONS; • Annual Survey of Hours
and Earnings; • GIS mapping analysis. • Focus group feedback
Supply analysis • What has been built? An overview of
historic supply in the local authority market in terms of size, number and spatial
• Latest development supply pipeline statistics;

arc4 RENEW NSRP Executive Housing Market Research Sept 2010 11 of 80
location of executive housing; • What is being built? A review of planned
schemes and those under construction in respect of outstanding planning permissions, SHLAA and National Land Use Database;
• Locally determined growth strategy - supply targets;
• What reasonable quantum of executive housing should the local authorities be aiming for?
• What is the gap between existing demand and supply?
• Latest development capacity data;
• Developer feedback • Local authority planning
feedback.
Where do the three local authorities want to be?
• Current gap analysis between demand and supply profile;
• ‘Visions’ to be supplied by the respective local authorities
• Experian, ASHE; • SHMA • Council feedback and
emerging LDF documents

arc4 RENEW NSRP Executive Housing Market Research Sept 2010 12 of 80
Section 3 Executive Housing Market Definition 3.1 Introduction 3.1.1 Housing referred to as ‘executive’ is a vague market product and has eluded definitive
classification due to the many forms, densities, locations and contexts within which property referred to as ‘executive’ can be found. Indeed the term is often used, somewhat erroneously, to uplift the image of developments that would otherwise be classified as volume built housing. The term ‘executive’ may be allocated to new build developments in one location due to relative exclusivity in the context of resident household incomes, that may not be regarded as distinct developments in more affluent locations. Furthermore the term can be used dependent upon consumer perception and aspiration, in reference to new build bespoke properties, gated communities or period properties.
3.1.2 The term ‘executive’ equates to the most desirable and commonly, most expensive property
in a particular location. Executive markets are locations that generally operate on a regional basis, across regional housing markets due to their exclusivity, the operation of such not confined to local authority boundaries. Purchasers of executive housing will often travel over large distances to employment locations, due to the nature of the desired character of residence.
3.1.3 In broad terms, executive housing is acknowledged as, ‘High quality accommodation in low
density, suited to the needs and aspirations of higher income households’. 1 3.1.4 The first aspect of this research is to establish a meaningful definition of executive housing in
the North Staffordshire market context. An executive housing market is dependent upon the components of supply and demand. In these terms, a housing supply profile based on property prices, property sizes, dwelling types, interior specifications, outside space and location. A housing demand profile based on household income, equity and savings, household type, household size, household needs, length of occupancy, access to occupancy and business ownership.
3.1.5 Characteristics of an executive housing market would also include a clear linkage to the
national / international market, beneficial or at least low taxation, in terms of the location choice of industry and employment opportunities most conducive to business leaders, excellent environmental conditions, a contiguous executive or prime property market and associated lifestyle offer (discussed in further detail below).
3.1.6 An executive housing market can be defined in a number of ways combining the property
value, but including a suite of elements such as price, density, design, location and specification, in order to establish a meaningful definition. In addition to a price level, this may include for example factors such as low density (eg, approximating five units per acre), with large floor space in excess of 2,000sqft, offering facilities such as 4+ bedrooms, double garages and ensuite bedrooms or luxury apartments in desirable locations. They can include bespoke design and self-build and are generally in owner occupation.
1 Tomaney, J. Bradley, D. (2006). The economic role of mobile professional and creative workers and their housing residential preferences: evidence from North East England. Nathanial Lichfield and Partners. Centre for Urban and Regional
Development Studies, University of Newcastle upon Tyne. Newcastle.

arc4 RENEW NSRP Executive Housing Market Research Sept 2010 13 of 80
3.1.7 It is appreciated that in many markets and normal market conditions, property regarded as executive housing is likely to attract prices in excess £450,000. However a certain level of discount has been factored into our analysis for Stoke, in terms of both council tax banding and property pricing. This has been appropriate in order to capture the top end of the market for comparable properties with those in the adjacent local authorities of North Staffordshire. This approach has been informed by analysis of transaction levels across North Staffordshire and interviews with local agents active across the area, listed in appendix F. Our analysis therefore includes council tax banding E – H, rather than just G – H, to include the top end of the residential markets in each LA.
3.1.8 In addition our analysis of the depth of the top end market in North Staffordshire has
identified disparities in achieved property values. Analysis of the depth of this market represented by transaction activity identified a number of price bands.
3.1.9 As we outline in section four below there are a significantly higher number of transactions
recorded in Staffordshire Moorlands and Newcastle-under-Lyme for properties in excess of £400,000 compared to Stoke. The justification for adopting a £400,000 threshold for upper market housing is two-fold. Namely this property value reflects the council tax discount for Stoke encompassing a comparable upper-end market within bands E-H. Secondly the feedback from considerable focus group work with local agents and residents identified this level at which properties were considered to be upper market in Stoke.
3.1.10 Therefore the value ranges we have identified and will use in this assessment of current
high-end property transactions include;
• £400 - £500K range covers the ‘very high end’ property stock in Stoke and ‘high end’ property in Newcastle-under-Lyme and Staffordshire Moorlands;
• £500 - £750K range covers the ‘exceptional and exclusive’ properties in Stoke and the ‘very high end’ properties in Newcastle-under-Lyme and Staffordshire Moorlands;
• £750K+ covers the ‘exceptional and exclusive’ properties in Newcastle-under-Lyme and Staffordshire Moorlands.
3.1.11 Below we examine the current upper end housing offer demand in terms of both transaction
levels and housing type. This will inform the recommendations as to the housing typologies and characteristics comprising a conducive ‘Quality of Place’ and residential offer in our case study section. An explanation of the relationship between these aspects is discussed in section 9.

arc4 RENEW NSRP Executive Housing Market Research Sept 2010 14 of 80
Section 4 Executive Housing Market Assessment Current Executive Housing Market 4.1.1 As Table 4.1 illustrates the buying activity of detached properties in the three local authorities
of North Staffordshire over the last three years highlights properties commanding prices in excess of £750,000 and £1M in Newcastle-under-Lyme and Staffordshire Moorlands. In comparison the top end of the Stoke market is represented by a market high of 0.9% during 2008 of between £500,000 - £600, 000 (Land Registry, Q2 2009).
4.1.2 The analysis has focussed upon detached property transactions due to nominal levels of
activity in the higher price categories for other property types such as flats, semi-detached and terraced properties. We appreciate that in certain markets the executive market has the potential to include properties of these types, such as prime location flats and townhouses. We identify the current demand levels for these alternative housing types in the higher price bands in section 4.2 below.
Table 4.1: Buying activity detached properties North Staffordshire 2007 – 2009 to date
Stoke 2007 2008 2009
Nos % Nos % Nos %
Under 100K 29 2.9% 26 4.8% 7 5.5%
100 -150K 215 21.7% 114 20.9% 55 43.0%
150 - 200 347 34.9% 200 36.6% 49 38.3%
200 - 300 283 28.5% 147 26.9% 13 10.2%
300 - 400 76 7.7% 40 7.3% 3 2.3%
400 - 500 38 3.8% 14 2.6% 1 0.8%
500-600 5 0.5% 5 0.9% 0 0.0%
Total 993 100.0% 546 100.0% 128 100.0%
Newcastle-under-Lyme 2007 2008 2009
Nos % Nos % Nos %
Under 100K 7 1.4% 4 1.2% 4 3.8%
100 -150K 63 12.8% 45 13.4% 18 17.0%
150 - 200 211 42.7% 117 34.9% 30 28.3%
200 - 300 132 26.7% 103 30.7% 39 36.8%
300 - 400 52 10.5% 48 14.3% 9 8.5%
400 - 500 21 4.3% 7 2.1% 4 3.8%
500-750 7 1.4% 10 3.0% 1 0.9%
750-1M 1 0.2% 0 0.0% 0 0.0%
1M+ 0 0 1 0.3% 1 0.9%
Total 494 100.0% 335 100.0% 106 100.0%
Staff Moors 2007 2008 2009
Nos % Nos % Nos %
Under 100K 9 1.2% 6 1.8% 4 3.5%
100 -150K 232 30.4% 40 11.9% 23 20.4%
150 - 200 174 22.8% 96 28.6% 27 23.9%
200 - 300 221 29.0% 128 38.1% 40 35.4%
300 - 400 81 10.6% 41 12.2% 12 10.6%
400 - 500 32 4.2% 19 5.7% 4 3.5%
500-750 12 1.6% 6 1.8% 3 2.7%
arc4 RENEW NSRP Executive Housing Market Research Sept 2010 15 of 80
750-1M 1 0.1% 0 0.0% 0 0.0%
1M+ 1 0.1% 0 0.0% 0 0.0%
Total 763 100.0% 336 100.0% 113 100.0%
Source: Land Registry Q2 2009
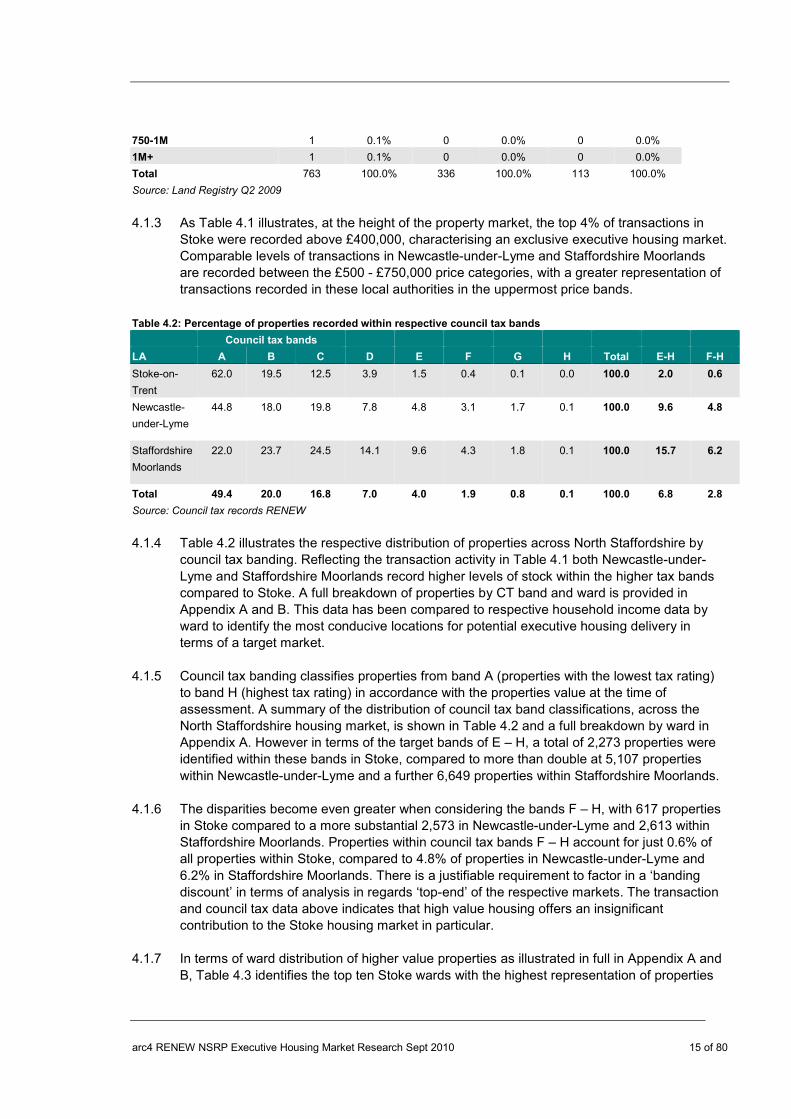
4.1.3 As Table 4.1 illustrates, at the height of the property market, the top 4% of transactions in
Stoke were recorded above £400,000, characterising an exclusive executive housing market. Comparable levels of transactions in Newcastle-under-Lyme and Staffordshire Moorlands are recorded between the £500 - £750,000 price categories, with a greater representation of transactions recorded in these local authorities in the uppermost price bands.
Table 4.2: Percentage of properties recorded within respective council tax bands
Council tax bands
LA A B C D E F G H Total E-H F-H
Stoke-on-
Trent
62.0 19.5 12.5 3.9 1.5 0.4 0.1 0.0 100.0 2.0 0.6
Newcastle-
under-Lyme
44.8 18.0 19.8 7.8 4.8 3.1 1.7 0.1 100.0 9.6 4.8
Staffordshire
Moorlands
22.0 23.7 24.5 14.1 9.6 4.3 1.8 0.1 100.0 15.7 6.2
Total 49.4 20.0 16.8 7.0 4.0 1.9 0.8 0.1 100.0 6.8 2.8
Source: Council tax records RENEW
4.1.4 Table 4.2 illustrates the respective distribution of properties across North Staffordshire by
council tax banding. Reflecting the transaction activity in Table 4.1 both Newcastle-under-Lyme and Staffordshire Moorlands record higher levels of stock within the higher tax bands compared to Stoke. A full breakdown of properties by CT band and ward is provided in Appendix A and B. This data has been compared to respective household income data by ward to identify the most conducive locations for potential executive housing delivery in terms of a target market.
4.1.5 Council tax banding classifies properties from band A (properties with the lowest tax rating)
to band H (highest tax rating) in accordance with the properties value at the time of assessment. A summary of the distribution of council tax band classifications, across the North Staffordshire housing market, is shown in Table 4.2 and a full breakdown by ward in Appendix A. However in terms of the target bands of E – H, a total of 2,273 properties were identified within these bands in Stoke, compared to more than double at 5,107 properties within Newcastle-under-Lyme and a further 6,649 properties within Staffordshire Moorlands.
4.1.6 The disparities become even greater when considering the bands F – H, with 617 properties
in Stoke compared to a more substantial 2,573 in Newcastle-under-Lyme and 2,613 within Staffordshire Moorlands. Properties within council tax bands F – H account for just 0.6% of all properties within Stoke, compared to 4.8% of properties in Newcastle-under-Lyme and 6.2% in Staffordshire Moorlands. There is a justifiable requirement to factor in a ‘banding discount’ in terms of analysis in regards ‘top-end’ of the respective markets. The transaction and council tax data above indicates that high value housing offers an insignificant contribution to the Stoke housing market in particular.
4.1.7 In terms of ward distribution of higher value properties as illustrated in full in Appendix A and
B, Table 4.3 identifies the top ten Stoke wards with the highest representation of properties

arc4 RENEW NSRP Executive Housing Market Research Sept 2010 16 of 80
in the uppermost council tax bands. The three wards of Trentham and Hanford (30%), Meir Park and Sandon (16.9%) and Abbey Green (11.2%) contain almost two-thirds of all Stoke properties within bands E – H, at 58.1%.
Table 4.3: Top ten Stoke wards recording highest valued properties council tax bands E - H Ward name E F G H E-H Total (%) F-H Total (%)
Abbey Green 3.4 1.1 0.1 0.0 4.7 1.3
Blurton 2.2 0.9 0.1 0.0 3.2 1.0
Chell and Packmoor 0.8 0.0 0.0 0.0 1.0 0.1
East Valley 1.8 0.9 0.1 0.0 2.8 1.0
Hartshill and Penkhull 1.5 0.4 0.1 0.2 2.1 0.7
Longton South 1.9 0.3 0.1 0.0 2.3 0.4
Meir Park and Sandon 4.8 2.1 0.2 0.0 7.1 2.3
Northwood and Birches Head 1.5 0.0 0.0 0.0 1.5 0.0
Norton and Bradeley 0.9 0.1 0.1 0.0 1.2 0.2
Trentham and Hanford 9.6 2.2 0.7 0.2 12.6 3.1
Source: RENEW
4.1.8 In terms of ward distribution of higher value properties as illustrated in full in Appendix A and
B, Table 4.4 identifies the top ten Newcastle-under-Lyme wards with the highest representation of properties in the uppermost council tax bands. The three wards of Loggerheads and Whitmore (25.2%), Westlands (16.6%) and Keele (15.7%) contain almost half of all Newcastle-under-Lyme properties within bands E – H, at 47.5%.
Table 4.4: Top ten Newcastle-under-Lyme wards recording highest valued properties council tax bands E – H
Ward name E F G H E-H F-H
Audley and Bignall End 4.3 1.3 0.3 0.0 5.9 1.6
Halmerend 12.1 8.8 3.0 0.4 24.2 12.1
Keele 18.2 12.3 5.1 1.9 37.6 19.4
Loggerheads and Whitmore 24.6 17.8 17.2 0.4 60.0 35.4
Madeley 9.3 7.5 1.7 0.2 18.7 9.3
May Bank 2.2 1.7 1.3 0.0 5.2 3.0
Newchapel 3.1 1.1 0.1 0.0 4.3 1.2
Seabridge 11.2 2.5 0.2 0.0 13.9 2.7
Thistleberry 8.1 4.1 0.7 0.0 13.0 4.9
Westlands 14.2 18.0 7.3 0.0 39.6 25.4
Source: RENEW 4.1.9 In terms of ward distribution of higher value properties as illustrated in full in Appendix A and
B, Table 4.5 identifies the top ten Staffordshire Moorlands wards with the highest representation of properties in the uppermost council tax bands. The three wards of Horton (12.1%), Dane (10.5%) and Bagnall and Stanley (9.0%) contain over one-third of all Staffordshire Moorlands properties within bands E – H, at 31.6%. As indicated in Appendix B map B3, the distribution of higher valued properties is more widespread across the authority in comparison to the pockets of higher value stock in Newcastle-under-Lyme and in far fewer proportions in Stoke.
Table 4.5: Top ten Staffordshire Moorlands wards recording highest valued properties council tax bands E – H Ward name E F G H E-H F-H
Alton 24.1 10.4 4.8 0.3 39.6 15.6

arc4 RENEW NSRP Executive Housing Market Research Sept 2010 17 of 80
Bagnall and Stanley 22.1 19.4 9.1 0.0 50.6 28.5
Biddulph North 14.0 4.5 2.6 0.0 21.1 7.1
Caverswall 14.9 7.2 4.2 0.1 26.5 11.6
Cheddleton 13.2 6.6 1.7 0.2 21.7 8.5
Dane 26.2 22.7 9.2 0.9 59.0 32.8
Hamps Valley 22.2 8.9 4.1 0.3 35.6 13.3
Horton 21.5 27.0 19.5 0.4 68.4 46.9
Ipstones 19.1 7.8 2.6 0.1 29.6 10.5
Manifold 26.7 10.1 4.0 0.0 40.8 14.1
Source: RENEW
4.1.10 The distribution of properties in council tax bands E – H is shown in Appendix B1 – B3. It is
clear that higher value property makes a nominal contribution to the overall housing stock in Stoke as a local authority. In Newcastle-under-Lyme, there appears to be a clear distinction between the north and east of the local authority with a low representation of higher valued stock compared to the south in particular in Loggerheads and Whitmore, Keele and Westlands and west such as in Halmerend and Madeley.
4.1.11 Higher value property appears to represent a greater proportion and wider distribution of
property stock in Staffordshire Moorlands, particularly towards the east of the district in the National Park (Appendix Map B3).
4.2 Current ‘high-end’ property market context 4.2.1 Land Registry sales data was examined for the period Q1 2005 – Q2 2009. The dataset
comprises 31,702 individual residential sales records from open market transactions in the three local authorities of North Staffordshire, over the four-year period. By way of comparison the rate of private sector turnover is far greater in Stoke at 18,839 transactions over this period, compared to 7,139 in Newcastle-under-Lyme and 5,724 sales in Staffordshire Moorlands within this period.
4.2.2 In terms of analysing the depth of the high-end property market in North Staffordshire,
unsurprisingly a significantly higher number of transactions have been recorded in Staffordshire Moorlands and Newcastle-under-Lyme for properties in excess of £400,000 compared to Stoke. The justification for adopting a £400,000 threshold for upper market housing is two-fold. Namely this property value reflects the council tax discount for Stoke encompassing a comparable upper-end market within bands E-H. Secondly the feedback from considerable focus group work with local agents and residents identified this level at which properties were considered to be in the highest market.
4.2.3 The total number of recorded transactions above this threshold between Q1 2007 and Q2
2009 was 63 sales in Stoke. All sales were existing stock apart from two new build sales and all apart from three being detached properties. Table 4.6 identifies those ‘high-end’ non-detached property sales over this period, illustrating the constrained demand for upper market housing typologies from the traditional detached type. Each transaction was recorded as an existing semi-detached property within a suburban / rural location.
Table 4.6: Non-detached upper market property transactions - Stoke
Price Type New Build / Existing Post Code Ward Name Rural / Suburban / Urban
£370,000 Semi Existing ST3 5YD Longton North Suburban / Rural
£379,950 Semi Existing ST4 8XJ Trentham & Hanford Suburban / Rural

arc4 RENEW NSRP Executive Housing Market Research Sept 2010 18 of 80
£395,000 Semi Existing ST2 9DD Berryhill & Hanley East Suburban / Rural
Source: RENEW, Land Registry
4.2.4 In Newcastle-under-Lyme the number of transactions above this threshold was 53. All sales
were existing stock apart from four new build sales and all sales except 17 being detached properties, 9 semi-detached and 8 terraced. Table 4.7 identifies those ‘high-end’ non-detached property sales over this period, illustrating the depth of upper market housing typologies from the traditional detached type. Each transaction was recorded as an existing property apart from two new builds, the majority within a rural / suburban location. Notably there is an equal representation of larger terraced / townhouse and semi-detached properties.
Table 4.7: Non-detached upper market property transactions – Newcastle-under-Lyme
Price Type New Build / Existing Post Code Ward Name Rural / Suburban / Urban
£750,000 T Existing ST5 0QW May Bank Suburban
£760,000 T Existing TF9 4HE
Loggerheads and
Whitmore Rural
£775,000 S Existing ST5 5HB
Loggerheads and
Whitmore Rural
£595,000 T Existing TF9 2PA
Loggerheads and
Whitmore Rural
£495,000 T Existing TF9 2PA
Loggerheads and
Whitmore Rural
£500,000 S Existing ST5 0QN May Bank Urban / Suburban
£520,000 T New Build TF9 4NA
Loggerheads and
Whitmore Rural
£350,000 T Existing TF9 4HJ
Loggerheads and
Whitmore Rural
£350,000 S Existing CW3 9QL Madeley Rural
£355,000 S Existing CW3 9AN Halmerend Rural / Suburban
£375,000 S Existing ST5 3LT Westlands Suburban / Urban
£377,500 S Existing ST5 1DP Town Urban / Suburban
£385,000 S Existing TF9 2QH
Loggerheads and
Whitmore Rural
£389,950 S Existing TF9 4NB
Loggerheads and
Whitmore Rural
£397,000 S New Build ST5 3JG Westlands Rural / Suburban
£429,000 T Existing ST5 2NF Thistleberry Suburban
£475,000 T Existing ST5 3GZ Knutton and Silverdale Rural / Suburban
Source: RENEW, Land Registry
4.2.5 In Staffordshire Moorlands 78 transactions were recorded above £400,000. All sales were
existing stock apart from seven new build sales and all sales except 39 being for detached properties. Table 4.8 identifies those ‘high-end’ non-detached property sales over this period, illustrating the depth of upper market housing typologies from the traditional detached type. Each transaction was recorded as an existing property apart from two new builds, the majority within a rural / suburban location. Notably there is an equal representation of larger terraced / townhouse and semi-detached properties, with only one recorded sale for a flat within this market.

arc4 RENEW NSRP Executive Housing Market Research Sept 2010 19 of 80
Table 4.8: Non-detached upper market property transactions – Staffordshire Moorlands
Source: RENEW, Land Registry
4.2.6 As the tables above indicate there is a considerable paucity of new build executive property
supply on the current market throughout the three authorities of North Staffordshire. The total number of new build sales in this sector across the three authorities being 13 sales over this period. The main focus of transaction activity within the high end market recorded within existing properties within a rural and suburban location. This feature of the North Staffordshire executive market is highlighted within section 6 agent and developer interviews
Price Type New Build / Existing Post Code Ward Name Rural / Suburban / Urban
£370,000 T Existing ST13 5LR Leek East Rural / Suburban
£440,000 S Existing ST13 8JS Leek North Rural / Suburban
£365,000 S Existing ST13 8DL Leek West Suburban / Rural
£495,000 S Existing ST10 4JH Checkley Rural
£980,000 S Existing CW12 3QJ Horton Rural
£370,000 T Existing ST9 9PS Bagnall and Stanley Rural
£390,000 T Existing SK17 0NZ Manifold Rural
£360,000 S Existing ST9 9NJ Bagnall and Stanley Rural
£400,000 S Existing ST13 5PA Leek South Suburban
£370,000 S Existing ST13 7EA Cheddleton Rural
£400,000 S Existing ST11 9BG Forsbrook Rural
£450,000 T Existing ST9 9NS Bagnall and Stanley Rural
£385,000 T Existing ST13 6AB Leek North Urban
£481,000 S Existing ST10 4BN Alton Rural
£364,000 T Existing ST9 9LX Bagnall and Stanley Rural
£570,000 S Existing ST8 6QP Biddulph North Suburban
£670,000 F New Build DE6 2FR Hamps Valley Rural
£365,000 S Existing ST11 9HQ Forsbrook Suburban / Rural
£404,000 T Existing ST9 9QF Horton Rural
£950,000 S Existing SK11 0RF Dane Rural
£357,000 S Existing ST13 5SB Leek East Suburban / Rural
£480,000 S Existing ST13 8SB Leek North Rural
£430,000 S Existing ST13 5EZ Leek North Urban
£395,000 T Existing ST13 8SA Leek North Rural
£375,000 T Existing ST13 7AL Leek South Rural
£590,000 S Existing ST13 7QZ Hamps Valley Rural
£500,000 T Existing ST10 2BA Churnet Rural
£370,000 T Existing ST13 8RN Horton Rural
£600,000 T Existing ST13 5RD Leek South Rural
£410,000 S New Build ST10 3BQ Alton Rural
£440,000 T Existing ST9 0BA Cheddleton Rural
£425,000 T Existing ST8 7PS Biddulph South Rural
£430,000 T Existing ST8 7RS Biddulph North Rural
£660,000 S Existing ST10 4AP Alton Rural
£385,000 S Existing ST10 4BH Alton Rural
£595,000 S Existing ST13 8SH Dane Rural
£350,000 S Existing ST9 9DY
Brown Edge and
Endon Rural
£350,000 S Existing ST13 8PU Horton Rural

arc4 RENEW NSRP Executive Housing Market Research Sept 2010 20 of 80
below. Illustrating a distinct absence of new build property currently on the market, the highest priced new build stock in North Staffordshire is £259,995, volume-built and not representative of an executive market according to the definitions provided.
4.2.7 The value ranges used in this assessment of current high-end property transactions include;
• £400 - £500K range covers the ‘very high end’ property stock in Stoke and ‘high end’ property in Newcastle-under-Lyme and Staffordshire Moorlands;
• £500 - £750K range covers the ‘exceptional and exclusive’ properties in Stoke and the ‘very high end’ properties in Newcastle-under-Lyme and Staffordshire Moorlands;
• £750K+ covers the ‘exceptional and exclusive’ properties in Newcastle-under-Lyme and Staffordshire Moorlands.
4.2.8 Identified property sales within the three high-end value ranges are broken down by ward
and local authority in Tables 4.9 – 4.11 below. Table 4.9: High end house price transactions by ward - Stoke
Ward name £400 -
£500K
£500 -
£750K
£750K+
Abbey Green 2
Bentilee and Townsend 1
Berryhill and Hanley East 1
Blurton 1
Burslem North 1
East Valley 4
Longton North 1
Meir Park and Sandon 1
Northwood and Birches Head 1
Stoke and Trent Vale 1
Trentham and Hanford 9 1
Source: Land Registry, RENEW
4.2.9 As illustrated in Table 4.9, only one property could be classified as ‘exclusive and
exceptional’ in terms of price, this property recorded in the Trentham and Hanford ward. As we have illustrated elsewhere, this ward comprises the highest proportion of private sector stock in the highest council tax bands and the highest average household income of Stoke wards.
4.2.10 Stoke has a highly constrained supply of high value housing. Indeed the fact that all but one
property has been sold for sub-£500,000 would indicate that compared to some higher value areas an executive housing product does not exist.
4.2.11 Table 4.10 illustrates the higher representation of high value properties within Newcastle-
under-Lyme. A total of 130 transactions are recorded within the ‘high-end’ range, 18 sales within the ‘very-high’ range and 6 within the ‘exceptional’ range. These transactions are recorded within the ward of Loggerheads and Whitmore and include a sale in excess of £1.1M. The wards of Westlands, Halmerend and May Bank also record representation within the ‘very high’ range.
Table 4.10: High end house price transactions by ward - Newcastle-under-Lyme

arc4 RENEW NSRP Executive Housing Market Research Sept 2010 21 of 80
Ward name £400 -
£500K
£500 -
£750K
£750K+
Audley and Bignall End 2
Halmerend 9 3
Keele 1
Knutton and Silverdale 1
Loggerheads and Whitmore 42 7 6
Madeley 3 1
May Bank 5 2
Newchapel 3
Seabridge 3
Thistleberry 5 1
Town 3
Westlands 27 4
Wolstanton 1
Source: Land Registry, RENEW
4.2.12 Table 4.11 illustrates the higher representation of high value properties within Staffordshire
Moorlands. A total of 145 transactions are recorded within the ‘high-end’ range, 30 sales within the ‘very-high’ range and 8 within the ‘exceptional’ range. These transactions are recorded within six wards and include sales in excess of £1M.
Table 4.11: High end house price transactions by ward – Staffordshire Moorlands
Ward name £400 -
£500K
£500 -
£750K
£750K+
Alton 7 1
Bagnall and Stanley 10 1
Biddulph Moor 2
Biddulph North 8 2 1
Biddulph South 1
Brown Edge and Endon 5 1
Caverswall 2 1
Cheadle South East 1
Cheadle West 1
Checkley 5 1 1
Cheddleton 12
Churnet 5 4
Dane 6 2 1
Forsbrook 9 1
Halmerend 1
Hamps Valley 6 2 2
Horton 15 9 1
Ipstones 8
Leek East 8
Leek North 9 1
Leek South 7 1
Leek West 3
Manifold 10 3 2
Tutbury and Outwoods 1

arc4 RENEW NSRP Executive Housing Market Research Sept 2010 22 of 80
Werrington 3
Source: Land Registry, RENEW
4.3 Wider Housing Reference Area 4.3.1 As the research identifies, the market for executive housing operates over a wide area,
larger than housing markets are normally defined. The market is often described as regional, but as North Staffordshire sits on the boundary of two regions it is appropriate to consider a cross-regional wider market area. Following consultation, we based it on the wider reference area for the North Staffordshire housing market and included the (pre-reorganisation) LA areas of Crewe and Nantwich, Congleton, Stafford and North Shropshire. .
4.3.2 Table 4.12 illustrates the buying activity of detached properties in this wider housing reference area over the last three years. The number of properties commanding prices in excess of £500,000 - £1M in North Shropshire represents 4.5% of the total market, higher than that in Newcastle-under-Lyme and Staffordshire Moorlands. The volume of transactions at £400K-£500K records almost 10% of the total market share of detached sales. In terms of sales volumes, North Shropshire is comparable with Newcastle-under-Lyme
4.3.3 In terms of transaction volumes, Stafford records a considerable number of sales within the
higher price bands, comparable with, though slightly higher in numerical terms with Staffordshire Moorlands over the three-year period. Comparable levels of transactions in the higher price categories are recorded, including individual exceptional priced sales in excess of £1M.
4.3.4 The analysis has focussed upon detached property transactions due to nominal levels of
activity in the higher price categories for other property types such as flats, semi-detached and terraced properties. In Stafford sales of these property types recorded over this three year period were 8 semi-detached between £400-£500K, no flats and 4townhouse / terraced properties. No transactions recorded for these types over £500,000.
Table 4.12: Buying activity wider Housing Reference Area 2007 – 2009 to date
North Shropshire 2007 2008 2009
Nos % Nos % Nos %
Under 100K 5 1.2% 3 1.2% 2 2.5%
100 -150K 20 4.8% 12 4.8% 9 11.3%
150 - 200 103 24.8% 55 21.9% 26 32.5%
200 - 300 159 38.3% 105 41.8% 25 31.3%
300 - 400 80 19.3% 42 16.7% 10 12.5%
400 - 500 30 7.2% 24 9.6% 7 8.8%
500-750 16 3.9% 8 3.2% 1 1.3%
750-1M 2 0.5% 2 0.8% 0 0.0%
Total 415 100.0% 251 100.0% 80 100.0%
Stafford 2007 2008 2009
Nos % Nos % Nos %
Under 100K 5 0.8% 2 0.6% 3 1.9%
100 -150K 27 4.1% 13 3.7% 23 14.6%
150 - 200 147 22.3% 75 21.1% 39 24.8%
200 - 300 301 45.7% 160 45.1% 59 37.6%
300 - 400 120 18.2% 60 16.9% 19 12.1%

arc4 RENEW NSRP Executive Housing Market Research Sept 2010 23 of 80
400 - 500 38 5.8% 21 5.9% 9 5.7%
500-750 17 2.6% 20 5.6% 5 3.2%
750-1M 1 0.2% 3 0.8% 0 0.0%
1M+ 2 0.3% 1 0.3% 0 0.0%
Total 658 100.0% 355 100.0% 157 100.0%
Congleton 2007 2008 2009
Nos % Nos % Nos %
Under 100K 7 1.0% 3 1.0% 3 2.9%
100 -150K 16 2.4% 19 6.2% 17 16.2%
150 - 200 112 16.7% 51 16.7% 33 31.4%
200 - 300 339 50.7% 146 47.9% 36 34.3%
300 - 400 112 16.7% 52 17.0% 9 8.6%
400 - 500 49 7.3% 21 6.9% 4 3.8%
500-750 31 4.6% 12 3.9% 2 1.9%
750-1M 3 0.4% 0 0.0% 1 1.0%
1M+ 0 0.0% 1 0.3% 0 0.0%
Total 669 100.0% 305 100.0% 105 100.0%
Crewe and Nantwich 2007 2008 2009
Nos % Nos % Nos %
Under 100K 2 0.3% 4 1.3% 3 2.3%
100 -150K 52 8.3% 41 13.0% 22 17.2%
150 - 200 170 27.0% 86 27.3% 31 24.2%
200 - 300 224 35.6% 104 33.0% 37 28.9%
300 - 400 87 13.8% 46 14.6% 21 16.4%
400 - 500 70 11.1% 15 4.8% 12 9.4%
500-750 20 3.2% 15 4.8% 2 1.6%
750-1M 2 0.3% 4 1.3% 0 0.0%
1M+ 2 0.3% 0 0.0% 0 0.0%
Total 629 100.0% 315 100.0% 128 100.0%
Source: Land Registry Q2 2009
4.3.5 As Table 4.12 illustrates, the buying activity of detached properties in the wider South
Cheshire area incorporating Congleton and Crewe and Nantwich over the last three years has declined significantly in line with the wider market trends. In Congleton, in terms of absolute transaction levels and distribution of stock, similar trends are drawn with Staffordshire Moorlands. However in both Congleton and Crewe and Nantwich a higher concentration of sales are recorded in the mid-range executive properties namely £400K - £500K price band.
4.3.6 The analysis of the extent of the respective executive markets across the wider housing
market reference area identifies the comparative lack of housing being sold within this sector in Stoke-on-Trent in particular. The majority of transactions at this level are recorded for existing detached properties.
4.3.7 The overall position is shown in Table 4.13. To give a snapshot, it is probably reasonable to consider the annual level of transactions at prices of £500k and over, based on 2007 and 2008. This covers a year that had buoyant activity and one of declining activity. The figures for the first half of 2009 are much lower, and represent a depressed rather than a normal market. On this basis, there are
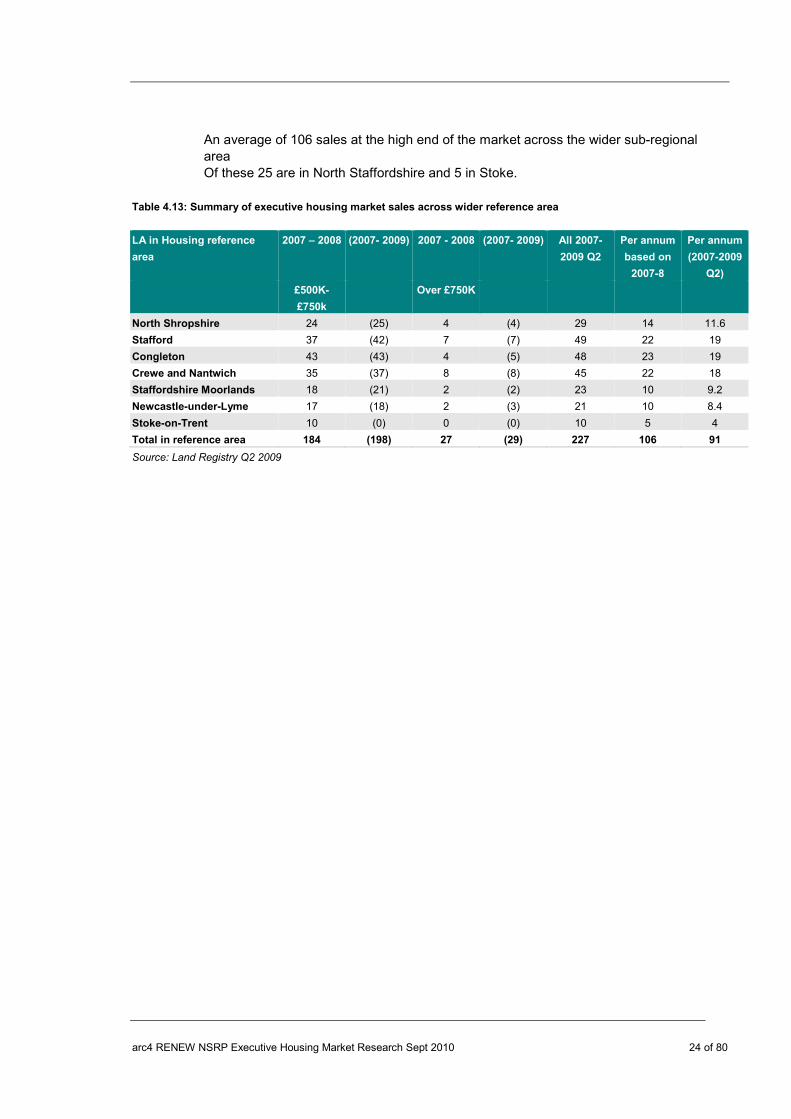
arc4 RENEW NSRP Executive Housing Market Research Sept 2010 24 of 80
An average of 106 sales at the high end of the market across the wider sub-regional area Of these 25 are in North Staffordshire and 5 in Stoke.
Table 4.13: Summary of executive housing market sales across wider reference area
LA in Housing reference
area
2007 – 2008 (2007- 2009) 2007 - 2008 (2007- 2009) All 2007-
2009 Q2
Per annum
based on
2007-8
Per annum
(2007-2009
Q2)
£500K-
£750k
Over £750K
North Shropshire 24 (25) 4 (4) 29 14 11.6
Stafford 37 (42) 7 (7) 49 22 19
Congleton 43 (43) 4 (5) 48 23 19
Crewe and Nantwich 35 (37) 8 (8) 45 22 18
Staffordshire Moorlands 18 (21) 2 (2) 23 10 9.2
Newcastle-under-Lyme 17 (18) 2 (3) 21 10 8.4
Stoke-on-Trent 10 (0) 0 (0) 10 5 4
Total in reference area 184 (198) 27 (29) 227 106 91
Source: Land Registry Q2 2009

arc4 RENEW NSRP Executive Housing Market Research Sept 2010 25 of 80
Section 5 Policy Context 5.1 National policy context 5.1.1 The one issue that dominates all others in the UK housing market at the current time is that
there is an underlying undersupply of the correct housing to meet demand. Demand has increased substantially over recent years through demographic and cultural shifts, smaller household sizes, increased life expectancy, immigration and rising wealth. Over the past decade house building has simply not kept pace, latest CLG figures reveal 133,710 completions during 2008 against a national target of 240,000.
5.1.2 One of the consequences of this imbalance has been to contribute to the extent that house
prices have risen dramatically over the last five years. In addition the cost differentials between tenures has risen to such a level that many households are trapped within the rented sector. For example, the ability for households in social rented accommodation to exercise any choice within the market is heavily restricted and first time buyer loans are currently at historically low levels.
5.1.3 The former Government’s policy solution to the perceived housing ‘crisis’ was contained
within the 2007 Housing Green Paper, which set ambitious targets for the volume of future house building in England. The Green paper proposed the delivery of three million homes by 2020. Meeting this 240,000 unit per annum target will be a significant challenge for both the development industry and the planning system and as such the then Government stated that policy would aim to move beyond supply and demand issues. The objective was to loosen the housing market and enable households to move between different tenures more easily at different life stages. The future direction of government policy on housing, beyond the very sketchy outlines in the Coalition Government agreement remains to be clarified.
How does lower density executive housing provision within North Staffordshire fit within the strategic planning framework for North Staffordshire and the wider sub-region?
5.1.4 Stoke, like other local authorities, is currently in a period of transition from the current
Structure Plan planning framework to the emerging Local Development Framework. Local Development Frameworks are designed to promote a proactive approach to managing and facilitating development. LDF’s differ considerably to previous spatial planning documents in that they are continuous and fluid and are designed to be driven by an overall vision for development.
5.1.5 The North Staffordshire Regeneration Partnership Business Plan establishes the aim to
promote and develop a quality housing range and offer, as part of an over-arching ambition to create sustainable communities and encourage economic growth. This mission statement on the sub-regional level reflects a series of national and regional policy drivers.
Planning Policy Statement 3: Housing
5.1.6 PPS3 sets out the Government’s national planning policy framework for delivering the
Government’s housing objectives. PPS3 has been developed in response to the Barker Review of Housing Supply in March 2004. The proposals draw on a range of research and consultation exercises. The underlying objective of PPS3 is to initiate the necessary step change in housing delivery to meet the emphasis on increasing supply. The Government

arc4 RENEW NSRP Executive Housing Market Research Sept 2010 26 of 80
hoped to do this by creating and developing a more responsive approach to land supply at a local level. Planning guidance is currently being overhauled by the Coalition Government.
5.1.7 PPS3 set out a series of policy drivers pertinent to the development of new housing, they
include: 5.1.8 Achieving high quality housing - Reflecting policy in Planning Policy Statement 1: Delivering
Sustainable Development, good design should contribute positively to making places better for people. PPS3 indicated that design which is inappropriate for its context, or which fails to take the opportunities available for improving the character and quality of an area and the way it functions, will not be accepted.
5.1.9 PPS3 suggested that Local Planning Authorities should develop a shared vision with their
local communities of the type(s) of residential environments they wish to see and develop design policies that set out the quality of development that will be expected for the local area, aimed at:
• Creating places, streets and spaces which meet the needs of people, are visually
attractive, safe, accessible, functional, inclusive, have their own distinctive identity and maintain and improve local character;
• Promoting designs and layouts which make efficient and effective use of land, including encouraging innovative approaches to help deliver high quality outcomes.
5.1.10 In addition it is set out that Local Planning Authorities should encourage applicants to bring
forward sustainable and environmentally friendly new housing developments and in doing so should reflect the approach set out in the forthcoming PPS on climate change, including on the Code for Sustainable Homes.
5.1.11 Achieving a mix of housing – Drivers of policy on housing mix are dominated by the
requirement to provide for a mixed community. Key characteristics of a mixed community are indicated within PPS3 as being a variety of housing, particularly in terms of tenure and price. Pertinent to much development currently is the provision of housing for a mix of different households such as families with children, single person households and older people.
5.1.12 Regional Spatial Strategies, before their recent abolition, set out the region’s approach to
achieving a good mix of housing. Local Planning Authorities should plan for a mix of housing on the basis of the different types of households that are likely to require housing over the plan period, and with the accent now on “localism” will have responsibility for developing their plans on a purely local basis. This will include having particular regard to:
• Current and future demographic trends and profiles; • The accommodation requirements of specific groups, in particular, families with
children, older and disabled people; • The diverse range of requirements across the area.
5.1.13 Based upon the findings of a Strategic Housing Market Assessment and other local
evidence, Local Planning Authorities should set out in Local Development Documents:
• The likely overall proportions of households that require market or affordable housing, for example, x% market housing and y% affordable housing;
• The likely profile of household types requiring market housing eg multi-person, including families and children (x%), single persons (y%), couples (z%);
arc4 RENEW NSRP Executive Housing Market Research Sept 2010 27 of 80
• The size and type of affordable housing required. 5.1.14 Achieving market housing mix – Local Planning Authorities should plan for the full range of
market housing. In particular one of the key findings of the North Staffordshire SHMA identifying the need to deliver ‘more executive housing in the housing sectors dominated by terraced stock’.
5.1.15 In summary, the local planning policy framework, informed by national drivers, indicates that
developers should bring forward proposals for market housing which reflect the demand and the profile of households requiring market housing in order to sustain mixed communities whilst proposals for affordable housing should reflect the size and type of affordable housing required.
5.1.16 In planning at site level, Local Planning Authorities should ensure that the proposed mix of
housing on large strategic sites reflects the proportions of households that require market or affordable housing and achieves a mix of households as well as a mix of tenure and price.
West Midlands Regional Housing Strategy
5.1.17 Responsibilities for housing planning and delivery significantly shifted to the regional level
following the Sustainable Communities Plan 2003 and the Planning and Compulsory Purchase Act 2004. Regional Housing Boards and Regional Planning Bodies were respectively required to produce a Regional Housing Strategy (RHS) and a Regional Spatial Strategy (RSS) for submission to the Regional Assemblies and Communities and Local Government (CLG). Much of this architecture has been swept away by the Coalition Government and the new arrangements have yet to be announced.
5.1.18 The purpose of the Regional Housing Strategy was to galvanise and apply the principles of
urban and rural renaissance throughout the region’s housing markets. The challenge for the Housing Strategy, in line with the counterpart document Regional Spatial Strategy and policies contained in the Regional Economic Strategy, were to:
• create mixed, balanced and inclusive communities; • assist in the delivery of WMRSS urban and rural renaissance; • influence the development of future housing provision to facilitate and enhance
the economic development of the region; • address the variety of housing needs across a range of specific sectors;
5.1.19 In summary the housing offer in the region should support future economic growth
throughout the region. The Regional Housing Strategy recognised the need to expand the residential offer in both, desirable locations where acute demand and supply imbalances have created affordability constraints through escalating prices, and areas of unpopular and obsolete housing, not meeting the aspirations of modern communities, through the Homes ad Communities Agency (HCA) sponsored HMR Pathfinder.
West Midlands Regional Spatial Strategy
5.1.20 The Planning White Paper, published in May 2007, proposed to streamline the planning
system, strengthen the strategic role of local authorities and importantly ensure that the planning system can cope with the future target to deliver 240,000 new homes per annum. Many of the White Paper’s proposals were included in the Housing and Regeneration Act

arc4 RENEW NSRP Executive Housing Market Research Sept 2010 28 of 80
(2008) whilst others were incorporated in appropriate guidance. As indicated above, much of this will be replaced by a new policy and governance framework.
5.1.21 The West Midlands RSS was initially published in June 2004. Following the publication of the
Phase One Revision in light of the Black Country sub-region by CLG, a revised WMRSS was issued in January 2008 guiding development to 2026. It influenced and was influenced by the economy, housing, transport, the built and natural environment. The RSS helped to define the future role of places, how places work together and ultimately, about the effect places have on the quality of life that people living in, working in or visiting that area experience. As such it provided a broad and long-term development strategy for the Region.
5.1.22 The guiding principals of the RSS were to accomplish more sustainable patterns of
development throughout the region, recognising the key objective to stem the unsustainable out-migration of population, jobs and investment from the Major Urban Areas (MUAs). In order to stem the trend of residualisation within the MUAs, considerable expansion of the type, range and quality of the residential and employment offer is required. Urban Renaissance forms the principal forward strategy in the MUAs in order to meet their economic and social needs by attracting and retaining economically independent households.
5.1.23 The Regional Housing Board anticipated pressure on the existing residential stock from a
rapidly growing population across the region, through principal process of natural growth. The RSS outlined delivery of 365,600 new homes over the next 20 years, regional and sub-regional cities and towns being the principal focus for housing, employment, shopping, leisure, education, health and cultural facilities in the region.
5.1.24 The key spatial priority for the core regional cities will be to manage and spread the benefits
of growth, with targeted investment in housing, transport, social and environmental infrastructure. In a shift towards centralisation of development the major metropolitan areas will be the prime recipients of future growth. The polycentric framework of growth established in the RSS drew particular emphasis on the relationship between areas for residential and economic growth.
5.1.25 The four Major Urban Areas (MUAs) of North Staffordshire, Birmingham/ Solihull, the Black
Country and Coventry contain over half the population of the West Midlands and are therefore the main focus for urban renaissance. The overriding aim is to reverse the trend of outmigration, making the MUAs increasingly attractive places where people want to live, work and invest.
5.1.27 Implementation of urban renaissance throughout the MUAs will be facilitated, as outlined in
Policy UR1, by restructuring ‘land use and transport networks to create employment growth, new residential environments, improved environmental quality, integrated transport and joined up centres’.
5.1.28 The Regional Spatial Strategy indicated that Local Development Frameworks would need to
make provision for continuous delivery of housing to 2021 in line with PPS3. Table 3.1 presents the then housing allocations per annum across the region.
Table 5.1: Housing allocations per annum for the West Midlands planning areas
Planning area to 2007 2007-2011 2011-2021

arc4 RENEW NSRP Executive Housing Market Research Sept 2010 29 of 80
Birmingham 2,300 3,000 3,000
Coventry 650 650 830
Dudley 600 700 975
Herefordshire 800 600 600
Sandwell 900 900 975
Shropshire 1,300 900 900
Solihull 400 400 470
Staffordshire 2,900 2,500 1,600
Stoke-on-Trent 600 600 600
Telford and Wrekin 1,330 1,300 700
Walsall 500 500 825
Warwickshire 2,000 1,500 1,350
Wolverhampton 500 500 825
Worcestershire 1,900 1,200 1,000
MUAs (approx) 6,450 7,250 8,500
Other areas 10,230 8,030 6,150
Total 16,680 15,280 14,650
Source: West Midlands Regional Spatial Strategy January 2008 Community Strategy 2004-2014 5.1.29 This document outlines the long term vision for the city to 2014, developed by the city council
and Local Strategic Partnership (LSP). The vision outlines a, ‘city that provides good quality housing, with good job prospects and wage levels. Where businesses are supported and new businesses are attracted to provide a diverse economy’.
• To create a culture of enterprise and innovation and make Stoke-on-Trent a
good place to do business; • To make Stoke-on-Trent an investment location by removing dereliction and unfit
housing; • To provide new quality jobs for our communities; • To develop the physical infrastructure to drive economic improvement.
5.1.30 The driver behind the setting of individual planning authority targets are the findings of
Strategic Housing Market Assessments as set out in PPS3. The North Staffordshire Strategic Housing Market Assessment was published in December 2008 the key findings and implications for the sub-regional area, comprising Stoke in particular include;
• The need to deliver more executive housing in the sectors dominated by
terraced stock, in terms of the quality and choice of residential environments; • A need for a more flexible planning approach to address the imbalance of
housing stock both current and in the pipeline; • Address the limited housing choice and mix in terms of type and tenure to
achieve sustainable communities, the current housing choice continues to act as a block on the area achieving its wider economic potential
• A continued process of residential ‘leapfrog’ to aspirational markets and neighbourhoods in adjacent markets such as Staffordshire Moorlands for the most economically independent households.
RENEW North Staffordshire Business Plan
arc4 RENEW NSRP Executive Housing Market Research Sept 2010 30 of 80
5.1.31 These thematic findings are echoed in the RENEW NSRP Business Plan in order to create the conditions for sustainable growth. Businesses in the sub-region will, given strategic objectives, increasingly need to compete effectively in a globalised economy by ensuring they can innovate, attract and retain local and graduate skilled labour, have a choice of well located, well connected sites on which to grow.
• Retain and attract population; • Balance the demand and supply of housing; • Transform the urban form and local environment; • Facilitate housing choice and the provision of a quality housing stock; • Promote social cohesion and social mobility, to help achieve sustainable
communities.
5.1.32 The North Staffordshire Regeneration Business Partnership directs regeneration across the three local authorities, the 2008 – 11 Business Plan focussing on the four key areas including;
• Re-development of Stoke-on-Trent city centre, promoting strategic links and development in Newcastle town centre;
• Creating a better, skilled workforce within more knowledge-based companies; • Supporting communities through tackling issues such as worklessness,
improved housing offer and re-vitalised town centres; • Encouraging inward investment and improving the area’s image
‘Make-It’ Stoke-on-Trent / Newcastle-under-Lyme, Staffordshire brand 5.1.33 In line with the aims above, commissioned by the NSRP, the ‘Make-It’ brand aims to promote
the image of North Staffordshire, utilised as a cohesive brand logo by universities, local businesses, public and voluntary sector organisations, in order to reflect and promote local assets. It is hoped that the campaign will support the regeneration plans through attraction of inward investment, visitors and residents to the area. The brand aims to promote local assets such as world class heritage, attractive towns, creative skills, highly-rated higher education centres of learning, green space and a commitment to sustainability.
Newcastle-under-Lyme and Stoke-on-Trent Core Strategy 5.1.34 The joint Newcastle-under-Lyme and Stoke-on-Trent Adopted Core Strategy outlines the
Strategic Vision for the area to be, ‘a prosperous, vibrant, environmentally responsible and successful area of choice for businesses, visitors and residents in the period up to 2026. The outcomes of the strategic aims are envisaged to include reversal of population decline and therefore retention, rising income levels, strengthening housing markets, healthier people with a strong sense of well being and an enhanced reputation. The aims are focussed upon key themes of People, Prosperity, Place and Image.
• Gross total new dwellings to be built in Stoke-on-Trent is 13,500 and in
Newcastle-under-Lyme 6,257 by 2026. These translate as net RSS targets of 11,400 and 5,700 respectively;
• New housing will be focused in the inner urban core, including the city centre and neighbourhoods within the RENEW ‘areas of intervention’;
• Indicative net annual requirements total 570 in Stoke-on-Trent and 285 in Newcastle-under-Lyme over the Plan period. (The planning policy unit have highlighted that in the current climate it is highly unlikely that this level of delivery

arc4 RENEW NSRP Executive Housing Market Research Sept 2010 31 of 80
will be achieved, instead a putative figure of 50% of 600 units is taken as the anticipated rate for 2008/09).
Staffordshire Moorlands Submission Core Strategy 5.1.35 The Staffordshire Moorlands Core Strategy has undergone a series of iterations following
consideration of responses through the consultation process. The latest Addendum to the Submission Version of the Core Strategy incorporated alterations to distribution of housing allocations across the main settlements of the district. It is anticipated that the Inspectorate examination will take place in June / July 2010 with full adoption in December 2010. The central theme of the Vision for Staffordshire Moorlands is predicated on the aspiration for the authority to become an exceptional place to live, work and visit. This translates into spatial and development objectives as part of a wider regenerated North Staffordshire to balance the need for sustainable growth and enhance the District’s natural and built assets.
• Latest population projections forecast the need to deliver 6,180 dwellings
between 2006 – 2026 in light of natural growth and projected employment growth of 15% equivalent to 5,192 jobs. This is considered in light of the RSS alternative growth options between a lower and higher range of 5,500 – 7,500 dwelling s between 2001 – 2026;
• As a preferred development option, new housing to be focused in the three main settlements of Leek, Biddulph and Cheadle, including the neighbourhoods within the RENEW ‘areas of intervention’;
• The spatial objectives for the individual settlements, underpinned by sustainable forms of development include the aims to, ‘create distinctive, sustainable, self-supporting settlements’; ‘meet the needs of the communities’; ‘encourage a strong, prosperous and diverse economy’; ‘maintain a quality environment and special places’.

arc4 RENEW NSRP Executive Housing Market Research Sept 2010 32 of 80
Section 6 Demand for Executive Housing Factors that will influence future demand - Household income and ACORN profiles 6.1.1 This section examines in detail the key drivers of demand pertinent to the market for
executive housing. An executive property is underpinned by the wealth of the housing purchaser. Household income is one measure of a household’s wealth and ability to access the executive housing market. In the most part potential purchasers of executive properties have considerable equity in the form of existing property to trade upwards, savings or windfalls. In terms of household income, there is a distinct correlation between those wards recording the highest property transaction levels and values, to the highest average household incomes. This pattern is reflected in map form in Appendix D.
6.1.2 Those wards recording the highest household income levels, in excess of £50,000, are
Trentham and Hanford, Meir Park and Sandon in Stoke. In Newcastle-under-Lyme they are Loggerheads and Whitmore, Halmerend and Westlands. In Staffordshire Moorlands Horton, Dane and Bagnall and Stanley are amongst a wider distribution of higher average household incomes in the authority.
6.1.3 In terms of relative affluence, Appendix C lists the proportion of total resident population by
postcode sector comprising ‘Wealthy Achievers’ according to the latest available ACORN household classification system. The grouping of ‘Wealthy Achievers’ account for almost half, at 48.3% of the total resident population of Staffordshire Moorlands, compared to 22.3% of Newcastle-under-Lyme residents and 12.4% of Stoke residents. Appendix C provides a comprehensive illustration of disparities between postcode areas, in terms of the relative proportion the wealthiest category of households.
6.1.4 Table 6.1 presents the income distribution across North Staffordshire, Stafford and South
Cheshire. Incomes throughout the distribution have increased and have done so relatively evenly over the previous five year period. Rising incomes in the sub-region as a whole, along with a period of sustained uplift in property values, has resulted in demand for property within the sub-region remaining high in the most desirable locations. This pressure has been experienced greatest within the popular markets, however as the latest North Staffordshire SHMA has illustrated Stoke is unique within the sub-region, with a persistent trend for wealthy family households moving to adjacent authorities such as Newcastle-under-Lyme, Staffordshire Moorlands, Stafford and the South Cheshire area. The price uplift in larger detached properties with greater capacity for larger household sizes has been the most significant in terms of relative prices affecting potential purchasers of executive housing market products. (The tables below show an X where there insufficient data to estimate an income figure.) Table 6.1: Resident based income distribution (£/yr), North Staffordshire and South Cheshire 2009
L.A Median Percentile distribution 10 20 25 30 40 60 70 75 80 90
S-on-T 21,238 12,344 14,696 15,357 16,683 18,439 23,705 26,680 28,364 30,525 x
N-u-L 23,273 12,636 15,717 16,639 17,515 20,021 25,537 28,518 30,978 33,216 x
S . M 24,510 12,603 15,222 16,542 17,714 22,723 28,811 31,692 33,934 x x
Con’ton 27,813 13,696 17,415 19,275 20,183 24,132 32,586 37,228 39,344 x x
C & N 23,427 13,405 16,000 17,012 17,814 20,651 27,245 29,549 x x x

arc4 RENEW NSRP Executive Housing Market Research Sept 2010 33 of 80
Stafford 24,694 13,792 17,455 18,525 19,642 21,921 28,486 32,845 36,899 x x
Source: Annual Survey of Hours and Earnings 2009, ONS 6.1.5 Table 6.2 presents the workplace based income information from the Annual Survey of
Hours and Earnings. This information shows that the incomes of households working in Stoke-on-Trent, but not residing within the local authority, are more than those living and working within the district. This matches the reverse trend identified in the adjacent authorities with higher resident-based income in Newcastle-under-Lyme, Staffordshire Moorlands and Congleton. These patterns in conjunction with net-outward migration trends (SHMA) confirm that households with higher earnings are satisfying their housing requirements outside of the Stoke local authority area.
Table 6.2: Work-place based income distribution (£/yr), North Staffordshire and South Cheshire 2009
L.A Median Percentile distribution 10 20 25 30 40 60 70 75 80 90
S-on-T 21,922 12,424 14,829 15,810 16,911 19,496 24,896 28,389 30,377 32,784 x
N-u-L 20,960 12,463 14,147 15,771 16,471 18,112 23,263 26,582 27,190 x x
S . M 22,410 11,909 14,902 15,988 16,705 18,246 24,216 27,217 x x x
Con’ton 23,680 13,095 15,526 17,480 18,343 20,359 27,358 32,409 34,394 x x
C & N 23,505 12,319 15,852 17,001 18,238 21,169 27,064 31,320 32,781 34,828 x
Stafford 25,359 13,866 17,198 18,570 19,601 22,856 29,464 33,261 35,383 38,671 x
Source: Annual Survey of Hours and Earnings 2009, ONS
6.1.6 A comparison of the resident and work-based incomes for higher income groups is shown in the table 6.3 below. The comparison uses the 70% percentile, as this is the highest level at which a complete data set is available. It does not represent the income levels associated with the executive market, but gives an indication of the patterns. Table 6.3: Comparison of resident and work place incomes
L.A Av resident income
@70% percentile
Av work-place income at
70% percentile
% difference
S-on-T 26,680 28,389 -6%
N-u-L 28,518 26,582 +7%
S . M 31,692 27,217 +16%
Con’ton 37,228 32,409 +15%
C & N 29,549 31,320 -6%
Stafford 32,845 33,261 -1%
6.1.7 This comparison shows the extent to which there is an imbalance between the incomes of the resident and working populations. It shows how the net in-commuting to Stoke from Newcastle and Staffordshire Moorlands broadly balances the upper income sections of the North Staffordshire market. Interestingly, the comparison with Crewe and Nantwich suggests that the position for Stoke is not exceptional in terms of the extent of imbalance; the key feature of all the North Staffordshire LA areas is the relative low incomes across the work-based income range.
6.1.8 Analysis of the annual income levels shows further the disparities in the higher income resident population across North Staffordshire. The key statistics are shown below in table 6.4. In summary, it shows how adjacent authorities appear to be satisfying the housing search criteria for many of those working in Stoke with higher than average incomes.

arc4 RENEW NSRP Executive Housing Market Research Sept 2010 34 of 80
Table 6.4: Higher income resident households L.A % household with £50k+ income
% of Households classified as
wealthy achievers (CACI)
S-on-T 6.2% 12.4%
N-u-L 21.1% 22.3%
S . M 22.8% 48.3%
6.1.9 The evidence indicates that, as we would expect, the concentrations of high income
households and incidence of ‘Wealthy Achievers’ roughly correspond with the locations identified in both the Council Tax and Land Registry data for higher value properties. This is presented in Appendix D maps 1 – 3.
6.1.10 Therefore, we can conclude that the limited supply of higher-value housing in Stoke reflects the established commuting patterns across North Staffordshire, and this would need to change to reduce the imbalance. However, we have to recognise that the housing provision at the higher end of the market, in the overall North Staffordshire market, does not seem to be seriously out of balance with demand. The low resident household incomes in Stoke are as much, or maybe more, due to the relatively low workplace incomes as compared to those in South Cheshire and Stafford.
6.1.11 Whilst this income data does not give us direct evidence about the extent of workplace incomes that would drive the executive housing market, it strongly suggests that there are relatively few very high earners in the North Staffordshire market as compared to the adjacent S Cheshire and Stafford areas. The relatively low levels of activity in the N Staffs executive housing market may be reflecting this fundamental level of demand. Demography – Population projections
6.1.12 This section considers whether demographic trends are likely to result in changes in the scale or nature of the Executive housing market.
6.1.13 The current Stoke population is estimated at approximately 240,200 persons (Mid-Year Estimates, 2007, ONS). Through a process of natural change and net positive international-migration, the local authority appears to have stemmed the trend for large-scale population loss. However in spite of this, trend-based population projections reveal that the local authority will record losses within the main economically active resident population through net out-migration in age bands 35 – 59 year olds as illustrated in fig 6.1 below. This is important as, based in the desk research and estate agent evidence, this 35-59 age group represents the main cohort of potential demand for executive housing.
6.1.14 ONS population projections (latest available) indicate that the population of Stoke is
projected to increase to 254,000 persons by 2031, equating to an actual growth of approximately 14,000 persons.
6.1.15 Demand in terms of basic population growth is therefore set to increase at a relatively fast
pace. Examining population growth by age group gives us more detail on which groups of the population will increase most. As per national trends, Stoke has an ageing population with projected increases in proportional terms highest in the elderly age groups. For example, the number of residents over the age of 85 years is projected to increase by 84% to 2031. As illustrated by fig 6.1, projections anticipate losses in all household formation age

arc4 RENEW NSRP Executive Housing Market Research Sept 2010 35 of 80
cohorts apart from 30-34 year olds. These projections are based on historic trends and are development neutral. Therefore, the projections are strategically indicative for areas of investment focus for the local authority, such as the acute need to attract inward investment for employment opportunities, diversify the housing stock and complementary enhancements to the quality of place in order to stem the out-migration of the economically active households.
Figure 6.1: Projected population change by age group in Stoke 2009 – 2031
Source: 2006-based population projections, ONS
6.1.16 The current population of Newcastle-under-Lyme is estimated at approximately 125,300 persons (Mid-Year Estimates, 2007, ONS). Trend-based population projections reveal a comparatively similar profile to that of Stoke; in that the local authority will record losses within the main economically active resident population through net out-migration in age bands 35 – 59 year olds as illustrated in fig 6.2 below.
6.1.17 Population projections indicate that the population of Newcastle-under-Lyme is projected to
increase to 136,400 persons by 2031, though these increases will predominantly be within the older age cohorts.
6.1.18 In line with national trends, Newcastle-under-Lyme has an ageing population with projected
increases in proportional terms highest in the elderly age groups. The number of residents over the age of 85 years is projected to increase by 107% to 2031. As illustrated by fig 6.2, projections anticipate losses in all household formation age cohorts apart from 30-39 year olds.
-20% -10% 0% 10% 20% 30% 40% 50% 60% 70% 80% 90%
0-4
5-9
10-14
15-19
20-24
25-29
30-34
35-39
40-44
45-49
50-54
55-59
60-64
65-69
70-74
75-79
80-84
85+
ALL AGES
Quinary age group
Percentage change 2009 - 2031

arc4 RENEW NSRP Executive Housing Market Research Sept 2010 36 of 80
Figure 6.2: Projected population change by age group in Newcastle-under-Lyme 2009 – 2031
Source: 2006-based population projections, ONS 6.1.19 The current population of Staffordshire Moorlands is estimated at approximately 96,100
persons (Mid-Year Estimates, 2007, ONS). Trend-based population projections reveal a comparatively similar profile to that of the adjacent areas in North Staffordshire, in that the local authority will record negative growth in the main economically active resident population through net out-migration in age bands 35 – 59 year olds as illustrated in fig 6.3 below.
6.1.20 Population projections indicate that the population of Staffordshire Moorlands is projected to
increase by 7,000 persons to 103,100 persons by 2031, though these increases will predominantly be within the older age cohorts.
6.1.21 In line with national trends, Staffordshire Moorlands has an ageing population with projected
increases in proportional terms highest in the elderly age groups. The number of residents over the age of 85 years is projected to increase by 147.8% to 2031. As illustrated by fig 6.3, projections anticipate losses in all household formation age cohorts apart from 30-34 year olds.
Figure 6.3: Projected population change by age group in Staffordshire Moorlands between 2009 – 2031
-20% -10% 0% 10% 20% 30% 40% 50% 60% 70% 80% 90% 100% 110% 120%
0-4
5-9
10-14
15-19
20-24
25-29
30-34
35-39
40-44
45-49
50-54
55-59
60-64
65-69
70-74
75-79
80-84
85+
ALL AGES
Quinary age group
Percentage change 2009 - 2031

arc4 RENEW NSRP Executive Housing Market Research Sept 2010 37 of 80
Source: 2006-based population projections, ONS 6.1.21 Considering demographic change in the wider housing reference area, all projections
illustrate similar trends for ageing populations with the largest proportional increases in the older age bands (see Appendix F). However, the South Cheshire area of Crewe and Nantwich is anticipated to record growth within the main economically active household groupings unlike the adjacent authorities.
6.1.22 The demographic profiles only provide a proxy of projected demand, as change in the
numbers within the 35-59 age cohorts that are the main purchasers of executive housing, will not by itself translate into actual demand. Taken on their own, we would not expect the demographic trends in North Staffordshire to translate as a rise in demand for executive housing.
6.1.23 Changes in Income levels and wealth will be especially important and these are considered below. Factors about preferences and access to such housing will also shape demand, including the housing product offer and the quality of place. These aspects are considered in the next section, informed by interviews with local agents and developers active in the marketplace and local resident focus groups. Changes in employment and income levels
-40.0% -20.0% 0.0% 20.0% 40.0% 60.0% 80.0% 100.0% 120.0% 140.0% 160.0%
0-4
5-9
10-14
15-19
20-24
25-29
30-34
35-39
40-44
45-49
50-54
55-59
60-64
65-69
70-74
75-79
80-84
85+
ALL AGES
Quinary age group
Percentage change 2009 - 2031

arc4 RENEW NSRP Executive Housing Market Research Sept 2010 38 of 80
6.1.24 The relationship between housing and the economy is complex, however in broad terms there is much evidence to suggest that provision of the right type of housing in the right locations serves to attract the key economically independent households and can have a significant impact on the wider economy. There is the direct impact of income in the area, and in addition residents of high quality family housing include a high proportion of entrepreneurs and decision-makers, leading to a consequent high level of business start-ups and investments. This leads to establishment of new employment opportunities, often in locations convenient to the home of the entrepreneur. There is consequently considerable economic implications for North Staffordshire in providing high quality family and executive housing provision, the potential benefits to the local authority and how a lack of supply would impact the Council’s aspirations for growth and sustainability.
6.1.25 Recent research undertaken on the current local employment market by SQW and Experian suggests declining jobs in Stoke, with a small shift to professional jobs. In relative terms this is not likely to have a significant impact on potential purchasers within the Executive Housing market. The sub-region of North Staffordshire has been significantly impacted by the downturn and highlighted as a key area of vulnerability by regional policy-makers, due to the area’s structural weaknesses and dependence on low value sectors. The economic research notes that due to a contraction of the manufacturing sector, Newcastle-under-Lyme has proven more resilient than neighbouring Stoke (Experian).
6.1.26 In terms of the structural business base within the sub-region, the downturn has impacted upon sentiment and job losses, with those sectors worst effected in manufacturing, construction, wholesale retail and trade, SME businesses and those dependent upon discretionary spending. The main job losses have been concentrated in the manufacturing, low-skilled and elementary sectors, suggesting that young and low skilled workers have been disproportionately impacted by the downturn. In terms of future economic resilience, there is a significant case for re-structuring and re-training the workforce to sectors that will underpin the new economy, known as the knowledge economy, in areas such as high-value and advanced manufacturing, creative industries and social enterprise (Experian).
6.1.26 As noted in the economic research undertaken, forecasting scenarios are subject to a great
deal of uncertainty. However the key messages identify the need for a proactive policy-on approach to encouraging investment and restructuring the economy towards advanced manufacturing and specialist services to enable employment growth, engendering resilience in the future economic base of the sub-region. In terms of the relationship between housing and the economy, the drivers of the new economy namely global footloose industries choose to locate where the skilled workforce is located. There exists clear relationships between the locational choices of employees within these sectors and consequently those of industry, namely in asset-rich environments. Therefore provision of the right residential offer and quality of place factors, such as the leisure and cultural offer, improved links with the higher education sector and proactive leveraging for business investment will contribute to restructuring the sub-regional economy conducive to business skills requirements.
6.1.27 The perception of the sub-region as a location for provision of executive housing to cater for
locational choices of the higher income groups is addressed in section 7.

arc4 RENEW NSRP Executive Housing Market Research Sept 2010 39 of 80
Section 7 Primary Fieldwork Estate agent testimonies 7.1.1 In this section we interviewed relevant stakeholders including estate agents, private
developers, resident focus groups and individuals such as industry leaders and sportsmen classified as Wealthy Achievers (ACORN) including High Net Worth Individuals (HNWIs)2, with a specific focus upon understanding the market dynamics of the executive housing market in North Staffordshire and neighbouring markets. Participants are listed in Appendix F.
7.1.2 Part of the logic of adopting a qualitative approach is that many of the topics are relatively
subjective in nature and beyond quantifiable data sources, such as the perception of given areas. This approach is intended to add texture to the broader focus of the quantitative data above and is based on interviews with individuals with an insight into the local executive housing market dynamics.
7.1.3 The understanding of this niche market is characterised by features including, but beyond
price. These features included property with at least four bedrooms with en suite facilities, in most cases many more bedrooms, properties in excess of 2,500sqft achieving prices approximating £200 per sqft (reaching £300 per sqft at the height of the market). However agents were keen to stress that within the executive housing market and particularly above the £1M threshold, capital value was more important than comparative value per square footage.
7.1.4 The properties are predominantly detached period houses, or occasionally new build within a
contiguous prestigious environment with properties of comparable specification and price, or individual properties within gated settlements, offering a high level of security and privacy including bespoke security arrangements, being viewed as an essential feature for many purchasers.
7.1.5 The specification within the property would be very high, often including bespoke /
personalised fittings, particularly in the kitchen and bathroom, with a high degree of attention to detail and a contemporary feel. Agents commented that properties purchased by the affluent wealthy achievers in this market required extra room for workspaces and leisure pursuits such as swimming pools, jacuzzis, gymnasium and cinema rooms. The external surroundings would ordinarily include double garage, surrounding landscaped garden and ample driveway space.
7.1.6 Agents with a considerable client base within the executive housing market, emphasised the
importance of accessibility as a principle reason influencing locational choices for primary residences. The main reasons being ease of access between their property and work or leisure pursuits and access to international airports. Purchasers in this category tend to gauge accessibility in terms of travel time. Agents noted that accessibility to transport links and major employment centres will be a key contributory factor explaining why Cheshire
2 High Net Worth Individuals (HNWIs) those individuals with high net worth in investable assets typically between £500,000 - £5M. Individuals below £500,000 but above £100,000 are referred to as Mass Affluent. Due to the nature of this study, we
include primary residence as an asset allocation. This definition of HNWIs will include those categorised elsewhere in the
report as Wealthy Achievers.

arc4 RENEW NSRP Executive Housing Market Research Sept 2010 40 of 80
harbours a substantial concentration of wealthy purchasers in this market, in close proximity to Manchester Airport and the city. Likewise areas such as Darras Hall in Ponteland, in close proximity to Newcastle International Airport and Wynyard to the motorway network for Newcastle record a high proportion of industry leaders and HNWIs.
7.1.7 In terms of accessibility the importance of both ‘Quality of Place’ and ‘Residential Offer’ is
imperative in providing purchasers access to excellent leisure and cultural facilities, either in their residence or within the immediate vicinity. Agents reveal that an element of the success of many executive developments is the accessibility to leisure facilities, often within a 30-minute drive time to a selection of good restaurants, shopping and leisure pursuits. Executive developments are often in close proximity to leisure facilities such as a local golf course (Tattenhall, Meir Country Park, Ponteland, Wynyard) or cultural amenities within a short drive. We discuss the importance of these factors in providing an attractive location and their integral role within economic potential of an area below.
7.1.8 Accessibility is regarded by local agents as a combination of travel time and ease of access.
For the primary residence to be accessible a maximum daily journey time to a place of work should be no more than one – one and a half hours. This highlights both the generally accepted assumption that the executive housing market operates beyond local authority boundaries and is characterised more on the scale of sub-regional and regional scales (Agent commentary and Toumaney et al, 2006). This trend for longer travel times to reach a desired location from the large regional employment centres is wholly dependent upon good transport links. This trend is apparent for established commuting patterns to London from a significant hinterland reaching across the Home Counties to Oxfordshire and the Cotswolds beyond; the Golden Triangle comprising the M1 corridor and both Yorkshire National Parks to York and Leeds; North York Moors, Teesdale and Northumberland National Park area to Newcastle and rural Nottinghamshire and Cambridgeshire to Cambridge and London.
7.1.9 In this regard agents comment that the potential for providing an executive housing offer
within Stoke may suffer from proximity to an established offer within Newcastle-under-Lyme, Staffordshire Moorlands and Cheshire to the north. Agents note that there is a desire to locate within a renowned, contiguous executive housing market, the operation of which across regional and sub-regional areas may prove limiting to provision in a new market, particularly without the development of a desirable lifestyle offer within Stoke as a whole.
7.1.10 Agents noted that property and personal security is a major factor when specifying a property
location and choice. There is a distinct requirement placed upon security features such as gated developments, electronic surveillance and security services for both the property and family members.
7.1.11 Aligned with the requirement to live in a prestigious location, within a contiguous exclusive
and comparably-priced residential built environment, is a strong desire to live in an environment close to social and economic peers. This is often underpinned by the fact that executive developments are accessed by those above a particular wealth threshold.
7.1.12 In this regard executive residences often fulfil the requirement of a statement purchase in
terms of specification, size and design. For the most part a primary residential property represents the largest investment made by a household and therefore is a display of achievement and wealth.
7.1.13 A significant factor for buyers of executive property with school-age children is education.
There is an implicit association between location of residence and a renowned preparatory

arc4 RENEW NSRP Executive Housing Market Research Sept 2010 41 of 80
and private school. In terms of access, assuming children are not boarding, they should be able to reach schools within a 30-minute drive. Well-performing state schools and cities with established universities feature well in terms of attracting wealthy purchasers to the adjacent areas such as Lauder and the Borders next to Edinburgh, the Golden Triangle to the north of York and the Cotswolds in close proximity to Warwick, Oxford and Cambridge.
7.1.14 As a reflection of wealth, purchasers of executive property have a high regard for property-
led investments. Property is regarded as an investment for which price can be influenced directly through improvements in specification and management. This assumption has been tested following recent economic turmoil, however the executive housing market is relatively less dependent upon availability of mortgage finance for access to property.
7.1.15 Agents note that there has been a noticeable increase in transactions for agricultural
properties in recent years. The trend for lifestyle-ownership is particularly prevalent in the southern executive market and has clear links with the city workers in the City of London. This has implications for the location of proposed executive housing, namely within rural locations impacting upon the release of greenbelt designations.
7.1.16 Agents comment that in a competitive marketplace for a finite supply of top-end products,
developers are increasingly incorporating high quality design, often bespoke reflecting the purchaser’s lifestyle expectations. There is a certain cache associated with the level of design and integrated facilities within, as property and residential developers are transferring image and amenities from hotels in many instances. External new build design will often be bold and contemporary, with interior facilities incorporating extensive leisure and wellness features.
7.1.17 Specialist bespoke design services have become a key element of integrated features in
executive housing. The high-end consumer exercises influence on every aspect of their home design, with attention to detail and craftsmanship reflecting wealth and taste through the use of quality of materials.
7.1.18 The trend in executive new builds has been the inclusion of a separate social space from the
open-plan kitchen / dining area. This includes all-weather areas in landscaped gardens, suitable for socialising and entertaining.
7.1.19 The trend for bespoke design is a key element within the executive new build market, as the
ability to design one’s own property to a personal specification, elevates the property beyond products offered within the volume-house built top-end market. This capacity adds an element of prestige and permits the purchaser to make a statement reflect their lifestyle and wealth. Increasingly the capacity for bespoke design is incorporating environmentally sustainable features such as ground source heat pumps, bio-fuel heat generators and modern methods of construction.
7.1.20 Period properties in a rural or rural / suburban location form the principal property type within
the North Staffordshire executive marketplace. As illustrated in section 4 above new build properties within the defined executive housing market are exceptions, comprising a constrained offer. It is interesting to note that the most expensive new build property currently on the market within Stoke local authority is a five-bedroom detached property in Brindley Village, located in Sandyford within a volume built estate, at £259,995. This currently represents the top-end of the new build market within the authority although would not meet the criteria of executive property offer.

arc4 RENEW NSRP Executive Housing Market Research Sept 2010 42 of 80
7.1.21 Furthermore the majority of executive properties on the market are advertised across the North Staffordshire area and not confined to local authority boundaries illustrating the sub-regional area across which the high-end market operates. Examples of properties advertised in Stoke are predominantly located within Staffordshire Moorlands, however examples of those that are currently on the market that would be classified as executive housing within Stoke include.
Table 7.1: Executive properties currently for sale within Stoke
Price Address Description
£925,000 Meadowcroft,
Barlaston Old Road,
ST4
1920 Bespoke detached period property overlooking Trentham golf course. Access
to M34 and M6 motorway. Accommodation comprises; Entrance porch leading into
reception hall, downstairs cloaks/shower Room, sitting room, dining room, dining
kitchen, family sitting room. side hallway leading to cellar, utility, office/playroom
with attic above. Galleried Landing, master bedroom with en-suite bathroom, three
further Bedrooms and study. Family Bathroom. External includes tennis court and
landscaped gardens the plot extends in excess of an acre. There is also a separate
garage block consisting of two double garages with loft space.
Source: Agent interviews, Rightmove
7.1.22 Properties that are currently on the market that would be classified as executive housing
within Newcastle-under-Lyme are similarly limited with seven properties marketed above £500,000 and a further 12 between £350,000 - £500,000. Notably none of the properties are new build. In terms of new build the most expensive properties currently on the market within the authority, are four-bedroom detached properties on Keele Road and in Wolstanton, located within a volume built estate, at £249,995. This currently represents the top-end of the new build market within the authority. An example of executive properties on the market in Newcastle-under-Lyme include:
Table 7.2: Executive properties currently for sale within Newcastle-under-Lyme
Price Address Description
£875,000 Broadoaks, 237
Seabridge Lane, ST5
3TB
Five bedroom detached finished to a high standard of detail. Exclusive family
residence with accommodation on three floors extending to approx 5,000 sq. ft.
Situated on the westerly edge of town, convenient for local amenities/schools, and
five minutes drive from Newcastle town centre. The accommodation comprises a
reception hall featuring oak staircase, drawing room, rear patio, dining room,
separate living room and quality fitted family kitchen with dining conservatory and
large matching separate utility room. Leading to the rear reception hall and
family/entertainment room with full drop-down cinema screen, separate study and
large games room above. All four family size bedrooms on the first floor are en-
suite facilities. The master bedroom also has walk-in wardrobe and principal
bathroom with luxurious contemporary full suite including jacuzzi shower. Second
floor with spacious additional living space, having separate bedroom and shower
room. This can provide a self-contained living annexe if required or alternatively,
further use as an office, games room or gym. The plot extends to approximately half
an acre, with landscaped gardens to front and rear, affording considerable privacy
all around. An outdoor Heated Swimming Pool and driveway. Council Tax Band H.
Source: Agent interviews, Rightmove
7.1.23 Despite the large representation of upper market properties within Staffordshire Moorlands, in terms of new build the most expensive new build properties currently on the market within the authority, are five-bedroom detached properties on Cheadle Road, Cheddleton, located within a volume built estate, at £259,995. This currently represents the top-end of the new

arc4 RENEW NSRP Executive Housing Market Research Sept 2010 43 of 80
build market within the authority. Properties that are currently on the market that would be classified as executive housing within Staffordshire Moorlands include:
Table 7.3: Executive properties currently for sale within Staffordshire Moorlands
Price Address Description
£1,100,000 New House Farm,
Bagnall Road, Bagnall
Four-bedroom detached bungalow set within 12 acres of land and approached by
private driveway. Comprising a range of outbuildings, formal gardens and indoor
swimming complex. The property offers large family sized accommodation,
Entrance Porch, Entrance Hall, W.C, Lounge, Large Dining Kitchen, Master
Bedroom with En-Suite and Walk in Dressing Room, Three further double
Bedrooms and family Bathroom.
£900,000 Little Lawn Farm,
Thorney Edge Road,
Bagnall
A substantial seven acre equestrian holding located on the North Staffs/South
Cheshire border close to the market town of Leek with easy access to the M6 South
, M6 North and M1 via the A50 connection. The former agricultural holding has been adapted to provide a stone built detached four bedroom family residence with the
scope for further bedrooms/separate accommodation in an external barn. The
equestrian facilities comprise a new purpose built stable block with ten individual
stables as well as wash room and solarium and tack room.
£750,000 Tinster House, Tinster
Wood, Endon
Six bedroom recently completed bespoke country house, stone built and located in
just over 18 acres of woodland and grazing. Newly completed and with top quality
appointments throughout. Expansive accommodation comprising oil c/h (underfloor
on ground floor) and hardwood d/g. Magn. Hall, Cloaks., Lounge, Dining Room,
Study, Living Kitchen with Family Room, Breakfast Room, and Kitchen areas, Utility,
Landing Master Suite with Shower Room & Dressing Room, Guest Bed with en-
suite, 2 further 1st floor Beds., and impressive family Bathroom. The Second floor is
adaptable for further accommodation, at present has a large sitting Area, TV Room
two further bedrooms and bathroom.
£699,950 Bluebell Farm, Park
Lane, Endon
Four bedroom detached property with capacity for equestrian use, set within eight
acres of land. High specification to finish internally. Council Tax Band G.
£695,000 Greenfields Farm,
Armshead Road,
Werrington
Four bedroom farmhouse on the edge of open countryside with access to market
towns of Leek and Cheadle. This stone built property and adjoining paddock extend
to approximately four acres. The ground floor accommodation consists of three
good size reception rooms and a sizeable living kitchen. At first floor level the
master bedroom has adjoining dressing rooms and luxury en-suite facility. Three
further bedrooms and bathroom complete the accommodation. Externally there is a
large stone built double garage with useful workroom to rear and first floor
accommodation. The extensive gardens have an adjoining paddock.
Source: Agent interviews, Rightmove
7.1.24 Local agents commented that Staffordshire Moorlands and South Cheshire are the principal
search areas for executive properties across the sub-region, catering for both housing offer and desired locational aspects. New build properties within this market are limited and the area of search for new build within the high-end market extends beyond North Staffordshire to Stafford in the south and South Cheshire to the north.
7.1.25 The wider executive housing market incorporating Stafford, Staffordshire Moorlands and
South Cheshire areas offers considerably more options for those purchasers seeking executive homes compared to limiting searches to the Stoke area. The considered view from agents active in the market was that Stoke as an authority is not regarded as a main location of choice for residence compared to Staffordshire Moorlands, Newcastle-under-Lyme and South Cheshire. The view of those categorised as HNWIs even those working within Stoke,

arc4 RENEW NSRP Executive Housing Market Research Sept 2010 44 of 80
was a preference for locating in a contiguous high value housing market, with a reputation for housing offer within this market. Stoke at present does not offer the residential offer nor quality of place to capture this market, with some HNWIs choosing to commute into the authority from South Cheshire and the rural hinterlands of adjacent authorities, to satisfy the housing and lifestyle offer.
7.1.26 Of the nine agents operating within the area, those that recorded the number of registered
clients for properties, the number varied from ten – fifteen clients for properties registered above £500,000 and 45 – 60 clients for properties above £350,000. It is worth noting that not all agents kept a recorded list of registered clients and that properties advertised above the £400,000 threshold were infrequent - below ten in number per agent.
7.1.27 However in terms of the depth of the executive housing market in the respective locations
representing a potential pool of prospective purchasers, there would appear to be a considerable market for properties between the £350,000 - £500,000 band below the stamp duty threshold increase. Particularly in light of the absence of new build property in this banding and potential for a small number of bespoke executive properties above this level, depending upon location.
7.1.28 Estate agents suggested that purchasers of executive housing are characterised by those
working within the centres of Manchester, Birmingham and some local business leaders located in Stoke and Derby to the east. They are predominantly in their late forties and fifties, with some semi-retired professionals in their sixties, whilst younger purchasers are predominantly sportspersons, other professions including business owners, or directors.
Focus group attitudes and aspirations 7.2.1 A number of focus group workshops were undertaken as part of the wider commission,
which elucidated a number of attitudes to the potential North Staffordshire marketplace. In terms of positive aspects, the area was considered well located to green infrastructure and open rural space, benefiting from good transport links to the rural areas and likewise to locations of employment. The considered concensus was that given resident’s positive attachment to the local area, there would be a considerable demand to remain due to aspects such as proximity to green open space and family connections, upon the next household move. Investment in quality public realm and offer was highly regarded from the focus groups such as Trentham Gardens and Cultural Quarter.
7.2.2 However, these points are mitigated by the concensus that Stoke city centre and the
associated district centres lack a focus, suffering from poor wider perception of the area and lacking a wider lifestyle offer including retail and leisure. Stoke-on-Trent city centre underperforms and are not desirable locations of choice for retail destinations compared to Manchester and Birmingham. These major urban centres draw North Staffordshire residents for the wider retail and leisure offer as destinations of choice.
7.2.3 Furthermore, the lack of well-paid professional employment opportunities in the area was
regarded as a negative aspect to the potential for retaining and attracting higher paid earners to the area. The view from the focus groups reflected that if a variety of better employment opportunities were available, they would consider staying in the area. Retaining talented people and wealth in the area was seen a key issue. The universities were seen as a major strength for the area. However, respondents believed that graduates would not stay in the area owing to a lack of professional and well-paid jobs.
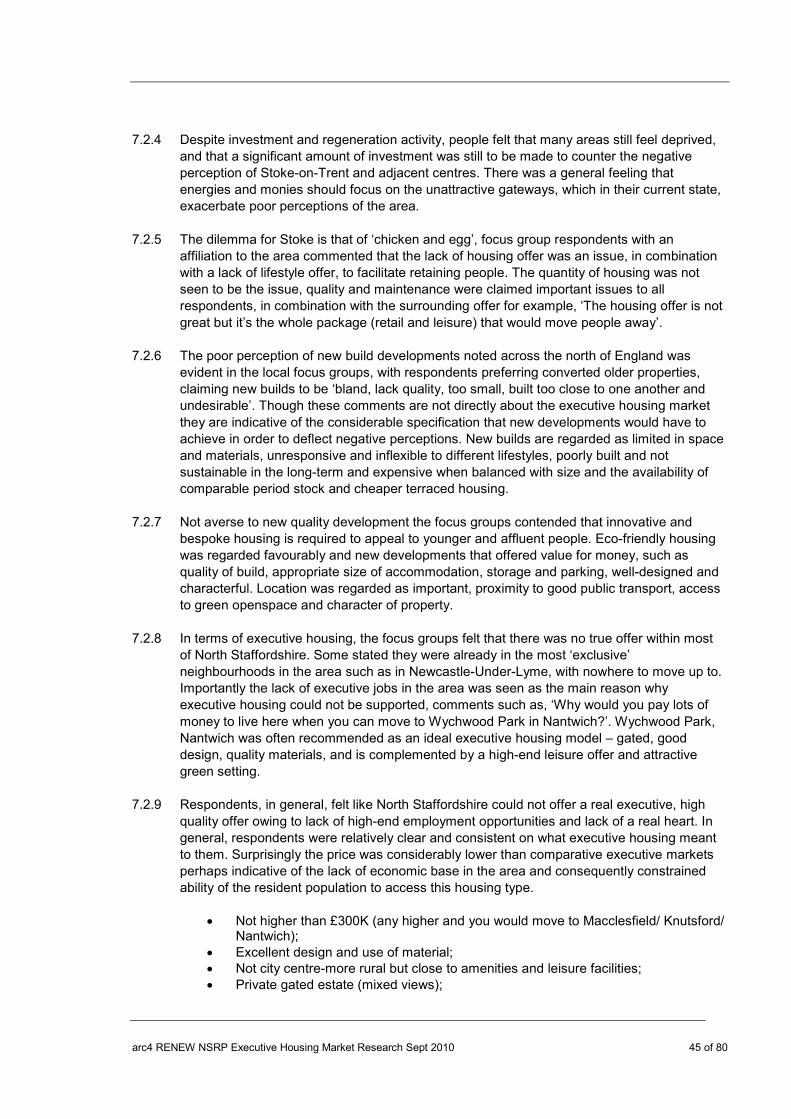
arc4 RENEW NSRP Executive Housing Market Research Sept 2010 45 of 80
7.2.4 Despite investment and regeneration activity, people felt that many areas still feel deprived, and that a significant amount of investment was still to be made to counter the negative perception of Stoke-on-Trent and adjacent centres. There was a general feeling that energies and monies should focus on the unattractive gateways, which in their current state, exacerbate poor perceptions of the area.
7.2.5 The dilemma for Stoke is that of ‘chicken and egg’, focus group respondents with an
affiliation to the area commented that the lack of housing offer was an issue, in combination with a lack of lifestyle offer, to facilitate retaining people. The quantity of housing was not seen to be the issue, quality and maintenance were claimed important issues to all respondents, in combination with the surrounding offer for example, ‘The housing offer is not great but it’s the whole package (retail and leisure) that would move people away’.
7.2.6 The poor perception of new build developments noted across the north of England was
evident in the local focus groups, with respondents preferring converted older properties, claiming new builds to be ‘bland, lack quality, too small, built too close to one another and undesirable’. Though these comments are not directly about the executive housing market they are indicative of the considerable specification that new developments would have to achieve in order to deflect negative perceptions. New builds are regarded as limited in space and materials, unresponsive and inflexible to different lifestyles, poorly built and not sustainable in the long-term and expensive when balanced with size and the availability of comparable period stock and cheaper terraced housing.
7.2.7 Not averse to new quality development the focus groups contended that innovative and
bespoke housing is required to appeal to younger and affluent people. Eco-friendly housing was regarded favourably and new developments that offered value for money, such as quality of build, appropriate size of accommodation, storage and parking, well-designed and characterful. Location was regarded as important, proximity to good public transport, access to green openspace and character of property.
7.2.8 In terms of executive housing, the focus groups felt that there was no true offer within most
of North Staffordshire. Some stated they were already in the most ‘exclusive’ neighbourhoods in the area such as in Newcastle-Under-Lyme, with nowhere to move up to. Importantly the lack of executive jobs in the area was seen as the main reason why executive housing could not be supported, comments such as, ‘Why would you pay lots of money to live here when you can move to Wychwood Park in Nantwich?’. Wychwood Park, Nantwich was often recommended as an ideal executive housing model – gated, good design, quality materials, and is complemented by a high-end leisure offer and attractive green setting.
7.2.9 Respondents, in general, felt like North Staffordshire could not offer a real executive, high
quality offer owing to lack of high-end employment opportunities and lack of a real heart. In general, respondents were relatively clear and consistent on what executive housing meant to them. Surprisingly the price was considerably lower than comparative executive markets perhaps indicative of the lack of economic base in the area and consequently constrained ability of the resident population to access this housing type.
• Not higher than £300K (any higher and you would move to Macclesfield/ Knutsford/
Nantwich); • Excellent design and use of material; • Not city centre-more rural but close to amenities and leisure facilities; • Private gated estate (mixed views);

arc4 RENEW NSRP Executive Housing Market Research Sept 2010 46 of 80
• Detached, three to four new build homes in small rural area/ green surroundings; • Set in decent grounds – not close to other properties; • Bespoke design often with green features; • The right lifestyle-offer in good travelling distance.
7.2.10 The focus groups identified the aspirations of higher income and high equity wealthy
households above and the intention to move to a larger property. Though notably despite attachment to the local area, due to a lack of housing offer of the right type and location, this move may be enacted beyond North Staffordshire into predominantly South Cheshire area.
7.2.11 The concensus from respondents noted that development of executive housing in the
authority amounted to more than merely residential development. The lifestyle offer, facilities available, proximity and access to green space would all contribute to an attractive executive housing market. New build flats were not considered an attractive choice and neither was urban living, as substantial improvements would have to be made to the main urban centres to offer facilities associated with large cities.
Developer perceptions 7.3.1 A number of developers active in the region were consulted in the research process
(Appendix F). All have a track record of providing high-end new build stock in comparative terms, though some stated that they were not active in North Staffordshire, having developed executive products in the neighbouring locations of Shropshire and South Cheshire.
7.3.2 Although some high value housing for the North Staffordshire market have been built in
recent years, the developers have not delivered executive market products in the Stoke-on-Trent area. A number of reasons were forwarded relating to demographic profiles and planning policy.
7.3.3 In terms of socio-economic profiles, a number of developers and land buyers noted that to
date Stoke would not offer an attractive market, both the demographic profile and income levels were not regarded as being conducive to developing a high-end product. The macro-economic shifts have contributed to a more risk-averse approach to development in proven markets and those consulted would be minded to deliver high-end properties in proven markets within which they are familiar. Of those consulted, this was Shropshire, Cheshire and South Manchester.
7.3.4 One developer noted that should the right opportunity arise they would consider the market;
this would have to meet a number of set criteria, such as being broadly located within a proven high value market, in a rural, fringe location and with good transport access. Allied to this was the need for supportive planning policies, permitting development in potentially Greenfield locations and at lower densities than currently permitted by policy. Lower densities of approximately 20 – 25 dwellings per hectare were mentioned3, though both national and local planning policy were regarded as obstructions to developing higher value, lower density dwellings.
7.3.5 This concern relates both to planning policy and to a lack of land opportunity to deliver this
product in the right location. Developers would look for a more flexible policy that actively permitted lower density dwellings in desirable locations, as has been the case elsewhere in
3 Although this density does not reflect a true executive market, it indicates the thinking of developers

arc4 RENEW NSRP Executive Housing Market Research Sept 2010 47 of 80
the country. Density requirements determined by a restrictive planning policy framework are regarded a constraint on viable delivery, allied to the fact that perceived relative lower income and wealth levels will result in lower end values in the current Stoke market
7.3.6 All developers stated that they are constantly looking for opportunities and feel that in relative
terms there is a potential demand pool of professionals in neighbouring areas of Newcastle-under-Lyme who would be a ready market for new build products. A number of interviewees involved in land buying stated that they had ‘land in the pipeline’ in Newcastle-under-Lyme, but Stoke did not offer an attractive marketplace in comparison. Given the margin differentials upon which the respective developers work and the current economic downturn, they remain risk averse and claim the location must be appropriate in terms of access to wider factors such as employment and lifestyle opportunities.
7.3.7 The current views and risk-averse strategy militates against development, given the
downturn and associated impact on investment in wider facilities to change the perception that Stoke in particular is a desirable place to live. The restructuring of the local economy has had a deep impact on perception and the authority lacks the focus and aspirational quality that neighbouring locations benefit from such as South Manchester, Cheshire and Shropshire. Joined up proactive approaches to exceptions policies and inward investment in regeneration and associated lifestyle offer will impact positively upon this perception.
7.3.8 Notwithstanding the wider constraints, developers remain open to the potential of the local
authority to deliver an executive product to retain highly paid employees that would otherwise move to adjacent authorities. However, delivery of this market product in the right location, in this respect the developers maintain semi-rural / rural, must be in tandem with a wider strategy to develop the lifestyle offer, including leisure, retail and educational offer.
7.3.9 Developers believe a cautious approach would be beneficial in testing the market, bringing
forward a select number of properties adjacent to proven markets. There is acknowledgement that a proactive approach is required from the local authority through the SHLAA and LDF process, in certain cases releasing greenfield sites for development in the right locations. In addition, a clear strategic policy approach encouraging this development in terms of other housing policies and the suite of development obligations need to be set out to the developers. This includes consideration of potential exemption from density requirements and affordable housing provision.
7.3.10 Active interventions in terms of lower land prices, potentially including that within council-
ownership, would address the development cost obstacle to producing properties at lower densities.
7.3.11 The conclusions are that the market in respect of executive housing development in North
Staffordshire depends upon a number of key issues being addressed across sectors beyond housing. Stoke-on-Trent of the three North Staffordshire local authorities remains subject to a negative perception in terms of being an aspirational location to live compared to adjacent authorities in the sub-region including South Cheshire with an established executive high-end property market. Developers are keen to develop high-end products in the right location; however, they remain risk averse unless there is a wider lifestyle offer being made available that will successfully change perceptions in comparison to ‘safer’ markets for this product elsewhere.

arc4 RENEW NSRP Executive Housing Market Research Sept 2010 48 of 80

arc4 RENEW NSRP Executive Housing Market Research Sept 2010 49 of 80
Section 8 Current supply of New Build Executive Housing 8.1.1 This section examines in detail the key supply side trends pertinent to the market for a
broader housing requirement in North Staffordshire and the development of potential sites for this purpose. We examine those elements of supply affecting the housing system in general.
8.1.2 We provide an analysis of the historic new build supply in terms of executive housing and the
degree to which this is meeting the requirements of this niche market. In addition, we examine future supply in terms of outstanding planning applications across the sub-region and the effect that this would have on current supply. It is clear from our analysis that Stoke’s housing stock is particularly constrained in terms of offering a broad residential choice across the spectrum, specifically at the top-end of the market compared to both Staffordshire Moorlands and Newcastle-under-Lyme. Over time, the existing housing stock will experience increasing pressures from a growing and varied pool of household demand. To achieve the economic, social and environmental objectives outlined for the city, the planning system will need to respond and facilitate new build supply that is broader than it currently is.
8.1.3 The major sources of information used in this element of the report include Stoke City
Council, Newcastle-under-Lyme and Staffordshire Moorlands planning data and the latest Strategic Housing Market Assessment for North Staffordshire.
8.1.4 The strategic approach established in line with national planning policy guidance for housing
delivery has been predominantly brownfield. The emphasis on brownfield delivery aims to balance conservation with development and achieve the objective of sustainability including reducing the need to travel. Stoke benefits from having a considerable quantity of brownfield regeneration sites, the development of which is fundamental to the delivery of the RENEW North Staffordshire Business Plan and Pathfinder Initiatives. In tandem with the regeneration of the city centre however, the aims include delivery of a broader supply of housing typologies to attract and retain the skilled workforce underpinning the growth of the knowledge economy.
Planning perspective on future executive development 8.2.1 In terms of new build executive housing development across the three respective local
authorities, all planning departments report that this has been limited, reflecting the views of the local agents commenting upon period and conversion properties comprising this market. The three respective authorities, in line with national policy guidance, have recorded an increase in the average densities of applications on housing sites.
8.2.2 The aspirational requirement to increase the number of executive style properties within
Stoke and diversify the housing offer has not translated to date in planning applications for such developments. The local authority currently record 59 outstanding permissions for development of four bedroom properties, however officials report that some permissions remain outstanding with the possibility of not being built out and only a nominal number would be classified as ‘executive properties’.
8.2.3 Likewise, in Staffordshire Moorlands, though an authority well served with high-end value
properties, the future supply of executive properties totals seven outstanding planning permissions, anticipated to achieve market end values in excess of £450,000.

arc4 RENEW NSRP Executive Housing Market Research Sept 2010 50 of 80
8.2.4 In Newcastle, plans are being progressed by Keele University to develop the 6-hectare Hawthorns site in the centre of Keele Village for a mixed development, which will contain some Executive Housing. There have been planning issues concerning this proposal, however officers at Newcastle Council have worked with the University and have had a clear preference for low density development to include large executive homes with large gardens. The plans as currently framed provide for a mixed development comprising of 71 housing units ( a mix of 2, 3, 4 (20 no) and 5 bedroom houses (18 no, with over 2,000 sq m of floor-space) of terraced and detached varieties, together with a 129-place “active ageing” unit which will contain houses, apartments and beds. The aim is to “provide quality housing to support the high quality jobs being created in the University, the Science Park and the surrounding area.” The development is “targeted at a varied market as people employed in these jobs may be first time buyers (eg graduates), local people, people moving into the area, and families looking for quality living space near to the work place”. The mix in the development has been informed by a combination of in-house research by the developer partner, public consultation events, and consultation with companies locating into the Science Park. The scheme will tae place over a 5 year period, of which the first few years will be taken up with developing new Halls of Residence, after which the housing will be developed.
8.2.5 The LDF Core Strategy establishes a target of 90% brown field and 10% green field
development in the context of the city comprising in excess of 20,000 dwellings capacity on previously developed brown field land. However, current green field commitments are limited and much of the local authority is constrained by the adopted North Staffordshire Green Belt.
8.2.6 Further conflict with national policy arises with density requirements to maintain new
development in excess of 30 dwellings per hectare. However, planning officials identify that sites should be considered individually and there is more potential for effective implementation and control on sites in council or NSRP ownership. This can include sale of individual plots for bespoke units, control of densities and infrastructure.
8.2.7 The potential capacity within the local authority for this sector could therefore be
considerable in terms of phased release of bespoke detached properties marketed across the sub-regional area. Sub-regional executive sales equate to approximately 106 sales per annum, however only thirteen new build sales were recorded over the period Q1 2007 – Q2 2009 within the three authorities of North Staffordshire. This limited level of development may be partially attributable to lack of product offer in the Stoke-on-Trent local authority; however it highlights that a cautious approach to delivery of a select number of units in a desirable location is likely to be the preferred option for development.
8.2.8 This reflects the views of planning officials across the North Staffordshire area, recognising
the stable market for higher value property in Newcastle-under-Lyme and the sustained demand for this market in Staffordshire Moorlands. The approach to development of executive housing in Stoke-on-Trent is welcomed as beneficial to the overall North Staffordshire housing market. The view is that the approach must however focus upon existing desired locations in close proximity to equally high value properties. Quality of place factors such as good schools, access to lifestyle amenities, leisure, retail, good transport links and open space will determine demand and viability. There is consensus that although potential demand exists in the sub-region, development in Stoke should focus upon short-term, easy wins and traditional “pull factors” to generate demand due to the absence of such existing products in the local market.

arc4 RENEW NSRP Executive Housing Market Research Sept 2010 51 of 80

arc4 RENEW NSRP Executive Housing Market Research Sept 2010 52 of 80
Section 9 Developing an executive housing market Creating the conditions for executive housing market 9.1.1 The decision to purchase and move can have a significant impact on the circumstances and
living arrangements of a household. It is this characteristic that differentiates the housing market from many others. Integral to housing as a consumer good is its spatial location. Location is important and features heavily in the decision making of purchasers and vendors.
9.1.2 Indeed although the most subjective measure in defining an executive housing market, there
needs to be an environment to encourage the creation of demand from the most affluent households in the region. Most prime executive markets are coherent and contiguous areas which cover a relatively tightly defined location, these may be gated communities or estates, providing a prestigious location and environment.
9.1.3 The concept of ‘quality of place’ defined as, ‘the sum of those factors – culture, local
environment, public realm, housing, community safety, access and health – which together make somewhere an attractive place to live’4 has been an oft-overlooked issue in the speculative-led development model of UK towns and cities. The ‘residential offer’ as an integral part of the overall ‘quality of place’ and a driver in the residential choices made by particular groups, is inextricably linked to the growth of the local economy and sustainable place-making.
9.1.4 Housing and its contribution to the creation of quality of place should be recognised as
fundamental to underpinning the performance of local economies. The NSRP Business Plan, reflecting the aims of the wider WMRSS recognise that in order to drive the regional and local economy, will depend predominantly upon the ability to attract and retain those employees within the burgeoning service and knowledge-based sectors.
9.1.5 The most significant factor for a robust, competitive economy is the extent to which places
have a skilled, creative and entrepreneurial workforce. The modern knowledge economy relies more on people and their skills than any other primary driver of economic growth. Corporations choose to locate in areas comprising knowledge capital and a well-educated workforce. Consequently the competitiveness of place is reliant upon providing the conditions that will attract and retain the most mobile and skilled workforce.
Creating the conditions for growth – providing a quality residential offer and places 9.1.6 The perceived ‘quality of place’ incorporates a number of inextricably linked concepts
including local level liveability factors such as environmental quality, access to services such as schools, healthcare, shops, parks and open spaces, and on a city/regional level incorporates factors such as city centre lifestyle offer, cultural offer and the presence of higher education institutions. The local factors have implications within an area, whereas the city/regional factors are regarded as contributing to locational choices of the more mobile economic workforce.
9.1.7 The attraction of a mobile skilled workforce to North Staffordshire is strategically imperative
to support economic growth and realise the ambitions of key stakeholders in the sub-region. 4 Llewelyn Davies Yeang, ‘Quality of Place: The North’s Residential Offer, Phase IIa Report’, 2006.

arc4 RENEW NSRP Executive Housing Market Research Sept 2010 53 of 80
The concept of ‘residential offer’ as formulated by Llewelyn Davis Yeang5, impacts upon both local and city/regional levels, as the absence of, or a limited ‘residential offer’, will serve to prevent the attraction and retention of key workers and thus reduce the pool of skilled employees.
9.1.8 As the SHMA illustrates the housing tenure within Stoke in particular is skewed towards the
mid – low private sector housing, with a preponderance of terraced properties indicative of a restricted ‘residential offer’.
9.1.9 ‘Residential offer’ is defined as, ‘a composite of housing factors – including range, quality
and value for money – which together inform an individual’s or household’s local and regional locational choices’ (Llewelyn Davies Yeang, 2006).
9.1.10 ‘Quality of place’ is defined as, ‘the sum of those factors – culture, local, environment, public
realm, housing, community safety, access, health – which together make somewhere – whether a town, city or region – an attractive place to live’ (Llewelyn Davies Yeang, 2006). Fig 7.1 below illustrates the role of residential offer within the context of ‘quality of place’, understanding the relationship between ‘quality of place’ and economic competitiveness.
Figure 9.1: The role of residential offer in place making
Source: Llewelyn Davis Yeang, 2006 9.1.11 The right combination of liveability and attraction building factors listed above, contributing to
the creation of ‘Quality of place’, help to entice the right people and businesses to an area, supporting economic development and competitiveness. The potential of certain groups to contribute disproportionately to the long-term competitiveness of cities have helpfully been identified within a suite of studies into the city regions of the Northern Way (Llewelyn Davies
5 Llewelyn Davies Yeang (2006): ‘Quality of Place: The North’s Residential Offer. Phase IIa Report’.
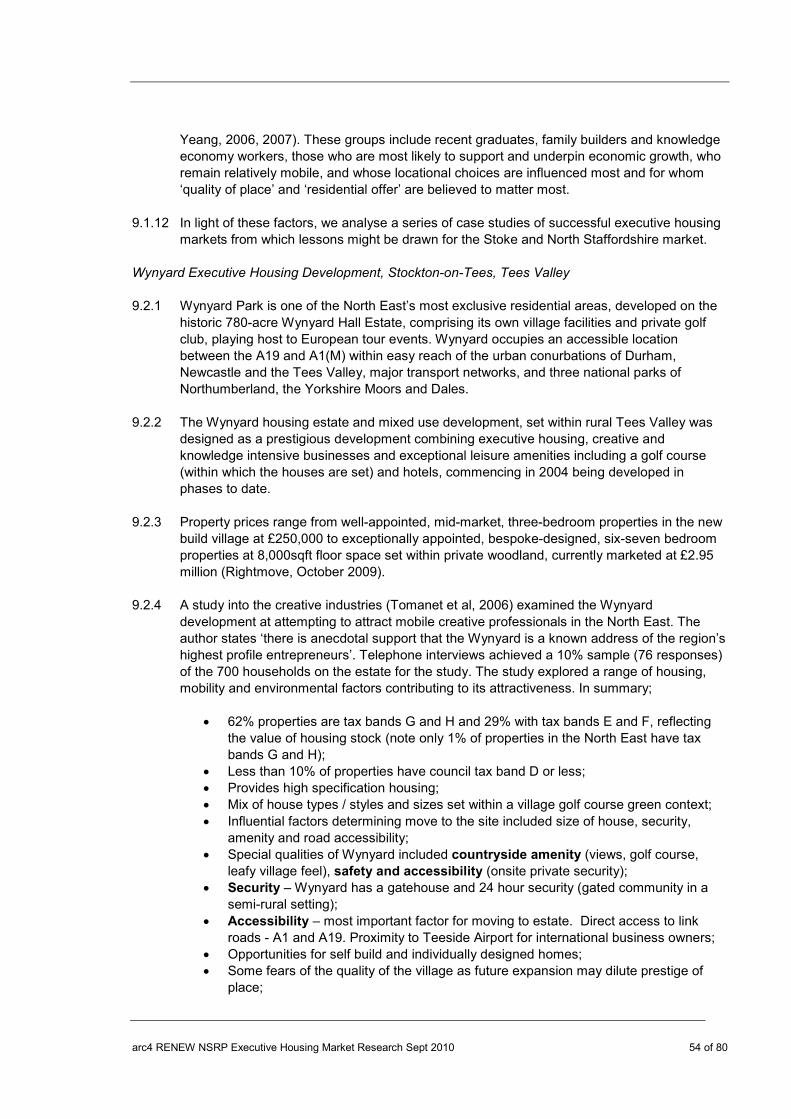
arc4 RENEW NSRP Executive Housing Market Research Sept 2010 54 of 80
Yeang, 2006, 2007). These groups include recent graduates, family builders and knowledge economy workers, those who are most likely to support and underpin economic growth, who remain relatively mobile, and whose locational choices are influenced most and for whom ‘quality of place’ and ‘residential offer’ are believed to matter most.
9.1.12 In light of these factors, we analyse a series of case studies of successful executive housing
markets from which lessons might be drawn for the Stoke and North Staffordshire market. Wynyard Executive Housing Development, Stockton-on-Tees, Tees Valley 9.2.1 Wynyard Park is one of the North East’s most exclusive residential areas, developed on the
historic 780-acre Wynyard Hall Estate, comprising its own village facilities and private golf club, playing host to European tour events. Wynyard occupies an accessible location between the A19 and A1(M) within easy reach of the urban conurbations of Durham, Newcastle and the Tees Valley, major transport networks, and three national parks of Northumberland, the Yorkshire Moors and Dales.
9.2.2 The Wynyard housing estate and mixed use development, set within rural Tees Valley was
designed as a prestigious development combining executive housing, creative and knowledge intensive businesses and exceptional leisure amenities including a golf course (within which the houses are set) and hotels, commencing in 2004 being developed in phases to date.
9.2.3 Property prices range from well-appointed, mid-market, three-bedroom properties in the new
build village at £250,000 to exceptionally appointed, bespoke-designed, six-seven bedroom properties at 8,000sqft floor space set within private woodland, currently marketed at £2.95 million (Rightmove, October 2009).
9.2.4 A study into the creative industries (Tomanet et al, 2006) examined the Wynyard
development at attempting to attract mobile creative professionals in the North East. The author states ‘there is anecdotal support that the Wynyard is a known address of the region’s highest profile entrepreneurs’. Telephone interviews achieved a 10% sample (76 responses) of the 700 households on the estate for the study. The study explored a range of housing, mobility and environmental factors contributing to its attractiveness. In summary;
• 62% properties are tax bands G and H and 29% with tax bands E and F, reflecting
the value of housing stock (note only 1% of properties in the North East have tax bands G and H);
• Less than 10% of properties have council tax band D or less; • Provides high specification housing; • Mix of house types / styles and sizes set within a village golf course green context; • Influential factors determining move to the site included size of house, security,
amenity and road accessibility; • Special qualities of Wynyard included countryside amenity (views, golf course,
leafy village feel), safety and accessibility (onsite private security); • Security – Wynyard has a gatehouse and 24 hour security (gated community in a
semi-rural setting); • Accessibility – most important factor for moving to estate. Direct access to link
roads - A1 and A19. Proximity to Teeside Airport for international business owners; • Opportunities for self build and individually designed homes; • Some fears of the quality of the village as future expansion may dilute prestige of
place;

arc4 RENEW NSRP Executive Housing Market Research Sept 2010 55 of 80
• The search radius of movers was vast. Rather than competing with other local areas, the move to Wynyard was enacted over a regional scale, preventing moves to Leeds, York and Harrogate (see agent commentary above);
• 40% of movers originated either outside of the North East or from overseas; • Wynyard offers an aspirational housing market, well beyond local authority
boundaries; • 40% of respondents stated owning their own business.
9.2.5 The study concludes, ‘the Wynyard was a bold investment strategy. Pioneers that bought the
plots of their choice and developed their own individually designed home undoubtedly added to the prestige of the residential environment that has been created and equally importantly help to offset the risk and cost of upfront investment in creating the road, utilities and leisure infrastructure. The study strongly suggests that exceptional housing sites on the urban fringe and beyond will compete with locations across a much wider area than the adjacent conurbation, this does not mean that we should ignore their impact on urban centres. It is critical any social consequences of further housing land releases beyond the urban area are understood as well as potential economic consequences’ (Toumanet et al, 2006).
Darras Hall, Runnymede Road, Ponteland, Newcastle 9.3.1 Reflecting the prestige of Wynyard in Stockton, Darras Hall, Ponteland is renowned as one
of the North East’s most exclusive residential areas. This in no small part, due to Runnymede Road serving as an enclave of executive, new build properties, principally built to bespoke designs by North East sportsmen and business leaders. The location benefits from proximity to the transport network of A19 and A1, Newcastle International Airport and neighbouring leisure facilities such as several golf courses and lifestyle offer of Newcastle.
9.3.2 New build properties are lavish in terms of interior specification and expansive in floor space,
ranging from four bedroom properties at 3,000sqft to eight bedroom properties in excess of 5,500sqft. These range from £350,000 for converted older stock to £4 million for high specification new build detached properties with extensive secure grounds.
Grey Towers Farm, Middlesbrough 9.4.1 A similar highly desirable location in the north-east, located on the edge of Middlesbrough,
the site incorporates new build and the high-specification conversion of Poole Hospital by Yuill and Countrywide. The aspect is mature woodland and agricultural land in close proximity to Middlesbrough golf course and a designated ‘special landscape area’. Properties are low density with provision of extensive private outdoor space and integrated mature landscaping throughout the site.
9.4.2 The development comprises predominantly new build detached executive housing and high-
end apartments in the converted hospital. Overall achieved prices remain the highest in Middlesbrough with five and six bedroom properties marketed between £575,000 - £630,000 respectively.
Alderley Edge, Cheshire 9.5.1 For a location with a population under 5,000 persons (ONS Census) the village has become
a renowned location of choice within the Cheshire marketplace for HNWIs. The area currently has more than 50 properties marketed in excess of £1 million and a showcase of new build development in one location for the executive housing market. An example new

arc4 RENEW NSRP Executive Housing Market Research Sept 2010 56 of 80
build property incorporating ultra modern design and environmental bespoke technology is currently being marketed for £1.1 million and approximates 6,300 sq.ft. The specification of the five en-suite bedrooms includes cinema room, study, indoor swimming pool, spa, high specification kitchen and bathrooms, solid wood doors and floors, security gates and video entry, pre-wired entertainment system throughout the property.
Accordia, Cambridge 9.6.1 The 9.5-hectare residential development on the edge of Cambridge city centre includes three
to five new high-quality homes ranging from £400,000 - £1.1 million. The development by Countryside Properties, features high architectural quality from three practices Feilden Clegg Bradley (65%), Maccreanor Lavington (25%) and Alison Brookes Architects (10%). The development benefits from a range of individual villas, terraced houses and apartments set within large open communal areas. In terms of design, the development is tenure-blind, with the 30% affordable housing indecipherable from the private housing, having proximity to open spaces and set within slow speed streets.
9.6.2 In anticipation of recently introduced legislation for Lifetime Homes Standards on all new
build by 2013, most homes have been designed to Lifetime Homes Standards accommodating changing life patterns. Adaptability is achieved through adoption of constructional techniques such as party walls with light steel frame infill and moveable partitions.
9.6.3 The principle of Super-Flexible Homes adheres to utilising the full volume of the building
envelope, such as loss of attic spaces into usable spaces, avoiding load-bearing walls in the centre of units, the dwelling offers the potential to be flexible and adapted in a number of ways including sub-division into a number of rooms.
9.6.4 In terms of sustainability, high quality construction and detailing have resulted in high
insulation performance significantly outperforming Building Regulations to BREAAM Excellent. High SAP ratings and air tightness allow for future integration of renewable energy technologies. High thermal mass provides cooler dwellings in summer, flat roofs are sedum-planted for high insulation and runoff management.
9.6.5 The masterplan was designed for pedestrian and cycle demands with landscaped pedestrian
streets and mews streets including discreet car parking. Winner of the Housing Design Award 2006, CABE Building For Life Gold Standard, Best Housing Project of the Year 2006 and Civic Trust Award. The attention to high architectural and construction quality, combined with a wide consultation process informed the masterplan. It involved local design groups, residents associations, CABE, English Heritage and the local authority, winning strong support from the local council and allaying local residents initial concerns.
The Square, York 9.7.1 The Square is an exclusive residential development situated in close proximity to the city
centre, A64 and M1 road network and good access to York rail station. It is designed on the plan of a Georgian Square and features three storey period style townhouses and upper market apartments. The Square comprises three, four and five bedroom town houses overlooking the garden square and two bedroom apartments and duplexes overlooking rural

arc4 RENEW NSRP Executive Housing Market Research Sept 2010 57 of 80
aspect to the south west and is built adjacent to one of the highest property value areas in the city.
9.7.2 The Square features bespoke high specification interior finishes throughout made to the
purchasers requirements and security system entry to the development. Purchasers have included those employed in Leeds, Manchester and London due to the transport network accessibility. For the townhouse properties, prices range from £350,000 - £720,000.
Bardon Hall Gardens, Leeds 9.8.1 Located within a gated community with security guard gatehouse access this development
comprises new build five to seven bedroom properties in excess of 3,500sqft – 5,500sqft and a converted period mansion house and stable block mews houses. The development is located integrally with the existing high value suburban properties, but is secluded set within mature landscape adjacent to a city park.
9.8.2 The development has good access to the city centre and transport links, is in the catchment
of the city grammar school and adjacent to leisure facilities. Prices have achieved £890,000 within the last year for a detached new build property.
Lower Mill Estate, Gloucestershire 9.9.1 Set within 450 acres of Gloucestershire countryside and incorporating two Sites of Special
Scientific Interest (SSSIs), individual plots have been designed by 24 global architects. In close proximity to Cirencester the location is set within established Somerford Keynes water reserve. The properties are of bespoke design to purchasers specification and showcase the latest in globally renowned architectural practice.
Section 10 Conclusions Executive Housing Market Definition 10.1.1 The term ‘executive’ equates to the most desirable and commonly, most expensive property
in a particular location, due to their exclusivity. The market for executive housing is regional,

arc4 RENEW NSRP Executive Housing Market Research Sept 2010 58 of 80
as purchasers of executive housing will often travel over large distances to employment locations, partly reflecting mobile work-related needs and partly to secure the desired character of residence. In broad terms, executive housing is acknowledged as, ‘High quality accommodation in low density, suited to the needs and aspirations of higher income households’. 6
10.1.2 An executive housing market can be defined in a number of ways combining the property
value, but including a suite of other elements such as density, design, location and specification, in order to establish a meaningful definition. In addition to a price level, this may include for example factors such as low density (e.g., approximating five units per acre), with large floor space in excess of 2,000sqft, offering facilities such as 4+ bedrooms, double garages and en-suite bedrooms or luxury apartments in desirable locations. They can include bespoke design and self-build and are generally in owner occupation.
10.1.3 To establish a measure of the size of the executive property market for the area that includes
North Staffordshire, we analysed the depth of this market by transaction activity, sale price and council tax banding. This identified that the price levels for comparable properties are, in some instances, lower in Stoke than elsewhere. We also identified several different levels at which the market operates in order to capture the top end of the market for comparable properties across North Staffordshire.
10.1.4 Our analysis therefore includes
• Council tax banding E – H, rather than just G – H, to include the top end of the residential markets in each LA.
• The sales value ranges we have identified are; Ø £400 - £500K range covers the high end property stock in Stoke and but a
significantly greater part of the property market in Newcastle-under-Lyme and Staffordshire Moorlands;
Ø £500 - £750K range covers the most exceptional and exclusive’ properties in Stoke and the ‘very high end’ properties in Newcastle-under-Lyme and Staffordshire Moorlands; at this price level commentators agree that this represents an executive market;
Ø £750K+ covers the ‘exceptional and exclusive’ properties in Newcastle-under-Lyme and Staffordshire Moorlands; there were no transactions in this price level in Stoke.
Current executive housing market in North Staffs 10.2.1 Council tax records indicate that in the target bands of E – H, a total of 2,273 properties (2%)
were identified within Stoke, compared to more than double at 5,107 properties (9.6%) within Newcastle-under-Lyme and a further 6,649 properties (15.7%) within Staffordshire Moorlands. The disparities become even greater when considering the bands F – H, with 617 properties (0.6%) in Stoke compared to 2,573 (4.8%) in Newcastle-under-Lyme and 2,613 (6.2%) within Staffordshire Moorlands.
6 Tomaney, J. Bradley, D. (2006). The economic role of mobile professional and creative workers and their housing residential preferences: evidence from North East England. Nathanial Lichfield and Partners. Centre for Urban and Regional
Development Studies, University of Newcastle upon Tyne. Newcastle.

arc4 RENEW NSRP Executive Housing Market Research Sept 2010 59 of 80
10.2.2 In terms of ward distribution of higher value properties in Stoke, the three wards of Trentham and Hanford (30%), Meir Park and Sandon (16.9%) and Abbey Green (11.2%) contain almost two-thirds of all Stoke properties within bands E – H, at 58.1%.
10.2.3 Land Registry sales data between Q1 2005 – Q2 2009 comprised 31,702 individual
residential sales records from open market transactions in the three local authorities of North Staffordshire. The numbers of private sector sales is far greater in Stoke at 18,839 transactions over this period, compared to 7,139 in Newcastle-under-Lyme and 5,724 sales in Staffordshire Moorlands.
10.2.4 Due to the very low level of sales of other types of properties, the analysis has focussed on
the numbers of detached sales in the higher price categories. High value detached property represents a minor component of Stoke’s housing market with a total 3.8% of transactions recorded above £400,000, characterising the limited high-end housing market. Comparable levels of transactions in Newcastle-under-Lyme and Staffordshire Moorlands are recorded at 5.7% and 6.9%.
10.2.5 The total number of recorded transactions for detached houses above the £400k threshold
between 2007 and 2009 Q2 was 63 sales in Stoke, comprising existing re-sale stock in rural-suburban locations (note only 3 further non-detached properties). This compares to 53 sales in Newcastle-under-Lyme and 78 in Staffordshire Moorlands, predominantly existing detached in rural locations. Table 10.1: Higher end of market sales in North Staffordshire
Market Definition No of sales 2007 - 2009 Q2 (% 0f all sales)
Stoke Staffs Moorlands Newcastle
High end market £400k -500k 53 (3.2%) 55 (4.9%) 32 (3.4%)
Very high end
market
£500k -£750k 10 (0.6%) 21 (1.9%) 18 (1.9%)
Exclusive and
exceptional
properties
over £750k 0 2 (0.2%) 3 (0.3%)
Totals - All high
end market
All above £400k 63 (3.8%) 78 (6.9%) 53 (5.7%)
10.2.6 There is an absence of new build executive property supply on the current market throughout
the three local authorities of North Staffordshire. A total of 13 new build sales in the above price bands were recorded within the three authorities of North Staffordshire between Q1 2007 – Q2 2009.
10.2.7 The analysis by sale price levels suggests a relatively larger proportion of higher value properties in Stoke than does the Council tax bands. The Council tax data (bands E-H) suggests that 17% of high value properties are in Stoke, whereas the sale price data suggests 32%. One possible reason may be that the relative values have changed since the 1991 base date for Council Tax banding, but we think this is unlikely to be a major factor. It seems more likely that the turnover of higher value property is greater in Stoke. Executive Housing Market: wider sub-regional housing market area

arc4 RENEW NSRP Executive Housing Market Research Sept 2010 60 of 80
10.3.1 As the research identifies, the market for executive housing operates over a wide area, larger than housing markets are normally defined. The market is often described as regional, but as North Staffordshire sits on the boundary of two regions, we based it on the wider reference area for the North Staffordshire housing market. This includes, in addition to North Staffordshire, the (pre-reorganisation) LA areas of Crewe and Nantwich, Congleton, Stafford and North Shropshire.
10.3.2 The overall level of sales across this wider market reference area gives an indication of the overall size of the market. The headline figures are based on the annual level of transactions of detached houses at prices of £500k and over, based on 2007 and 2008. This covers a year that had buoyant activity and one of declining activity. The figures for the first half of 2009 are much lower, and represent a depressed rather than a normal market. On this basis, there was an annual average of 106 sales at this high end of the market across the wider sub-regional area. Of these, 25 were in North Staffordshire and 5 in Stoke. This gives a good indication of the scale of the true “executive housing” market in which North Staffordshire is competing.
10.3.3 If the price bands were widened to properties at £400k and above, the market would be defined as nearly three times as large, with an annual 305 sales, of which 90 were in North Staffordshire and 62 in Stoke. This represents the overall top end of the housing market.
10.3.4 We compared the workplace location of higher-income earners with the distribution of executive housing. It shows relative low workplace incomes in North Staffordshire and confirms that a net outflow of higher-income earners from Stoke is matched by a substantial inflow of higher income earners to Newcastle and Staffordshire Moorlands. Whilst the available income data does not give us direct evidence about the extent to which workplace incomes drive the executive housing market, it strongly suggests that there is an overall balance in the North Staffordshire market area. It shows that there are relatively few very high earners in the North Staffordshire market as compared to the adjacent S Cheshire and Stafford areas. The relatively low levels of activity in the North Staffordshire executive housing market may simply be reflecting this underlying weak level of demand. Factors that will influence future demand
10.4.1 Those areas across North Staffordshire recording the highest household income levels, in excess of £50,000, correspondingly have the highest-value recorded property sales and the highest proportion of residents classified as ‘Wealthy Achievers’.
10.4.2 We examined whether demographic trends would influence the future levels of demand for executive housing. The demographic trends provide one proxy of projected demand, as change in the numbers within the 35-59 age cohorts (that are the main purchasers of executive housing) will influence actual demand. The projections for each N Staffs LA area show a significant decline in this age group, although there is a different pattern in South Cheshire. We have to be cautious as this may reflect past migration pattern built into the demographic projections and the fact that demographic trends are development neutral and would not reflect demand created through supply of this housing type. Taken on their own, we would not expect the demographic trends in North Staffordshire to stimulate a rise in demand for executive housing.
10.4.3 There are recent projections of future employment and income levels from work carried out for the West Midlands Regional Assembly by SQW, Experian and Cambridge Econometrics. This suggests that the total number of jobs in Stoke may decline over the period to 2031

arc4 RENEW NSRP Executive Housing Market Research Sept 2010 61 of 80
without further intervention, with a modest increase in the types of employment that will drive executive housing demand i.e. professional and managerial jobs. However given the fragile structure of the local employment market, reliant on manufacturing and lower skilled jobs, a policy-on approach to encourage high-value manufacturing and specialist sectors is required to engender resilience in the future economic cycle (Experian). Estate agent evidence
10.5.1 The evidence from agents is important to understanding the nature and possible changes in
this market. Purchasers moving into the executive housing market are reported by agents as being predominantly wealthy working executives, such as industry leaders and sportsmen classified as Wealthy Achievers (ACORN) including High Net Worth Individuals (HNWIs)7.
10.5.2 Common attributes associated with executive household purchases within this market
include predominantly detached period houses, or occasionally new build within a contiguous, prestigious environment with properties of comparable specification and price, or individual properties within gated settlements, offering a high level of security and privacy including bespoke security arrangements, being viewed as an essential feature for many purchasers.
10.5.3 In terms of location, accessibility is a principle reason influencing locational choices for
primary residences. The main reasons being ease of access between their property, work or leisure pursuits and access to international airports. Purchasers in this category tend to gauge accessibility in terms of travel time. Agents noted that accessibility to transport links and major employment centres would be a key contributory factor to purchase.
10.5.4 For the primary residence to be accessible a maximum daily journey time to a place of work
should be no more than one – one and a half hours. This highlights both the generally accepted assumption that the executive housing market operates beyond local authority boundaries and is characterised more on the scale of sub-regional and regional scales.
10.5.5 The importance of both ‘Quality of Place’ and ‘Residential Offer’ is imperative in providing
purchasers access to excellent employment, leisure and cultural facilities, either in their residence or within the immediate vicinity. A key element of the success of many executive developments is the accessibility to lifestyle leisure, retail facilities and proximity to good schools, often within a 30-minute drive time to a selection of good restaurants and leisure pursuits.
10.5.6 There has been a noticeable increase in transactions for agricultural properties in recent
years with a noticeable trend for lifestyle-ownership comprising equestrian facilities. In addition developers are increasingly incorporating high quality design, often bespoke reflecting the purchaser’s lifestyle expectations. There is a certain cachet associated with the level of design and integrated facilities within incorporating extensive leisure and wellness features.
7 High net worth Individuals (HNWIs) those individuals with high net worth in investable assets typically between £500,000 - £5M. Individuals below £500,000 but above £100,000 are referred to as Mass Affluent. Due to the nature of this study, we
include primary residence as an asset allocation. This definition of HNWIs will include those categorised elsewhere in the
report as Wealthy Achievers.

arc4 RENEW NSRP Executive Housing Market Research Sept 2010 62 of 80
10.5.7 Agents see Staffordshire Moorlands and South Cheshire as the principal search areas for executive properties across the sub-region, catering for both housing offer and the desired locational aspects. New build properties within this market are limited and the area of search for new build within the high-end market extends beyond North Staffordshire to Stafford in the south and South Cheshire to the north.
10.5.8 The size of the potential demand pool was gauged from the nine agents surveyed. Those
that recorded the number of registered clients for properties, the number varied from ten – fifteen clients each for properties registered above £500,000 and 45 – 60 clients for properties above £350,000. Given the likely level of multiple registration, this suggests that about 30-50 clients were active in the top end of the market (over £500k) at the time of the research. This is broadly consistent with our earlier estimates of the size of the sub-regional market, based on the number of property sales (106 per year). Focus group attitudes and aspirations
10.6.1 The positive aspects of the focus group feedback is that the area was considered well
located to green infrastructure and open rural space, benefiting from good transport links to the rural areas and likewise to locations of employment. The considered consensus was that if a resident has a positive attachment to the local area, there would be a considerable demand to remain. Investment in a quality public realm, such as Trentham Gardens and Cultural Quarter, was highly regarded by the focus groups.
10.6.2 However, these points are mitigated by the consensus that the City centre and the
associated district centres lack a focus, suffering from poor wider perception of the area and lacking a wider lifestyle offer including retail and leisure. Furthermore, the lack of well-paid professional employment opportunities in the area was regarded as a negative aspect to the potential for retaining and attracting higher paid earners to the area. Retaining talented people and wealth in the area was seen a key issue. The universities were seen as a major strength for the area.
10.6.3 In terms of executive housing, the focus groups felt that there was no true offer within the
authority. Some stated they were already in the most ‘exclusive’ neighbourhoods in the area in neighbouring Newcastle-Under-Lyme, with nowhere to move up to. Respondents felt that provision of executive properties must be supported by a wider lifestyle offer and well-paid employment opportunities. Developer perceptions
10.7.1 Developers are constantly looking for opportunities and feel that in relative terms there is a
potential demand pool of professionals in the sub-region who could be a ready market for new build executive products. However, delivery of this market product in the right location, in semi-rural / rural, must be in tandem with a wider strategy to develop the lifestyle offer, including leisure, retail and educational offer. In the current economic climate, Stoke is not perceived to offer an attractive location choice for developing higher end dwellings, given the relative lower income levels and lower-skilled demographics. But if there were a pro-active approach by the local authorities, certain of the developers would be prepared to consider Executive Housing development opportunities if they were in existing higher value, accessible and semi-rural locations.
Planning views

arc4 RENEW NSRP Executive Housing Market Research Sept 2010 63 of 80
10.8.1 The aim to increase the number of executive style properties, especially within Stoke, and to diversify the housing offer is welcomed across the North Staffordshire area, but has not translated to date in planning applications for such developments. There is potentially the scope for this type of development. Specifically in Stoke, there are potential sites with the capacity to deliver 130 – 200 dwellings regarded as executive, with the capacity to more than double the number of dwellings in the uppermost tax bands G and H.
10.8.2 A logical approach to development of a relatively untested new build executive market, must consider the points identified in this research. To provide a framework we set out below a summary of the strengths and weaknesses of North Staffordshire as a location for new Executive housing. Strengths and Weaknesses of North Staffordshire as location for new Executive Housing Factor Strengths Weaknesses Location Mid-way between Manchester
and Birmingham, so big potential market.
Stoke has negative image and need avoid a “Stoke” label.
Some sites have easy access to M6 and A50
There are intervening very attractive, established Executive locations nearer to Manchester and Birmingham
45-50 minutes to Manchester airport
Good trains to London, Birmingham and Manchester
Attractions of the area
Close to Peak district and Shropshire country
Not the same Cachet or amenities as “Cheshire”
Keele and Staffs universities Rather a quiet backwater without strong “society” offer. Few premium larger local hotels/venues
Independent Schools OK But not the breadth of choice of Manchester or Birmingham schools offer.
Trentham Gardens, Biddulph Grange; possibly local theatres. Alton Towers?
Very limited cultural offer
Many Golf courses But not very well known? Underlying demand
Possibly benefit from growth in adjacent City Regions
Weak economy and relatively few high income jobs
Little projected population growth Recommendations
10.8.3 The evidence indicates that current provision of true executive housing is limited and the offer may not meet the aspirations of the potential executive purchaser and existing wealthy residents. This has a number of economic implications such as loss of council tax revenue, lack of local entrepreneurs and business leaders and reduced demand within the leisure and service sector.
10.8.4 However, the overall size of the market is modest, and North Staffordshire will be in competition with south Cheshire and the rest of Staffordshire to increase the size of its executive housing market. It seems to us that a target of 10 – 20 new-build executive homes

arc4 RENEW NSRP Executive Housing Market Research Sept 2010 64 of 80
(in the £500k+ price-band) per year across North Staffordshire would be ambitious but realistic. So over a 20-year period there is a case for earmarking land with capacity for 200-400 top-end market executive homes.
10.8.5 In a few especially attractive locations there may be market pressure for such development. But generally the economics for this type of development in North Staffordshire will not favour low density, high specification executive housing. In this context, there appear to be two main routes that may be able to encourage the provision of new executive housing, including locations in Stoke where the strategy seeks to focus much new development. The lower risk approach is to focus upon existing desired locations in close proximity to existing high value properties. This would build on the positive “Quality of Place” factors such as access to lifestyle amenities, leisure facilities, good transport links and open space will influence demand and viability. It would focus upon short-term, relatively easy-win sites to generate interest and build for a nascent market by development of select bespoke executive properties. The bolder approach would be to develop a larger scale executive housing scheme in a premium location that would have sufficient scale to establish an image and character even if not set immediately adjacent to existing executive housing. Some of the successful schemes elsewhere have done this, but scale would be needed – probably at least 20 new homes offer.
10.8.6 We have reviewed these alternatives informed by a broad view of possible site availability, focussing on Stoke. There are potential smaller sites that might be made available in the Meir Park and Trentham areas with the capacity for development at relatively low risk. They can offer adjacency to existing higher value properties and have good accessibility.
10.8.7 There could be other sites elsewhere in the City, some of sufficient size to be considered for the “bolder approach”. These include, for example, locations in the Penkhull area, or the northeast fringes of the City. These all have certain locational disadvantages – potential purchasers would have to travel (from the Motorways/A500/A50, or the Station) through less attractive parts of the City to access these locations and they are not adjacent to a significant number of other high value homes. There would need to be a unique selling point to launch schemes in these locations; superb local facilities or a stunning location, and this would need to be carefully market tested to establish whether a site then had potential for Executive Housing in the longer term.
10.8.8 The most promising initial approach may be to give priority to, and promote development of a medium-sized site (or group of small sites) in a promising location, such as the Trentham area. This would:-
§ Help to create and establish confidence with developers that executive housing can be delivered in the Stoke market;
§ Capture the high-income individuals who have the potential to yield economic benefits for
North Staffordshire, bearing in mind their precise location is unlikely to be material to the wider economic benefits.
10.8.9 The feasibility of a larger site in Stoke or elsewhere will probably depend strongly on whether there are any competing larger-scale Executive Housing developments in North Staffordshire. If the possible large scheme at Keele went ahead, for example, this may

arc4 RENEW NSRP Executive Housing Market Research Sept 2010 65 of 80
capture a substantial share of the potential new-build market. Implications for inner urban regeneration priorities
10.8.10 There may be a concern that focussing this type of development in the already more affluent suburbs would be a detriment to housing and community renewal programmes elsewhere in the City. This would probably be true if significant volumes of new housing were being proposed, and if this were housing types that would potentially divert demand from the inner areas. However, the executive housing proposals are small numbers and the evidence is clear; the target client group is one that would otherwise not live in inner urban Stoke, or possibly even North Staffordshire at all. Next steps
10.8.11 Practical initiatives such as those outlined should be pursued with a wider group of stakeholders include, the allocation of land for the specific purpose of developing executive housing, relaxing density requirements in order to facilitate high value and quality executive housing development.
10.8.12 The sites in the types of preferred locations identified above should be pursued in a joined up approach, collaborating with landowners and developers to establish a clear vision of high quality executive housing products required. A phased programme of development should be pursued identifying the short-term, ‘easy win’ sites for delivery of a select number of bespoke detached, executive dwellings to generate a niche market, in locations contiguous to high value properties.
10.8.13 This requires establishing clear policy framework with a vision of North Staffordshire that will involve an element around attracting aspirational residents to the area. This process can be facilitated through local authority leadership and the creation of clear workable partnerships between the local authorities and private partners.
10.8.14 In terms of the role of the planning process to help delivery, planning applications for development of these sites need to be progressed quickly to encourage development. An open, active, responsive and inclusive dialogue with private developers, investors and businesses needs to occur both during the development of any plans and also throughout the delivery of an executive housing scheme to avoid losing the vision.
10.8.15 The potential for creating future opportunities for Executive housing development in currently non-preferred parts of North Staffordshire (especially within Stoke) should be taken forward by discussions with potential developers to share and encourage ideas with a view to identifying deliverable commercial opportunities.
10.8.16 The recognition that creating attractive, quality places is an indispensable aspect of the longer-term process emphasises the need for a holistic approach. The stress must remain on quality at all times in terms of design of buildings and public realm, in order to alter the perception of the area and take advantage of the assets such as access to open space.

arc4 RENEW NSRP Executive Housing Market Research Sept 2010 66 of 80
Appendix A Table A1: Stoke property distribution by council tax banding and ward
LA Ward name A B C D E F G H Total E-H F-H
Stoke-on-Trent Abbey Green 62.8 13.7 12.4 6.4 3.4 1.1 0.1 0.0 100.0 4.7 1.3
Stoke-on-Trent Bentilee and Townsend 82.5 9.7 5.9 1.3 0.4 0.1 0.0 0.0 100.0 0.5 0.1
Stoke-on-Trent Berryhill and Hanley East 69.4 25.8 4.3 0.4 0.1 0.0 0.0 0.0 100.0 0.1 0.0
Stoke-on-Trent Blurton 66.9 17.2 9.9 2.8 2.2 0.9 0.1 0.0 100.0 3.2 1.0
Stoke-on-Trent Burslem North 74.9 13.6 9.5 1.7 0.3 0.0 0.0 0.0 100.0 0.4 0.1
Stoke-on-Trent Burslem South 81.8 13.7 3.6 0.7 0.1 0.0 0.0 0.0 100.0 0.2 0.1
Stoke-on-Trent Chell and Packmoor 53.2 22.4 20.1 3.3 0.8 0.0 0.0 0.0 100.0 1.0 0.1
Stoke-on-Trent East Valley 47.8 20.7 24.5 4.3 1.8 0.9 0.1 0.0 100.0 2.8 1.0
Stoke-on-Trent Fenton 77.8 18.8 3.0 0.3 0.0 0.0 0.0 0.0 100.0 0.1 0.1
Stoke-on-Trent Hanley West and Shelton 83.4 10.6 4.1 1.5 0.2 0.0 0.1 0.2 100.0 0.5 0.4
Stoke-on-Trent Hartshill and Penkhull 58.9 21.0 15.0 3.0 1.5 0.4 0.1 0.2 100.0 2.1 0.7
Stoke-on-Trent Longton North 40.9 45.7 11.6 1.6 0.1 0.0 0.1 0.0 100.0 0.2 0.1
Stoke-on-Trent Longton South 53.1 21.2 16.4 7.1 1.9 0.3 0.1 0.0 100.0 2.3 0.4
Stoke-on-Trent Meir Park and Sandon 45.5 13.1 21.0 13.3 4.8 2.1 0.2 0.0 100.0 7.1 2.3
Stoke-on-Trent Northwood and Birches Head 65.6 16.9 13.3 2.7 1.5 0.0 0.0 0.0 100.0 1.5 0.0
Stoke-on-Trent Norton and Bradeley 52.7 26.5 15.7 3.9 0.9 0.1 0.1 0.0 100.0 1.2 0.2
Stoke-on-Trent Stoke and Trent Vale 77.5 13.6 6.5 1.5 0.6 0.2 0.0 0.0 100.0 0.9 0.3
Stoke-on-Trent Trentham and Hanford 13.0 21.7 34.6 18.0 9.6 2.2 0.7 0.2 100.0 12.6 3.1
Stoke-on-Trent Tunstall 73.0 17.2 4.6 5.0 0.1 0.0 0.0 0.0 100.0 0.2 0.1
Stoke-on-Trent Weston and Meir North 52.6 26.8 18.1 1.8 0.5 0.0 0.1 0.0 100.0 0.6 0.1
Source: RENEW
Table A2: Newcastle-under-Lyme property distribution by council tax banding and ward
LA Ward name A B C D E F G H Total E-H F-H
Newcastle-under-Lyme Audley and Bignall End 47.9 13.0 25.7 7.5 4.3 1.3 0.3 0.0 100.0 5.9 1.6
Newcastle-under-Lyme Bradwell 42.4 29.7 22.4 4.8 0.4 0.2 0.0 0.1 100.0 0.7 0.3
Newcastle-under-Lyme Butt Lane 66.6 11.9 18.5 1.4 0.9 0.5 0.1 0.0 100.0 1.5 0.6
Newcastle-under-Lyme Chesterton 55.1 12.1 25.5 6.8 0.4 0.0 0.1 0.0 100.0 0.5 0.1
Newcastle-under-Lyme Clayton 22.1 30.1 36.3 9.2 1.8 0.4 0.1 0.0 100.0 2.3 0.5
Newcastle-under-Lyme Cross Heath 72.8 18.5 7.8 0.7 0.1 0.0 0.0 0.0 100.0 0.2 0.0
Newcastle-under-Lyme Halmerend 38.0 14.3 14.2 9.3 12.1 8.8 3.0 0.4 100.0 24.2 12.1
Newcastle-under-Lyme Holditch 85.0 11.3 3.3 0.1 0.1 0.1 0.0 0.1 100.0 0.2 0.1
Newcastle-under-Lyme Keele 17.3 18.6 18.2 8.3 18.2 12.3 5.1 1.9 100.0 37.6 19.4
Newcastle-under-Lyme Kidsgrove 42.2 30.4 15.5 10.7 1.1 0.1 0.0 0.0 100.0 1.3 0.1
Newcastle-under-Lyme Knutton and Silverdale 70.1 24.7 4.8 0.2 0.1 0.1 0.1 0.0 100.0 0.2 0.1
Newcastle-under-Lyme Loggerheads and Whitmore 5.8 8.5 12.6 13.1 24.6 17.8 17.2 0.4 100.0 60.0 35.4
Newcastle-under-Lyme Madeley 31.4 14.6 24.2 11.0 9.3 7.5 1.7 0.2 100.0 18.7 9.3
Newcastle-under-Lyme May Bank 28.9 26.2 34.6 5.1 2.2 1.7 1.3 0.0 100.0 5.2 3.0
Newcastle-under-Lyme Newchapel 22.3 35.9 28.4 9.2 3.1 1.1 0.1 0.0 100.0 4.3 1.2
Newcastle-under-Lyme Porthill 53.6 14.4 24.1 6.9 0.7 0.2 0.1 0.1 100.0 1.0 0.3
Newcastle-under-Lyme Ravenscliffe 28.1 31.4 31.3 5.8 3.0 0.3 0.1 0.0 100.0 3.4 0.4
Newcastle-under-Lyme Seabridge 22.6 23.0 20.8 19.6 11.2 2.5 0.2 0.0 100.0 13.9 2.7
Newcastle-under-Lyme Silverdale and Parksite 71.1 8.3 18.8 1.5 0.2 0.0 0.1 0.1 100.0 0.4 0.2
Newcastle-under-Lyme Talke 40.4 25.4 31.3 2.1 0.5 0.2 0.1 0.0 100.0 0.8 0.3

arc4 RENEW NSRP Executive Housing Market Research Sept 2010 67 of 80
Newcastle-under-Lyme Thistleberry 43.6 7.2 26.5 9.7 8.1 4.1 0.7 0.0 100.0 13.0 4.9
Newcastle-under-Lyme Town 75.1 7.0 10.7 4.9 1.7 0.4 0.2 0.1 100.0 2.3 0.7
Newcastle-under-Lyme Westlands 18.6 6.3 6.4 29.1 14.2 18.0 7.3 0.0 100.0 39.6 25.4
Newcastle-under-Lyme Wolstanton 57.8 18.6 17.5 4.5 1.2 0.4 0.0 0.0 100.0 1.6 0.4
Source: RENEW
Table A3: Staffordshire Moorlands property distribution by council tax banding and ward
LA Ward name A B C D E F G H Total E-H F-H
Staffordshire Moorlands Alton 8.2 17.2 15.4 19.6 24.1 10.4 4.8 0.3 100.0 39.6 15.6
Staffordshire Moorlands Bagnall and Stanley 2.0 14.5 14.9 18.1 22.1 19.4 9.1 0.0 100.0 50.6 28.5
Staffordshire Moorlands Biddulph East 64.7 18.6 6.0 7.5 2.9 0.2 0.0 0.1 100.0 3.2 0.2
Staffordshire Moorlands Biddulph Moor 6.2 20.0 40.8 18.2 10.4 3.8 0.5 0.1 100.0 14.8 4.5
Staffordshire Moorlands Biddulph North 5.5 22.1 36.4 14.8 14.0 4.5 2.6 0.0 100.0 21.1 7.1
Staffordshire Moorlands Biddulph South 8.7 6.8 54.9 19.2 6.7 2.9 0.8 0.1 100.0 10.5 3.9
Staffordshire Moorlands Biddulph West 26.8 34.7 24.6 7.7 4.7 1.2 0.2 0.0 100.0 6.1 1.4
Staffordshire Moorlands Brown Edge and Endon 10.9 12.0 27.2 30.8 12.7 4.4 2.0 0.0 100.0 19.1 6.4
Staffordshire Moorlands Caverswall 9.5 15.6 26.6 21.8 14.9 7.2 4.2 0.1 100.0 26.5 11.6
Staffordshire Moorlands Cellarhead 5.7 27.6 43.7 17.7 4.4 0.6 0.2 0.1 100.0 5.3 0.9
Staffordshire Moorlands Cheadle North East 39.0 32.1 20.0 4.9 2.8 0.5 0.5 0.1 100.0 4.0 1.2
Staffordshire Moorlands Cheadle South East 26.8 36.0 18.0 11.6 4.9 1.7 0.9 0.1 100.0 7.6 2.7
Staffordshire Moorlands Cheadle West 22.7 18.3 24.5 18.8 13.3 1.7 0.6 0.1 100.0 15.7 2.4
Staffordshire Moorlands Checkley 13.1 25.6 23.7 19.5 11.3 5.3 1.5 0.0 100.0 18.1 6.7
Staffordshire Moorlands Cheddleton 7.2 32.7 22.6 15.8 13.2 6.6 1.7 0.2 100.0 21.7 8.5
Staffordshire Moorlands Churnet 18.0 32.3 20.1 14.8 10.4 3.4 1.1 0.1 100.0 14.9 4.5
Staffordshire Moorlands Dane 12.5 6.5 7.1 14.9 26.2 22.7 9.2 0.9 100.0 59.0 32.8
Staffordshire Moorlands Forsbrook 15.0 28.4 37.6 10.3 4.5 3.3 0.9 0.0 100.0 8.7 4.2
Staffordshire Moorlands Hamps Valley 6.3 15.8 17.7 24.6 22.2 8.9 4.1 0.3 100.0 35.6 13.3
Staffordshire Moorlands Horton 4.6 4.9 7.5 14.6 21.5 27.0 19.5 0.4 100.0 68.4 46.9
Staffordshire Moorlands Ipstones 10.5 17.2 20.0 22.7 19.1 7.8 2.6 0.1 100.0 29.6 10.5
Staffordshire Moorlands Leek East 40.3 19.6 11.5 13.2 8.3 5.5 1.5 0.1 100.0 15.4 7.1
Staffordshire Moorlands Leek North 39.1 47.5 7.4 2.5 2.1 1.0 0.4 0.1 100.0 3.5 1.5
Staffordshire Moorlands Leek South 41.5 26.5 18.4 6.7 3.9 2.3 0.7 0.0 100.0 6.9 3.1
Staffordshire Moorlands Leek West 22.6 16.0 42.9 9.6 6.8 1.9 0.2 0.0 100.0 8.9 2.1
Staffordshire Moorlands Manifold 7.2 8.8 18.8 24.3 26.7 10.1 4.0 0.0 100.0 40.8 14.1
Staffordshire Moorlands Werrington 4.1 12.6 59.8 16.1 6.1 1.0 0.3 0.1 100.0 7.4 1.3
Source: RENEW
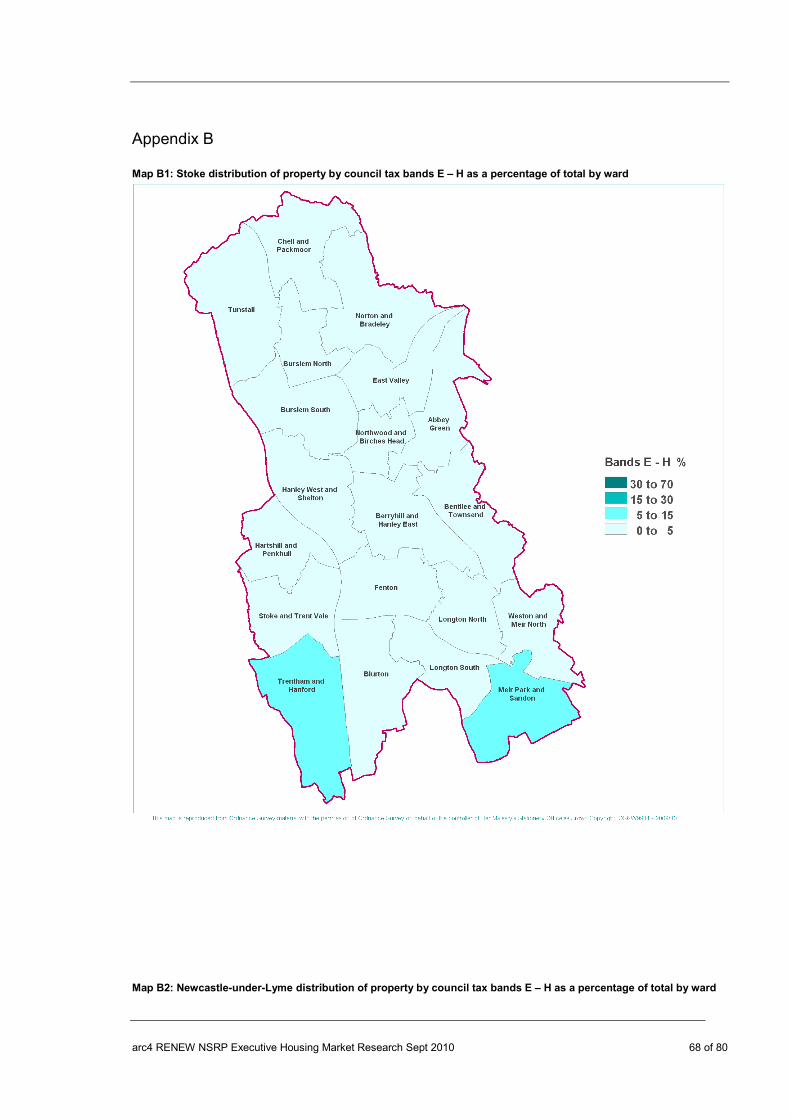
arc4 RENEW NSRP Executive Housing Market Research Sept 2010 68 of 80
Appendix B Map B1: Stoke distribution of property by council tax bands E – H as a percentage of total by ward
Map B2: Newcastle-under-Lyme distribution of property by council tax bands E – H as a percentage of total by ward

arc4 RENEW NSRP Executive Housing Market Research Sept 2010 69 of 80
Map B3: Staffordshire Moorlands distribution of property by council tax bands E – H as a percentage of total by ward

arc4 RENEW NSRP Executive Housing Market Research Sept 2010 70 of 80
Appendix C

arc4 RENEW NSRP Executive Housing Market Research Sept 2010 71 of 80
Table C1: Percentage of total population classified as Wealthy Achievers – Stoke
Postcode Population Wealthy Achievers
(%) of total pop.
ST 1 1 348 0.0%
ST 1 2 3,658 0.0%
ST 1 3 4,870 0.0%
ST 1 4 4,007 0.0%
ST 1 5 3,075 5.1%
ST 1 6 13,443 6.9%
ST 2 0 9,341 0.0%
ST 2 7 7,943 18.1%
ST 2 8 7,389 4.7%
ST 2 9 8,498 9.2%
ST 3 1 5,673 0.0%
ST 3 2 7,579 2.4%
ST 3 3 7,012 3.9%
ST 3 4 9,125 14.4%
ST 3 5 13,629 2.9%
ST 3 6 9,179 1.1%
ST 3 7 13,016 51.4%
ST 4 1 1,248 0.0%
ST 4 2 7,436 0.0%
ST 4 3 7,415 0.0%
ST 4 4 6,449 0.1%
ST 4 5 7,321 4.8%
ST 4 6 7,364 0.5%
ST 4 7 6,230 0.3%
ST 4 8 11,844 56.1%
ST 6 1 7,560 0.0%
ST 6 2 2,946 0.0%
ST 6 3 3,785 0.0%
ST 6 4 3,841 4.9%
ST 6 5 9,956 7.3%
ST 6 6 12,895 12.2%
ST 6 7 8,632 11.1%
ST 6 8 11,094 19.4%
ST 7 1 11,414 8.3%
ST 7 2 12,798 49.4%
ST 7 3 7,493 51.8%
ST 7 4 15,204 27.1%
ST 7 8 8,007 22.3%
ST 8 6 10,781 23.8%
ST 8 7 9,021 65.7%
Total average 12.4%
Source: CACI, ACORN
Table C2: Percentage of total population classified as Wealthy Achievers – Newcastle-under-Lyme
Postcode Population Wealthy Achievers
(%) of total pop.

arc4 RENEW NSRP Executive Housing Market Research Sept 2010 72 of 80
ST 5 0 9,050 13.4%
ST 5 1 3,501 0.0%
ST 5 2 8,272 23.6%
ST 5 3 9,640 43.6%
ST 5 4 6,569 61.9%
ST 5 5 6,139 36.7%
ST 5 6 8,635 9.4%
ST 5 7 11,650 21.2%
ST 5 8 11,244 13.0%
ST 5 9 7,663 0.1%
Total average 22.3%
Source: CACI, ACORN
Table C3: Percentage of total population classified as Wealthy Achievers – Staffordshire Moorlands
Postcode Population Wealthy Achievers
(%) of total pop.
ST 9 0 6,322 58.2%
ST 9 9 5,589 84.2%
ST11 9 9,593 43.1%
ST13 5 6,213 24.0%
ST13 6 5,856 5.7%
ST13 7 6,962 64.0%
ST13 8 8,312 34.6%
ST14 5 4,886 63.8%
ST14 7 8,233 15.6%
ST14 8 6,523 63.4%
ST15 0 8,496 52.7%
ST15 8 11,863 51.9%
SK11 0 4,597 72.6%
SK11 6 3,629 0.0%
SK11 7 10,973 18.2%
SK11 8 12,842 28.8%
SK11 9 4,270 91.1%
SK17 0 3,117 72.9%
SK17 6 7,981 16.0%
SK17 7 7,537 2.9%
SK17 8 5,519 29.2%
SK17 9 8,258 38.2%
CW12 1 4,367 17.0%
CW12 2 4,619 54.4%
CW12 3 10,242 58.6%
CW12 4 10,280 49.1%
DE 6 1 10,405 48.2%
DE 6 2 5,469 79.8%
DE 6 3 4,100 96.0%
DE 6 4 1,163 83.7%
DE 6 5 4,520 79.0%
Total average 48.3%
Source: CACI, ACORN

arc4 RENEW NSRP Executive Housing Market Research Sept 2010 73 of 80
Appendix D Map D1: Stoke - Distribution of high-end market property sales and proportion of ‘Wealthy Achievers’ of total
households

arc4 RENEW NSRP Executive Housing Market Research Sept 2010 74 of 80
Map D2: Newcastle-under-Lyme - Distribution of high-end market property sales and proportion of ‘Wealthy
Achievers’ of total households

arc4 RENEW NSRP Executive Housing Market Research Sept 2010 75 of 80
Map D3: Staffordshire Moorlands - Distribution of high-end market property sales and proportion of ‘Wealthy
Achievers’ of total households

arc4 RENEW NSRP Executive Housing Market Research Sept 2010 76 of 80
Appendix E

arc4 RENEW NSRP Executive Housing Market Research Sept 2010 77 of 80
Fig E1: Projected population change by age group in Crewe and Nantwich between 2009 – 2031
Source: ONS 2006 mid-year estimates Fig E2: Projected population change by age group in Congleton between 2009 – 2031
0.0% 20.0% 40.0% 60.0% 80.0% 100.0% 120.0% 140.0% 160.0%
0-4
5-9
10-14
15-19
20-24
25-29
30-34
35-39
40-44
45-49
50-54
55-59
60-64
65-69
70-74
75-79
80-84
85+
ALL AGES

arc4 RENEW NSRP Executive Housing Market Research Sept 2010 78 of 80
Source: ONS 2006 mid-year estimates Fig E3: Projected population change by age group in Stafford between 2009 – 2031
-20% 0% 20% 40% 60% 80% 100% 120% 140% 160% 180%
0-4
5-9
10-14
15-19
20-24
25-29
30-34
35-39
40-44
45-49
50-54
55-59
60-64
65-69
70-74
75-79
80-84
85+
ALL AGES
Quinary age group
Percentage change 2009 - 2031

arc4 RENEW NSRP Executive Housing Market Research Sept 2010 79 of 80
Source: ONS 2006 mid-year estimates Appendix F
-20% 0% 20% 40% 60% 80% 100% 120% 140% 160% 180%
0-4
5-9
10-14
15-19
20-24
25-29
30-34
35-39
40-44
45-49
50-54
55-59
60-64
65-69
70-74
75-79
80-84
85+
ALL AGES
Quinary age group
Percentage change 2009 - 2031

arc4 RENEW NSRP Executive Housing Market Research Sept 2010 80 of 80
Stakeholder participants Estate agents Knight Frank – Birmingham and Leeds (covering executive and country market across the North and North Midlands Savills Jackson Stopps and Staff Fisher German Butters John Bee Bury and Hilton Bridgefords Whittaker and Biggs Daniel Hulme Developers First Post Homes Charles Church Seddons Hillcrest Homes Jones Homes Bardsley Homes Countryside Homes