removal of topographical effect from remote sensing … · removal of topographical effect from...
TRANSCRIPT

238 IAPRS, Vol. 32, Part 4 "GIS-Between Visions and Applications", Stuttgart, 1998
REMOVAL OF TOPOGRAPHICAL EFFECT FROM REMOTE SENSING DATA FOR THERMAL INERTIAMODELLING
Beata HejmanowskaUniversity of Mining and Metallurgy al. Mickiewicza 30, 30059 Cracow, Poland
ABSTRACT
Topographical effect was considered in the context of bare soil moisture assessment. Soil moisture wasevaluated using thermal inertia modelling. As an input data in thermal inertia model, the images in visible andthermal infrared range are required. Two own programs were worked out modi - for thermal inertia modelling and topo– for topographical effect removal. Standard GIS software can have an option for topographical effect removal but onlyusing two most popular (but not always correct) methods: Lambert’s and Minnaert’s.
Theoretical test was performed to qualify significance of the topographical effect in thermal inertia modelling. Forsoil moisture evaluation on the base of the thermal inertia value, the correction of thermal image seems to be moreimportant than correction of the image in visible range. To study the problem the remote sensing experiment wasperformed 27.10.1996 for test area (4x4 km) placed near Cracow in Poland. The satellite (Landsat) and airborne imageswere collected simultaneously with in situ measurements of soil moisture and temperature. Experiment was performednear meteorological station where standard meteorological parameters are measured. This kind of data was used formatching thermal inertia model. Conducted investigations confirm that topographical effects can significant influenceremote sensing data. Proposed correction bases on assumption that the soils of the same moisture should “look” thesame independent of slope and exposition. Topographical effect was easy to observe on the images in visible andinfrared range on satellite and on airborne level. Different correction methods were tested for removal topographicaleffect from remote sensing data. After correction, correlation coefficient between DN and local illumination angle of thesurface decreases from approximately 0.50 to 0.04. Initial results of the investigation connected to the influence oftopographical effect on remote sensing data used in thermal inertia modelling were presented on the ISPRS Congress inVienna in 1996. In the paper results of the following researches are presented.
1 INTRODUCTION
Remotely method for soil moisture assessment isnot elaborate yet. On the base on the literature:[Choudhury B.J., 1979; Hejmanowska B., Mularz S.,1996; Idso S.B. i in., 1975; Kimball B.A. i in., 1976;, 1985;Reginato R.J., i in., 1979] can be stated, that thermalinfrared (TIR) is now the most suitable electromagneticrange for soil moisture distinguish. Microwave techniquesactive as well as passive is hopeful for soil moisturemonitoring. These techniques are neverthelesscomplicated and need still many researches. Thereforeusing of visible (VIS) and infrared range (IR) seems to bemore realistic for remotely assessment of soil moisture. Itshould be mentioned that images in visible and infraredpart of spectrum are easy to access in commercialsystems, for example Landsat. Some limitation inapplications of Landsat images in Poland is its spatialresolution. 30 m in visible and 120 m in thermal range is alittle bit too small for Polish agriculture fields. Improvementof spatial resolution to 15 m in visible and 60 m in thermalrange can considerably change this situation. Access tohigh-resolution satellite images with approximately a fewmetes will probably cause in Poland seriously increase ofinterest of satellite remote sensing data. High-resolutionimages could be competed in compare to airborneimages. Especially when we take to account also itsrevisits cycle, average a few days. Therefore, researchesof possibilities of applications of satellite remote sensingimages in VIS and IR spectral range are important forPoland as never till now.
Electromagnetic level measured remotelydepends on many factors: spectral characteristic of theobject, interaction of electromagnetic radiation in theatmosphere, sensor characteristic but also on geometry:direction of sun illumination and sensor viewing direction.Image of the flat horizontal terrain with homogenouscovering (forest, or soil, or grass) is different from the
image of the same covering but in hilly area. It is causedby variation of the illumination direction, it means of zenithsun illumination angle. Sun facing slope (southerly) seemsto be brighter (warmer) than northerly facing slope. Thiseffect is called “ topographical effect”. Removal of this “disturbing phenomena” is necessary before for exampledigital image classification or mathematical modelling ofsome physical processes (properties) on the earth. Inmany cases, difference in reflectance coefficient ortemperature measured remotely can be caused only bytopographical effect. For the objects of the same physicalcharacteristic for example the same water content, wecould measure different reflectance or temperature.
Studies of topographical effect removal from remotesensing data in VIS and near infrared (NIR)electromagnetic range are described in the literature.Some theoretical correction methods have been proposedand practical tested. I didn’t find any proposal for thermalimage correction. Removal of topographical effect basesgenerally on the assumption that after correction imageshould be similar to the image of flat horizontal area. Sosoutherly facing slopes should be darker and northerlyfacing slopes brighter than before correction.
During conducted investigations before followingdigital processing, remote sensing data were initialcorrected to reduce topographical effect. Then theimproved images were transformed to thermal inertiaimage, next correlated with soil water content.
2 METHODOLOGY
Researches contain studies of two problems:� possibilities of remote sensing assessment of soil
moisture on agriculture fields in Poland, and� necessity of initial correction of remote sensed data
to reduce topographical effect.Soil moisture was estimated basing on thermal inertiaparameter defined as:
D. Fritsch, M. Englich & M. Sester, eds, 'IAPRS', Vol. 32/4, ISPRS Commission IV Symposium on GIS - Between Visions and Applications,Stuttgart, Germany.

Hejmanowska 239
� ��� � (1)
where:k - thermal conductivity,c – heat capacity,� - soil density.Thermal inertia P was not evaluated basing on in situmeasurements of k, c and � but was estimated from theremote sensing data:
P =f (As, �T, B) (2)where:A s– short-wave albedo,�T – maximum diurnal temperature differences,B – additional parameters consist of geographical andmeteorological dataModel proposed by Pratt et al. (1980) was used forthermal inertia modeling. In the model the following dataare needed:� Remote sensed images in visible and thermal
infrared range,� Geographical co-ordinates of investigated terrain,� Imaging date and time,� Meteorological data.
Obviously proper input data: As, �T are significant forcorrectly evaluation of thermal inertia (P). Albedo andmaximum diurnal temperature difference should be similarfor the same soil moisture of the same soil type. In thismoment a problem of initial pre-processing of remotesensing data for topographical effect removal couldappear.
Different techniques for reduce topographical effecthave been vastly described in the literature. Theoreticalmodels, laboratory measurements of BRDF*) and digitalcorrections of real remote sensing data (mostly of satellitedata) are in the literature presented [Cierniewski, J.,Verbrugghe, M., 1997; Civco, D.L., 1989, Emsile, A.G.,Aronson, J.R., 1972, Franklin, J.et.al 1986, Hapke, B.,1963; Hugli, H., Frei, W., 1983, Kahle A.B., 1977,Laungcai C., Zingeheng L., 1992, Leprieur, C.E., Durand,J.M., 1988, Smith, J.A. et.al. 1980]. It should bementioned that correction methods were concerned to VISand NIR, and were performed in the mountains, coveredby forest, mainly coniferous. During conducted tests,remote sensing images recorded in VIS range werecorrected basing on methods known from the literature.Because of lack any proposal for topographical correctionin thermal infrared (TIR), the methods from VIS and nearIR were implemented to TIR .
Methods for topographical effect removal from remotesensing images in VIS and NIR could be divided on twogroups:� Methods basing on BRDF of the objects,� Empirical methods.1Methods basing on BRDF require a’priori defined BRDFof the recorded objects. Using empirical methods BRDFdon’t have to be known.
The following method were practical tested:� Diffusive method basing on Lambert’s law, [Smith, J
et.al. 1980, Hugli, H., Frei, W., 1983],� Backscattering method, [Hapke, B.W., 1963, Hugli,
H., Frei, W., 1983],� Minnaert’s method, [Smith, J.A., et.al., 1980]� Empirical method basing on slope exposure.
*) BRDF – Bidirectional Reflectance Distribution Function describespatial distribution of the radiation coming out from the object.
Diffusive methods assume that the recordedelectromagnetic level is independent on sensor directionbut is influenced by solar zenith angle. The smaller iszenith illumination angle the greater is recordedelectromagnetic level (objects are brighter or warmer) butit’s all the same for all sensor position. Correction in thebackscattering method bases on assumption that themaximum is observed when sensor has sun behind.Minnaert’s method belongs to the empirical methods andis the most popular of them. Empirical method bases ofcorrelation’s analysis between DN and illuminationparameters, mainly cosines of zenith illumination angle.
Topographical effect was considered for improvingremote sensing data before thermal inertia modelling forsoil moisture assessment. At the beginning, a theoreticaltest was performed to check significance of reducingtopographical effect in VIS electromagnetic range incompare to TIR range. Topographical effect was alsoobserved during terrestrial measurements using thermalcamera AGEMA 780 [Hejmanowska B., Mularz S., 1996].Maximum difference between temperature of the samesoil but measured by camera with sun behind in compareto results from camera sun forward was 200C.
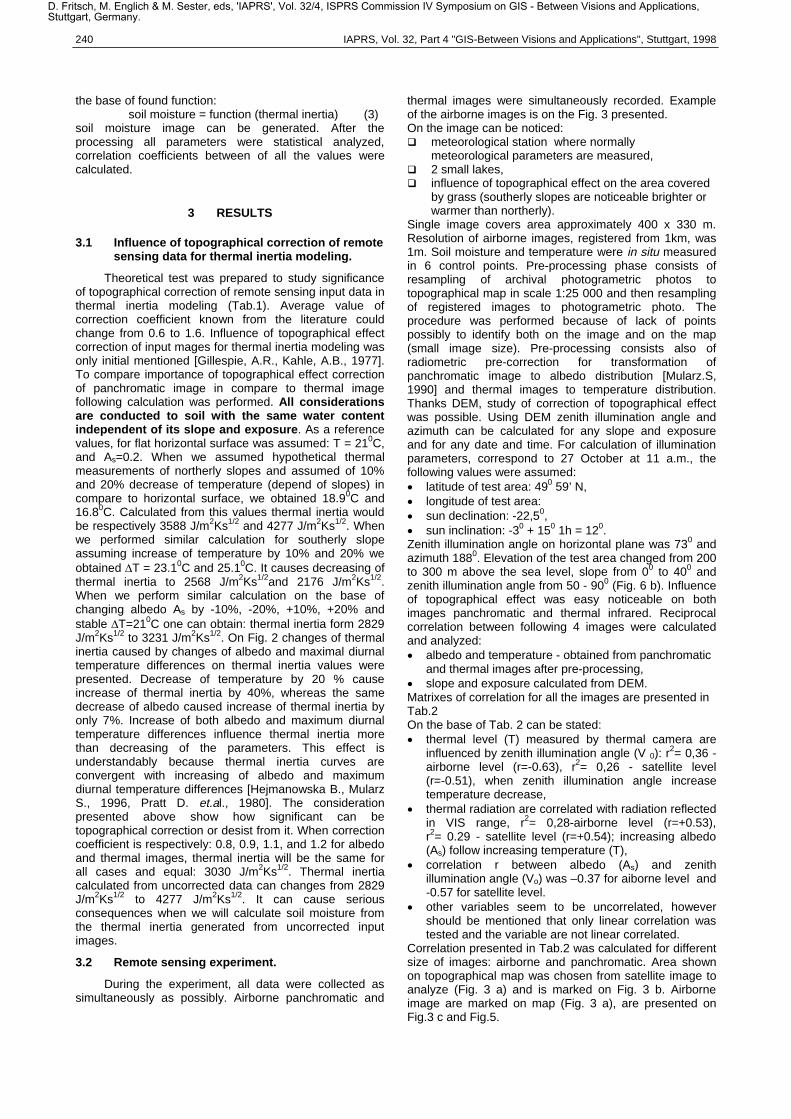
Three level remote sensing experiment was performedto check possibilities of application of thermal inertia (TI)modeling for soil moisture detection in Polish conditionsand to check necessity of topographical effect correction.Test area was located in southern part of Poland 50 kmeast from Cracow (Fig.3). Terrain can be characterized ashilly with elevation from 200 to 300 m above sea level andslopes from 0 to 400. The aim of our research was toestimate soil moisture distribution on the agriculture testfields on the base on remote sensing data. The soils oftest area were similar – loess and loess-like. During theexperiment, performed 27.10.1996 following data werecollected:� ¼ of Landsat scene,� airborne panchromatic images (CCD camera)
combined with thermal camera (AGEMA 880),� in situ measurements of soil temperature and
moisture.Collected during the experiment data were processed forgenerate soil moisture map (Fig. 1). Panchromatic andTIR images were pre-processed in GIS system (IDRISI)for radiometrical and geometrical correction. In situmeasurements of soil temperature were used forcalibration and testing TIR images. Geometrical correctionwas performed using resampling method. After theprocedure, images are in proper cartographic co-ordinates. The following step includes topographical effectcorrection that needs Digital Elevation Model (DEM). DEMfor test area were accessible from the project of ThePolish Committee of Scientific Research (P0389/PZ/93/04). The sun co-ordinates can be calculatedfor date and time of imaging and for latitude and longitudeof the test area. Sun position: zenith angle and azimuthcalculated for all pixels, for any slope and exposure wasused for topographical effect correction. On the base ofzenith illumination angle and azimuth, correctioncoefficient image was constructed (topo). Then image wasmultiply by correction image. In the next step, thermalinertia was generated using program modi. For evaluationof parameter B (2), some other data like meteorologicaldata are wanted. Meteorological parameters wereobtained from meteorological station. Thermal inertiaimage was next analysed to find correlation between soilmoisture and thermal inertia value in control points. On
D. Fritsch, M. Englich & M. Sester, eds, 'IAPRS', Vol. 32/4, ISPRS Commission IV Symposium on GIS - Between Visions and Applications,Stuttgart, Germany.
240 IAPRS, Vol. 32, Part 4 "GIS-Between Visions and Applications", Stuttgart, 1998
the base of found function:soil moisture = function (thermal inertia) (3)
soil moisture image can be generated. After theprocessing all parameters were statistical analyzed,correlation coefficients between of all the values werecalculated.
3 RESULTS
3.1 Influence of topographical correction of remotesensing data for thermal inertia modeling.
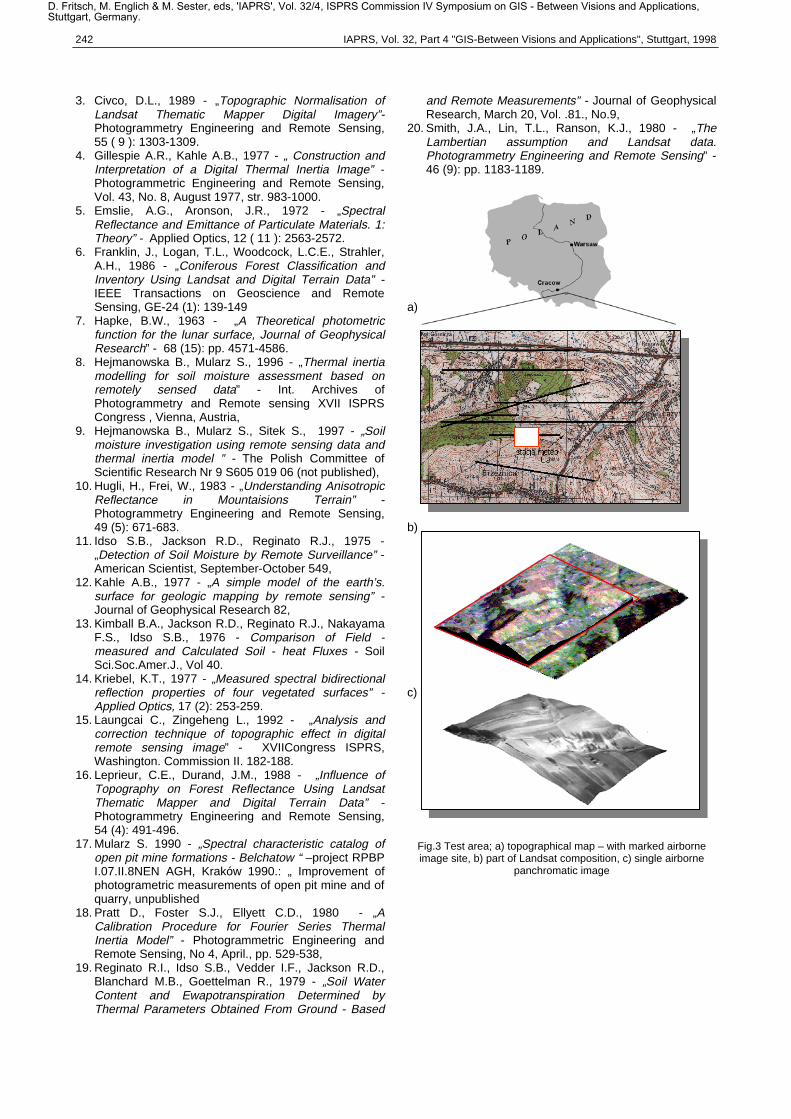
Theoretical test was prepared to study significanceof topographical correction of remote sensing input data inthermal inertia modeling (Tab.1). Average value ofcorrection coefficient known from the literature couldchange from 0.6 to 1.6. Influence of topographical effectcorrection of input mages for thermal inertia modeling wasonly initial mentioned [Gillespie, A.R., Kahle, A.B., 1977].To compare importance of topographical effect correctionof panchromatic image in compare to thermal imagefollowing calculation was performed. All considerationsare conducted to soil with the same water contentindependent of its slope and exposure. As a referencevalues, for flat horizontal surface was assumed: T = 210C,and As=0.2. When we assumed hypothetical thermalmeasurements of northerly slopes and assumed of 10%and 20% decrease of temperature (depend of slopes) incompare to horizontal surface, we obtained 18.90C and16.80C. Calculated from this values thermal inertia wouldbe respectively 3588 J/m2Ks1/2 and 4277 J/m2Ks1/2. Whenwe performed similar calculation for southerly slopeassuming increase of temperature by 10% and 20% weobtained �T = 23.10C and 25.10C. It causes decreasing ofthermal inertia to 2568 J/m2Ks1/2and 2176 J/m2Ks1/2.When we perform similar calculation on the base ofchanging albedo As by -10%, -20%, +10%, +20% andstable �T=210C one can obtain: thermal inertia form 2829J/m2Ks1/2 to 3231 J/m2Ks1/2. On Fig. 2 changes of thermalinertia caused by changes of albedo and maximal diurnaltemperature differences on thermal inertia values werepresented. Decrease of temperature by 20 % causeincrease of thermal inertia by 40%, whereas the samedecrease of albedo caused increase of thermal inertia byonly 7%. Increase of both albedo and maximum diurnaltemperature differences influence thermal inertia morethan decreasing of the parameters. This effect isunderstandably because thermal inertia curves areconvergent with increasing of albedo and maximumdiurnal temperature differences [Hejmanowska B., MularzS., 1996, Pratt D. et.al., 1980]. The considerationpresented above show how significant can betopographical correction or desist from it. When correctioncoefficient is respectively: 0.8, 0.9, 1.1, and 1.2 for albedoand thermal images, thermal inertia will be the same forall cases and equal: 3030 J/m2Ks1/2. Thermal inertiacalculated from uncorrected data can changes from 2829J/m2Ks1/2 to 4277 J/m2Ks1/2. It can cause seriousconsequences when we will calculate soil moisture fromthe thermal inertia generated from uncorrected inputimages.
3.2 Remote sensing experiment.
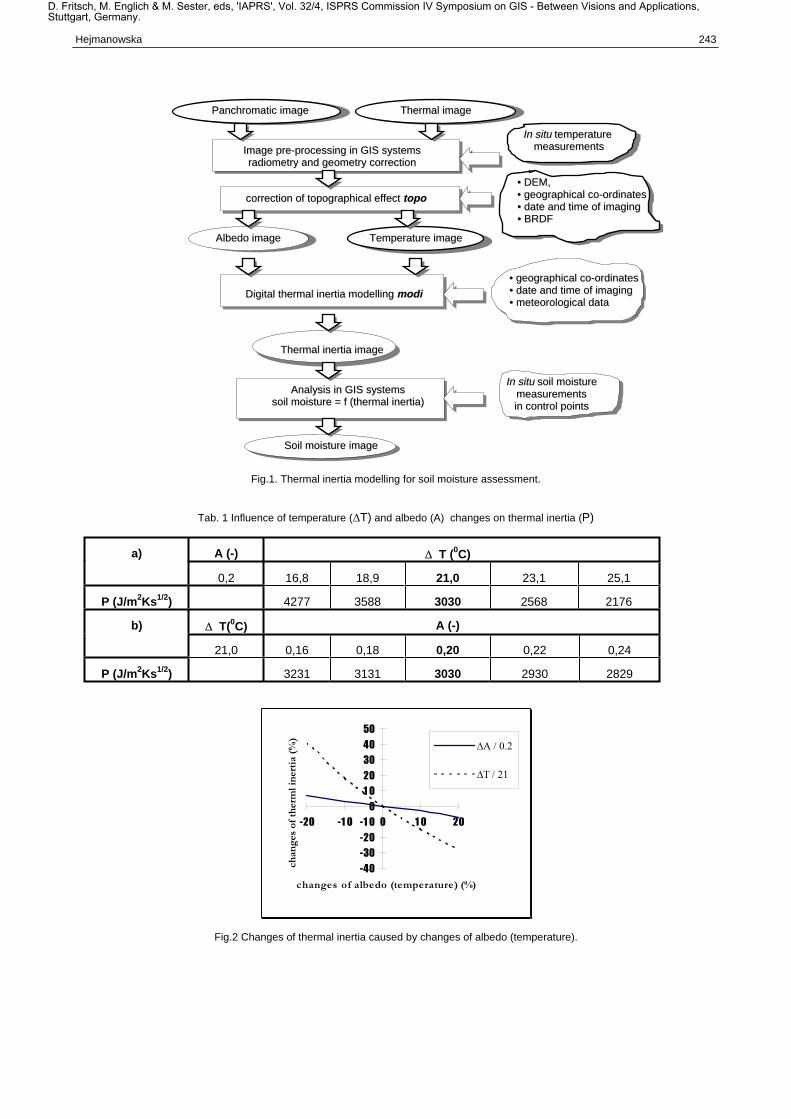
During the experiment, all data were collected assimultaneously as possibly. Airborne panchromatic and
thermal images were simultaneously recorded. Exampleof the airborne images is on the Fig. 3 presented.On the image can be noticed:� meteorological station where normally
meteorological parameters are measured,� 2 small lakes,� influence of topographical effect on the area covered
by grass (southerly slopes are noticeable brighter orwarmer than northerly).
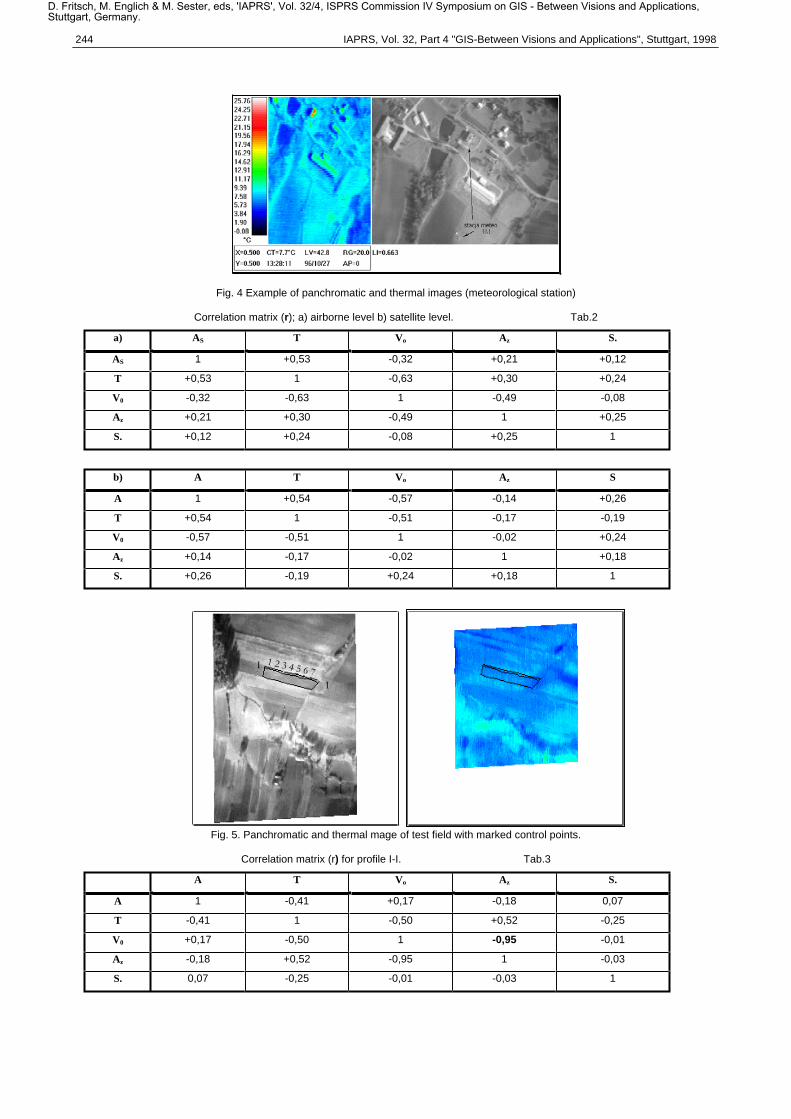
Single image covers area approximately 400 x 330 m.Resolution of airborne images, registered from 1km, was1m. Soil moisture and temperature were in situ measuredin 6 control points. Pre-processing phase consists ofresampling of archival photogrametric photos totopographical map in scale 1:25 000 and then resamplingof registered images to photogrametric photo. Theprocedure was performed because of lack of pointspossibly to identify both on the image and on the map(small image size). Pre-processing consists also ofradiometric pre-correction for transformation ofpanchromatic image to albedo distribution [Mularz.S,1990] and thermal images to temperature distribution.Thanks DEM, study of correction of topographical effectwas possible. Using DEM zenith illumination angle andazimuth can be calculated for any slope and exposureand for any date and time. For calculation of illuminationparameters, correspond to 27 October at 11 a.m., thefollowing values were assumed:� latitude of test area: 490 59’ N,� longitude of test area:� sun declination: -22,50,� sun inclination: -30 + 150 1h = 120.Zenith illumination angle on horizontal plane was 730 andazimuth 1880. Elevation of the test area changed from 200to 300 m above the sea level, slope from 00 to 400 andzenith illumination angle from 50 - 900 (Fig. 6 b). Influenceof topographical effect was easy noticeable on bothimages panchromatic and thermal infrared. Reciprocalcorrelation between following 4 images were calculatedand analyzed:� albedo and temperature - obtained from panchromatic
and thermal images after pre-processing,� slope and exposure calculated from DEM.Matrixes of correlation for all the images are presented inTab.2On the base of Tab. 2 can be stated:� thermal level (T) measured by thermal camera are
influenced by zenith illumination angle (V 0): r2= 0,36 -
airborne level (r=-0.63), r2= 0,26 - satellite level(r=-0.51), when zenith illumination angle increasetemperature decrease,
� thermal radiation are correlated with radiation reflectedin VIS range, r2= 0,28-airborne level (r=+0.53),r2= 0.29 - satellite level (r=+0.54); increasing albedo(As) follow increasing temperature (T),
� correlation r between albedo (As) and zenithillumination angle (Vo) was –0.37 for aiborne level and-0.57 for satellite level.
� other variables seem to be uncorrelated, howevershould be mentioned that only linear correlation wastested and the variable are not linear correlated.
Correlation presented in Tab.2 was calculated for differentsize of images: airborne and panchromatic. Area shownon topographical map was chosen from satellite image toanalyze (Fig. 3 a) and is marked on Fig. 3 b. Airborneimage are marked on map (Fig. 3 a), are presented onFig.3 c and Fig.5.
D. Fritsch, M. Englich & M. Sester, eds, 'IAPRS', Vol. 32/4, ISPRS Commission IV Symposium on GIS - Between Visions and Applications,Stuttgart, Germany.

Hejmanowska 241
For particular analysis test field B was chosen(Fig.5). Slope of field B changes from 5 to 200. Field B hasmainly eastern orientation, azimuth changes from 54 -1350. In profile I-I in seven points, soil moisture and in situtemperature were measured. For the profile, I-I correlationbetween albedo, temperature, zenith illumination angle,surface exposure and slope were calculated (Tab.3).Because of noticeable influence of topographical effect onremote sensing data in VIS and also in TIR some testswere undertaken to reduce this effect. The all mentionedabove methods were tested. Images after Lambert’smethod were over corrected (northerly slopes were toobright and too warm). The better results gave Minnaert’sand backscattering method. On the images corrected afterMinnaert’s and backscattering model could be noticed thatcorrection factor is too significant influenced by slope ofthe surface in compare to its exposure. Therefore, I triedto consider mainly surface exposure. Correctioncoefficient was evaluated empirical after compare ofalbedo and thermal level for different soil exposures andthe same water content. After correction, I obtainedimages on which topographical effect was minimal Fig 6.e. Correlation coefficients between images before andafter proposed correction decrease significant:� panchromatic image r:: from –0.32. to 0.16 (airborne
level), r: from -0.56 to 0.004 (satellite level),� thermal image r:: from -0.63 to 0.008 (airborne level),
r:: from =0.51 to 0.0004 (satellite level).The image influenced minimally by topographical effectwas chosen for next processing (Fig.6 e)- soil moistureassessment. Besides images: albedo and temperaturemeteorological parameters are needed in thermal inertiamodel. Some of them:� diurnal air temperature differences: 12.50 C,� average diurnal air temperature: 2.80 C,� average wind velocity: 1m/s.Image of albedo and temperature distribution was used asan input data in thermal inertia modeling using ownprogram: modi. Thermal inertia parameter for controlpoints was next statistical analyze to find functiondescribing dependence soil moisture on thermal inertia.Dependence soil moisture/thermal inertia (P) wasestimated by linear function:
soil moisture=0.005422 P -4.184, r2 = 0.96 (4)The last step contained transformation of thermal inertiaimage to soil moisture map.
To evaluate the best parameter for soil moistureassessment all used variables were analyzed (Tab.4).On the base of Tab. can be stated:1. The highest correlation between soil moisture and
albedo was obtained: r2=0,98. High correlation wasbetween soil moisture and temperature measured insitu: r2=0,94. Correlation between soil moisture andTI calculated on the base of corrected input data was:r2=0,90 (correlation between temperature calculatedfrom corrected thermal image and soil moisture wasr2=0,69. Correction of albedo image caused increaseof correlation between soil moisture and albedo fromr2=0.81 to 0.98.
2. Correction of thermal image was necessary becauseof dependence of temperature and soil moisture.Correlation between temperature measured remotelybefore correction and soil moisture was r= +0.79 (r2=62) (it is false because means that increasing of soilmoisture is connected with increasing of soiltemperature, and is contradicted with in situ
temperature measurements). After correctioncorrelation coefficient was r= -0.83, (r2= 0,69).
Square means error of soil moisture estimation fromthermal inertia model in compare to in situ measurementsof water content was �1.47%. Because of only 6 controlpoints F-statistic was calculated to check significance ofobtained correlation: r2 = 0.90 (4), (Fcalc=95.3). Estimatedfrom control points linear correlation should be significantbecause F-Statistic calculated are greater than boundaryvalue Fbound=7.7 for v1=1 and v2=2.
At the end, thermal inertia modeling was conductedfor uncorrected images. To analyze some northerly facingfield was chosen. The field was composed of two partswith different water content about. 10 and 25%. On soilmoisture image generated from uncorrected input datawater content of analyzed part of control field was reverse(35% and 20%).
4 DISCUSSION
Generally dependence: thermal inertia/soil moistureis not linear in all soil moisture values range, especially indry and wet state. Testing of thermal inertia /soil moisturefunction in all values range was not possible because ofsoil moisture values appearing during the measurements(10-25%)
Known from the literature correlation betweenimages in VIS and near IR concerned homogenous covertype mainly conifer forest (ponderosa pine). The highcorrelation obtained for all the images independent ofcover type were caused by late date of imagery (27October) and low sun position (zenith illumination angle -730). For homogenous cover – for example grasscorrelation coefficient was higher r2= 0.52 (r=-0.72).
5 CONCLUSIONS
Thermal inertia modeling seems to be a suitable toolfor soil moisture estimation basing on remote sensingdata in Poland. Remote sensing data registered onsatellite or airborne level should be initially corrected toreduce topographical effect. Desist from it can stronglydisturb soil moisture image. Influence of topographicalcorrection of thermal image seems to be more significantthan of panchromatic image. Obtain a proper method forreducing topographical effect from thermal image needsprobably many additional investigations.
6 ACKNOWLEDGMENTS
The research described above in this paper werefinancial supported, in part by Polish Committee ofScientific Research (grant No 9 S605 019 06). Remotesensing experiment was prepared in cooperation with DrStanislaw Mularz.
7 LITERATURE
1. Choudhury B.J., 1979 -„Effect of Surface Roughnesson the Microwave Emission from Soil” - Journal ofGeophysical Research, September 20, Vol.84, No C9.
2. Cierniewski, J., Verbrugghe, M., 1997 - „Influence ofsoil surface roughness on soil bidirectionalreflectance” - Int.J.Remote Sensing, 1997, Vol.18,No.6, 1277-1288.
D. Fritsch, M. Englich & M. Sester, eds, 'IAPRS', Vol. 32/4, ISPRS Commission IV Symposium on GIS - Between Visions and Applications,Stuttgart, Germany.
242 IAPRS, Vol. 32, Part 4 "GIS-Between Visions and Applications", Stuttgart, 1998
3. Civco, D.L., 1989 - „Topographic Normalisation ofLandsat Thematic Mapper Digital Imagery”-Photogrammetry Engineering and Remote Sensing,55 ( 9 ): 1303-1309.
4. Gillespie A.R., Kahle A.B., 1977 - „ Construction andInterpretation of a Digital Thermal Inertia Image” -Photogrammetric Engineering and Remote Sensing,Vol. 43, No. 8, August 1977, str. 983-1000.
5. Emslie, A.G., Aronson, J.R., 1972 - „SpectralReflectance and Emittance of Particulate Materials. 1:Theory” - Applied Optics, 12 ( 11 ): 2563-2572.
6. Franklin, J., Logan, T.L., Woodcock, L.C.E., Strahler,A.H., 1986 - „Coniferous Forest Classification andInventory Using Landsat and Digital Terrain Data” -IEEE Transactions on Geoscience and RemoteSensing, GE-24 (1): 139-149
7. Hapke, B.W., 1963 - „A Theoretical photometricfunction for the lunar surface, Journal of GeophysicalResearch” - 68 (15): pp. 4571-4586.
8. Hejmanowska B., Mularz S., 1996 - „Thermal inertiamodelling for soil moisture assessment based onremotely sensed data” - Int. Archives ofPhotogrammetry and Remote sensing XVII ISPRSCongress , Vienna, Austria,
9. Hejmanowska B., Mularz S., Sitek S., 1997 - „Soilmoisture investigation using remote sensing data andthermal inertia model ” - The Polish Committee ofScientific Research Nr 9 S605 019 06 (not published),
10. Hugli, H., Frei, W., 1983 - „Understanding AnisotropicReflectance in Mountaisions Terrain” -Photogrammetry Engineering and Remote Sensing,49 (5): 671-683.
11. Idso S.B., Jackson R.D., Reginato R.J., 1975 -„Detection of Soil Moisture by Remote Surveillance” -American Scientist, September-October 549,
12. Kahle A.B., 1977 - „A simple model of the earth’s.surface for geologic mapping by remote sensing” -Journal of Geophysical Research 82,
13. Kimball B.A., Jackson R.D., Reginato R.J., NakayamaF.S., Idso S.B., 1976 - Comparison of Field -measured and Calculated Soil - heat Fluxes - SoilSci.Soc.Amer.J., Vol 40.
14. Kriebel, K.T., 1977 - „Measured spectral bidirectionalreflection properties of four vegetated surfaces” -Applied Optics, 17 (2): 253-259.
15. Laungcai C., Zingeheng L., 1992 - „Analysis andcorrection technique of topographic effect in digitalremote sensing image” - XVIICongress ISPRS,Washington. Commission II. 182-188.
16. Leprieur, C.E., Durand, J.M., 1988 - „Influence ofTopography on Forest Reflectance Using LandsatThematic Mapper and Digital Terrain Data” -Photogrammetry Engineering and Remote Sensing,54 (4): 491-496.
17. Mularz S. 1990 - „Spectral characteristic catalog ofopen pit mine formations - Belchatow “ –project RPBPI.07.II.8NEN AGH, Kraków 1990.: „ Improvement ofphotogrametric measurements of open pit mine and ofquarry, unpublished
18. Pratt D., Foster S.J., Ellyett C.D., 1980 - „ACalibration Procedure for Fourier Series ThermalInertia Model” - Photogrammetric Engineering andRemote Sensing, No 4, April., pp. 529-538,
19. Reginato R.I., Idso S.B., Vedder I.F., Jackson R.D.,Blanchard M.B., Goettelman R., 1979 - „Soil WaterContent and Ewapotranspiration Determined byThermal Parameters Obtained From Ground - Based
and Remote Measurements” - Journal of GeophysicalResearch, March 20, Vol. .81., No.9,
20. Smith, J.A., Lin, T.L., Ranson, K.J., 1980 - „TheLambertian assumption and Landsat data.Photogrammetry Engineering and Remote Sensing” -46 (9): pp. 1183-1189.
a)
b)
c)
Fig.3 Test area; a) topographical map – with marked airborneimage site, b) part of Landsat composition, c) single airborne
panchromatic image
D. Fritsch, M. Englich & M. Sester, eds, 'IAPRS', Vol. 32/4, ISPRS Commission IV Symposium on GIS - Between Visions and Applications,Stuttgart, Germany.
Hejmanowska 243
Fig.1. Thermal inertia modelling for soil moisture assessment.
Tab. 1 Influence of temperature (�T) and albedo (A) changes on thermal inertia (P)
a) A (-) � T (0C)
0,2 16,8 18,9 21,0 23,1 25,1
P (J/m2Ks1/2) 4277 3588 3030 2568 2176
b) � T(0C) A (-)
21,0 0,16 0,18 0,20 0,22 0,24
P (J/m2Ks1/2) 3231 3131 3030 2930 2829
���
���
���
�� �
�
� �
��
��
��
��
��� �� � � � � ��
������� ������ ������������������
��������������
�������������
�������
������
Fig.2 Changes of thermal inertia caused by changes of albedo (temperature).
PPaanncchhrroommaattiicc iimmaaggee TThheerrmmaall iimmaaggee
ccoorrrreeccttiioonn ooff ttooppooggrraapphhiiccaall eeffffeecctt ttooppoo
AAllbbeeddoo iimmaaggee TTeemmppeerraattuurree iimmaaggee
DDiiggiittaall tthheerrmmaall iinneerrttiiaa mmooddeelllliinngg mmooddii
TThheerrmmaall iinneerrttiiaa iimmaaggee
SSooiill mmooiissttuurree iimmaaggee
AAnnaallyyssiiss iinn GGIISS ssyysstteemmssssooiill mmooiissttuurree == ff ((tthheerrmmaall iinneerrttiiaa))
IImmaaggee pprree--pprroocceessssiinngg iinn GGIISS ssyysstteemmssrraaddiioommeettrryy aanndd ggeeoommeettrryy ccoorrrreeccttiioonn
IInn ssiittuu tteemmppeerraattuurreemmeeaassuurreemmeennttss
•• DDEEMM,,•• ggeeooggrraapphhiiccaall ccoo--oorrddiinnaatteess•• ddaattee aanndd ttiimmee ooff iimmaaggiinngg•• BBRRDDFF
•• ggeeooggrraapphhiiccaall ccoo--oorrddiinnaatteess•• ddaattee aanndd ttiimmee ooff iimmaaggiinngg•• mmeetteeoorroollooggiiccaall ddaattaa
IInn ssiittuu ssooiill mmooiissttuurreemmeeaassuurreemmeennttssiinn ccoonnttrrooll ppooiinnttss
D. Fritsch, M. Englich & M. Sester, eds, 'IAPRS', Vol. 32/4, ISPRS Commission IV Symposium on GIS - Between Visions and Applications,Stuttgart, Germany.
244 IAPRS, Vol. 32, Part 4 "GIS-Between Visions and Applications", Stuttgart, 1998
Fig. 4 Example of panchromatic and thermal images (meteorological station)
Correlation matrix (r); a) airborne level b) satellite level. Tab.2
a) AS T Vo Az S.
AS 1 +0,53 -0,32 +0,21 +0,12
T +0,53 1 -0,63 +0,30 +0,24
V0 -0,32 -0,63 1 -0,49 -0,08
Az +0,21 +0,30 -0,49 1 +0,25
S. +0,12 +0,24 -0,08 +0,25 1
b) A T Vo Az S
A 1 +0,54 -0,57 -0,14 +0,26
T +0,54 1 -0,51 -0,17 -0,19
V0 -0,57 -0,51 1 -0,02 +0,24
Az +0,14 -0,17 -0,02 1 +0,18
S. +0,26 -0,19 +0,24 +0,18 1
Fig. 5. Panchromatic and thermal mage of test field with marked control points.
Correlation matrix (r) for profile I-I. Tab.3
A T Vo Az S.
A 1 -0,41 +0,17 -0,18 0,07
T -0,41 1 -0,50 +0,52 -0,25
V0 +0,17 -0,50 1 -0,95 -0,01
Az -0,18 +0,52 -0,95 1 -0,03
S. 0,07 -0,25 -0,01 -0,03 1
�������������
D. Fritsch, M. Englich & M. Sester, eds, 'IAPRS', Vol. 32/4, ISPRS Commission IV Symposium on GIS - Between Visions and Applications,Stuttgart, Germany.

Hejmanowska 245
Summary correlation matrix (r) Tab.4
Soilmoisture
Albedo(after
correction)
Temperaturemeasured remotely
(after correction)
Temperaturemeasured in situ
Thermalinertia
Temperaturemeasuredremotely
(before correction)
Albedo(before
correction)
Soil moisture 1 -0.9976 -0.83 -0.97 +0.95 +0.79 -0.90Albedo
(after correction)-0.9976 1 +0.86 +0.94 +0.95 -0.75 +0.90
Temperaturemeasured remotely
(after correction)
-0.83 +0.86 1 +0.68 -0.66 -0.33 +0.56
Temperaturemeasured in situ
-0.97 +0.94 +0.68 1 -0.98 -0.92 +0.94
Thermalinertia
0.95 +0.95 -0.66 -0.98 1 +0.89 +0.89
Temperaturemeasured remotely(before correction)
+0.79 -0.75 -0.33 -0.92 +0.89 1 -0.89
Albedo(before correction)
-0.90 +0.90 +0.56 +0.94 +0.89 -0.89 1
a) b)
0,0 0,06 0,12 0,18 0,24 0,30 0,36 0,40 50 55 60 65 70 75 80 85 0
zenith illumination angle V0
c) d)
e)
0,0 0,1 0,2 0,3 0,4 0,5 0,6 0,7albedo AS
Fig.6. Correction of panchromatic image
a) registered panchromatic image,
b) zenith illumination angle (50 - 890),
c) image after correction basing on Lambert’s model,
d) image after correction basing on backscattering model,
e) image after correction basing on azimuth empirical method.
D. Fritsch, M. Englich & M. Sester, eds, 'IAPRS', Vol. 32/4, ISPRS Commission IV Symposium on GIS - Between Visions and Applications,Stuttgart, Germany.

246 IAPRS, Vol. 32, Part 4 "GIS-Between Visions and Applications", Stuttgart, 1998
D. Fritsch, M. Englich & M. Sester, eds, 'IAPRS', Vol. 32/4, ISPRS Commission IV Symposium on GIS - Between Visions and Applications,Stuttgart, Germany.