removal of heavy metals from drinking water by adsorption
TRANSCRIPT

Western Kentucky UniversityTopSCHOLAR®
Masters Theses & Specialist Projects Graduate School
8-2012
Removal of Heavy Metals from Drinking Water byAdsorption onto Limestone with a Focus onCopper and Aluminum ApplicationsSwarna Latha SomasaniWestern Kentucky University, [email protected]
Follow this and additional works at: http://digitalcommons.wku.edu/theses
Part of the Environmental Chemistry Commons, Environmental Health and ProtectionCommons, and the Environmental Indicators and Impact Assessment Commons
This Thesis is brought to you for free and open access by TopSCHOLAR®. It has been accepted for inclusion in Masters Theses & Specialist Projects byan authorized administrator of TopSCHOLAR®. For more information, please contact [email protected].
Recommended CitationSomasani, Swarna Latha, "Removal of Heavy Metals from Drinking Water by Adsorption onto Limestone with a Focus on Copper andAluminum Applications" (2012). Masters Theses & Specialist Projects. Paper 1204.http://digitalcommons.wku.edu/theses/1204


REMOVAL OF HEAVY METALS FROM DRINKING WATER BY ADSORPTIONONTO LIMESTONE WITH A FOCUS ON COPPER AND ALUMINUM
APPLICATIONS
A ThesisPresented to
The Faculty of the Department of ChemistryWestern Kentucky University
Bowling Green, Kentucky
In Partial FulfillmentOf the Requirements for the Degree
Master of Science
BySwarna Latha Somasani
August 2012


I dedicate this thesis to my mother, father and brothers for their love and support. Also, I
dedicate this thesis to my research advisor, Dr. Cathleen Webb, for her help and support
throughout my research. Also, dedication goes to all my friends at Western Kentucky
University.

iv
ACKNOWLEDGEMENTS
I would like to thank my research advisor, Dr. Cathleen Webb, for her valuable
guidance throughout my research. I am thankful for her encouragement and for her
patience throughout my research. Also thanks for the financial support by my advisor
during the research work. Her precious instructions made me to finish my research with
ease.
I would like to acknowledge Dr. Bangbo Yan for his help in XRD during my
research work. Thankful to Dr. John Andersland for his support in SEM studies. Thanks
to Alicia McDaniel for her support in providing all chemicals during the times of need.
Also thankful to Pauline Norris at Advanced Material Institute, for her guidance in ICP.
Many thanks to Shannon Marble, and Aly Anderson for their help.
I wish to thank the other faculty/staff at the Department of Chemistry for their
help. Also thanks to Ogden College of Science and Engineering at WKU.
Special acknowledgements to my research group without whom it would be
impossible for me to overcome all the obstacles.
I express my deepest gratitude to all my family members for their encouragement
and support.

v
TABLE OF CONTENTS
List of Figures…………………………………………………………………………….vi
List of Tables………………………………...…………………………………………...ix
Abstract……………………………………………………………………………….….xi
Chapter One: Introduction…………………………………………………………...........1
Chapter Two: Experimental Section…………………………………………………......11
Chapter Three: Results and Discussions…………………………………….…...………21
Chapter Four: Conclusion..………………………………………………………………66
Chapter Five: Future work……………………………………………………………….69
Chapter Six: Perspective…………………………………………………………………70
Bibliography……………………………………………………………………………..71

vi
LIST OF FIGURES
Figure 1: Copper speciation in water ………………………………………………..…....3
Figure 2: Aluminum speciation in water………………………………………………….5
Figure 3: Inductively coupled plasma …………………………………….………..........14
Figure 4: Burrell Wrist action shaker…………………………………………………….15
Figure 5: Accumet pH meter……………………………………………………………..16
Figure 6: Calibration curve for copper……………….………………….….………........22
Figure 7: Kinetics experiment with 20 ppm copper solution using ten grams uncoated
limestone………………………………………………………………………………....24
Figure 8: Kinetics experiment with 20 ppm copper solution using ten grams iron-coated
limestone………………….……………………………………………………………...26
Figure 9: Batch tests with 20 ppm copper solution using iron-coated limestone………..28
Figure 10: Batch tests with 40 ppm copper solution using iron-coated limestone………30
Figure 11: Batch tests with 100 ppm copper solution using iron-coated limestone……..32
Figure 12: Effect of pH using iron-coated limestone with 40 ppm copper solution……..34
Figure 13: Calibration curve for aluminum ……………………………………..............36
Figure 14: Kinetics experiment with 2 ppm aluminum solution using ten grams uncoated
limestone............................................................................................................................38

vii
Figure 15: Kinetics experiment with 2 ppm aluminum solution using ten grams
iron-coated limestone………………………………………………………………….…40
Figure 16: Batch tests with 2 ppm aluminum solution using iron-coated limestone…….42
Figure 17: Batch tests with 4 ppm aluminum solution using iron-coated limestone….....44
Figure 18: Batch tests with 10 ppm aluminum solution using iron-coated limestone…...46
Figure 19: Effect of pH using iron-coated limestone with 4 ppm aluminum solution…..48
Figure 20: XRD pattern comparing uncoated limestone with calcium carbonate……….49
Figure 21: XRD pattern of uncoated limestone and iron-coated limestone…………...…50
Figure 22: SEM image of uncoated limestone…………………………………………...51
Figure 23: SEM analysis report for uncoated limestone…………………………………52
Figure 24: SEM image of iron-coated limestone………………….……………………..54
Figure 25: SEM analysis report for iron-coated limestone……………………………... 55
Figure 26: SEM image of iron-coated limestone after treatment with 10 ppm aluminum
solution…………………………………………………………………………………...57
Figure 27: SEM analysis report for iron-coated limestone after treatment with 10 ppm
aluminum solution……………………………………………………………………….58
Figure 28: SEM image of iron-coated limestone after treatment with 100 ppm copper
solution….………………………………………………………………………………..60
viii
Figure 29: SEM analysis report for iron-coated limestone after treatment with 100 ppm
copper solution…………………………………………………………………………...61
Figure 30: SEM image of iron-coated limestone after treatment with water…………....63
Figure 31: SEM analysis report for iron-coated limestone after treatment with water….64

ix
LIST OF TABLES
Table 1: Materials………………………………………………………………………..11
Table 2: Calibration data for copper……………………………………………………..21
Table 3: Kinetics experiment with 20 ppm copper solution using ten grams uncoated
limestone………………………………………………………………………………....23
Table 4: Kinetics experiment with 20 ppm copper solution using ten grams iron-coated
limestone…………………………………………...………………………………….....25
Table 5: Batch tests with 20 ppm copper solution using iron-coated limestone………...27
Table 6: Batch tests with 40 ppm copper solution using iron-coated limestone………...29
Table 7: Batch tests with 100 ppm copper solution using iron-coated limestone……….31
Table 8: Effect of pH using iron-coated limestone with 40 ppm copper solution……….33
Table 9: Calibration curve for aluminum………………………………………………...35
Table 10: Kinetics experiment with 2 ppm aluminum solution using ten grams uncoated
limestone….……………………………………………………………………………...37
Table 11: Kinetics experiment with 2 ppm aluminum solution using ten grams
iron-coated limestone…………………………………………………………………….39
Table 12: Batch tests with 2 ppm aluminum solution using iron-coated limestone……..41
Table 13: Batch tests with 4 ppm aluminum solution using iron-coated limestone……..43

x
Table 14: Batch tests with 10 ppm aluminum solution using iron-coated limestone……45
Table 15: Effect of pH using iron-coated limestone with 4 ppm aluminum solution…....47
Table 16: SEM analysis data for uncoated limestone………………………………........53
Table 17: SEM analysis data for iron-coated limestone…………………………………56
Table 18: SEM analysis data iron-coated limestone after treatment with 10 ppm
aluminum solution……………………………………………………………………….59
Table 19: SEM analysis data for iron-coated limestone after treatment with 100 ppm
copper solution…………………………………………………………………………...62
Table 20: SEM analysis data for iron-coated limestone after treatment with water……..65
xi
REMOVAL OF HEAVY METALS FROM DRINKING WATER BY ADSORPTIONONTO LIMESTONE WITH A FOCUS ON COPPER AND ALUMINUM
APPLICATIONS
Swarna Latha Somasani August 2012 Pages 74
Directed by: Dr. Cathleen Webb, Dr. Bangbo Yan and Dr. Kevin Williams
Department of Chemistry Western Kentucky University
Elevated levels of arsenic and other heavy metals like copper, aluminum, zinc,
and selenium in drinking water are found to have deleterious effects on human health.
Hence, finding methods for reducing their levels is critical. Iron-coated limestone is used
as an adsorption material for the removal of heavy metals from drinking water. Removal
of heavy metals by native or uncoated limestone was also observed and used for
comparison to and evaluation of the improvement in removal efficiency from the iron-
coated material. The removal efficiency with limestone was studied for different
concentrations of heavy metals. Kinetic studies were done to determine the decrease in
heavy metal concentration as a function of time using limestone. Inductively coupled
plasma spectroscopy was used for metal analysis. The effective removal rate of copper
and aluminum was found to be four hours and one hour, respectively. This method of
removal by using limestone is cost effective, eco-friendly, and hence, of great potential
importance for heavy metal removal.
Iron-coated limestone is used as an adsorption material for the removal of heavy
metals from drinking water. This project will investigate techniques to improve removal
efficiency of heavy metals using limestone-based material through adsorption. This
research will assist in the development of a granular adsorbent product that will remove
metals and that can be manufactured and sold for use at the drinking water source, at

xii
point-of-use, or at point-of-entry. Limestone is readily available and its use for metals
removal is relatively inexpensive. The technology can be adapted to small, rural water
supply systems. Benefits of this research will include a low-cost treatment technology for
source reduction that will reduce select metals to below drinking water standards.

1
I. Introduction
Heavy metals are a class of metallic elements which are abundant in earth’s crust.
Heavy metal contamination has been a serious concern throughout the world (Romero, et
al, 2001). Humans may require trace amounts of heavy metals such as copper, and zinc.
Unfortunately, these metals can be dangerous at high levels. Heavy metal accumulation at
higher levels can result even in death. Heavy metal toxins contribute to a variety of
adverse health effects (Romero, et al, 2001). Around twenty different known heavy
metals were identified that can impact human health. Accumulation of heavy metals
within the body can lead to a decline in the mental, cognitive, and physical health of the
individual (Aziz, et al, 2005). Global environmental changes have dramatically increased
the overall environmental 'load' of heavy metals (Lee, et al, 2005). Today, heavy metals
are abundant in our air, soil, and even drinking water. They are present in virtually every
area of modern life (Chen, et al, 2008). Heavy metal concentration in drinking water in
the United States is regulated by the United States Environmental Protection Agency
(U.S. EPA), under the Safe Drinking Water Act. Several international organizations and
national organizations like United Nations International Children’s Emergency Fund
(UNICEF), World Health Organization (WHO), World Bank and National Government
Organizations (NGOs) have initiated steps to control heavy metal levels in drinking
water, especially in Asian countries (Hossain, et al, 2005).
Heavy metals may cause chronic poisoning with some considered to be a human
carcinogen. Copper and aluminum have been found in ground water in many parts of the
2
world like India, Bangladesh, Inner Mangolia and Taiwan (Ferguson, et al, 2007). Higher
levels of copper and aluminum were found to cause skin, lung, and bladder cancer (Le, et
al, 2000). Heavy metals in ground water tend to be mostly in a reduced state which can
be inferred from the lower redox potentials. Geochemical conditions may also lead to
naturally occurring higher levels of heavy metals in ground water (Kim, et al, 2000). The
maximum contaminant level (MCL) is referred to as maximum level of heavy metals in
water that can cause potential effects on human body.
Copper: Copper is a transition element with atomic number 29 and atomic weight
63.55 amu. In solution copper (II) has a blue color. It may exist in both the cuprous (+1)
and cupric (+2) forms. Melting and boiling points of copper are 1357 K and 2835 K,
respectively. Copper exhibits malleable and ductile properties. Hence, it has wide
applications in electrical wiring, utensils, pipes, building materials, alloys, electroplating,
petroleum refining, and the azo dye manufacture (Landner & Lindestrom, 1999). Copper
compounds are also used in fungicides, insecticides, and in fertilizers as a nutrient to
support growth.
Copper is essential for proper functioning of enzymes such as superoxide
dismutase, ceruloplasmin, cytochrome-c oxidase, tyrosinase, monoamine oxidase. Copper
is found in various parts of the body such as the lungs, liver, kidney, and brain (Linder, et
al, 1996). Adsorption of copper occurs in the upper gastrointestinal tract. Copper is
removed from the body through bile, sweat, and urine (Luza, et al, 1996; Cox, 1999).
Copper enters into humans through food, water and air. Food and water are the
major source of copper ingestion into the body. The lethal dose of copper lies between 4

3
and 400 mg of copper (II) per kg body weight (Chuttani, et al, 1965). Copper exposure
can lead to headaches, diarrhoea, nausea and vomiting at low doses. Increased doses of
copper can result in gastrointestinal bleeding, hepatocellular toxicity, renal failure and
oligouria (Agarwal, et al, 1993).
Figure 1 shows the speciation diagram of copper in water. Copper exists in both
the free state and in hydroxyl forms. Among all the forms free copper (II) ion and
monohydroxy copper (II) are considered to be highly toxic. While the anionic complexes
such as carbonate complexes are less toxic. The particulate copper is not toxic unless it is
solubilized in water or within the fluids of organism (Cuppett, et al, 2006).
Figure 1: Copper Speciation in water (Cuppett, et al, 2006)
In pure water, copper has a minimal solubility around pH 5. Copper in drinking
water is analyzed by inductively coupled plasma spectroscopy (ICP) and the detection
limits for copper are given as 3.6 µg/L (ISO, 1996).

4
Aluminum: Aluminum is a metallic element with atomic number 13 and atomic mass of
26.98 amu. It is colorless and typically exists in +3 oxidation state. It is available in
earth’s crust as silicates, oxides and hydroxides along with other metals such as sodium
and fluorides. The melting and boiling points are found to be 933 K and 2740 K
respectively.
Aluminum is widely used in automotive, aircraft, construction, electric industries
and in alloys. It is also used in cooking utensils and in food packaging. It is also used in
water treatment process to reduce the level of microbes, organic matter, color and
turbidity. It serves as a coagulant in the water treatment process. It is commonly used in
pharmaceutical industries such as in the preparation of antacids. It is also used in
antiperspirants and food additives (ATSDR, 1992).
The most common source of ingestion of aluminum in humans is by air, water
and food. Aluminum is present in water in different forms and its existence is influenced
by pH. In pure water, aluminum has a minimal solubility in the pH range of 5.5-6.0.
Aluminum in drinking water is analyzed by inductively coupled plasma spectroscopy
(ICP) and the detection limits for aluminum are given as 30 µg/L (ISO, 1996). Aluminum
in lethal doses was found to cause skin rashes, arthritis, mouth ulcers, skin ulcers, nausea
and vomiting (WHO, 1997).
Figure 2 represents the speciation diagram of aluminum in water at 250C.
Aluminum exists mostly in the +3 oxidation state up to pH 4. Many transitions occur
between pH 5 and 6. Aluminum in the +3 oxidation state is transformed to the hydrated
form around pH 5.

5
Figure 2: Aluminum Speciation in water
In recent years, heavy metal contamination in ground water has been found to be
alarming in ground water in Asian countries like Bangladesh, India and China (Hossain,
et al, 2005). Specific rock types, geochemical conditions, proximity to hydrologic and
landscape variables are found to be the reasons of higher content of heavy metals in
ground water (Joseph, et al, 2006).
Techniques for heavy metal removal: Several techniques are well established and have
been in use for the removal of heavy metals from drinking water including coagulation,
ion exchange, reverse osmosis, nano filtration, adsorption and usage of activated alumina.
Coagulation/ Flocculation: Iron chloride is used as a coagulant to remove heavy metals
from drinking water at certain pH conditions. The presence of sulfates and other organic

6
matter affected the removal efficiency. Alum can also be used as coagulant. Alum is
chemically hydrated aluminum potassium sulfate (Janet, et al, 1997).
Activated Alumina: Activated alumina is efficient in removing total dissolved solids and
is effective for arsenic. However, it is difficult to regenerate activated alumina (Nurul, et
al, 2006).
Ion exchange: Ion exchange removal occurs by the exchange of heavy metal ions with
other species in a column. This process may be efficient in removal but there is
competition among the heavy metals for the exchange sites. Pores often get clogged with
suspended solids, and other matter (Nurul, et al, 2006).
Reverse Osmosis: Cellulose triacetate membranes are generally used for separation. This
is an efficient method for removal but often the membranes get degraded by chlorine and
they are difficult to clean or regenerate (Mina, et al, 2009).
Nanofiltration: Nano filters act by the principle of charge exclusion and retain certain
ions. Pore distribution and membrane size also influences the separation of uncharged
organic species. Since it is an expensive technique, the usage is limited (Nurul, et al,
2006).
Adsorption Techniques: Several materials such as limestone, hematite and feldspar,
activated carbon, and activated alumina have been used as adsorbents (Silva, et al, 2010).
Limestone: Limestone acts as an adsorbent in heavy metal removal. The most commonly
used limestone is calcite and dolomite. Limestone in a pulverized form is typically used.
Commercially available limestone is pulverized and then sieved so that smaller particles

7
with enhanced surface area are produced (Silva, et al, 2010). Earlier research by using
limestone as an adsorbent for removal of heavy metals from drinking water has showed
the removal efficiency of 90%. Adsorption using limestone is found to be economic,
efficient and eco-friendly since it produced no harmful products.
Bio techniques such as use of bacterial sensors and ferns, which are inexpensive
and nontoxic, can help in removing heavy metals from drinking water. Unfortunately,
these techniques are labor and resource intensive.
Earlier, extensive research was done on arsenic removal from drinking water
since it poses severe health problems. Arsenic sources can be categorized as either
anthropogenic or natural. Anthropogenic sources include agriculture chemicals and wood
preservatives, forest fires. Natural sources of arsenic include arsenopyrite (FeAsS), pyrite
(FeS2), pyrrhotite (Fe1-xS), piment (As2S3). Arsenic in ground water can also be obtained
by the dissolution of arsenic bearing iron oxides (Peters, et al, 1999). Arsenic is also
introduced by volcanoes, and erosion (Islam, et al, 2007).
Elevated levels of arsenic and other heavy metals like copper, aluminum, zinc,
selenium in drinking water are found to have deleterious effects on human health. The
US EPA set the drinking water standards for arsenic at 0.01 ppm, copper at 1.3 ppm,
aluminum at 0.2 ppm, zinc at 3 ppm, cadmium 0.003 ppm, selenium at 0.01 ppm, and
lead at 0.01 ppm. Higher levels of arsenic in drinking water cause numbness in hands
and feet, blindness, and cancers of lung, liver and prostate. Various techniques are used to
reduce the levels of arsenic from drinking water. Sorption and desorption process were
studied in arsenic removal from water using limestone, rice husk and granular activated

8
carbon (GAC). Limestone is coated with a layer of porous Si-Ca-As containing iron
oxide with some manganese oxide. Water with low levels of As (III) was obtained after
passing through the filter using limestone. Adsorption studies using rice husk also
showed reduced arsenic levels in water. Column tests with granular activated carbon
showed removal of As (III) and As (V) from drinking water. Sorption and desorption of
arsenic were found to depend upon aqueous concentration of arsenic, pH and aqueous
concentration of other heavy metals. After the removal of arsenic from drinking water
different instrumental methods are used to detect and measure the levels of arsenic.
Arsenic interferes with cellular activity by inhibiting cellular enzymes, thus causing cell
death, lactic acidosis and other health problems (Janet, et al, 1997; Stocker, et al, 2003).
Arsenic occurs in two oxidation states: arsenate and arsenite. In surface waters it
is present in the form of arsenate, As (V). In ground waters it is mostly present in the
form of arsenite, As (III). Combinations of As (III) and As (V) are also present. As (V) is
easily removed when compared to As (III). Most methods require As (III) to be converted
into As (V) for efficient removal (Nurul, et al, 2006). Arsenite is oxidized by free
chlorine, potassium permanganate, ozone, chloramines, chlorine dioxide and UV
radiation (Sorlini, et al, 2010). Oxidation by using chlorine, potassium permanganate,
ozone is more effective in comparison to chloramines, UV radiation, and chlorine
dioxide. The adsorption process is often carried out through column tests. Various factors
such as particle size, flow rate and amount of adsorbate affect the adsorption process. As
the particle size decreases the removal efficiency increases because of the greater surface
area when compared to larger particles (Nurul, et al, 2006).

9
Adsorption occurs by two ways: affinity adsorption and anion exchange. Affinity
adsorption is related to the surface behavior of the rice husk. Anion exchange is between
arsenic in the water and the carbon surface of adsorbent material. Recovery add
substantially to cost, waste disposal, technical difficulty and safety (Nurul, et al, 2006).
Anion exchange mechanism can be explained electrochemically. Hydroxyl groups
are created on the surface of adsorbent. Carbon present on the surface of adsorbent in
contact with water reduces oxygen to hydroxyl ions. Carbon loses electrons and becomes
positively charged. Electrical neutrality is maintained with the help of hydroxyl ions,
which results in their adsorption. The hydroxyl ions are deposited on the surface of the
adsorbent. When a solution containing anions with greater affinity towards carbon than
hydroxyl ions is passed through, then the hydroxyl ions are exchanged for anionic species
(Nurul, et al, 2006).
Desorption process is a method for recovery of the adsorbent, which is typically
expensive. Recovery is done by hydrochloric acid, sulfuric and nitric acid and base
solution such as sodium hydroxide and potassium hydroxide (Nurul, et al, 2006).
Limestone is used as the adsorbent in the proposed research. The structure of
limestone was investigated from the experiments such as helium gas infiltration where
the porosity was found to be 17.6%. Nitrogen adsorption experiments indicate that
limestone exhibits two kinds of pores. Most of the surface area of limestone is found to
possess micro pores which are responsible for increase in surface area thus resulting in
enhanced adsorption (Leith, et al, 1996). Limestone is so inexpensive it does not need to
be recovered. It can be safely disposed of in cement or concrete.

10
Instruments for analyzing heavy metal content: For detection of heavy metals in drinking
water various instrumental methods have been designed such as Inductively Coupled
Plasma Mass Spectrometry (ICPMS), High Performance Liquid Chromatography
(HPLC), and Graphite Furnace Atomic Absorption Spectrometry (GFAA), and Flow
Injection Hydride Generation Atomic Absorption Spectrophotometer (FI-HG-AA).

11
II. Experimental Section
Chemicals and Materials: Table 1 shows chemical names and their manufacturers.
Table 1: Materials
Chemical Name Manufacturer
Nanopure water Barnstead Nano Pure II
Limestone (#16/60 ) Pete Lien and Sons, LaPorte, CO
Ferric chloride (FeCl3. 6H2O) Mallinckrodt
Whatman cellulose nitrate membrane
filters (0.45 µm, 25 mm)
Fisher Scientific
Millipore Swinnex Filter Holder Fischer Scientific
Sodium hydroxide (NaOH) Fischer Scientific
Buffers (pH 4 and pH 7) Fischer Scientific
Copper (1000 ppm) Inorganic Ventures
Aluminum (1000 ppm) Inorganic Ventures
Nitric acid (Concentrated, Trace metal
grade)
Fischer Scientific

12
Preparation of stock solutions
Preparation of 0.1M iron chloride solution: A sample of 27 grams of FeCl3· 6H2O was
dissolved in 10 mL of nanopure water and transferred to a 1000 mL volumetric flask. The
volume is made to 1000 mL with nanopure water.
Preparation of iron-coated limestone: A sample of 100 grams of limestone was placed
into a round bottom flask. A solution of 100 ml of 0.1M iron (III) chloride FeCl3 was
then placed in the flask. The flask was placed on a shaker. After 24 hours, a few drops of
1M sodium hydroxide were added to shock the solution. The granules were rinsed with
nanopure water and then air dried.
Preparation of 1M sodium hydroxide solution: A sample of four grams of sodium
hydroxide was dissolved in 10 mL of nanopure water which was then transferred to a
100 mL volumetric flask. The volume is made to 100 mL with nanopure water.
Standard solutions 1000 ppm of copper and aluminum were purchased from
Inorganic Ventures. All other solutions were prepared from these standards.
Preparation of 20 ppm copper solution: An aliquot of 20 mL of 1000 ppm standard
copper solution was placed in a 1000 mL volumetric flask and the volume is made up to
1000 mL with nanopure water.
Preparation of 40 ppm copper solution: An aliquot of 40 mL of 1000 ppm standard
copper solution was placed in a 1000 mL volumetric flask and the volume is made up to
1000 mL with nanopure water.

13
Preparation of 100 ppm copper solution: An aliquot of 100 mL of 1000 ppm standard
copper solution was placed in a 1000 mL volumetric flask and the volume is made up to
1000 mL with nanopure water.
Preparation of 2 ppm aluminum solution: An aliquot of 2 mL of 1000 ppm standard
aluminum solution was placed in a 1000 mL volumetric flask and the volume is made up
to 1000 mL with nanopure water.
Preparation of 4 ppm aluminum solution: An aliquot of 4 mL of 1000 ppm standard
aluminum solution was placed in a 1000 mL volumetric flask and the volume is made up
to 1000 mL with nanopure water.
Preparation of 6 ppm aluminum solution: An aliquot of 6 mL of 1000 ppm standard
aluminum solution was placed in a 1000 mL volumetric flask and the volume is made up
to 1000 mL with nanopure water.
Instrumentation
Inductively Coupled Plasma (ICP-ES): Inductively coupled plasma emission
spectroscopy provides for the multi-element analysis. An instrument of ICP is shown in
Figure 3. It usually consists of a torch which carries argon gas through it. The torch is
connected to a water cooled induction coil. The coil is in turn, connected to a radio-
frequency generator. A spark from the Tesla causes ionization of the argon gas,
producing ions and electrons and resulting in the formation of high temperature plasma.
The sample to be analyzed is introduced into the torch. Usually a nebulizer converts the
sample into fine droplets and introduces the sample into the plasma. The elements

14
converted into ions. They recombine in the plasma remitting radiation at the
characteristic wavelengths of the elements involved. Hence, a particular element is
detected. (Skoog, et al, 1998).
Figure 3: Inductively coupled plasma

15
Wrist action shaker: A wrist action shaker is used for the purpose of stirring. The Burrell
wrist action shaker (model 75) shown in Figure 4 was used. The shaker is designed in
such a way that it can hold eight flasks at a time. The desired time and speed can be setup
on the shaker. This is used to coat the limestone material and also for stirring of the
solutions.
Figure 4: Burrell wrist action shaker

16
pH meter: An Accumet basic AB15 pH meter shown in Figure 5 was used for the
purpose of pH measurement of all the solutions. It consists of a glass electrode. The
instrument is calibrated with pH buffers 4 and 7. After calibration it is used for pH
measurement.
Figure 5: Accumet pH meter
Scanning electron microscope: The JEOL JSM-5400 LV SEM was the used to analyze
the samples.
Sample preparation for SEM:
Mounting: SEM samples are generally mounted on metal holders called stubs. The stubs
are generally made of aluminum. The sample is generally fastened on to the stub by a
mounting material such as tape. The mounting material should be stable upon the

17
bombardment of electrons with minimal release of solvents, and should have good
electrical conductivity.
X-ray diffraction methods (XRD): X-ray diffraction is used for the qualitative and
quantitative determination of solid samples. It works on the principle that X-ray
diffraction pattern is unique for each sample. This pattern from XRD is compared with a
known compound and the chemical compound is identified.
Experimental Methods
Kinetic studies
Copper
Kinetic studies: Kinetic studies were done to study the effect of time on heavy metal
removal rate. These experiments were conducted with iron-coated limestone and
uncoated limestone. For kinetic studies, the same amount of limestone was used and kept
in contact with the standard solution for different time intervals (0.25, 0.5, 1, 1.5, 2, 4, 10
and 24 hours). A 100 mL volume of 20 ppm of copper solution was taken in round
bottom flask. To each flask ten grams of iron coated limestone was added and kept in
contact with the copper solution for the stated time intervals. Kinetic studies were done
using both coated and uncoated limestone. The speed of the shaker is set to 1-2 cycles per
sec. The pH of the copper solution was measured before and after the kinetic
experiments. The same experiments were done with uncoated limestone and an initial
copper solution of 20 ppm.

18
Aluminum
Kinetic studies: Kinetic studies for aluminum were done to study the effect of time on
heavy metal removal rate. These experiments were conducted with both iron-coated
limestone and uncoated limestone. For kinetic studies, the same amount of limestone was
used and kept in contact with the standard solution for different time intervals (0.25, 0.5,
1, 1.5, 2, 4, 10 and 24 hours). A 100 mL volume of 2 ppm of aluminum solution was
placed in a round bottom flask. To each flask, ten grams of coated limestone was added
and kept in contact with the aluminum solution for stated time intervals. Kinetic studies
were done using both coated and uncoated limestone. The speed of the shaker is set to
1-2 cycles per sec. The pH of the aluminum solution was measured before and after the
kinetic experiments. The same experiments were done with uncoated limestone and an
initial aluminum solution of 2 ppm.
Batch tests
Copper
Batch tests: These experiments were conducted with both iron-coated limestone and
uncoated limestone. Different amounts of iron coated limestone (5, 10, 20 and
100 grams) are used. A duplicate of ten grams was also prepared for quality control and
assurance. Different amounts of limestone were placed into separate round bottom flasks
and 100 mL of 20 ppm copper solution was introduced into each of the flasks. The speed
of the shaker is set at 2 cycles per sec for four hours.

19
The same experimental procedure was followed for uncoated limestone with
copper solution of 20 ppm for time period of four hours. All the samples, once they are
removed from the shaker, were microfiltered and analyzed on ICP.
Aluminum
Batch tests: These experiments were conducted with both iron-coated limestone and
uncoated limestone. Different amounts of iron coated limestone (5, 10, 20 and 100 gms)
are used. A duplicate of ten grams was also prepared for quality control and assurance.
Different amounts of limestone were weighed into separate round bottom flasks and
100 mL of 2 ppm aluminum was introduced into each of the flasks. The speed of the
shaker is set at 1-2 cycles per sec for a time period of one hour.
The same experimental procedure was followed for uncoated limestone with
initial aluminum solution of 20 ppm for a time period of one hour. All the samples once
they are removed from the shaker are microfiltered and analyzed on ICP.
pH studies: The effect of pH on heavy metal removal was studied for both aluminum and
copper heavy metals. For this purpose, stock solutions of copper (40 ppm) and aluminum
(4 ppm) of varying pH 5, 6, 7, 8 and 9 prepared. The desired pH is achieved with addition
of small amounts of sodium hydroxide solution (1M). The solutions kept in contact with
iron coated limestone on the shaker for a time period of four hours for copper and one
hour for aluminum solution. Then, the solutions are microfiltered and analyzed on ICP.

20
Limestone and water interactions: In order to study if there are any interactions of water
with limestone, limestone was kept in contact with water for 24 hours and then analyzed
on ICP and SEM.
Sample analysis: The samples were collected into separate vials with 25 µ Whatman
cellulose nitrate membrane filters. ICP is used for the sample analysis. ICP is calibrated
using standard solution of the heavy metal that is being analyzed. Flush time of
60 seconds and 80 seconds are used for copper and aluminum solutions respectively.
Wavelengths of 324.754 nm and 308.2 nm are used in ICP for copper and aluminum
samples respectively.
Microscopic studies: Microscope studies are done to study the surface behavior of
limestone. They are done both by scanning electron microscopy (SEM) and X-ray
diffraction studies (XRD). SEM and XRD studies are done to study the surface nature of
both iron-coated and uncoated limestone. SEM studies are also done for iron coated
limestone after the treatment with copper and aluminum solutions.

21
III. Results and Discussions
Kinetic Studies: The effect of contact time on the removal rate of aluminum and copper
was determined by kinetic experiments. For kinetic studies, fixed amount of limestone
(ten grams) is kept in contact with limestone for different time intervals. The kinetic
experiments were done using both coated and uncoated limestone and compared for their
removal efficiency. The calibration data for copper after the analysis on ICP-ES is shown
in Table 2 and Figure 6.
Table 2: Calibration data for copper
Copper concentration (ppm) Signal intensity (324.7 nm) Signal intensity (327.3 nm)
0 241.4 138
0.5 18566 10198
1 39675 21931
2.5 95179 52151
5 187120 103409
10 365045 205641
15 531312 298638
20 724002 407667

22
Figure 6 shows the calibration curve for copper. The graph is plotted for
concentration on the X-axis and signal intensity on the Y-axis. Calibration is done at
different concentrations (0.5 ppm, 1 ppm, 2.5 ppm, 5 ppm, 10 ppm, 15 ppm and 20 ppm)
of copper standard solution. The wavelengths used for copper analysis are 324.7 nm and
327.3 nm. The calibration curve has a correlation value of 0.999 at both wavelengths.
Figure 6: Calibration curve for copper

23
Table 3 shows the the data obtained for kinetics experiment with 20 ppm copper
using uncoated limestone after the analysis on ICP-ES. Figure 7 shows the kinetics
experiment with an initial concentration of 20 ppm copper solution on uncoated
limestone.
Table 3: Kinetics experiment with 20 ppm copper solution using ten grams uncoated
limestone
Time (hours) Copper concentration (ppm)
at 324.7 nm (± 0.15 ppm)
Copper concentration (ppm)
at 327.3 nm (± 0.15 ppm)
0 20.00 20.00
0.5 10.95 10.87
1 18.13 17.99
1.5 17.42 17.24
2 16.09 15.94
4 0.541 0.519
10 6.643 6.605
24 0.667 0.650

24
Figure 7: Kinetics experiment with 20 ppm copper solution using ten grams uncoated
limestone
In Figure 7, the X-axis represents the time in hours and the Y-axis represents the
residual concentration of the copper metal after treatment with plain limestone. The two
series represent the concentrations of copper at wavelengths 324.7 nm and 327.3 nm. It
showed the maximum removal within four hours. An amount of ten grams of uncoated
limestone could remove 97 percent of the copper from the solution. However, the
drinking water standard of 1.3 ppm for copper was achieved within four hours.

25
Table 4 shows the the data obtained for kinetics experiment with 20 ppm copper
using iron-coated limestone after the analysis on ICP-ES. Figure 8 shows the kinetics
experiment with an initial concentration of 20 ppm copper solution on iron-coated
limestone.
Table 4: Kinetics experiment with 20 ppm copper solution using ten grams iron-coated
limestone
Time (hours) Copper concentration (ppm)
at 324.7 nm (± 0.15 ppm)
Copper concentration (ppm)
at 327.3 nm (± 0.15 ppm)
0 20.00 20.00
0.5 8.591 8.478
1 5.149 5.086
1.5 4.120 4.071
2 4.418 4.336
4 0.598 0.581
10 0.377 0.353
24 1.273 1.245

26
In Figure 8, the X-axis represents the time in hours and the Y-axis represents the
residual concentration of the copper metal after treatment with iron-coated limestone. The
two series represent the concentrations of copper measured at wavelengths 324.7 nm and
327.3 nm. Maximum removal is within four hours. An amount of only ten grams of iron-
coated limestone could remove 97 percent of the copper from the solution within four
hours. However, the drinking water standard of 1.3 ppm for copper was achieved within
four hours.
Figure 8: Kinetics experiment with 20 ppm copper solution using ten grams iron-coated
limestone

27
The effect of limestone on removal rate was also studied using batch tests. Batch
tests are typically done with varying amounts of limestone (5, 10, 20, 50 and 100 grams)
with a fixed contact time of four hours since maximum removal rate is achieved within
four hours.
Table 5 shows the batch experiment with an initial concentration of 20 ppm
copper solution on iron-coated limestone. Figure 9 shows the batch experiment with an
initial concentration of 20 ppm copper solution on iron-coated limestone.
Table 5: Batch test with 20 ppm copper solution using iron-coated limestone
Weight of iron-coated
limestone (grams)
Copper concentration
(ppm) at 324.7 nm
(±0.015 ppm)
Copper concentration
(ppm) at 327.3 nm
(±0.015 ppm)
0 20.00 20.00
5 0.195 0.177
10 0.373 0.357
10 0.363 0.355
20 0.026 0.011
50 0.028 0.016
100 0.045 0.033

28
Figure 9: Batch experiment with 20 ppm copper solution using iron-coated limestone
In Figure 9, the X-axis represents the amount of limestone (grams) and the Y-axis
represents the residual concentration of the copper metal after treatment with iron-coated
limestone. The two series represent the concentrations of copper at wavelengths 324.7 nm
and 327.3 nm. An amount of 20 grams of iron-coated limestone could effectively remove
99.8 percent of the copper from the solution within four hours. The concentration of
copper was found to be 0.02617 ppm after treatment with 20 grams of iron-coated
limestone. However, the drinking water standard of 1.3 ppm for copper was achieved
with five grams of iron-coated limestone.

29
Table 6 shows the batch experiment with an initial concentration of 40 ppm
copper solution on iron-coated limestone. Figure 10 shows the batch experiment with an
initial concentration of 40 ppm copper solution on iron-coated limestone.
Table 6: Batch experiment with 40 ppm copper solution using iron-coated limestone
Weight of iron-coated
limestone (grams)
Copper concentration (ppm)
at 324.7 nm (± 0.015 ppm)
Copper concentration (ppm)
at 327.3 nm (± 0.015 ppm)
0 40.00 40.00
5 0.174 0.198
10 1.765 1.762
10 1.065 1.079
20 0.674 0.696
50 0.275 0.282

30
Figure 10: Batch experiment with 40 ppm copper solution using iron-coated limestone
In Figure 10, the X-axis represents the amount of limestone (grams) and the
Y-axis represents the residual concentration of the copper metal after treatment with
iron-coated limestone. The two series represent the concentrations of copper at
wavelengths 324.7 nm and 327.3 nm. An amount of 20 grams of iron-coated limestone
could effectively remove 99.3 percent of the copper from the solution within four hours.
The concentration of copper was found to be 0.6744 ppm after treatment with 20 grams
of iron-coated limestone. However, the drinking water standard of 1.3 ppm for copper
was achieved with five grams of iron-coated limestone.
31
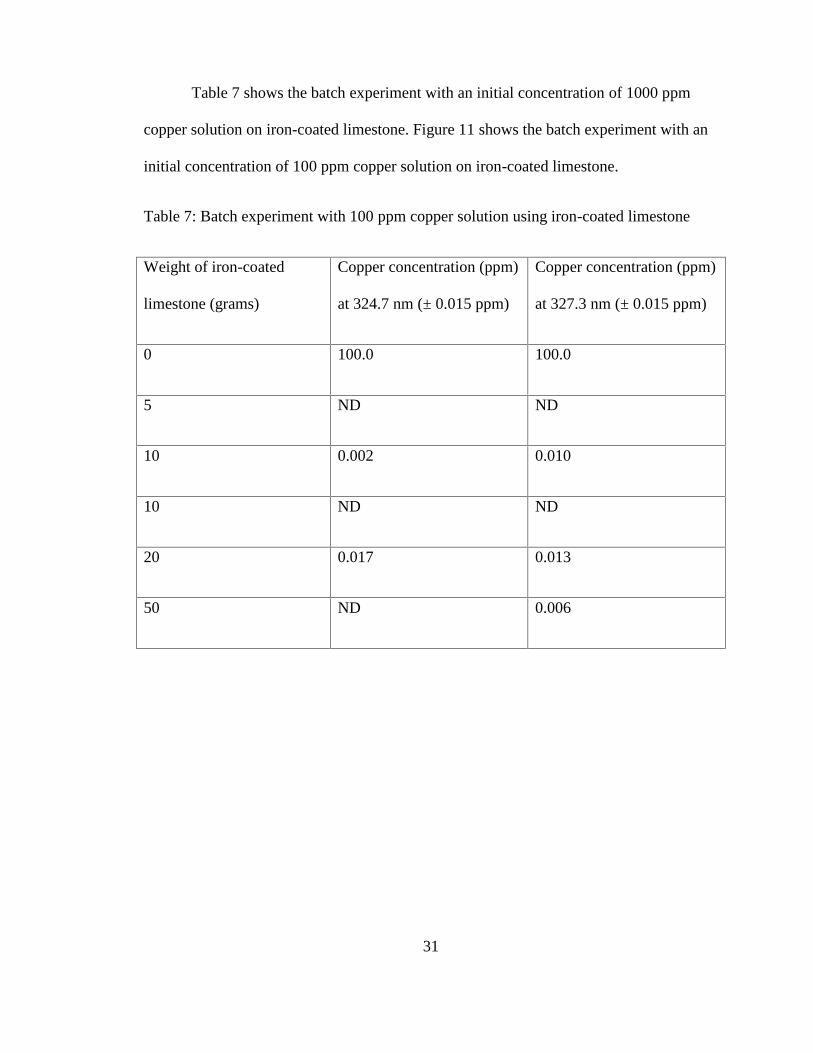
Table 7 shows the batch experiment with an initial concentration of 1000 ppm
copper solution on iron-coated limestone. Figure 11 shows the batch experiment with an
initial concentration of 100 ppm copper solution on iron-coated limestone.
Table 7: Batch experiment with 100 ppm copper solution using iron-coated limestone
Weight of iron-coated
limestone (grams)
Copper concentration (ppm)
at 324.7 nm (± 0.015 ppm)
Copper concentration (ppm)
at 327.3 nm (± 0.015 ppm)
0 100.0 100.0
5 ND ND
10 0.002 0.010
10 ND ND
20 0.017 0.013
50 ND 0.006

32
Figure 11: Batch experiment with 100 ppm copper solution using iron-coated limestone
Figure 11 shows the batch experiment with an initial concentration of 100 ppm
copper solution on iron-coated limestone. The X-axis represents the amount of limestone
(grams) and the Y-axis represents the residual concentration of the copper metal after
treatment with iron-coated limestone. The two series represent the concentrations of
copper at wavelengths 324.7 nm and 327.3 nm. An amount of five grams of iron-coated
limestone could effectively remove 100 percent of the copper from the solution within
four hours. The concentration of copper was found below the detection limits after
treatment with five grams of iron coated limestone. However, the drinking water standard
of 1.3 ppm for copper was achieved with five grams of iron-coated limestone.

33
The effect of pH on removal efficiency was studied for copper solution at
different pH values 5, 6, 7, 8 and 9. The desired pH was adjusted using smaller amounts
of 1M sodium hydroxide solution.
Table 8 shows the data for effect of pH on removal efficiency for copper solution
using iron-coated limestone. Figure 12 shows the effect of pH on removal efficiency for
copper solution using iron-coated limestone.
Table 8: Effect of pH using ten grams iron-coated limestone with 40 ppm copper solution
Initial pH (± 0.1) Percentage removal
measured at 324.7 nm
(±2%)
Percentage removal
measured at 327.3 nm
(±2%)
5 99 99
6 100 100
7 100 100
8 98 98
9 99 99

34
Figure 12: Effect of pH using ten grams iron-coated limestone with 40 ppm copper
solution
In Figure 12, the X-axis represents initial pH of copper solution before treatment
with iron-coated limestone and the Y-axis represents the percentage of copper removed
after treatment with iron-coated limestone. The two series represent the percentage of
copper removed at wavelengths 324.7 nm and 327.3 nm. At pH 7 copper was completely
removed from the solution, i.e., 100 percent removal efficiency was achieved. The
concentration of copper was below the detection limits at pH value of 7 for an initial
concentration of 40 ppm copper solution using iron-coated limestone. Since the removal
efficiency did not vary with pH the removal efficiency is insensitive to pH.

35
The calibration data for aluminum after the analysis on ICP-ES is shown in Table
9 and Figure13.
Table 9: Calibration data for aluminum
Aluminum concentration
(ppm)
Signal intensity (308.2 nm) Signal intensity (309.2 nm)
0 273.6 ND
0.25 595.1 ND
0.5 1277 1252
1 2348 3630
2.5 5651 10940
5 11110 23030
7.5 16650 35370
10 22150 47560

36
Figure 13: Calibration curve for aluminum
Figure 13 shows calibration curve for aluminum. The graph is plotted for
concentration on X-axis and signal intensity on Y-axis. Calibration is done at different
concentrations (0.5 ppm, 1 ppm, 2.5 ppm, 5 ppm, 7.5 ppm, and10 ppm) of aluminum
standard solution. The wavelengths used for aluminum analysis are 308.2 nm and
309.2 nm. The calibration curves have good correlation values of 0.999 at both
wavelengths.

37
Table 10 shows the data for kinetics experiment with an initial concentration of 2
ppm aluminum solution with uncoated limestone. Figure 14 shows the kinetics
experiment with an initial concentration of 2 ppm aluminum solution with uncoated
limestone.
Table 10: Kinetics Experiment with 2 ppm aluminum solution using ten grams uncoated
limestone
Time (hours) Aluminum concentration
(ppm) at 308.2 nm
(±0.015 ppm)
Aluminum concentration
(ppm) at 309.2 nm
(±0.015 ppm)
0 ND 0.003
0.25 0.290 0.260
0.5 0.617 0.580
1 0.572 0.535
1.5 0.651 0.619
2 0.595 0.564
4 0.627 0.592
10 0.383 0.349
24 0.525 0.486

38
Figure 14: Kinetics experiment with 2 ppm aluminum solution using ten grams uncoated
limestone
In Figure 14, the X-axis represents the time in hours and the Y-axis represents the
residual concentration of the aluminum metal after treatment with uncoated limestone.
The two series represent the concentrations of aluminum measured at wavelengths
308.2 nm and 309.2 nm. Maximum removal is achieved within fifteen minutes. An
amount of only ten grams of iron-coated limestone could remove 85.4 percent of the
aluminum from the solution within fifteen minutes. However, the drinking water standard
of 0.2 ppm for aluminum was achieved within thirty minutes using uncoated limestone.

39
Table 11 shows the data for kinetics experiment with an initial concentration of 2
ppm aluminum solution with iron-coated limestone. Figure 15 shows the kinetics
experiment with an initial concentration of 2 ppm aluminum solution with iron-coated
limestone.
Table 11: Kinetics experiment with 2 ppm aluminum solution using ten grams
iron-coated limestone
Time (hours) Aluminum concentration
(ppm) at 308.2 nm
(±0.015 ppm)
Aluminum concentration
(ppm) at 309.2 nm
(±0.015 ppm)
0 2.000 2.000
0.25 0.062 0.032
0.5 0.012 ND
1 0.004 ND
1.5 0.010 ND
2 0.031 0.002
4 0.046 0.013
10 0.049 0.019
24 0.045 0.018

40
Figure 15: Kinetics Experiment with 2 ppm aluminum solution using ten grams
iron-coated limestone
Figure 15 shows the kinetics experiment with an initial concentration of 2 ppm
aluminum solution on iron-coated limestone. The X-axis represents the time in hours and
the Y-axis represents the residual concentration of the aluminum metal after treatment
with iron-coated limestone. The two series represent the concentrations of aluminum
measured at wavelengths 308.2 nm and 309.2 nm. Maximum removal is achieved within
one hour. An amount of only ten grams of iron-coated limestone could remove
99.8 percent of the aluminum from the solution within one hour. Iron-coated limestone
could more effectively remove aluminum than uncoated limestone. Hence iron-coated
limestone is used in further experiments for aluminum removal. However, the drinking
water standard of 0.2 ppm for aluminum was achieved within fifteen minutes using
iron-coated limestone.

41
Table 12 shows data for batch experiment with an initial concentration of 2 ppm
aluminum solution on iron-coated limestone. Figure 16 shows the batch experiment with
an initial concentration of 2 ppm aluminum solution on iron-coated limestone.
Table 12: Batch experiment with 2 ppm aluminum solution using iron-coated limestone
Weight of iron-coated
limestone (grams)
Aluminum concentration
(ppm) at 308.2 nm
(±0.015 ppm)
Aluminum concentration
(ppm) at 309.2 nm
(±0.015 ppm)
5 0.023 0.003
10 0.018 0.012
10 0.019 0.023
20 0.019 0.031
50 0.010 0.026
100 0.012 0.031

42
Figure 16: Batch experiment with 2 ppm aluminum solution using iron-coated limestone
In Figure 16, the X-axis represents the amount of limestone (grams) and the
Y-axis represents the residual concentration of the aluminum metal after treatment with
iron-coated limestone. The two series represent the concentrations of aluminum at
wavelengths 308.2 nm and 309.2 nm. An amount of 50 grams of iron-coated limestone
could effectively remove 99.5 percent of the aluminum from the solution within one
hour. The concentration of aluminum was found to be 0.009531 ppm after treatment with
50 grams of iron coated limestone. However, the drinking water standard of 0.2 ppm for
aluminum was achieved with five grams of iron-coated limestone.

43
Table 13 shows data for batch experiment with an initial concentration of 4 ppm
aluminum solution on iron-coated limestone. Figure 17 shows the batch experiment with
an initial concentration of 4 ppm aluminum solution on iron-coated limestone.
Table 13: Batch experiment with 4 ppm aluminum solution using iron-coated limestone
Weight of iron-coated
limestone (grams)
Aluminum concentration
(ppm) at 308.2 nm
(±0.015 ppm)
Aluminum concentration
(ppm) at 309.2 nm
(±0.015 ppm)
5 0.041 0.086
10 0.011 0.066
10 0.007 0.055
20 0.005 0.061
50 ND 0.049
100 ND 0.053

44
Figure 17: Batch experiment with 4 ppm aluminum solution using iron-coated limestone
Figure 17 shows the batch experiment with an initial concentration of 4 ppm
aluminum solution on iron-coated limestone. The X-axis represents the amount of
limestone (grams) and the Y-axis represents the residual concentration of the aluminum
metal after treatment with iron-coated limestone. The two series represent the
concentrations of aluminum at wavelengths 308.2 nm and 309.2 nm. An amount of
50 grams of iron-coated limestone could effectively remove 100 percent of the aluminum
from the solution within one hour. The concentration of aluminum was below the
detection limits after treatment with 50 grams of iron coated limestone. However, the
drinking water standard of 0.2 ppm for aluminum was achieved with five grams of
iron-coated limestone.

45
Table 14 shows data for batch experiment with an initial concentration of 10 ppm
aluminum solution on iron-coated limestone. Figure 17 shows the batch experiment with
an initial concentration of 10 ppm aluminum solution on iron-coated limestone.
Table 14: Batch experiment with 10 ppm aluminum solution using iron-coated limestone
Weight of iron-coated
limestone (grams)
Aluminum concentration
(ppm) at 308.2 nm
(±0.015 ppm)
Aluminum concentration
(ppm) at 309.2 nm
(±0.015 ppm)
5 0.037 0.103
10 0.006 0.078
10 0.049 0.012
20 ND 0.057
50 ND 0.059
100 ND 0.064

46
Figure 18: Batch experiment with 10 ppm aluminum solution using iron-coated limestone
Figure 18 shows the batch experiment with an initial concentration of 10 ppm
aluminum solution on iron-coated limestone. The X-axis represents the amount of
limestone (grams) and the Y-axis represents the residual concentration of the aluminum
metal after treatment with iron-coated limestone. The two series represent the
concentrations of aluminum at wavelengths 308.2 nm and 309.2 nm. An amount of
20 grams of iron-coated limestone effectively removes 100 percent of the aluminum from
the solution within one hour. The concentration of aluminum was below the detection
limits after treatment with 20 grams of iron-coated limestone. However, the drinking
water standard of 0.2 ppm for aluminum was achieved with five grams of iron-coated
limestone.

47
Table 15 shows the experimental data obtained for effect of pH using 4 ppm
aluminum solution with ten grams of iron-coated limestone. Figure 19 shows the effect of
pH on removal efficiency for aluminum solution using iron-coated limestone
Table 15: Effect of pH using 4 ppm aluminum solution with ten grams iron-coated
limestone
Initial pH (±0.1) Percentage aluminum
removal measured at
308.2 nm (±3 %)
Percentage aluminum
removal measured at
309.2 nm (±3 %)
5 96 94
6 86 85
7 98 97
8 93 91
9 94 94

48
Figure 19: Effect of pH using 4 ppm aluminum solution with ten grams iron-coated
limestone
Figure 19 shows the effect of pH on removal rate for aluminum solution using
iron-coated limestone. The X-axis represents initial pH of aluminum solution before
treatment with iron-coated limestone and the Y-axis represents the percentage of
aluminum removed after treatment with iron-coated limestone. The two series represent
the percentage of aluminum removed at wavelengths 308.2 nm and 309.2 nm. At pH 7,
aluminum had a removed to maximum extent of 98.41 percent. The concentration of
aluminum was found to be 0.06327 ppm at a pH value of 7 for an initial concentration of
4 ppm aluminum solution using iron-coated limestone. The removal efficiency did not
vary much with pH change. Hence, removal mechanism is generally independent of pH.
49
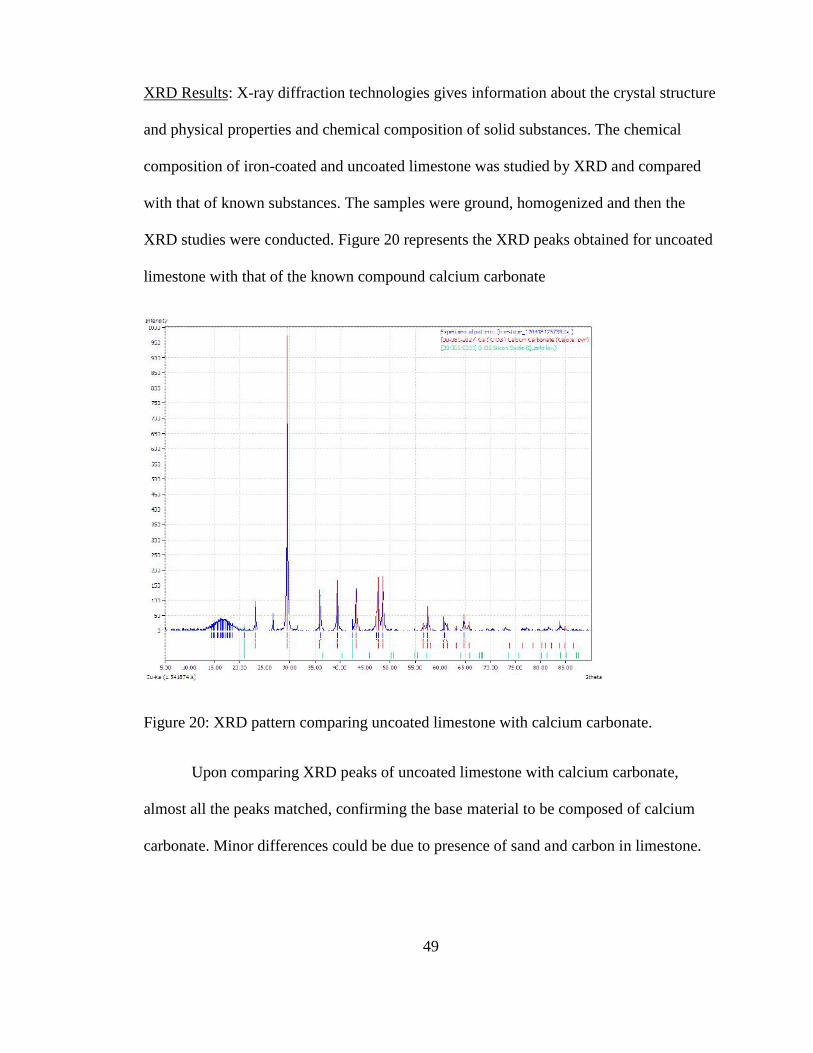
XRD Results: X-ray diffraction technologies gives information about the crystal structure
and physical properties and chemical composition of solid substances. The chemical
composition of iron-coated and uncoated limestone was studied by XRD and compared
with that of known substances. The samples were ground, homogenized and then the
XRD studies were conducted. Figure 20 represents the XRD peaks obtained for uncoated
limestone with that of the known compound calcium carbonate
Figure 20: XRD pattern comparing uncoated limestone with calcium carbonate.
Upon comparing XRD peaks of uncoated limestone with calcium carbonate,
almost all the peaks matched, confirming the base material to be composed of calcium
carbonate. Minor differences could be due to presence of sand and carbon in limestone.

50
Figure 21 shows the XRD pattern of iron-coated limestone and uncoated
limestone. The two peaks looks similar except for few differences which is attributed to
the deposition of iron hydroxide on iron-coated limestone.
Figure 21: XRD pattern of uncoated limestone and iron-coated limestone
51
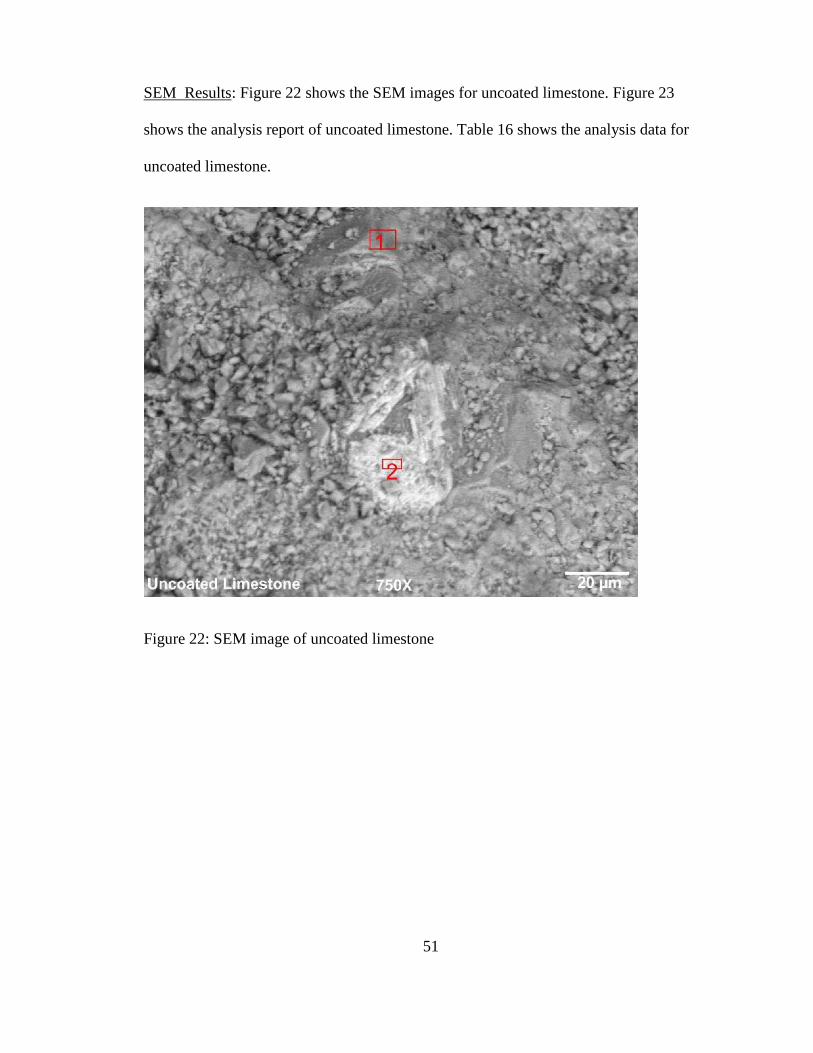
SEM Results: Figure 22 shows the SEM images for uncoated limestone. Figure 23
shows the analysis report of uncoated limestone. Table 16 shows the analysis data for
uncoated limestone.
Figure 22: SEM image of uncoated limestone

52
Figure 23: SEM analysis report for uncoated limestone

53
Table 16: SEM analysis data for uncoated limestone
Location-1 Location-2
Element Atomic % Concentration
Wt %
Atomic % Concentration
Wt %
C 5.07 3.03 9.88 5.71
O 66.35 52.80 66.43 51.13
Si 21.47 30.00 4.38 5.92
Ca 7.11 14.18 19.31 37.24
Total 100.00 100.00 100.00 100.00
The SEM image of the uncoated limestone indicates that it has calcium carbonate
and small amounts of silicon and sand (SiO2).
54
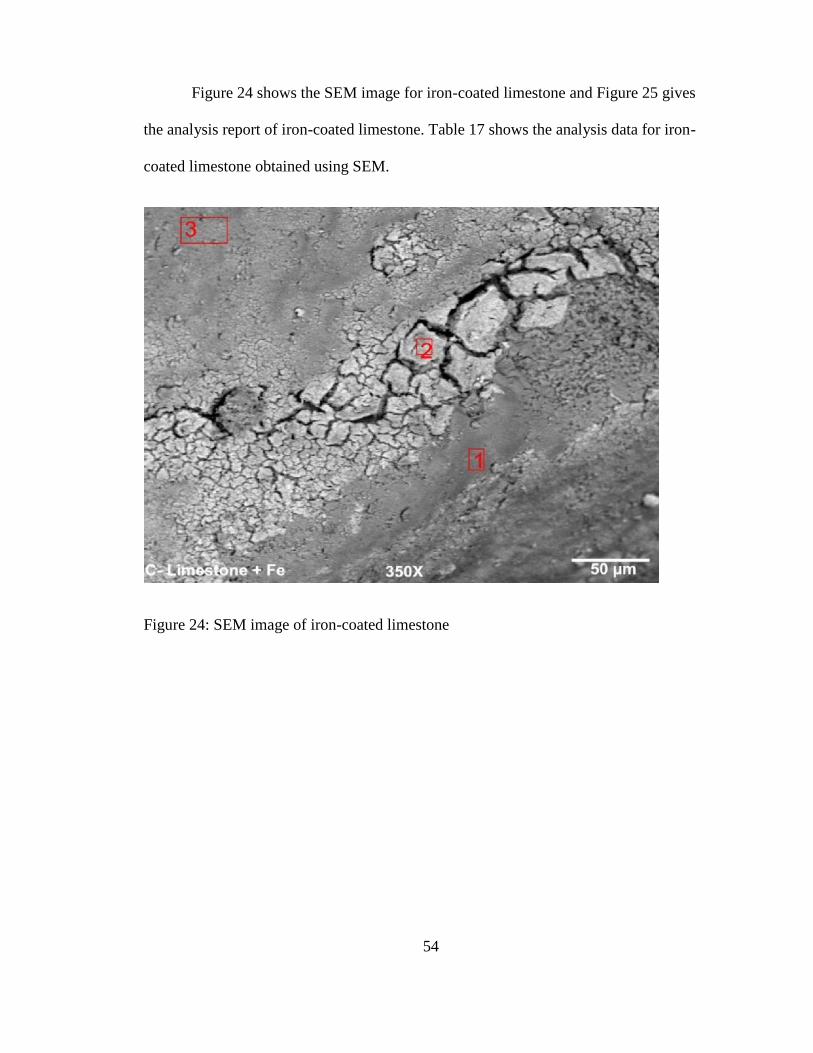
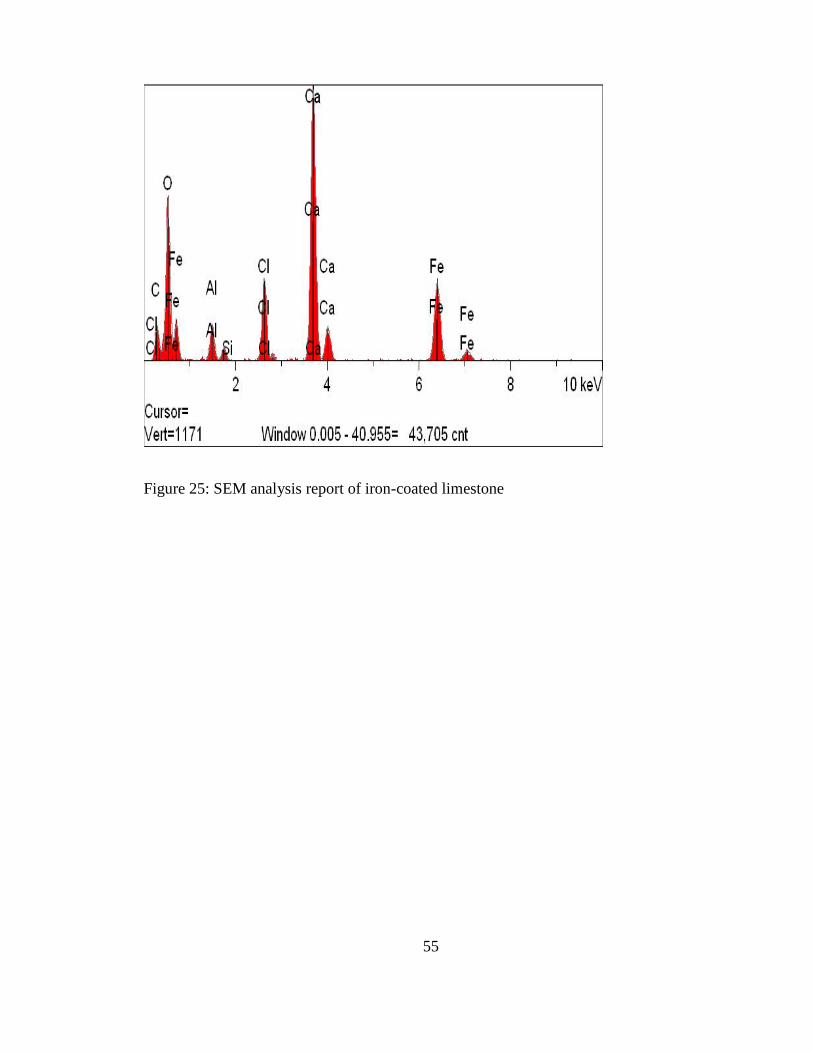
Figure 24 shows the SEM image for iron-coated limestone and Figure 25 gives
the analysis report of iron-coated limestone. Table 17 shows the analysis data for iron-
coated limestone obtained using SEM.
Figure 24: SEM image of iron-coated limestone
55
Figure 25: SEM analysis report of iron-coated limestone
56
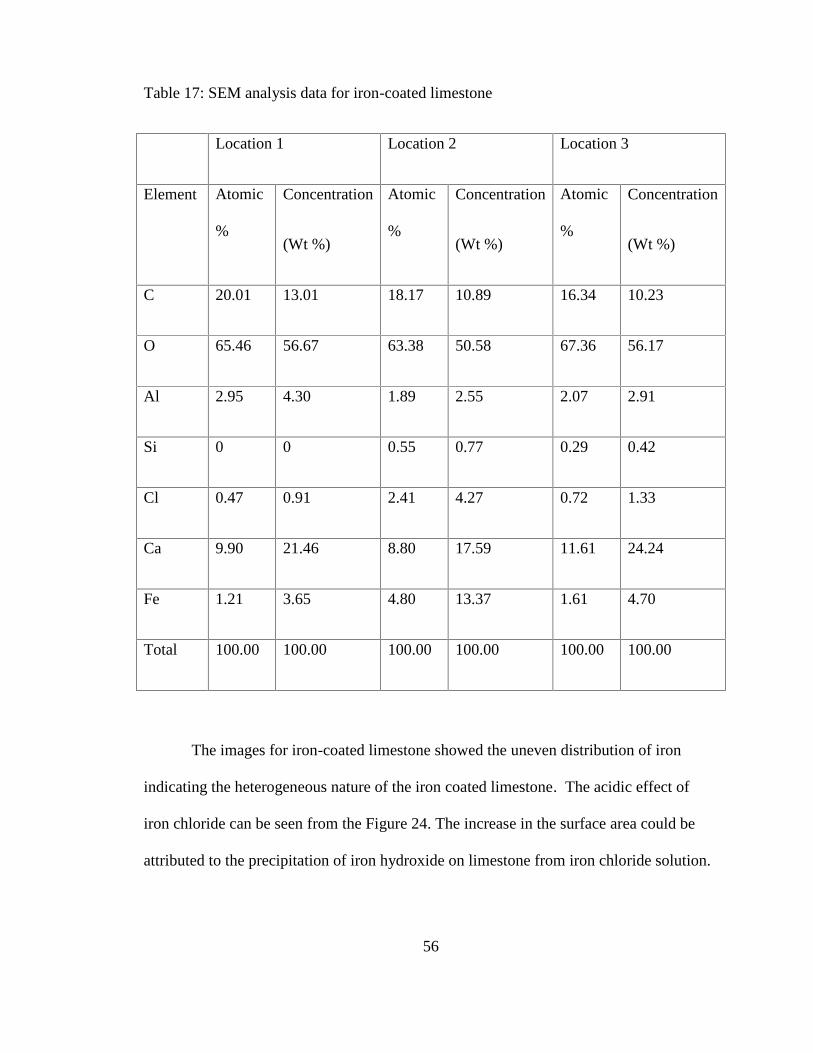
Table 17: SEM analysis data for iron-coated limestone
Location 1 Location 2 Location 3
Element Atomic
%
Concentration
(Wt %)
Atomic
%
Concentration
(Wt %)
Atomic
%
Concentration
(Wt %)
C 20.01 13.01 18.17 10.89 16.34 10.23
O 65.46 56.67 63.38 50.58 67.36 56.17
Al 2.95 4.30 1.89 2.55 2.07 2.91
Si 0 0 0.55 0.77 0.29 0.42
Cl 0.47 0.91 2.41 4.27 0.72 1.33
Ca 9.90 21.46 8.80 17.59 11.61 24.24
Fe 1.21 3.65 4.80 13.37 1.61 4.70
Total 100.00 100.00 100.00 100.00 100.00 100.00
The images for iron-coated limestone showed the uneven distribution of iron
indicating the heterogeneous nature of the iron coated limestone. The acidic effect of
iron chloride can be seen from the Figure 24. The increase in the surface area could be
attributed to the precipitation of iron hydroxide on limestone from iron chloride solution.

57
Figure 26 shows SEM image of iron-coated limestone after treatment with
10 ppm aluminum solution. Figure 27 gives the analysis report of iron-coated limestone
after treatment with 10 ppm aluminum solution. Table 18 shows the data for iron-coated
limestone after treatment with 10 ppm aluminum.
Figure 26: SEM image of iron-coated limestone after treatment with 10 ppm aluminum
solution

58
Figure 27: SEM analysis report for iron-coated limestone after treatment with 10 ppm
aluminum solution

59
Table 18: SEM analysis data for iron- coated limestone after treatment with 10 ppm
aluminum solution
Location-1 Location-2 Location-3
Element Atomic
%
Concentration
(Wt %)
Atomic
%
Concentration
(Wt %)
Atomic
%
Concentration
(Wt %)
C 12.61 5.94 10.06 5.64 13.23 8.06
O 69.22 50.93 65.47 48.89 68.99 55.97
Al 1.04 1.21 0.6 0.75 0.3 0.41
Si 0.43 0.31 0.13 0.17 0.52 0.74
Ca 15.15 0.61 23.46 43.89 16.53 33.59
Fe 1.55 33.63 0.21 0.56 0.44 1.24
Total 100.00 100.00 100.00 100.00 100.00 100.00
Limestone treated with aluminum showed the presence of the aluminum on the
surface while confirming its removal.

60
Figure 28 shows SEM image of iron-coated limestone after treatment with
100 ppm copper solution. Figure 29 gives the analysis report of iron-coated limestone
after treatment with 100 ppm copper solution. Table 18 shows the data for iron-coated
limestone after treatment with 100 ppm copper.
Figure 28: SEM analysis image for iron-coated limestone after treatment with 100 ppm
copper solution

61
Figure 29: SEM analysis report for iron-coated limestone after treatment with 100 ppm
copper solution

62
Table 19: SEM analysis data for iron- coated limestone after treatment with 100 ppm
copper solution
Location 1 Location 2
Element Atomic % Concentration
(Wt %)
Atomic % Concentration
(Wt %)
C 10.25 6.04 12.99 7.80
O 72.38 56.88 68.78 55.02
Si 0.54 0.75 ND ND
Cl 0.22 0.38 ND ND
Ca 12.80 25.19 17.54 38.15
Fe 3.11 8.52 0.41 1.14
Cu 0.72 2.24 0.28 0.9
Total 100.00 100.00 100.00 100.00
Limestone treated with copper showed the presence of the copper on the surface
while confirming its removal.

63
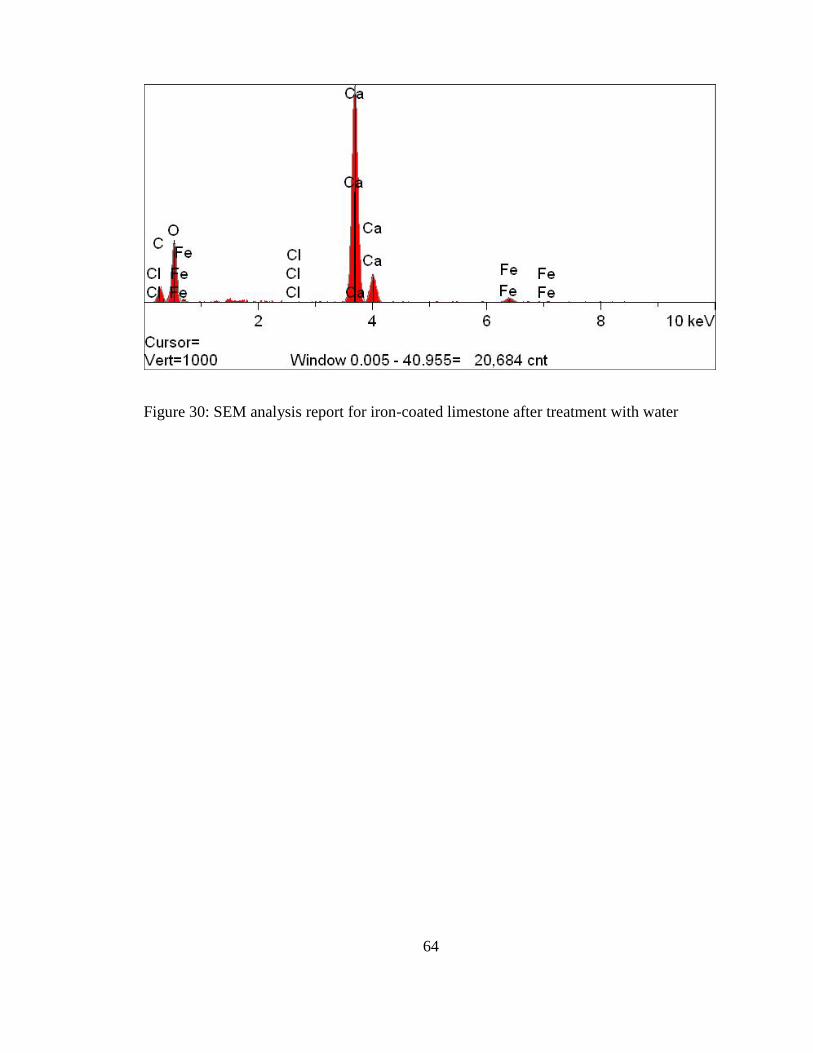
Figure 30 shows SEM image of iron-coated limestone after treatment with water.
Figure 31 gives the analysis report of iron-coated limestone after treatment water for four
hours. Table 18 shows the data for iron-coated limestone after treatment with water.
Figure 29: SEM image for iron-coated limestone after treatment with water
64
Figure 30: SEM analysis report for iron-coated limestone after treatment with water

65
Table 20: SEM analysis data for iron-coated limestone after treatment with water
Location 1 Location 2
Element Atomic % Concentration
(Wt. %)
Atomic % Concentration
(Wt. %)
C 12.12 7.47 13.40 8.26
O 71.82 58.96 71.44 58.66
Cl 0.03 0.05 0.07 0.13
Ca 15.33 31.53 12.09 28.46
Fe 0.7 2.00 2.65 7.58
Si ND ND 0.36 0.51
Total 100.00 100.00 100.00 100.00
The results from SEM indicate that there are no significant changes with exposure
to water.

66
IV. Conclusions
Heavy metal contamination has been a serious problem throughout the world
because of the hazardous effects on the health of humans. Even though there are well
established techniques for the heavy metal removal from drinking water, their usage can
be limited by cost. Hence, there exists a need to develop a method for heavy metal
removal from drinking water which is cost effective, efficient and eco-friendly. We
propose a novel method of using limestone to remove heavy metals from drinking water.
The U.S. EPA has set the drinking water standards for copper and aluminum as 1.3 ppm
and 0.2 ppm, respectively. This research is primarily focused on reducing heavy metal
levels to below the drinking water standards set by U.S. EPA.
Both uncoated and iron coated limestone are used for heavy metal removal. The
time required for the removal of heavy metal was determined by kinetic studies.
Uncoated limestone using a sample size of ten grams could remove 97 percent of copper
from a solution with an initial concentration of 20 ppm within four hours. Kinetics
studies were also done with iron-coated limestone. The removal efficiency was found to
be 97 percent for copper solution with an initial concentration of 20 ppm. The removal
rate of 97 percent was also achieved within four hours. For copper, both iron-coated
limestone and uncoated limestone removed the metal nearly to the same extent when the
contact time was four hours. However, the removal rate did not remain the same at other
contact times. Iron-coated limestone was more efficient for short time intervals for
copper. Further experiments with copper were solely conducted with iron-coated
limestone keeping the contact time for four hours.

67
Batch experiments for copper were conducted with iron-coated limestone. For a
20 ppm copper solution, an iron-coated limestone of 20 grams could remove 99.8 percent
of copper from the solution. For a 40 ppm copper solution with 20 grams of iron-coated
limestone 99.3 percent of copper was removed from the solution. For a 100 ppm copper
solution using iron-coated limestone of five grams could remove 100 percent of copper
from the solution. For the batch tests using iron coated limestone (5, 10, 20, 50 and
100 grams) for copper solutions of 20 ppm, 40 ppm, 100 ppm, drinking water standards
was achieved for all challenge concentrations. The pH studies indicated that copper was
completely removed from 40 ppm copper solution using iron coated limestone with a
contact time of four hours. The removal of copper is not sensitive to pH.
For aluminum, uncoated limestone with sample size of ten grams could remove
85.4 percent of aluminum from a solution with an initial concentration of 2 ppm within
fifteen minutes. Kinetics studies were also done with iron-coated limestone. The removal
efficiency was found to be 99.79 percent for aluminum solution with an initial
concentration of 2 ppm. The removal rate of 99.79 percent was achieved within one hour.
Iron-coated limestone was more efficient in comparison to uncoated limestone. Hence,
further experiments were solely conducted with iron-coated limestone for aluminum.
Batch experiments for aluminum were conducted with iron-coated limestone. For
a 2 ppm aluminum solution, an iron-coated limestone of 50 grams could remove
99.5 percent of aluminum from the solution. For a 4 ppm aluminum solution with
50 grams of iron-coated limestone, 100 percent of aluminum from the solution was
removed. For 10 ppm aluminum solution using iron-coated limestone of 20 grams could
remove 100 percent of aluminum from the solution. For the batch tests using iron coated
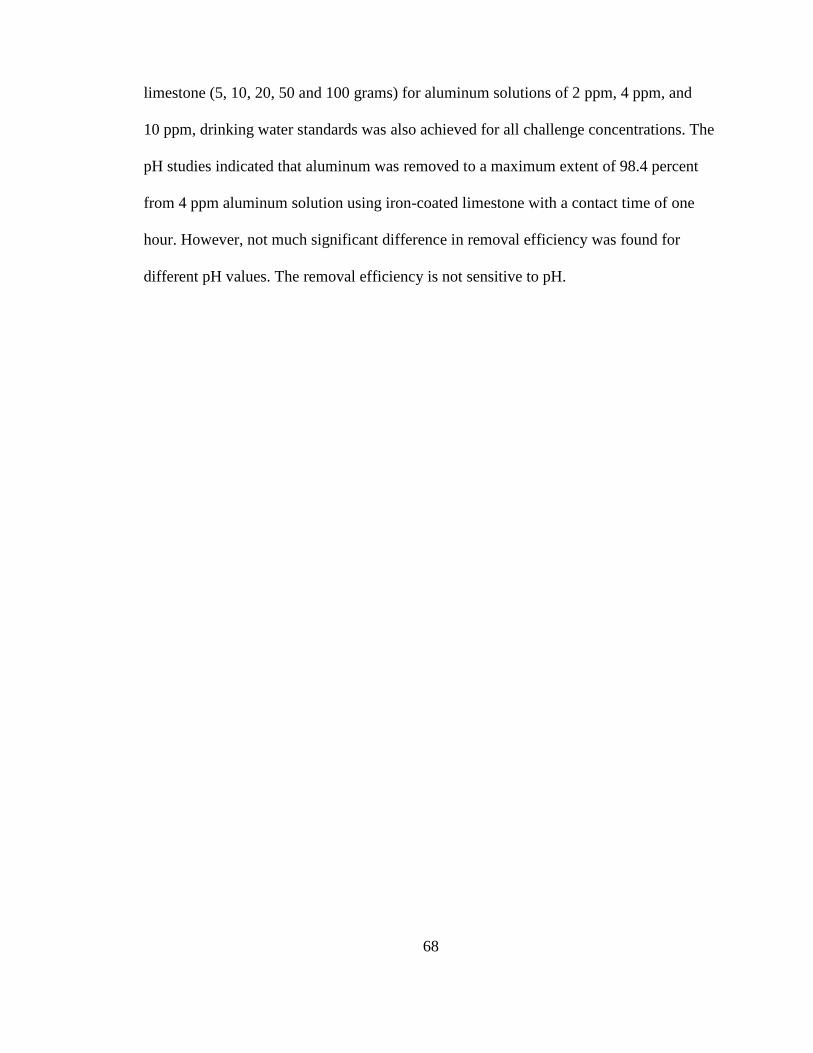
68
limestone (5, 10, 20, 50 and 100 grams) for aluminum solutions of 2 ppm, 4 ppm, and
10 ppm, drinking water standards was also achieved for all challenge concentrations. The
pH studies indicated that aluminum was removed to a maximum extent of 98.4 percent
from 4 ppm aluminum solution using iron-coated limestone with a contact time of one
hour. However, not much significant difference in removal efficiency was found for
different pH values. The removal efficiency is not sensitive to pH.

69
V. Future Work
The work can be extended for further investigations of other heavy metals which
poses risk to the health of humans. Application of the technique to real water samples
from different parts of the world is important. The method should be studied for a
mixture of two or more heavy metals in combination could be reduced by using
limestone. Further investigation of the kinetics is warranted.
The nature of limestone after the treatment with heavy metals like copper and
aluminum should also be studied to determine the mechanisms involved in the heavy
metal removal by limestone. Application of this technique to small and rural water
systems for heavy metal removal should be a long term goal.

70
VI. Perspective
Drinking water is contaminated with several pollutants that affect the health of
humans. Heavy metals are one of the type of pollutants that cause severe health problems.
We thought of reducing these heavy metals in drinking water to those levels where they
are not harmful.
In our proposed method we use limestone to reduce the heavy metal content.
Water with heavy metals was taken and kept in contact with limestone for a certain
period of time. The amount of heavy metals after contact with limestone were found to be
reduced to safe levels. The treated limestone can be easily disposed off without causing
any harm to the environment. The treated limestone is mixed with concrete and disposed
of. This method is affordable and easily available.

71
BIBLIOGRAPHY
Agarwal, K.; Sharma, A.; and Talukder, G. Clastogenic effects of copper sulphate
on the bone marrow chromosomes of mice in vivo. Mutation Research, 1993,
243, 1–6.
ATSDR.Toxicological profile for aluminium. US Department of Health and
Human Services, Public Health Service, Agency for Toxic Substances and
Disease Registry.
Aziz, H. A.; Adlan, M. N.; Hui, C. S.; Zahari, M. S. M.; and Hameed, B. H.
Removal of Ni, Cd, Pb, Zn and colour from aqueous solution using potential low
cost absorbent. Indian J. Eng. Mater. Sci. 2005, 12, 248-258.
Chuttani, H. K. Acute copper sulfate poisoning. American Journal of Medicine,
1965, 39, 849–854.
Cuppett, J. D.; Duncan, S. E.; and Dietrich, A. M. Evaluation of Copper
Speciation and Water Quality Factors That Affect Aqueous Copper Tasting
Response. Chem. Senses. 2006, 31(7), 689-697.
Ferguson, M. A.; Fernandez, D. P.; and Hering, J. G. Lowering the Detection
Limit for Arsenic: Implications for a Future Practical Quantitation Limit. J.
American Water Works Association. 2007, 99, 92-98.
Flegler, S. L.; Heehman, J. W.; and Klomparens, K. L. Scanning and
Transmission Electron Micoscopy An Introduction.

72
Hossain, M. A;, Sengupta, M. K.; Ahamed, S.; Rahman, M. M.; Mondal, D.;
Lodh, D.; Das, B.; Nayak, B.; Roy, B.; Mukherjee, A.; and Chakraborti, D.
Environ. Sci. Technol. 2005, 39, 4300-4306.
Islam, M. T.; Islam, S. A.; and Latif, S. A. Detection of Arsenic in Water, Herbal
and Soil Samples by Neutron Activation Analysis Technique. Bulletin of
Environmental Contamination and Toxicology. 2007, 79, 327-330.
ISO (1996) Water quality — Determination of 33 elements by inductively
coupled plasma atomic emission spectroscopy. Geneva, International
Organization for Standardization (ISO11885:1996 (E)).
Joseph, D. A.; Bernard, T. N.; John, R. N.; Kenneth, P.C.; Gilpin, R. R.; Dalsu.
B.; Laura. H.; Margaret, K.; Williams, B.; Debra, T. S.; and Jay, H. L. Environ.
Sci. Technol. 2006, 40, 3578-3585.
Kim, M. J.; Nriagu, J.; and Haack, S. Carbonate Ions and Arsenic Dissolution by
Ground Water. J. Environ. Sci. Technol. 2000, 34, 3094-3100.
Landner, L.; and Lindestrom, L.; Copper in society and in the environment. 1999.
Lee, M.; Cho, K.; Shah, A. P.; and Biswas, P. Nanostructured sorbents for capture
of cadmium species in combustion environments. Environ. Sci. Technol. 2005, 39,
8481-8489.
Linder, M. C.; and Hazegh-Azam, M. Copper biochemistry and molecular
biology. American Journal of Clinical Nutrition, 1996, 63,797S–811S.

73
Luza, S. C.; and Speisky, H. C. Liver copper storage and transport during
development: implications for cytotoxicity. American Journal of Clinical
Nutrition, 1996, 63, 812S–820S.
Mina, K.; Hyun-Ju, U.; Sunbaek, B;, Sang-Hee, L.; Suk-Jung, O.; Ji-Hye, H.;
Kyoung-Woong, K.; Jiho, M.; and Yang-Hoon, K. Arsenic Removal from
Vietnamese Groundwater Using the Arsenic-Binding DNA Aptamer. Environ.
Sci. Technol. 2009, 43, 9335-9340.
Nurul, A.; Satoshi, K.; Taichi, K.; Aleya, B.; Hideyuki, K.; Tohru, S.; and
Kiyohisa, O. Removal of Arsenic in Aqueous Solutions by Adsorption onto Waste
Rice Husk. Ind. Eng. Chem. Res. 2006, 45, 8105-8110.
Romero, F. M.; Armienta, M. A.; and Carrillo-Chavez, A. Arsenic sorption by
carbonate-rich aquifer material, a control on arsenic mobility at Zimapan, Mexico.
J. Arch. Enviorn. Contam. Toxicol. 2004, 47, 1-13.
Silva, A. M.; Cruz, F. L. S.; Lima, R. M. F.; Teixeira, M. C.; and Leao, V. A.
Manganese and limestone interactions during mine water treatment. J. of .
Hazardous Materials. 2010, 181, 514-520.
Skoog, Holler, and Nieman, Principles of Instrumental Analysis. 5th Edition,
1998, 230-250.
Sorlini, S.; Gialdini, F; and Stefan, M. Arsenic oxidation by UV radiation
combined with hydrogen peroxide. Water Sci Technol. 2010, 61, 339-44.

74
Stocker, J.; Balluch, D.; Monika, G.; Harms, H.; Feliciano, J.; Daunert, S.; Malik,
K. A.; and Meer, J. R. V. D. Development of a set of simple bacterial biosensors
for quantitative and rapid measurements of arsenite and arsenate in potable water.
Environ. Sci. Technol. 2003, 37, 4743-4750.
WHO (1997) Aluminium. Geneva, World Health Organization, International
Programme onChemical Safety (Environmental Health Criteria 194).
