concentration of heavy metals in drinking water … · concentration of heavy metals in drinking...
TRANSCRIPT

Received: 4th Feb-2014 Revised: 25th Feb-2014 Accepted: 27th Feb-2014 Research article
CONCENTRATION OF HEAVY METALS IN DRINKING WATER WITH EMPHASIS ON HUMAN HEALTH
J. Bala Chennaiaha,b*, M.A.Rasheedb and D.J.Patilb aChemical Department, Oil India Limited, Duliajan, Assam-786602.
bNational Geophysical Research Institute, (Council for Scientific and Industrial Research), Hyderabad - 500007.
*Corresponding author E-mail: [email protected]
ABSTRACT: The study was undertaken to assess the status of drinking water quality in the rural areas of the Bhongiri region, India. A total of 42 drinking water samples were collected from areas of the region, viz.: Ghatkesar, Pagidipalli, Bibinagar, and Bhongiri. All the samples were analysed for three physicochemical parameters Such as Conductivity, Total dissolved solids (TDS), pH and Twelve heavy metals (As, Cd, Co, Cu, Cr, Fe, Mn, Ni, Pb, V, Mo ,Zn ) and cations like (Na,K, Ca, mg)using standard procedures. The results were compared with other national and international standards. Among the analysed samples, regarding physicochemical parameters, 21% of the sample for hydrogen ion concentration (pH), 73.80 % of the sample for total dissolved solids (TDS) and 33% of the samples forelectrical conductivity (EC) concentrations higher than the WHO (2004) recommended values. All the Cations (Na, Mg, K, and Ca) concentrations exceeded the permissible limits of WHO and BIS. Regarding Heavy metals out of twelve Heavy metals six heavy metals (Cr, Fe, Mn, Ni, Pb, and Zn) concentrationsexceeded the WHO and BIS permissible limits, this could poses serious health diseases. It is recommended that potable water sources in the study area should be routinely monitored to ascertain its suitability for drinking and other purposes.
Key words: Water quality. ICP-MS.Drinking water.Heavy metals.
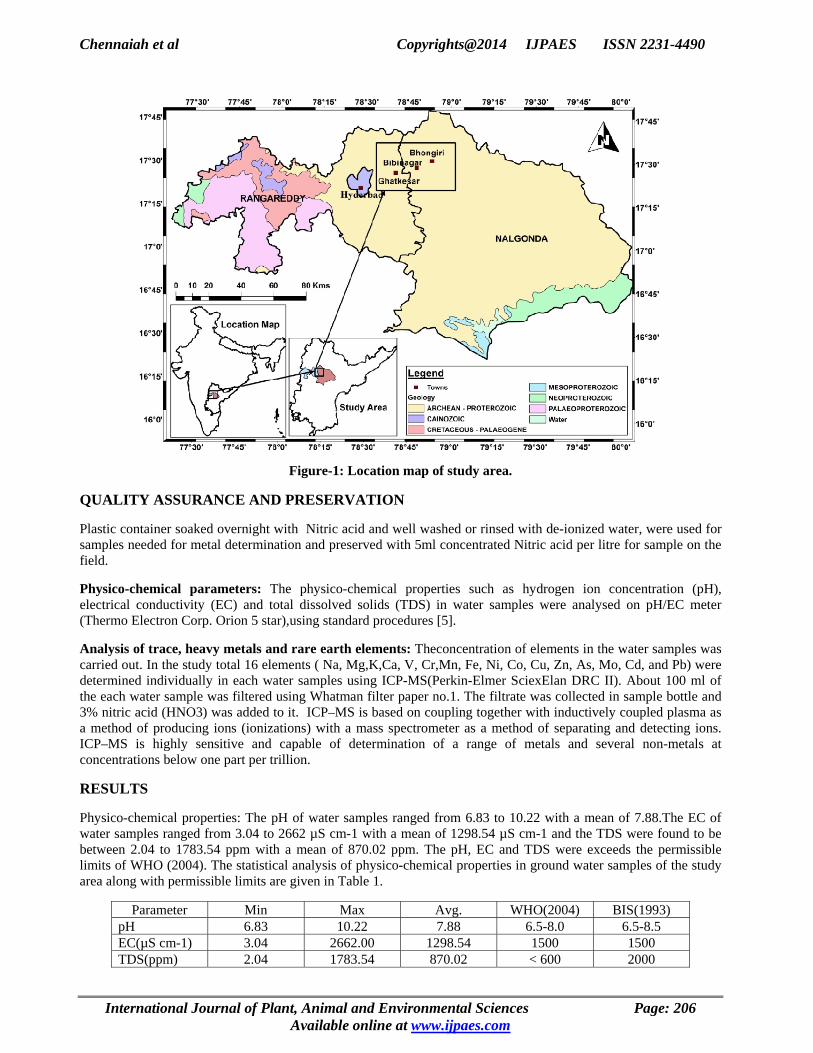
INTRODUCTION The aim of this study is to determine the relationship between the contaminant drinking water and its impact on human health in Bhongiri region, India. Heavy metals are sometimes called “trace elements”. They are the metallic elements of the periodic table. Heavy metals have become of particular interest in recent decades within the framework of environmental investigation. This has without doubt been due to the fact that highly sensitive analytical procedures are available for determining and detecting metal content with high precision. The contribution of the geology is to help isolate aspect environments that may influence the incidence of disease. The ultimate source of the body trace elements is generally rocks. The concentration of trace elements in rocks is varying by rock type. Sometimes, they become concentrated in soil, water, or in air taken up by plants and ingested by humans or animals.[1].Heavy metals are highly toxic and can cause damaging effects even at very low concentration. They are metallic elements which have a high atomic weight and density much greater than water [2].Body needs friendly trace element heavy metals, but there are another 12 poisonous heavy metals like Pb, Hg, As, Cd etc. act as inhibitor to the enzymatic metabolism of the body heavy metal overload is detrimental to the natural healing functions of the body system. Toxic heavy metals are taken into the body via inhalation, ingestion and skin absorption [3]. Contamination by heavy metal has received much attention with regard to accusation in soils and toxicity to the soil micro-organisms in common first row transition metals like Fe (111), Co (111), Cu (11) and Zn (11) has been found to inhibit microbial activities [4]. MATERIALS AND METHODS Sample Collection: The samples were collected at forty two (42) different locations in the study area and all the necessary preservative chemicals were added insitu. These sampling were done between the hours of 8.00am to 2.00 p.m.and in duplicates. The location map of sampling area is shown below figure.1
International Journal of Plant, Animal and Environmental Sciences Page: 205 Available online at www.ijpaes.com
Chennaiah et al Copyrights@2014 IJPAES ISSN 2231-4490
Figure-1: Location map of study area.
QUALITY ASSURANCE AND PRESERVATION
Plastic container soaked overnight with Nitric acid and well washed or rinsed with de-ionized water, were used for samples needed for metal determination and preserved with 5ml concentrated Nitric acid per litre for sample on the field.
Physico-chemical parameters: The physico-chemical properties such as hydrogen ion concentration (pH), electrical conductivity (EC) and total dissolved solids (TDS) in water samples were analysed on pH/EC meter (Thermo Electron Corp. Orion 5 star),using standard procedures [5].
Analysis of trace, heavy metals and rare earth elements: Theconcentration of elements in the water samples was carried out. In the study total 16 elements ( Na, Mg,K,Ca, V, Cr,Mn, Fe, Ni, Co, Cu, Zn, As, Mo, Cd, and Pb) were determined individually in each water samples using ICP-MS(Perkin-Elmer SciexElan DRC II). About 100 ml of the each water sample was filtered using Whatman filter paper no.1. The filtrate was collected in sample bottle and 3% nitric acid (HNO3) was added to it. ICP–MS is based on coupling together with inductively coupled plasma as a method of producing ions (ionizations) with a mass spectrometer as a method of separating and detecting ions. ICP–MS is highly sensitive and capable of determination of a range of metals and several non-metals at concentrations below one part per trillion.
RESULTS
Physico-chemical properties: The pH of water samples ranged from 6.83 to 10.22 with a mean of 7.88.The EC of water samples ranged from 3.04 to 2662 µS cm-1 with a mean of 1298.54 µS cm-1 and the TDS were found to be between 2.04 to 1783.54 ppm with a mean of 870.02 ppm. The pH, EC and TDS were exceeds the permissible limits of WHO (2004). The statistical analysis of physico-chemical properties in ground water samples of the study area along with permissible limits are given in Table 1.
Parameter Min Max Avg. WHO(2004) BIS(1993) pH 6.83 10.22 7.88 6.5-8.0 6.5-8.5 EC(µS cm-1) 3.04 2662.00 1298.54 1500 1500 TDS(ppm) 2.04 1783.54 870.02 < 600 2000
International Journal of Plant, Animal and Environmental Sciences Page: 206 Available online at www.ijpaes.com
Chennaiah et al Copyrights@2014 IJPAES ISSN 2231-4490
The concentration of trace elements & heavy metals (ppb) in ground water samples of the study area along with permissible limits are given in Table 2.
Element Min Max Avg. WHO(2004) BIS(1993) Na 31489.53 374220.71 151949.90 20000 NA Mg 1556.54 164019.22 40569.43 30000 30000 K 1714.65 32313.87 6471.46 10000 NA Ca 52116.15 476580.64 159634.83 75000 75000 V 4.68 38.56 9.25 NA 200 Cr 29.22 55.91 39.90 50 50 Mn 4.88 2046.17 147.52 100 100 Fe 185.80 1383.96 439.72 300 300 Co 0.32 2.79 0.96 NA NA Ni 5.08 39.24 13.44 20 3000 Cu 8.46 38.48 19.68 100 50 Zn 26.93 9903.0 1286.06 3000 5000 Cd 0.30 6.64 1.02 3 10 Mo 0.73 21.36 4.69 70 NA As 0.91 4.97 1.93 10 50 Pb 5.15 104.20 14.44 10 100
N.A: Not available, values in parentheses indicates percentage of samples exceed respective prescribed limits.
DISCUSSION
It is very important to identify the relationship between the presence of heavy metals in drinking water and the prevalence of renal failure, liver cirrhosis, hair loss, and chronic anaemia diseases. The prevalence of these diseases was markedly increases in the last few years due to air pollution, water pollution, and hazards over uses of pesticides in agriculture [1].Trace amounts of metals are common in water, and these are normally not harmful to our health. In fact, some metals are essential to sustain life. Calcium, magnesium, potassium, and sodium must be present for normal body functions and Cobalt, copper, iron, manganese, molybdenum, selenium, and zinc are needed at low levels as catalysts for enzyme activities. Na, Mg, K and Ca exceeds the permissible limits of both WHO (2004) and BIS(1993)in the study area.Drinking water containing high levels of these essential metals, or toxic metals such as arsenic, cadmium, chromium, lead, and molybdenum, may be hazardous to our health. Naturally occurring metals are dissolved in water when it comes into contact with rock or soil material. Other sources of metal contamination are corrosion of pipes and leakage from waste disposal sites [1]. One of the major symptoms of chemical toxicity seems to be a breakdown of the immune system, which opens the gateway for all kinds of diseases in the body. Also, another major symptom seems to be damage to the nervous system and increased nervousness. Toxic doses of chemicals cause either acute or chronic health effects. The levels of chemicals in drinking water, however, are seldom high enough to cause acute health effects. They are more likely to cause chronic health effects that occur long after exposure to small amounts ofa chemical. Examples of chronic health effects include cancer, birth defects, organ damage, disorders of the nervous system, and damage to the immune system [6].
(i)" Lead and Cadmium" and their impact on human health
The concentration of Pb in the drinking water samples ranged from 5.15 to 104.20 PPb with the mean of 14.4 PPb, the permissible limit of Pb is specified as 100 PPb by BIS (1993) and 10 PPb is specified byWHO (2004) for drinking water.33 % of the samples exceedsthepermissible limits of WHO (2004) .The high Lead concentrations were observed in Ghatkesar,Yamnampeta and Aushapur areas of the study area.Patients suffer from renal failure were related to contaminant drinking water mainly with lead and cadmium. Lead is a dangerous element, it is harmful even in small amounts. Lead enters the human body in many ways. It can be inhaled in dust from lead paints, or waste gases from leaded gasoline. Exposure to lead is cumulative over time. High concentrations of lead in the body can cause death or permanent damage to the central nervous system, the brain, and kidneys [7].This damage commonly results in behaviour and learning problems (such as hyperactivity), memory and concentration problems, high blood pressure, hearing problems, headaches, slowed growth, reproductive problems in men and women, digestive problems, muscle and joint pain.Theconcentration destribution map of Pb is shown in figure 2.
International Journal of Plant, Animal and Environmental Sciences Page: 207 Available online at www.ijpaes.com

Chennaiah et al Copyrights@2014 IJPAES ISSN 2231-4490
On the other hand, The concentration of Cd in the drinking water samples ranged from 0.30 to 6.64 ppb with the mean of 1.02 PPb, the permissible limit of Cd is specified as 3 PPb by BIS (1993) and 10.0 ppb is specified by WHO (2004) for drinking water. All the samples were within the permissible limits of BIS (1993).and WHO (2004).The high Cadmium concentrations were observed in Ghatkesar,Yamnampeta and Aushapur areas of the study area.Cadmium is generally classified as toxic trace element.Geologic deposits of cadmium can serve as sources to groundwater and surface water, especially when in contact with soft, acidic waters.In low doses, cadmium can produce coughing, headaches, and vomiting. In larger doses, cadmium can accumulate in the liver and kidneys, and can replace calcium in bones, leading to painful bone disorders and to a renal failure. The kidney is considered to be the critical target organ in humans chronically exposed to cadmium by ingestion [8].The concentration destribution map of Cd is shown in figure 3.
(ii) Copper and Molybdenum" and their impact on human health
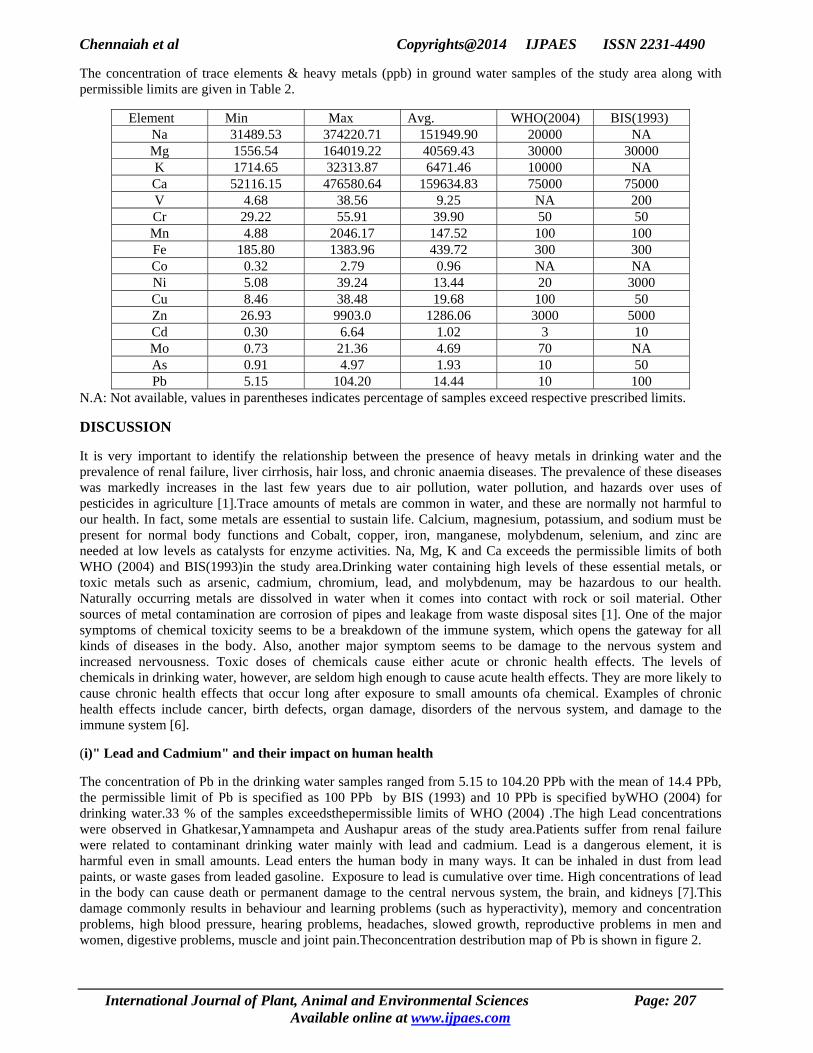
The concentration of Cu in the drinking water samples ranged from 8.46 to 38.48 PPb with the mean of 19.68PPb,the permissible limit of Cu is specified as 50 PPb by BIS (1993) and 100 PPb is specified by WHO (2004) for drinking water. All the samples were within the permissible limits of BIS (1993) and WHO (2004). The high Copper concentrations were observed in Bibinagar, Pagidipalli and Guduruareas.Patients suffer from liver cirrhosis in this study were related to contaminant drinking water mainly with copper and molybdenum. Copper is essential substance to human life, but chronic exposure to contaminant drinking water with copper can result in the development of anemia, liver and kidney damage [8].
International Journal of Plant, Animal and Environmental Sciences Page: 208 Available online at www.ijpaes.com
Chennaiah et al Copyrights@2014 IJPAES ISSN 2231-4490
This disease was a result of drinking water contaminated from corrosion of water pipes made of copper and industrial wastes. Diarrhea in small children could be also occurred due to high copper exposure. The adverse health effects caused by drinking water contaminated with copper are abdominal pain, vomiting, headache, nausea, and diarrhea. The concentration destribution map of Cu is shown in figure 4.
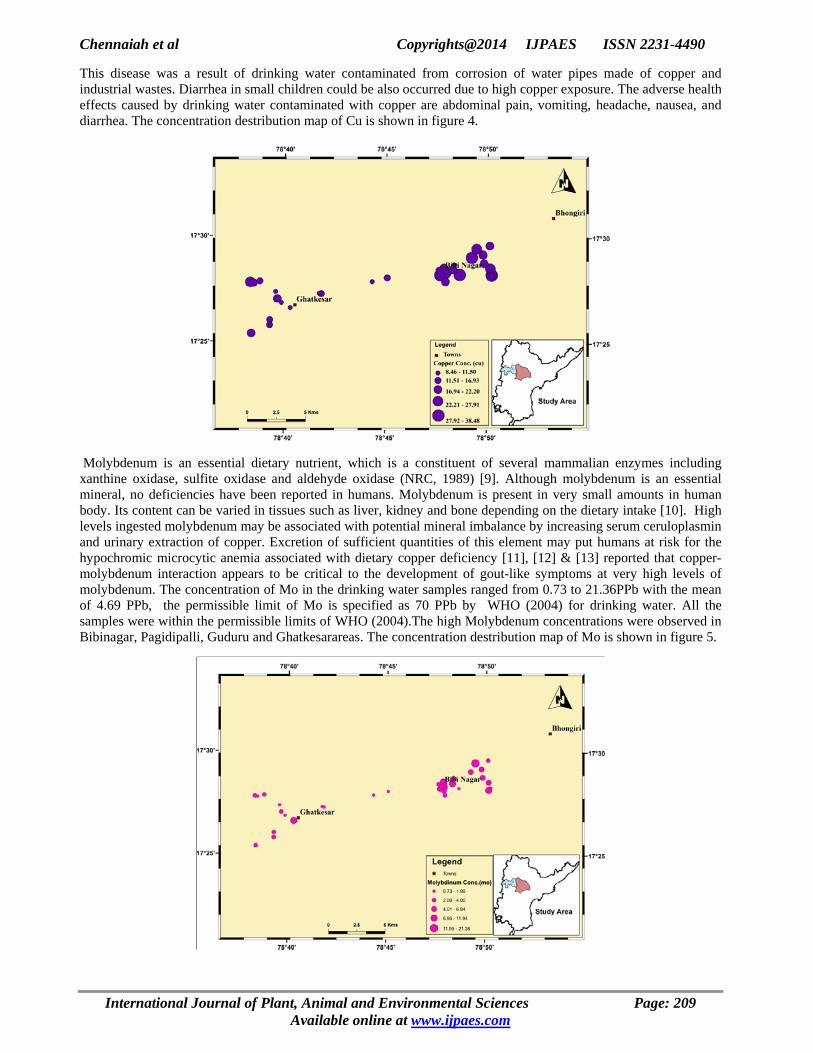
Molybdenum is an essential dietary nutrient, which is a constituent of several mammalian enzymes including xanthine oxidase, sulfite oxidase and aldehyde oxidase (NRC, 1989) [9]. Although molybdenum is an essential mineral, no deficiencies have been reported in humans. Molybdenum is present in very small amounts in human body. Its content can be varied in tissues such as liver, kidney and bone depending on the dietary intake [10]. High levels ingested molybdenum may be associated with potential mineral imbalance by increasing serum ceruloplasmin and urinary extraction of copper. Excretion of sufficient quantities of this element may put humans at risk for the hypochromic microcytic anemia associated with dietary copper deficiency [11], [12] & [13] reported that copper-molybdenum interaction appears to be critical to the development of gout-like symptoms at very high levels of molybdenum. The concentration of Mo in the drinking water samples ranged from 0.73 to 21.36PPb with the mean of 4.69 PPb, the permissible limit of Mo is specified as 70 PPb by WHO (2004) for drinking water. All the samples were within the permissible limits of WHO (2004).The high Molybdenum concentrations were observed in Bibinagar, Pagidipalli, Guduru and Ghatkesarareas. The concentration destribution map of Mo is shown in figure 5.
International Journal of Plant, Animal and Environmental Sciences Page: 209 Available online at www.ijpaes.com
Chennaiah et al Copyrights@2014 IJPAES ISSN 2231-4490
(iii)"Nickel and Chromium" and their impact on human health
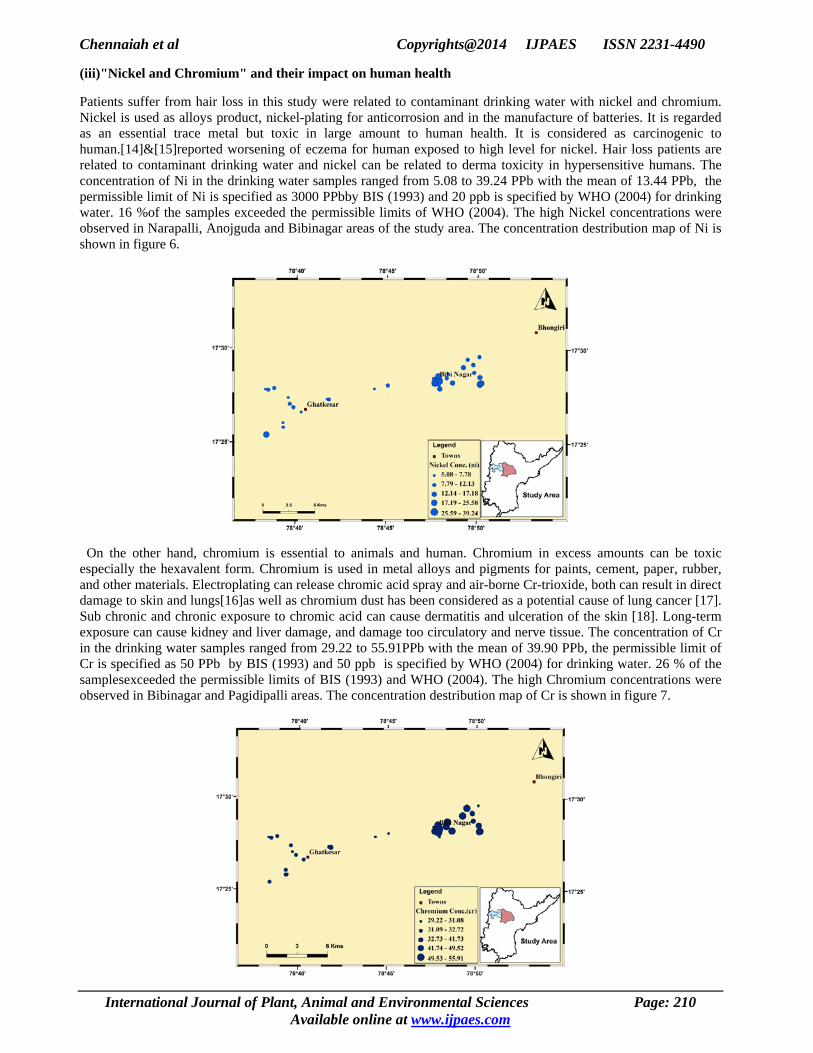
Patients suffer from hair loss in this study were related to contaminant drinking water with nickel and chromium. Nickel is used as alloys product, nickel-plating for anticorrosion and in the manufacture of batteries. It is regarded as an essential trace metal but toxic in large amount to human health. It is considered as carcinogenic to human.[14]&[15]reported worsening of eczema for human exposed to high level for nickel. Hair loss patients are related to contaminant drinking water and nickel can be related to derma toxicity in hypersensitive humans. The concentration of Ni in the drinking water samples ranged from 5.08 to 39.24 PPb with the mean of 13.44 PPb, the permissible limit of Ni is specified as 3000 PPbby BIS (1993) and 20 ppb is specified by WHO (2004) for drinking water. 16 %of the samples exceeded the permissible limits of WHO (2004). The high Nickel concentrations were observed in Narapalli, Anojguda and Bibinagar areas of the study area. The concentration destribution map of Ni is shown in figure 6.
On the other hand, chromium is essential to animals and human. Chromium in excess amounts can be toxic especially the hexavalent form. Chromium is used in metal alloys and pigments for paints, cement, paper, rubber, and other materials. Electroplating can release chromic acid spray and air-borne Cr-trioxide, both can result in direct damage to skin and lungs[16]as well as chromium dust has been considered as a potential cause of lung cancer [17]. Sub chronic and chronic exposure to chromic acid can cause dermatitis and ulceration of the skin [18]. Long-term exposure can cause kidney and liver damage, and damage too circulatory and nerve tissue. The concentration of Cr in the drinking water samples ranged from 29.22 to 55.91PPb with the mean of 39.90 PPb, the permissible limit of Cr is specified as 50 PPb by BIS (1993) and 50 ppb is specified by WHO (2004) for drinking water. 26 % of the samplesexceeded the permissible limits of BIS (1993) and WHO (2004). The high Chromium concentrations were observed in Bibinagar and Pagidipalli areas. The concentration destribution map of Cr is shown in figure 7.
International Journal of Plant, Animal and Environmental Sciences Page: 210 Available online at www.ijpaes.com
Chennaiah et al Copyrights@2014 IJPAES ISSN 2231-4490
(iv)"Arsenic and Manganese" and their impact on human health
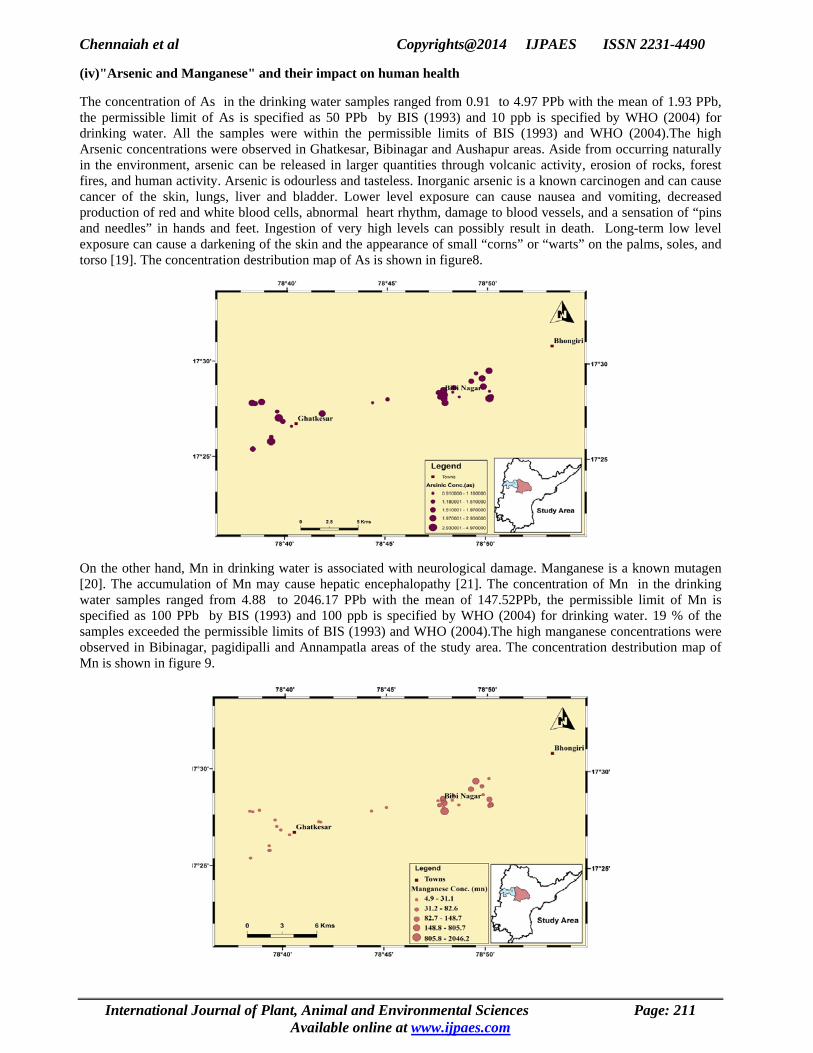
The concentration of As in the drinking water samples ranged from 0.91 to 4.97 PPb with the mean of 1.93 PPb, the permissible limit of As is specified as 50 PPb by BIS (1993) and 10 ppb is specified by WHO (2004) for drinking water. All the samples were within the permissible limits of BIS (1993) and WHO (2004).The high Arsenic concentrations were observed in Ghatkesar, Bibinagar and Aushapur areas. Aside from occurring naturally in the environment, arsenic can be released in larger quantities through volcanic activity, erosion of rocks, forest fires, and human activity. Arsenic is odourless and tasteless. Inorganic arsenic is a known carcinogen and can cause cancer of the skin, lungs, liver and bladder. Lower level exposure can cause nausea and vomiting, decreased production of red and white blood cells, abnormal heart rhythm, damage to blood vessels, and a sensation of “pins and needles” in hands and feet. Ingestion of very high levels can possibly result in death. Long-term low level exposure can cause a darkening of the skin and the appearance of small “corns” or “warts” on the palms, soles, and torso [19]. The concentration destribution map of As is shown in figure8.
On the other hand, Mn in drinking water is associated with neurological damage. Manganese is a known mutagen [20]. The accumulation of Mn may cause hepatic encephalopathy [21]. The concentration of Mn in the drinking water samples ranged from 4.88 to 2046.17 PPb with the mean of 147.52PPb, the permissible limit of Mn is specified as 100 PPb by BIS (1993) and 100 ppb is specified by WHO (2004) for drinking water. 19 % of the samples exceeded the permissible limits of BIS (1993) and WHO (2004).The high manganese concentrations were observed in Bibinagar, pagidipalli and Annampatla areas of the study area. The concentration destribution map of Mn is shown in figure 9.
International Journal of Plant, Animal and Environmental Sciences Page: 211 Available online at www.ijpaes.com

Chennaiah et al Copyrights@2014 IJPAES ISSN 2231-4490
(v) "Iron and Cobalt" and their impact on human health
Iron is an essential element in human nutrition.Estimates of the minimum daily requirement for iron depend on age, sex and iron bioavailability and range from about 10 to 50 mg/day. As a precaution against storage of excessive iron in the body, JECFA established a provisional maximum tolerable daily intake (PMTDI) in 1983 of 0.8 mg/Kg of body weight which applies to iron from all sources except for iron oxides used as colouring agents, and iron supplements taken during pregnancy and lactation [22]. The concentration of Fe in the drinking water samples ranged from 185.80 to 1383.96PPb with the mean of 439.72 PPb, the permissible limit of Fe is specified as 300 PPb by BIS (1993) and 300 is specified by WHO (2004) for drinking water. 60 % of the samples exceededthe permissible limits of BIS (1993) and WHO (2004).The high Iron concentrations were observed in Ghatkesar, Pagidipalli and Annampatla areas of the study area.The concentration destribution map of Pb is shown in figure 10.
The concentration of Co in the drinking water samples ranged from 0.32 to 2.79 PPb with the mean of 0.96 PPb, the permissible limit of Co is not specified by BIS (1993) and WHO (2004) for drinking water. The high Cobalt concentrations were observed in Bibinagar, Anojguda and Annampatla areas of the study area. Cobalt is a naturally occurring element with one stable isotope (59Co) and 26 known radioactive isotopes. Inhalation of cobalt particles results in deposition in the upper and lower respiratory tract, where they can be retained or absorbed into the blood after dissolution or mechanically transferred to the gastrointestinal tract by mucociliary action and swallowing. Inhalation and dermal exposure to cobalt in humans can result in sensitization. Bronchial asthma has been described in workers exposed to various forms of cobalt. Interstitial lung disease caused by metallic cobalt containing particles is an occupational lung disease generally referred to as hard metal lung disease. Mortality studies of the hard metal industry suggest an increase in lung cancer mortality [23].The concentration destribution map of Co is shown in figure 11.
International Journal of Plant, Animal and Environmental Sciences Page: 212 Available online at www.ijpaes.com

Chennaiah et al Copyrights@2014 IJPAES ISSN 2231-4490
(vi) Vanadium and zinc" and their impact on human health
The concentration of V in the drinking water samples ranged from 4.68 to 38.56 PPb with the mean of 9.25 PPb, the permissible limit of V is specified as 200 PPbby BIS (1993) for drinking water. All the samples were within the permissible limits of BIS (1993).The high Vanadium concentrations were observed in Ghatkesar, Narapalli, Yamnampeta and Bibinagarareas.Vanadium is a naturally occurring element. It is widely distributed in the earth’s crust at an average concentration of approximately 100 mg/kg. Vanadium is found in about 65 different minerals. Vanadium occurs naturally in soil, water, and air. Natural sources of atmospheric vanadium include continental dust, marine aerosol, and volcanic emissions. Breathing air with vanadium pentoxide can result in coughing which can last a number of days after exposure. Nausea, mild diarrhea, and stomach cramps have been reported in people taking sodium metavanadate or vanadylsulfate for the experimental treatment of diabetes [24]. The concentration destribution map of V is shown in figure 12.
Zinc occurs in small amounts in almost all igneous rocks. The concentration of Zn in the drinking water samples ranged from 26.93 to 9903.0 PPb with the mean of 1286.06 PPb, the permissible limit of Zn is specified as 3000 PPb by BIS (1993) and 3000ppb is specified by WHO (2004) for drinking water.11% of the samples exceeded the permissible limits of WHO (2004) and BIS (1993).The high Zinc concentrations were observed in Narapalli, Bibinagar, Pagidipalli and Guduru areas of the study area. Acute toxicity arises from the ingestion of excessive amounts of zinc salts, either accidentally or deliberately as an emetic or dietary supplement. Vomiting usually occurs after the consumption of more than 500 mg of zinc sulphate. Fever, nausea, vomiting, stomach cramps, and diarrhoea will occur after 3–12 hof ingestion [22]. The concentration destribution map of Pb is shown in figure13.
International Journal of Plant, Animal and Environmental Sciences Page: 213 Available online at www.ijpaes.com

Chennaiah et al Copyrights@2014 IJPAES ISSN 2231-4490
CONCLUSION The results of this study showed that the monitored physico-chemical parameters and Cations of the potable water samples under study area exceed the permissible limits of both WHO (2004) and BIS (1993) for drinking water. Amongst the heavy metals assessed, Chromium, Manganese, Iron, Nickel, Zinc and Lead were found to be higher than WHO (2004) recommended limit for drinking water while cobalt was detected in all the samples but permissible limits for cobalt are not available. It is recommended that potable water sources in the study area should be routinely monitored to ascertain its suitability for drinking and other purposes. ACKNOWLEDGEMENTS The authors are thankful to the Oil India Limited for granting permission to publish this paper. We are very thankful to Shri.B.C.Dutta (G.M-Chemical), Shri.S.K.Misra (Head-Chemical-Lab.) and Shri.R.L.Sharma (Head-Chemical-Operations) for their constant support and help. The authors are also thankful to the Director, National Geophysical Research Institute (CSIR), for their constant support and help topublish this work.
REFERENCES
[1] Heavy metals in drinking water and their environmental impact on human health.H. M. Salem et al. / ICEHM2000, Cairo University, Egypt, September, 2000, page 542- 556
[2] Heavy Metal toxicity, 2008. http:www.Tuberose.Com /heavy metal toxicity. Html. Retrieved on. 2nd Oct. [3] Jarup.L. 2003, 68, 167-182. Hazard of heavy metal contamination British medical Bulletin [4] Lawd. A.O. and Audu A.A, 2004. Journal of Environmental Sc. 8(1), 40-55 [5] APHA (American Public Health Association): 1985. Standard Methods for the Examination of water and
waste. 16th Edn., Washington, D.C. [6] USGAO, 2000: Health Effect of lead in drinking water. U.S. General Accounting Office reports. [7] Jennings, G., D.; Sneed, R., E.; Clair, M., B., St., 1996. Metals in drinking water. Published by: North Carolina
Cooperative Extension service Publication no.: AG-473-1. Electronic version 3/1996. [8] U.S.EPA, 1999: Drinking water and Health. EPA816-k-99-001. [9] Madsen, H., Poultsen, L., and Grandjean, P., 1990. Risk of high copper content in drinking water. Ugeskr. -
Laeger. Jun.18, 152 (25): 1806-90041-5782. [10] NRC (National Research Council), 1989. National Academy of Sciences. Recommended Dietary Allowances,
10th Ed., National Academy Press, Washington, DC. [11] Grounse, R. G., Pories, W. J., Bray, J. T., and Mauger, R. L., 1983. Geochemistry and Man:Health and
Diseases. In Thorton, I., 1983: Applied Environmental Geochemistry. Academic Press, London 267-303. [12] U.S. EPA, 1985: Drinking Water Criteria Document on Cadmium. Office of Drinking Water, Washington, DC. [13] U.S.EPA, 1991. Quantification of Toxicologic Effects for Nickel. Prepared by the Office of Health And
Environmental Assessment, Environmental Criteria and Assessment Office, Cincinnati, OH for the office of Water, Office of Science and Technology, Washington, DC.
[14] White, A, P. Handler and E.L. Smith. 1973. Principles of Biochemistry, 5th Ed. McGraw-Hill, New York, NY. P. 801-833.
[15] Ambrose, A.M., D.S. Larson, J.R. Borzelleca and G.R. Hennigar, Jr., 1976. Long-term toxicologic assessment of nickel in rats and dogs. J. Food Sci. Technol. 13: 181-187.
[16] Kaaber, K., N.K. Veien and J.C. Tjell, 1978. Low nickel diet in the treatment of patients’ with chronic nickel dermatitis. Br. J. Derm. 98: 197-201.
[17] Grounse, R. G., Pories, W. J., Bray, J. T., and Mauger, R. L., 1983. Geochemistry and Man: Health and Diseases. In Thorton, I., 1983: Applied Environmental Geochemistry. Academic Press, London 267-303.
[18] Hyodo, K., Susuki, S., Furuya, N. and Meshiazuka, K., 1980. Arch. Occup. Environ. Health 46,141-150. [19] S.EPA, 1999. Drinking water and Health.EPA816-k-99-001. [20] Web source 2009. www.engg.ksu.edu/CHSR/Issue 15March [21] Beckman RA, Milvran. Loeb LA. 1985., On the Fidelity of DNA Replication: Manganese Mutagenesis in
Vitro. Biochemistry 24:5810-5817. [22] Layrargues GP, Rose C, Spahr L, Zayed J, Normandin L, Butterworth RF. 1998. Role of manganese in the
pathogenesis of portal-systemic encephalopathy. Metabol Brain Dis 13(4):311-318. [23] Guidelines for drinking-water quality, 1996. 2nd ed. Vol. 2.Health criteria and other supporting information.
World Health Organization, Geneva [24] Department of Health and HumanServices, Public Health Service. 2004. Agency for Toxic Substances and
Disease Registry [25] Web source: http://www.ntis.gov/ (25)
International Journal of Plant, Animal and Environmental Sciences Page: 214 Available online at www.ijpaes.com