remote sensing in support of tsunami mitigation planning ... · remote sensing in support of...
TRANSCRIPT

Remote sensing in support of tsunami mitigation planning in the Mediterranean
N. Chrysoulakis1, E. Flouri1, E. Diamandakis1, V. Dougalis1, C. E. Synolakis1,2,3 & S. Foteinis3 1Institute of Applied and Computational Mathematics, Foundation for Research and Technology – Hellas, Greece 2Viterbi School of Engineering, University of Southern California, Los Angeles, CA, USA. 3Department of Environmental Engineering, Technical University of Crete, Greece
Keywords: Satellite images, digital elevation model, slope map, land cover/use, shoreline extrac-tion, tsunami inundation mapping.
ABSTRACT: Remote sensing has emerged as a powerful tool for mitigation planning and post-crisis assess-ment in various natural hazards. The development of advanced remote sensing technologies has improved mapping capabilities and expanded areas of application. The most significant im-provement is the commercialization of very high spatial resolution satellite data. Here, remote sensing data and methods were used to support the development of tsunami inundation maps for the City of Rhodes, Greece, as well as to help ground truthing modeling results. Information about the topography was derived using both satellite and aerial images. ASTER (Advanced Spaceborn Thermal Emission and Reflection Radiometer) stereo images were used to provide a Digital Elevation Model (DEM) for the whole island, whereas aerial imagery was used to derive a high resolution DEM for the Northern part where the city of Rhodes is located. These DEMs were used to orthorectify multispectral ASTER and Ikonos images, respectively. Land cover/use was extracted for the coastal area of Rhodes using both ASTER and Ikonos images. The latter was also used to extract the shoreline and information about the main buildings. The DEMs and the shoreline were used in the numerical computations of inundation, whereas the orthorectified products were used to validate the resulting inundation estimates on the ground. Finally, contour lines which extracted from the high resolution DEM along the inundation lines revealed the to-pographic controls on tsunami inundation.
1 INTRODUCTION
Remote sensing has emerged as a powerful tool in mapping changes on land after natural hazards such as floods, earthquakes, landslides, forest fires and cyclones/hurricanes. The development of advanced remote sensing technologies has improved the mapping capabilities and expanded its ap-plications. The most significant improvement has been the commercialization of high spatial reso-lution satellite images such as Ikonos and QuickBird (Vu et al. 2007). In the case of tsunamis, be-cause of the logistical challenges of doing fieldwork in a major disaster area where critical locales are simply inaccessible, satellite observations provide an excellent tool to carry out rapid, regional assessments (Synolakis & Okal 2005, Synolakis and Bernard 2006). Soon after the occurrence of the Sumatra tsunami in 2004 for example, satellite data were used in tsunami waves detection

(Geist et al. 2006, Gower 2007), as well as in damage assessment by detecting the changes along the coastal regions, water logging, ocean wave pattern, loss of vegetation and forests along the coasts (Borrero 2005, Borrero et al. 2006a, Singh et al. 2007, Kumar et al. 2007, Wikantika et al. 2007). By integrating satellite data into tsunami studies, more efficient and thorough post-tsunami surveys can be completed.
Tsunami hazard reduction can be also supported with satellite data. For example, the inundation limit (usually defined as the inland limit of wetting during the entire duration of the event) can in principle be detected in high resolution satellite images during post-crisis assessment. Moreover, satellite data can be used to develop Digital Elevation Models (DEMs) and slope maps. DEM tech-niques can be used to identify and delineate tsunami inundation and runup elevation (Kumar et al. 2007). Using slope rather than elevation to predict the inundation may be of use for planning future tsunami evacuations (McAdoo et al. 2007). For example, tsunami inundation maps are now avail-able for some areas in Northern Sumatra (Borrero et al. 2006b).
Inundation maps based on computations of tsunamis from scenario geophysical events are used in emergency preparedness and are the basis for designating evacuation routes, shelters and signage (Synolakis et al. 2002). The computation is not simple, as fluid motions during runup involve the interaction of three phases of matter, solid liquid and gas, and are known to be inherently unstable with large height gradients and velocities (Liu et al. 1991). Many models that claim to calculate in-undation actually stop the computation at some offshore location to avoid instabilities, see Synolakis (2003) for a discussion. In California, early maps for specific regions reflected an eleva-tion (contour) equal to the maximum runup generated by all possible relevant tsunami scenarios for the region. In general, the extent of vertical runup of any specific tsunami depends on the source seismic parameters and the target coastline location relative to the source. For earthquake tsunamis, the runup depends on the tectonic parameters of the parent earthquake, the ocean topography at the generation region, the bathymetry in the propagation path and exquisitely on the target coastline’s shoreline topography (Kanoglu & Synolakis 1998, 2006). For these reasons, numerical computa-tional models are used in inundation mapping. When validated per standard methods (Synolakis et al. 2007), numerical models produce excellent projections when compared with small scale labora-tory and large scale geophysical data.
Advancements in remote sensing technologies have resulted in an increase in the size and com-plexity of image databases. Therefore, choosing the relevant image data is not simple. Vu et al. (2007) developed a framework to integrate high spatial resolution (Landsat or ASTER), very high spatial resolution (QuickBird or Ikonos) satellite images and DEM data in mapping tsunami-affected areas. The processing flowed upwards from macro-scale (high spatial resolution data) to micro-scale (very high spatial resolution data). Across this pyramidal searching, only necessary data is acquired, processed and the focused geographical extent is narrowed.
The objective in this study was to examine the potential of satellite remote sensing in supporting tsunami mitigation planning in the Mediterranean. Remote sensing data and methods were used to support the development of tsunami inundation maps for the island of Rhodes, in the framework of the EU funded project TRANFER (Tsunami Risk ANd Strategies For the European Region) aimed at tsunami hazard and risk assessment and the identification of the best strategies for reduction of tsunami risk. Geographical Information Systems (GIS) methods were used to manage all spatial data and to create and combine the different inundation map components. The remote sensing data and methods were finally combined with in-situ observations with GPS (Global Positioning Sys-tem) to validate numerical modeling results.
2 DATA AND METHODOLOGY
The study area is shown in Figure 1. Three nested grids were used for inundation computations which were done with MOST (Method Of Splitting Tsunami) numerical model (Titov & Synolakis, 1998, Bernard et al. 2006). MOST has been extensively validated and is the code used by NOAA
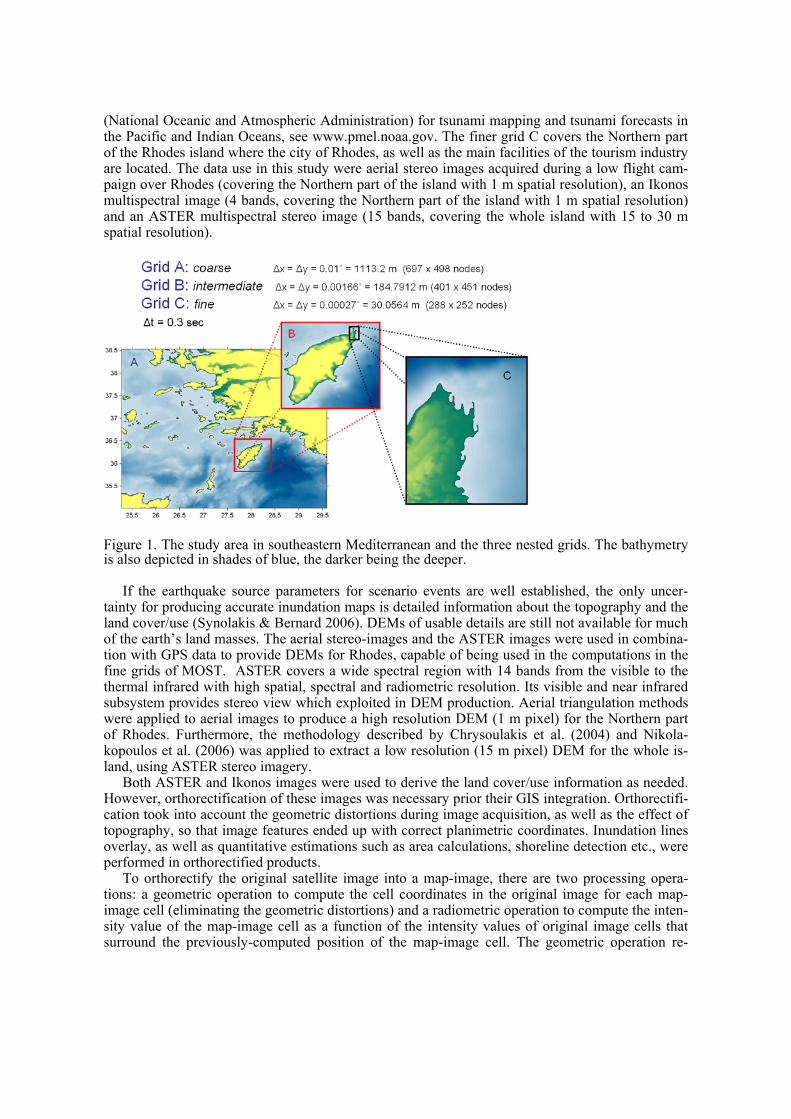
(National Oceanic and Atmospheric Administration) for tsunami mapping and tsunami forecasts in the Pacific and Indian Oceans, see www.pmel.noaa.gov. The finer grid C covers the Northern part of the Rhodes island where the city of Rhodes, as well as the main facilities of the tourism industry are located. The data use in this study were aerial stereo images acquired during a low flight cam-paign over Rhodes (covering the Northern part of the island with 1 m spatial resolution), an Ikonos multispectral image (4 bands, covering the Northern part of the island with 1 m spatial resolution) and an ASTER multispectral stereo image (15 bands, covering the whole island with 15 to 30 m spatial resolution).
Figure 1. The study area in southeastern Mediterranean and the three nested grids. The bathymetry is also depicted in shades of blue, the darker being the deeper.
If the earthquake source parameters for scenario events are well established, the only uncer-tainty for producing accurate inundation maps is detailed information about the topography and the land cover/use (Synolakis & Bernard 2006). DEMs of usable details are still not available for much of the earth’s land masses. The aerial stereo-images and the ASTER images were used in combina-tion with GPS data to provide DEMs for Rhodes, capable of being used in the computations in the fine grids of MOST. ASTER covers a wide spectral region with 14 bands from the visible to the thermal infrared with high spatial, spectral and radiometric resolution. Its visible and near infrared subsystem provides stereo view which exploited in DEM production. Aerial triangulation methods were applied to aerial images to produce a high resolution DEM (1 m pixel) for the Northern part of Rhodes. Furthermore, the methodology described by Chrysoulakis et al. (2004) and Nikola-kopoulos et al. (2006) was applied to extract a low resolution (15 m pixel) DEM for the whole is-land, using ASTER stereo imagery.
Both ASTER and Ikonos images were used to derive the land cover/use information as needed. However, orthorectification of these images was necessary prior their GIS integration. Orthorectifi-cation took into account the geometric distortions during image acquisition, as well as the effect of topography, so that image features ended up with correct planimetric coordinates. Inundation lines overlay, as well as quantitative estimations such as area calculations, shoreline detection etc., were performed in orthorectified products.
To orthorectify the original satellite image into a map-image, there are two processing opera-tions: a geometric operation to compute the cell coordinates in the original image for each map-image cell (eliminating the geometric distortions) and a radiometric operation to compute the inten-sity value of the map-image cell as a function of the intensity values of original image cells that surround the previously-computed position of the map-image cell. The geometric operation re-

quires the observation equations of the geometric model with the previously computed unknowns and elevation information. The 3D models take into account elevation distortion, therefore a DEM is needed to create precise orthorectified images. The DEM affects the orthorectification process, both in terms of elevation accuracy for positioning and in terms of grid spacing. To orthorectify the ASTER image the ASTER derived DEM was used per Chrysoulakis et al. (2004), while the Ikonos image was orthorectified per Lipakis et al. (2008).
Then, the shoreline was extracted for the Ikonos and ASTER oerthorectified products. The ac-curacy of image orthorectification, as well as the accuracy of image classification, are the most im-portant factors affecting the accuracy of the extracted shoreline. The methodology of Lipakis et al. (2008) was used to extract the shoreline: Ikonos data were orthorectified and a feature extraction technique was then used. This technique employed machine-learning algorithms which exploit both the spectral and spatial information of the image. The basis for shoreline extraction is the water-land separation; therefore the orthorectified image was classified and a polygon corresponding to water wetted area was extracted. Taking into account the land cover mapping constraints for very high spatial resolution satellite data (Foody 2000, Berberoglu et al. 2000), a machine learning clas-sifier approach was selected as the best solution for Ikonos multispectral image classification. The Feature Analyst software (VLS 2007) was used, since it employs machine-learning techniques which have the potential to exploit both the spectral and spatial information.
Land-use mapping was performed for coastal areas of Rhodes using both high and very high spatial resolution multispectral satellite imagery. The first method resulted in a general mapping of urban areas with elevation lower than 20 m. ASTER data with the spatial resolution of 15 m and the positional accuracy of 15 m were used to map the whole island. The second method resulted in a detailed land-use mapping for areas with elevation lower than 20 m. Ikonos data with the spatial resolution of 1 m and positional accuracy better than 2 m were used here. The ASTER orthorecti-fied multispectral image was classified to 11 classes by employing a per-pixel supervised classifi-cation procedure based on the maximum likelihood classification algorithm (Foody 2000, Gallego, 2004). Following, post-classification sorting merged the above classes into 2 main categories, ur-ban and non-urban. The ASTER derived DEM was used to extract the pixels in the classified image that corresponded to areas with elevation lower than 20 m. As already mentioned, the accuracy of per-pixels classification techniques is low for very high spatial resolution satellite data, therefore a semi-automatic classification method was used to classify the Ikonos image. This semi-automatic method was based on both manual digitization and machine learning classification techniques (VLS 2007), which are considered as the optimum approach for VHR multispectral data classifica-tion and feature extraction.
Information about buildings type and height is also useful in inundation mapping. The Ikonos imagery was used to detect 150 major building located in the Northern part of the island. The de-tection and the orientation of these buildings was performed using the orthorectified image. An ex-ample of building orientation is shown in Figure 2 where the major axis of the “Hotel Casino” was identified (green line) and two angles were estimated: the angle between the major axis and the di-rection of North and the angle between the major axis and the Normal to the shoreline. Information on buildings height and type was also extracted and stored in our database. Initially, a classification scheme of 4 building height classes (1 floor increments) and four building types (old - masonry made, 60’s type, 80’s type, and modern) was developed. Then the height and type information was extracted by combining Ikonos data with GoogleEarth/Panoramio (http://earth.google.com), as also shown in Figure 2. The extracted buildings location, orientation, type and height was validated and corrected using in-situ observations during a field campaign in July 2008.
Several seismic sources have been considered for providing scenario initial conditions for the computations of the inundation maps for the City of Rhodes. Here, we present results from four extreme seismic scenarios. These were our preliminary runs and they are still being evaluated by geologists in terms of geophysical realism and relevance. A bathymetric grid was built using se-lected bathymetric data and the Ikonos derived shoreline polygon as input for the interpolation. The resulting grid was clipped to the water data. The topographic grid used the aerial and ASTER de-rived DEMs and the water polygon as input and then clipped to the land polygon in the same man-

ner. The topographic and bathymetric grids were merged into a final grid, from which the three nested grids (Figure 1) were extracted and used by the MOST numerical model (Titov & Synolakis 1995, 1998).
Figure 2. Building identification, orientation and classification.
3 RESULTS AND DISCUSSION
The Root Mean Square Error (RMSE) in xy (planimetry) and z (elevation) were used for the DEM accuracy assessment. Assuming parallax difference correlation errors in the range of 0.5 to 1.0 pix-els (0.5-1 m for aerial images and 7-15 m for ASTER), elevation errors (RMSEz) are expected to be less than 1 m for aerial images and in the ±12 m to ±26 m range. Figure 3 shows the DEM de-rived from ASTER, whereas Figure 4 shows the DEM derived from aerial imagery. Several survey monuments were used to check their vertical accuracy as described in Chrysoulakis et al. (2004). The RMSEz was found less than 1m for aerial images derived DEM and less than 16 m for the ASTER DEM.
The orthorectified images derived from ASTER and Ikonos multispectral data are shown in Figures 5 and 6, respectively. The ASTER orthoimage is shown as pseudocolor composition of the ASTER channels 1, 2, and 3N (RGB: 3N-2-1), and it has been derived using the ASTER DEM. The Ikonos orthoimage, which is shown as pseudocolor composition of the Ikonos channels 2, 3, and 4 (RGB: 4-3-2), has been derived using the high resolution DEM.
The high resolution DEM was used to mask the Ikonos orthoimage, so the areas with elevation greater than 20 m were eliminated, because these areas were not needed in inundation mapping even in cases of extreme scenarios, - note that per Okal & Synolakis (2004), the runup seldom if ever exceeds twice the seismic slip, a magnitude 9 earthquake has a slip of 10m. Therefore, the ar-

eas with elevations lower than 20 m were the suspect vulnerable coastal areas. The remaining part of the Ikonos orthorectified image after the DEM masking is shown in Figure 7. The extracted shoreline has been superimposed in vector (ESRI shapefile) format (yellow line). According to past studies (Zhou & Li 2000, Li et al. 2003, Grodecki & Dial, 2003), the positional accuracy of this shoreline was expected to be in the range of 2 - 4 m. This was verified by means of in-situ observa-tions with GPS during a filed campaign in July 2008.
Figure 3. The ASTER derived DEM Figure 4. The aerial imagery derived DEM.
Figure 5. The ASTER orthoimage. Figure 6. The Ikonos orthoimage.
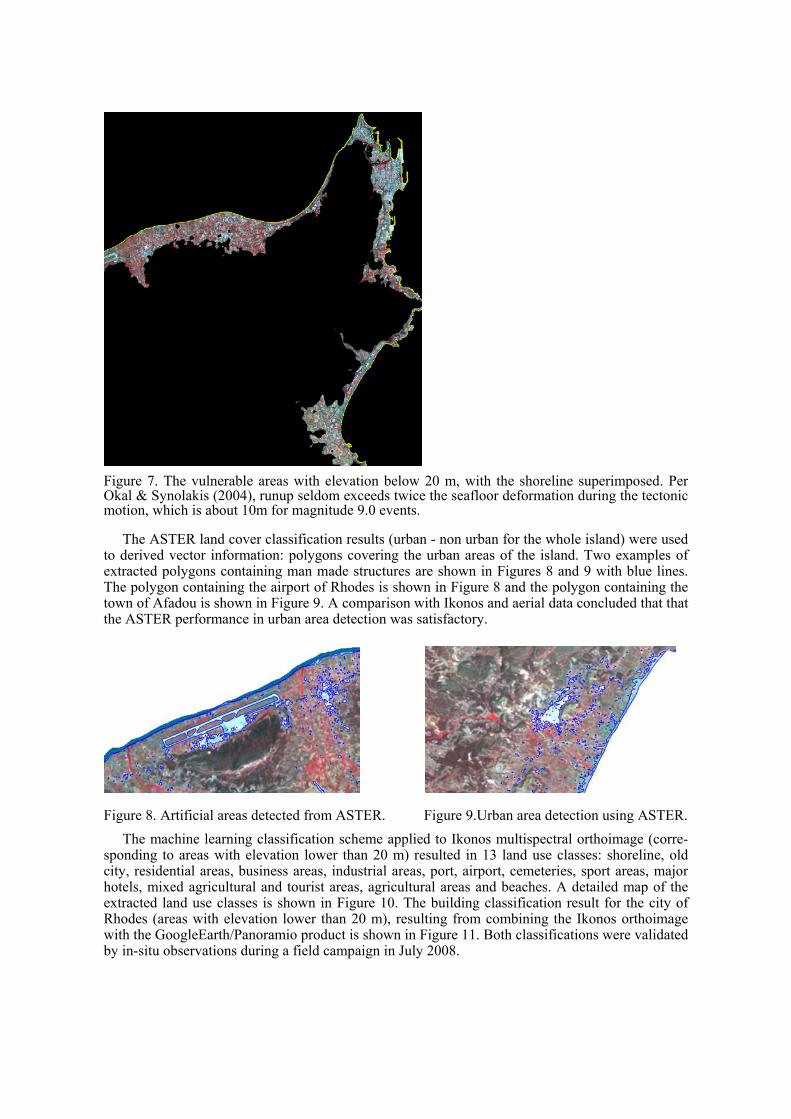
Figure 7. The vulnerable areas with elevation below 20 m, with the shoreline superimposed. Per Okal & Synolakis (2004), runup seldom exceeds twice the seafloor deformation during the tectonic motion, which is about 10m for magnitude 9.0 events.
The ASTER land cover classification results (urban - non urban for the whole island) were used
to derived vector information: polygons covering the urban areas of the island. Two examples of extracted polygons containing man made structures are shown in Figures 8 and 9 with blue lines. The polygon containing the airport of Rhodes is shown in Figure 8 and the polygon containing the town of Afadou is shown in Figure 9. A comparison with Ikonos and aerial data concluded that that the ASTER performance in urban area detection was satisfactory.
Figure 8. Artificial areas detected from ASTER. Figure 9.Urban area detection using ASTER.
The machine learning classification scheme applied to Ikonos multispectral orthoimage (corre-sponding to areas with elevation lower than 20 m) resulted in 13 land use classes: shoreline, old city, residential areas, business areas, industrial areas, port, airport, cemeteries, sport areas, major hotels, mixed agricultural and tourist areas, agricultural areas and beaches. A detailed map of the extracted land use classes is shown in Figure 10. The building classification result for the city of Rhodes (areas with elevation lower than 20 m), resulting from combining the Ikonos orthoimage with the GoogleEarth/Panoramio product is shown in Figure 11. Both classifications were validated by in-situ observations during a field campaign in July 2008.
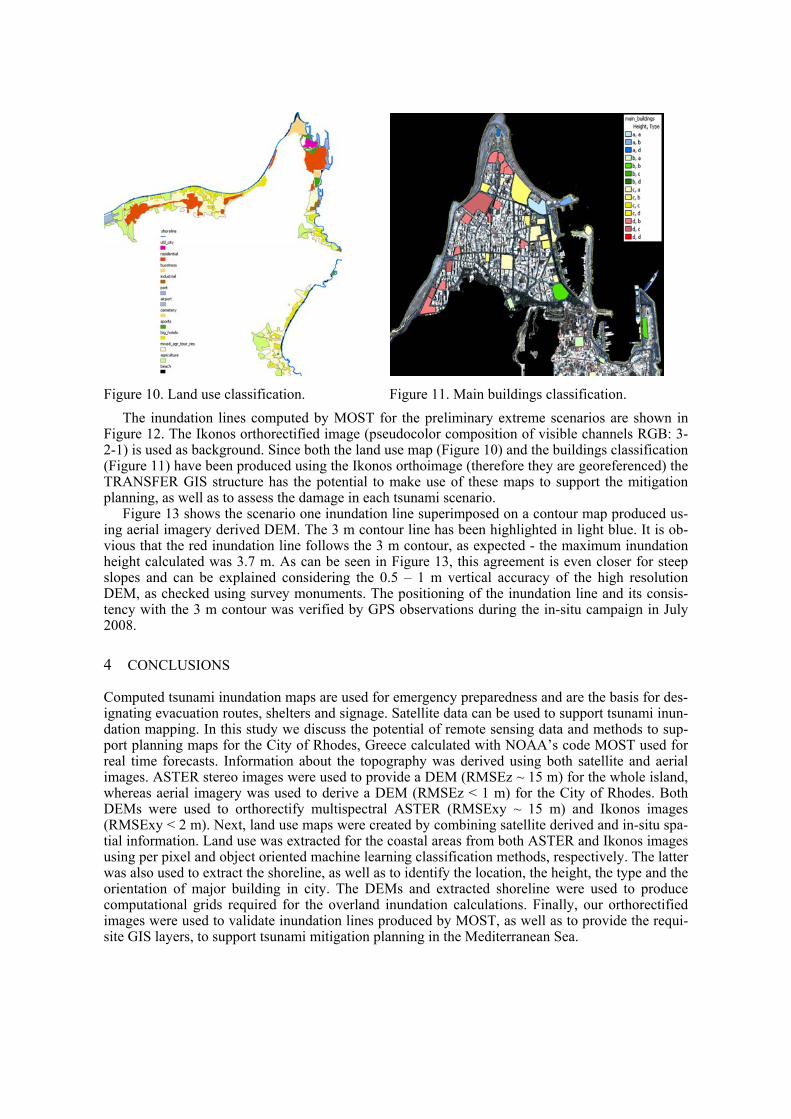
Figure 10. Land use classification. Figure 11. Main buildings classification.
The inundation lines computed by MOST for the preliminary extreme scenarios are shown in Figure 12. The Ikonos orthorectified image (pseudocolor composition of visible channels RGB: 3-2-1) is used as background. Since both the land use map (Figure 10) and the buildings classification (Figure 11) have been produced using the Ikonos orthoimage (therefore they are georeferenced) the TRANSFER GIS structure has the potential to make use of these maps to support the mitigation planning, as well as to assess the damage in each tsunami scenario.
Figure 13 shows the scenario one inundation line superimposed on a contour map produced us-ing aerial imagery derived DEM. The 3 m contour line has been highlighted in light blue. It is ob-vious that the red inundation line follows the 3 m contour, as expected - the maximum inundation height calculated was 3.7 m. As can be seen in Figure 13, this agreement is even closer for steep slopes and can be explained considering the 0.5 – 1 m vertical accuracy of the high resolution DEM, as checked using survey monuments. The positioning of the inundation line and its consis-tency with the 3 m contour was verified by GPS observations during the in-situ campaign in July 2008.
4 CONCLUSIONS
Computed tsunami inundation maps are used for emergency preparedness and are the basis for des-ignating evacuation routes, shelters and signage. Satellite data can be used to support tsunami inun-dation mapping. In this study we discuss the potential of remote sensing data and methods to sup-port planning maps for the City of Rhodes, Greece calculated with NOAA’s code MOST used for real time forecasts. Information about the topography was derived using both satellite and aerial images. ASTER stereo images were used to provide a DEM (RMSEz ~ 15 m) for the whole island, whereas aerial imagery was used to derive a DEM (RMSEz < 1 m) for the City of Rhodes. Both DEMs were used to orthorectify multispectral ASTER (RMSExy ~ 15 m) and Ikonos images (RMSExy < 2 m). Next, land use maps were created by combining satellite derived and in-situ spa-tial information. Land use was extracted for the coastal areas from both ASTER and Ikonos images using per pixel and object oriented machine learning classification methods, respectively. The latter was also used to extract the shoreline, as well as to identify the location, the height, the type and the orientation of major building in city. The DEMs and extracted shoreline were used to produce computational grids required for the overland inundation calculations. Finally, our orthorectified images were used to validate inundation lines produced by MOST, as well as to provide the requi-site GIS layers, to support tsunami mitigation planning in the Mediterranean Sea.

Figure 12. The resulted inundation lines for the four hypothetical extreme scenarios as super-imposed over the Ikonos multispectral orthore-ctified image.
Figure 13. Contour lines as derived from the high resolution DEM. The contour of 3 m is shown in blue and the inundation line in red.
ACKNOWLEDGEMENTS Research supported by the EU funded FP6 Project TRANSFER (Contract no. 037058).
REFERENCES
Berberoglu, S. Lloyd, C. D., Atkinson, P. M. & Curran, P. J. 2000. The integration of spectral and textural information using neural networks for land cover mapping in the Mediterranean. Com-puters & Geosciences 26: 385 - 396.
Bernard, E. N., Mofjeld, H. O., Titov,, V., Synolakis, C. E. & Gonzalez, F. I. 2006. Tsunami: scientific frontiers, mitigation, forecasting, and policy implications. Philosophical Transactions of the Royal Society A 364, (doi:10.1098/rsta.2006.1809).
Borrero, J. C., Synolakis, C. E. & Fritz, H. 2006a. Field Surveys northern Sumatra after the Tsu-nami and Earthquake of 26 December 2004. Earthquake Spectra 22 (S3): S93 - S104.
Borrero, J. C., Sieh, K., Shlieh, M. & Synolakis, C. E. 2006b. Tsunami inundation predictions for Western Sumatra. Proceedings of the National Academy of Sciences 103: 19673 - 19677.
Borrero, J. C. 2005. Field Data and Satellite Imagery of Tsunami Effects in Banda Aceh. Science 308 (5728): 1596, DOI: 10.1126/science.1110957
Chrysoulakis, N., Abrams, M., Feidas, H. & Velianitis, D. 2004. Analysis of ASTER Multispectral Stereo Imagery to Produce DEM and Land Cover Databases for Greek Islands: The REAL-DEMS Project. In: Prastacos, P., Cortes, U. De Leon, J. L., Murillo, M. (Eds): Proceedings of e-Environment: Progress and Challege: 411 - 424
Foody, G. M. 2000. Estimation of sub-pixel land cover composition in the presence of untrained classes. Computers & Geosciences 26: 469 – 478.
Gallego, F. J. 2004. Remote sensing and land cover area estimation. International Journal of Re-mote Sensing 25: 3019 - 3047.
Geist, E.L., Titov, V.V. & Synolakis, C.E. 2006. Tsunami wave of change, 2006 Scientific Ameri-can 294: 56 - 63.

Gower, J. 2007. The 26 December 2004 tsunami measured by satellite altimetry. International Journal of Remote Sensing 28: 2897 – 2913.
Grodecki, J. & Dial, G. 2003. Block adjustment of highresolution satellite images described by ra-tional polynomials. Photogrammetric Engineering and Remote Sensing 69: 59-68.
Kanoglu, U. & Synolakis, C. E. 2006, Initial value problem of the shallow water wave equations, Physical Review Letters 97: 148501 - 148504.
Kanoglu, U. & Synolakis, C. E. 1998. Long wave runup on piecewise linear topographies, Journal of Fluid Mechanics 374: 1 - 28.
Kumar, A., Chingkhei, R. K. & Dolendro, Th. 2007. Tsunami damage assessment: a case study in Car Nicobar Island, India. International Journal of Remote Sensing 28: 2937 – 2959.
Li, R., Di, K. & Ma, R. 2003. 3-D Shoreline Extraction from Ikonos Satellite Imagery. Marine Ge-odesy 26: 107 - 115.
Liu, P. L.-F., Synolakis, C. E. & Yeh, H. 1991. Impressions from the First International Workshop on Long Wave Runup. Journal of Fluid Mechanics 229: 675 – 688.
Lipakis, M., Chrysoulakis, N. & Kamarianakis, Y. 2008. Shoreline extraction using satellite im-agery. In: Pranzini, E. and Wetzel, E. (eds): Beach Erosion Monitoring. Results from BEACH-MED/e-OpTIMAL INTERREG IIIC Project. Nuova Grafica Fiorentina, Florence, Italy: 81 - 95.
McAdoo, B. G., Richardson, N. & Borrero, J. 2007. Inundation distances and run-up measurements from ASTER, QuickBird and SRTM data, Aceh coast, Indonesia. International Journal of Re-mote Sensing 28: 2961 – 2975.
Nikolakopoulos, K., Kamaratakis, E. & Chrysoulakis, N. 2006. SRTM vs ASTER Elevation Prod-ucts. Comparison for two regions in Crete, Greece. International Journal of Remote Sensing 27: 4819-4838.
Okal, E. A. & Synolakis, C. E. 2004. Source discriminants for nearfield tsunamis. Geophysical Journal International 158: 899 - 912.
Singh, R. P., Cervone, G., Kafatos, M. Prasad, A. K., Sahoo, A. K., Sun, D., Tang, D. L. & Yang, R. 2007. Multi-sensor studies of the Sumatra earthquake and tsunami of 26 December 2004. In-ternational Journal of Remote Sensing 28: 2885 - 2896.
Synolakis, C. E., Bernard, E. N., Titov, V. V., Kanoglu, U. & Gonzalez, F. I. 2007. Standards, cri-teria, and procedures for NOAA evaluation of tsunami numerical models. NOAA Tech. Memo. OAR PMEL-135, NOAA/Pacific Marine Environmental Laboratory, Seattle, WA.
Synolakis, C. E., Borrero, J. C. & Eisner, R. 2002. Developing inundation maps for the State of California, Solutions to Coastal Disasters, Ed: L. Wallendorf and L. Ewing, ISBN 0-7844-0605-7, Proc. ASCE: 848 - 862.
Synolakis, C.E. & Bernard, E. N. 2006. Tsunami Science Before and after 2004. Philosophical Transactions of the Royal Society A 364: 2231–2265, doi:10.1098/rsta.2006.1824.
Synolakis, C. E. & E. A. Okal. 2005. 1992-2002: Perspective on a decade of post-tsunami surveys, in: Tsunamis: Case studies and recent developments, ed. by K. Satake, Adv. Natur. Technol. Hazards 23: 1 - 30.
Synolakis, C. E. 2003. Tsunami and Seiche in Earthquake Engineering Handbook, CRC Press, 1512pp, ISBN ISBN 0849300681, 9780849300684.
Titov, V. V. & Synolakis, C. E. 1998. Numerical modeling of tidal wave runup. Journal of Water-ways, Port, Coastal and Ocean Engineering ASCE 124 (4): 157 - 171.
Titov, V.V. & Synolakis, C. E. 1995. Modeling of breaking and nonbreaking long wave evolution and runup using VTCS-2. Journal of Waterways, Ports, Coastal and Ocean Engineering 121: 308 - 316.
VLS. 2007. Feature Analyst Version 4.1 for Imagine. Reference Manual. Missoula, USA: Visual Learning Systems Inc.
Vu, T. T., Matsuoka, M. & Yamazaki, F. 2007. Dual-scale approach for detection of tsunami-affected areas using optical satellite images. International Journal of Remote Sensing 28: 2995 -3011.
Wikantika, K., Sinaga, A., Hadi, F. & Darmawan, S. 2007. Quick assessment on identification of damaged building and land-use changes in the post-tsunami disaster with a quick-look image of IKONOS and Quickbird (a case study in Meulaboh City, Aceh). International Journal of Re-mote Sensing 28: 3037 - 3044.
Zhou, G. & Li, R. 2000. Accuracy Evaluation of Ground Points from IKONOS High-Resolution Satellite Imagery. Photogrammetric Engineering and Remote Sensing 66: 1103-1112.