tsunami mitigation measures
TRANSCRIPT

Page 1 of 10
TSUNAMI MITIGATION MEASURES
Taofiq Al-Faesly PhD candidate, University of Ottawa, Canada [email protected]
Dan Palermo Associate professor, York University, Canada [email protected]
Ioan Nistor Associate professor, University of Ottawa, Canada [email protected]
ABSTRACT: Onshore coastal structures, such as seawalls, serve either to prevent tsunami waves from advancing inland or to dampen the hydrodynamic forces that would be imposed on structures that are impacted. Onshore tsunami mitigation strategies include the concept of vertical evacuation. This comes in the form of natural higher ground elevation; artificial higher elevation, such as soil berms; or buildings that are deemed tsunami-resistant. The focus of this study is to investigate the performance of onshore mitigation walls to dampen tsunami-induced hydrodynamic forces on structures. The mitigation walls investigated include vertical and inclined walls. The walls were positioned at two locations upstream from structural models that were subjected to the hydrodynamic forces. The tests were conducted for three flow depths that were generated by a swing gate with a quick opening time, which was located upstream from the structural models. The main parameters investigated in this test program included: the location of the mitigation walls relative to that of the structural models, the angle of inclination of the mitigation walls relative to the flume, and the height of the mitigation walls. During testing, time-histories of the base shear forces and base overturning moments were recorded.
1. Introduction
Tsunamis are generated from the vertical displacement of tectonic plates, from volcanic eruptions, landslides, or, rarely from asteroid impacts. Although several historical tsunamis were the result of volcanic eruptions or landslides, subduction zone earthquakes represent, by far, the greatest tsunami-generating mechanism. Asteroid-triggered tsunamis are very rare; therefore, their potentially devastating hazard is very low (Gisler et al. 2011). Tsunamis travel unnoticed to the naked eye across the deep ocean with amplitudes of only a few centimeters and velocity as high as several hundreds of kilometer an hour. However, as tsunamis approach the shoreline, they gradually increase in wave amplitude as the water depth decreases. Depending on the nearshore bathymetry, tsunamis advance inland in the form of hydraulic bores with significant flow depth with velocity in the range of 10 to 80 km/hr. The terminal effects of tsunami include damage to coastal areas, non-structural and structural damage to infrastructure due to the bore-induced forces, floating debris impact, scour, and flooding.
Tsunami events of the past decade (Indian Ocean 2004; Chile 2010; and Tohoku, Japan 2011) highlight the inherent vulnerabilities of coastal communities. The enormity and scale of the impact (inundation area, the number of casualties, and the economic losses) are the results and implications of those disasters. The Indian Ocean Tsunami alone was responsible for the loss of 230 000 lives and more than 100 billion US dollars of economic losses in 11 countries (Etkin et al., 2010). The Tohoku, Japan Tsunami displaced more than 500 000 people, lead to the loss of 24 000 people, and was responsible for an economic loss exceeding 300 billion US dollars (Takeuchi et al., 2011). These two disasters are the

Page 2 of 10
second deadliest and most expensive natural disasters on record, respectively. Figure 1 provides photos of residential structures located nearshore that experienced severe damage due to these tsunami events.
(a)
(b)
(c)
Fig. 1 – Residential structures damaged during tsunami: (a) two-storey concrete building, Khao Lak, Thailand (Nistor et al., 2006); (b) two-storey structure, Pellhue, Chile 2010 (Palermo et al.,
2012); and (c) overturned apartment building, Onagawa, Japan 2011 (Al-Faesly et al., 2012)
To avoid similar effects due to future disasters, efforts have focused primarily on the implementation of early warning systems, but to a much lesser extent on structural mitigation measures. The early warning system is one of the primary elements of disaster mitigation; it has a major role in preventing loss of life
On March 29, 1964, an 8.4 magnitude earthquake struck near Prince William Sound, Alaska. It triggered major tsunami waves along the Pacific Coast of North America. Figure 2 shows damage was sustained in Port Alberni, BC, as a result of this event.
Fig. 2 – Damage at Port Alberni, BC in 1964 (Photo by D. Peregrine: CNN, 2007)
A recent study based on historical tsunamis highlights that Canada is susceptible to tsunamis occurring in any of the three major oceans: Pacific, Atlantic, and Arctic (Leonard et al., 2010).
• Pacific Coast: this coast has the highest tsunami hazard in Canada. Tsunamis triggered by a megathrust earthquake, from both near- and far-field regions, have the potential to affect the Pacific Coast of Canada. This type of tsunami represents the largest tsunami hazard in Canada due to its widespread impact (Clague et al., 2003). Native American verbal records indicate ground shaking preceding a flooding event between 1690 and 1715 along this coast (Ludwin et al., 2005). Investigations of coastal morasses and offshore deposits provide evidence that great earthquakes and tsunamis occurred throughout the Holocene, with an average return period of approximately 500 years (Goldfinger et al., 2010; and Leonard et al., 2010). In addition, simulation studies predicted tsunami wave heights of 5-8 m along the southwest coastline of Vancouver Island based on tsunamis generated due to the release of strain accumulated over 500 years (Cherniawsky et al., 2007).
• Atlantic Coast: tsunami hazard on this coast is significantly lower than on the Pacific Coast due to the absence of active plate boundaries. However, there is potential hazard from far-field sources including the Caribbean tectonic fault and events similar to the 1755 Lisbon Earthquake. The Lisbon Earthquake triggered substantial rising and lowering of the of the water level in the harbour of Bonavista, Newfoundland, in addition to flooding of low-lying coastal zones (Etkin et al., 2010; and

Page 3 of 10
Roger et al., 2010). This coast is also susceptible to tsunamis generated by seismic-induced landslides.
• Arctic Coast: due to the sparsely populated Arctic coastal region, very little information is available regarding tsunami hazard. Generally, tsunami hazard on this coast is significantly less than the other coastal areas. In addition, the presence of sea ice cover would attenuate tsunami waves for a significant amount of the year. However, landslide generated tsunamis have been documented in the Disko Island region off western Greenland (Ruffman and Murty, 2006).
Researchers believe that the majority of loss of lives due to tsunami events in the Pacific Ocean over the past century occurred in areas where the tsunami waves reached the shore within 30 minutes of being triggered (Etkin et al., 2010). Thus, warning systems may be inadequate or ineffective for regions where the arrival time is very short.
2. Tsunami Mitigation Strategies
The threat to coastal regions from tsunami is the result of the high-depth and -velocity of the hydraulic bore. Mitigating against the effects of tsunamis can be achieved through: (1) public awareness; (2) installation of an early warning system; (3) an evacuation plan for communities located within inundation areas; (4) vertical evacuation; and (5) protective structures to reduce the impact on nearshore buildings. Depending on the population and usage of the coastal zone, one or more of the above strategies may be appropriate. The first three approaches are beyond the scope of this paper. The following sections focus on seawalls (protective structures) and vertical evacuation structures.
2.1. Sea Walls
Seawalls are typically constructed along the shoreline to prevent wave overtopping. They can also serve to prevent tsunami waves from reaching the shoreline or to reduce the hydrodynamic forces that will be imposed on structures that are located within the inundation zone. Therefore, seawalls should be reinforced to resist the loading imposed by tsunamis. The following are examples of seawalls that were built to mitigate the effect of tsunamis on coastal communities.
• Male Island, Maldives: High tides flooded the capital city of Male in 1987 and 1988. Consequently, a vertical seawall of approximately 1266 m in length was constructed in 1992 based on a disaster prevention plan. Wave-absorbing blocks were combined with the wall to reduce the impulsive force that results from wave breaking directly on the seawall (Kobelco, 2015). Figure 3 (a) provides a photo of the seawall.
• Taro, Japan: A concrete seawall as shown in Figure 3 (b) was built in 1958 to protect the town. The wall is one of the longest and tallest seawalls in the region with a length of approximately 2400 m and a height of more than 10 m. Prior to the March 2011 Tohoku Tsunami, the residents of Taro considered themselves protected as a result of living behind the seawall.
• Kunigami, Okinawa, Japan: Eight flared seawalls, similar to that shown in Figure 3 (c), were built in western Japan. This type of seawall provides better protection for coastal communities and the environment, protecting spawning grounds for sea turtles (Kobelco, 2015).
(a) (b)
(c)
Fig. 3 – Seawall structures: (a) around Male Island, Maldives (Pianc, 2009); (b) around Taro, Japan (UKY, 2015); and (c) flared seawall in Kunigami, Okinawa, Japan (Kobelco, 2015)

Page 4 of 10
2.2. Vertical Evacuation
During evacuation from low-lying areas to natural higher elevation provided by the surrounding terrain, there is a high probability that the population may encounter the tsunami. For this form of vertical evacuation, the evacuation should commence immediately following the earthquake motion. In such cases, the natural higher elevation should be within close proximity to inhabitants to be effective. Where this option is not available due to the topography or due to security restrictions (in industrial areas), the need for man-made vertical evacuation within the inundation zone arises. These evacuation structures can be either single-purpose or multi-purpose facility. Moreover, they should be earthquake- and tsunami-resistant, and encompass sufficient space to accommodate the expected number of users. In addition, the evacuation site should be higher than the estimated tsunami inundation depth at that location. It is critical that such sites be identifiable, and evacuation routes to these structures should be clearly provided with signage.
The single-purpose vertical evacuation shelters are structures that are designed and constructed to be used as tsunami refuge. Figure 4 (a) is a photo of a soil berm constructed in a community park in Sendai, Japan. Figure 4 (b) shows a Life-Saving Tower (Tasukaru Tower), which was developed by an industrial company in Japan as a simple and economical refuge structure. The platform of the tower sits at an elevation of 5.8 m above the ground level with a capacity of 50 people. Figure 4 (c) is a photo of a more aesthetically-pleasing elevated tsunami shelter at Shirahama Beach Resort, Japan.
(a) (b) (c) (d)
Fig. 4 – Tsunami evacuation structures (FEMA P-646, 2012): (a) soil berm at Sendai, Japan; (b) Life-Saving Tower; (c) Minamisanriku, Japan; and (d) Kesennuma Port, Japan
To date, there is no mandatory building code prescribing a detailed approach for the design and construction of tsunami-resistant structures. Okada et al. (2000 and 2005) provided a document (Structural Design Method of Buildings for Tsunami Resistance) which has been used for the design of vertical evacuation structures. Figure 4 (d) shows a residential building in Kesennuma, Japan, where the roof level is designated as an evacuation area in the event of a tsunami. The Federal Emergency Management Agency (FEMA) published the second edition of the Guidelines for Design of Structures for Vertical Evacuation from Tsunamis, known as FEMA P-646 (2012). The objective of FEMA P-646 was to develop guidance to design a structure to be earthquake- and tsunami-resistant
3. Performance of Mitigation Strategies during Recent Tsunamis
3.1. Seawalls
In this section, the performance of the walls during tsunami events is presented. Some seawalls that were impacted by tsunamis worked very well in protecting the coastal communities and remained intact, while others were severely damaged. These tsunami barriers, typically, were one of two types: (1) vertical or inclined concrete walls; or (2) compacted earth embankments lined with concrete slabs.
• The seawall of Male’s Island in Maldives (Figure 3(a)) served well for the community by protecting the administrative and economic activities. The concrete wall with the wave-absorbing blocks effectively protects the shore from the high sea levels and waves and is expected to prevent disasters (Kobelco, 2015). This conventional seawall around Male Island saved the island during the 2004 Indian Ocean Tsunami.
• During the 2004 Indian Ocean Tsunami, a small seawall in Sri Lanka remained mostly intact after being subjected to 4 m of tsunami inundation. The seawall is a revetment, covered with stone rubble

Page 5 of 10
(Figure 5 (a)). A small seawall also protected Taisei, a coastal town in Japan. The wall tilted seaward following the 2004 Indian Ocean Tsunami. Failure was initiated by the receding tsunami flow (Figure 5 (b)).
• During the 2011 Tohoku Tsunami, Kuji Harbor was protected by an 8.25 m high vertical seawall (Figure 5 (c)). Although the tsunami waves were higher than the seawall, the wall survived the event. The wall had several 10 m-wide openings to allow passage to the port. The sluice gates for those openings were between 6.45 to 6.80 m high. One of the gates was detached and transported approximately 60 m. The failed gate section was not effective in preventing subsequent tsunami waves from passing through the opening. This highlights two main points: (1) the seawall was able to withstand the tsunami waves that were higher than the design wave height; and (2) there is a need for better design of the gate lock mechanism to sustain the tsunami waves (Chock et al., 2013).
(a)
(b)
(c)
Fig. 5 – Seawall performances during tsunami: (a) seawall in Sri Lanka (Pianc, 2010); (b) Seawall in Taisei, Japan (Pianc, 2010); and c) seawall in Kuji after Tohoku Tsunami 2011 (Chock et al., 2013)
Based on recent tsunami experience, it can be concluded that seawalls can serve to mitigate the effects of tsunamis. Seawalls subjected to small tsunami wave heights performed as intended without failure and protected the coastal communities. Low-lying seawalls, which remained intact, were effective in reducing the tsunami flow velocities and flow momentum. Consequently, less damage was observed on the infrastructure located inland in comparison to structures located behind a totally damaged seawall.
3.2. Vertical Evacuation
Vertical evacuation buildings are designed to provide shelter in tsunami inundation zones by offering sufficient elevated space above the maximum estimated inundation depth. This type of shelter played a crucial role in reducing the loss of life during the 2011 Tohoku Tsunami. In Japan, buildings were designated for vertical evacuation provided they satisfied adequate construction standards (Hiroi et al., 2005). The key criteria for designation were: minimum height according to the estimated maximum tsunami inundation depth, Reinforced Concrete (RC) construction, and constructed after 1981 (the first significant update for seismic safety requirements in the building code in Japan). For example, an eight-storey RC frame apartment building and a two-storey RC government building in Kamaishi district, Japan, were designated as vertical evacuation shelters prior to the 2011 Tohoku Tsunami (Fraser et al., 2012).
4. Experimental Test Program and Facility
4.1. Testing Flume
The experimental program was conducted in a stainless steel High Discharge Flume (HDF) at CHC-NRC. The flume dimensions are: 14.56 m long, 2.70 m wide, and 1.20 m deep. A partition was installed at mid-width of the flume to reduce the active width to 1.35 m for the testing section. The flume is equipped with a hydraulic variable pitch pump that has a maximum discharge rate of 1.7 m
3/s. A swinging gate was
installed at the upstream end of the flume ensuring that 25.5 m3 of water could be impounded behind the
gate for the maximum impoundment depth of 1150 mm (Figure 6 (a)).
Page 6 of 10
(a)
(b)
(c)
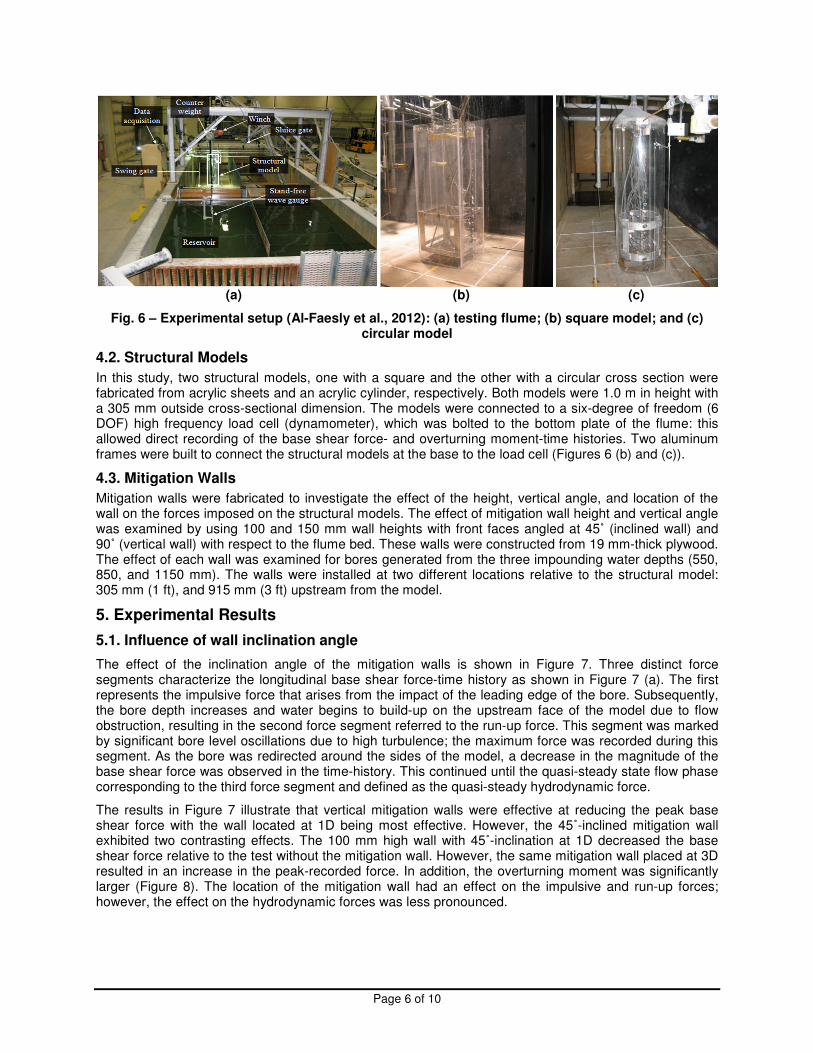
Fig. 6 – Experimental setup (Al-Faesly et al., 2012): (a) testing flume; (b) square model; and (c) circular model
4.2. Structural Models
In this study, two structural models, one with a square and the other with a circular cross section were fabricated from acrylic sheets and an acrylic cylinder, respectively. Both models were 1.0 m in height with a 305 mm outside cross-sectional dimension. The models were connected to a six-degree of freedom (6 DOF) high frequency load cell (dynamometer), which was bolted to the bottom plate of the flume: this allowed direct recording of the base shear force- and overturning moment-time histories. Two aluminum frames were built to connect the structural models at the base to the load cell (Figures 6 (b) and (c)).
4.3. Mitigation Walls
Mitigation walls were fabricated to investigate the effect of the height, vertical angle, and location of the wall on the forces imposed on the structural models. The effect of mitigation wall height and vertical angle was examined by using 100 and 150 mm wall heights with front faces angled at 45˚ (inclined wall) and 90˚ (vertical wall) with respect to the flume bed. These walls were constructed from 19 mm-thick plywood. The effect of each wall was examined for bores generated from the three impounding water depths (550, 850, and 1150 mm). The walls were installed at two different locations relative to the structural model: 305 mm (1 ft), and 915 mm (3 ft) upstream from the model.
5. Experimental Results
5.1. Influence of wall inclination angle
The effect of the inclination angle of the mitigation walls is shown in Figure 7. Three distinct force segments characterize the longitudinal base shear force-time history as shown in Figure 7 (a). The first represents the impulsive force that arises from the impact of the leading edge of the bore. Subsequently, the bore depth increases and water begins to build-up on the upstream face of the model due to flow obstruction, resulting in the second force segment referred to the run-up force. This segment was marked by significant bore level oscillations due to high turbulence; the maximum force was recorded during this segment. As the bore was redirected around the sides of the model, a decrease in the magnitude of the base shear force was observed in the time-history. This continued until the quasi-steady state flow phase corresponding to the third force segment and defined as the quasi-steady hydrodynamic force.
The results in Figure 7 illustrate that vertical mitigation walls were effective at reducing the peak base shear force with the wall located at 1D being most effective. However, the 45˚-inclined mitigation wall exhibited two contrasting effects. The 100 mm high wall with 45˚-inclination at 1D decreased the base shear force relative to the test without the mitigation wall. However, the same mitigation wall placed at 3D resulted in an increase in the peak-recorded force. In addition, the overturning moment was significantly larger (Figure 8). The location of the mitigation wall had an effect on the impulsive and run-up forces; however, the effect on the hydrodynamic forces was less pronounced.

Page 7 of 10
(a)
(b)
Fig. 7 – Base shear force-time histories imposed on the square model subjected to a bore
generated by the 850 mm impounding water depth with 100 mm mitigation walls installed at 1D
and 3D: (a) vertical wall; and (b) 45˚ inclined wall
(a)
(b)
Fig. 8 – Overturning moment-time histories imposed on the square model subjected to a bore generated by the 850 mm impounding water depth with 100 mm mitigation walls installed at 1D
and 3D: (a) vertical wall; and (b) 45˚ inclined wall
5.2. Influence of wall location
Two locations for the mitigation walls with respect to the location of the structure were investigated: 305 mm and 915 mm upstream from the structural models, designated as 1D and 3D, respectively, where D represents the cross-sectional dimension of the model (side length of the square model or diameter of the circular model). Figure 9 illustrates the base shear force- and base overturning moment-time histories
imposed on the circular model by the bore resulting from the 1150 mm impounding water depth. Three test configurations were investigated: without mitigation wall, which serves as the reference case; and 100 mm high, 45˚ inclined wall, denoted as 10W45 placed at 1D and 3D.
(a)
(b)
Fig. 9 – Circular model subjected to a bore generated by the 1150 mm impounding water depth
with 100 mm, 45˚-inclined mitigation walls installed at 1D and 3D: (a) base shear force-time
histories; and (b) base overturning moment-time histories
0
100
200
300
400
500
600
700
800
0 2 4 6 8 10 12 14 16 18 20
Fo
rce
Fx
(N
)
Time (s)
No wall
10W90@ 1D
10W90@ 3D
0
100
200
300
400
500
600
700
800
0 2 4 6 8 10 12 14 16 18 20
Fo
rce
Fx
(N
)
Time (s)
No wall
10W45@ 1D
10W45@ 3D
0
20
40
60
80
100
120
140
0 2 4 6 8 10 12 14 16 18 20
Mo
me
nt
(N.m
)
Time (s)
No wall
10W90@ 1D
10W90@ 3D
0
20
40
60
80
100
120
140
0 2 4 6 8 10 12 14 16 18 20
Mo
me
nt
(N.m
)
Time (s)
No wall
10W45@ 1D
10W45@ 3D
-100
0
100
200
300
400
500
600
0 2 4 6 8 10 12 14 16 18 20
Fo
rce
Fx
(N
)
Time (s)
No wall
10W45@1D
10W45@3D
High impulsive force
-50
0
50
100
150
200
250
300
0 2 4 6 8 10 12 14 16 18 20
Mo
me
nt
My
(N
.m)
Time (s)
No wall
10W45@1D
10W45@3D
High moment due to
the impulsive force
Runup force
Quasi-steady force
Impulsive force

Page 8 of 10
Figure 9 shows that 45˚ inclined mitigation wall at 3D increased the magnitude of impulsive force in comparison to the test with no mitigation wall. In addition, the corresponding base overturning moment increased relative to the wall at 1D.
Figure 10 shows the base shear force- and base overturning moment-time histories induced on the
circular model by the hydraulic bore generated from the 850 mm impounding water depth without and
with a vertical mitigation wall installed at 1D and 3D. The results highlight that the vertical mitigation wall
located at 1D is more effective in reducing the impulsive and maximum base shear forces, while neither
wall location was effective in reducing the overturning moment.
(a)
(b)
Fig. 10 – Circular model subjected to a bore generated by the 850 mm impounding water depth
with 100 mm, vertical mitigation walls installed at 1D and 3D: (a) base shear force-time histories;
and (b) base overturning moment-time histories
5.3. Influence of wall height
To investigate the effect of the height of the mitigation wall on the base shear force experienced by the structural models, two wall heights (100 and 150 mm) with eight different configurations considering wall location relative to the structural model (1D and 3D) and the vertical inclination angles (45˚ and 90˚) were tested. Figures 11 and 12 illustrate the base shear force-time histories recorded from those eight tests, in addition to the test results with no mitigation wall (reference case) for the 1150 mm impoundment depth.
(a)
(b)
Fig. 11 – Influence of vertical mitigation wall height on the base shear force-time history
experienced by the circular model: (a) wall placed at 1D; and (b) wall placed at 3D
-100
0
100
200
300
400
0 2 4 6 8 10 12 14 16 18 20
Fo
rce
Fx
(N
)
Time (s)
No wall
10W90@1D
10W90@3D
-20
0
20
40
60
80
100
0 2 4 6 8 10 12 14 16 18 20
Mo
me
nt
My
(N
.m)
Time (s)
No wall
10W90@1D
10W90@3D
0
100
200
300
400
500
600
700
800
0 2 4 6 8 10 12 14 16 18 20
Fo
rce
Fx
(N
)
Time (s)
No wall
10W90-1D
15W90-1D
0
100
200
300
400
500
600
700
800
0 2 4 6 8 10 12 14 16 18 20
Fo
rce
Fx
(N
)
Time (s)
No wall
10W90-3D
15W90-3D

Page 9 of 10
(a)
(b)
Fig. 12 – Influence of 45˚-inclined mitigation wall height on the base shear force-time history
experienced by the circular model: (a) wall placed at 1D; and (b) wall placed at 3D
The results show that the higher mitigation walls located closer to the structural model resulted in
marginally smaller base shear forces exerted on the structural model. However, the redirection of the
water bore towards the upper part of the model resulted in an increase in the base overturning moment.
6. Conclusions
The effect of mitigation walls on the base shear force and the base overturning moment that considered the effects of wall inclination angle, height, and location relative to structural models was investigated. The following conclusions are drawn from this experimental program:
• Location of the wall: the vertical mitigation wall placed at 1D was most effective at reducing the base shear force, but with a slight increase in the base overturning moment.
• Inclination angle of the wall: the 45˚-inclined mitigation wall placed at 3D increased the impulsive base shear force on the model and the impulsive overturning moment. The latter was a direct result of the bore impacting the structural model at a higher elevation. The best results were for the vertical wall located at 1D.
• Wall height: higher mitigation walls located near the structural model resulted in slightly smaller base shear forces exerted on the structural model. However, the redirection of the bore towards the upper part of the structural models resulted in an increase in the base overturning moment.
7. References
Al-Faesly, T., Palermo, D., Nistor, I., and Cornett, A., “Response of Structural Elements Subjected to Tsunami Hydrodynamic Forces,” International Journal of Protective Structures, Vol. (3), No. 4, 2012
Cherniawsky, J. Y., Titov, V. V., Wang, K., and Li, J. Y., “Numerical simulations of tsunami waves and currents for southern Vancouver Island from a Cascadia megathrust earthquake”, Pure and Applied Geophysics, 164 (2-3), 2007, 465-492
Chock, G., Robertson, I., Kriebel, D., Francis, M., and Nistor, I.,”Tohoku, Japan, Earthquake and Tsunami of 2011: performance of structures under tsunami loads”, e-book published by the American Society of Civil Engineers. 2013, pp. 366
Clague, J.J., A. Munro, and T. Murty, “Tsunami hazard and risk in Canada”, Natural Hazards, 28, 2003, 433-461
CNN. (2007). http://www.cnn.com/interactive/world/0502/gallery.tsunami.photos/frameset.exclude.html
Etkin D., “Canadians at risk: Our exposure to natural hazards, Canadian Assessment of Natural Hazards Project”, Report Published by Institute for Catastrophic Loss Reduction (ICLR), February 2010, 235p
FEMA P-646, ”Guidelines for Design of Structures for Vertical Evacuation from Tsunamis”, 4th edition, Federal Emergency Management Agency, 2012, Washington, DC., USA
0
100
200
300
400
500
600
700
800
0 2 4 6 8 10 12 14 16 18 20
Fo
rce
Fx
(N
)
Time (s)
No wall
10W45-1D
15W45-1D
0
100
200
300
400
500
600
700
800
0 2 4 6 8 10 12 14 16 18 20
Fo
rce
Fx
(N
)
Time (s)
No wall
10W45-3D
15W45-3D

Page 10 of 10
Fraser, S., Leonard, G., Matsuo, I. and Murakami, H., “Tsunami evacuation: Lessons from the Great East Japan earthquake and tsunami of March 11
th”, 2011, GNS Science Report 2012/17. 89 pp.
Gisler G, Weaver R, Gittings M, “Calculations of asteroid impacts into deep and shallow water”. Pure Appl Geophys 168, 2011, pp.1187–1198
Goldfinger, C., C.H. Nelson, J.E. Johnson, A.E., Morey, J. Gutiérrez-Pastor, E., Karabanov, A.T. Eriksson, E. Gràcia, G. Dunhill, J. Patton, R. Enkin, A. Dallimore, T. Vallier, and the Shipboard Scientific Parties, “Turbidite event history: methods and implications for Holocene paleoseismicity of the Cascadia subduction zone”, USGS Professional Paper, 2010, 1661-F
Hiroi, O., Abe, K., Kabeyasawa, T., Kawata, Y., Sugano, T., Tanaka, A., Yoshimura, H., “Guideline for Tsunami Evacuation Buildings”, Tokyo, Tsunami Evacuation Building Guideline Committee, Government of Japan Cabinet Office, 2005
Pianc Working Group 53,”Mitigation of Tsunami Disasters in Ports”, Pianc Report version III-4, December 2009. 116 pp.
Pianc, ”Mitigation of Tsunami Disasters in Ports”, Pianc Report No. 112, the World Association of Waterborn Transport Infrastructure, December 2010. 110 pp.
Kobelco, image of flaring seawall at Kunigami, Available at: http://www.kobelco.co.jp/ english/about _kobelco/csr/environment/2012/img/03_02.jpg [Accessed February 15, 2015]
Leonard, J., Hyndman, R.D. and G. C. R. TOWARDS A NATIONAL TSUNAMI HAZARD MAP FOR CANADA: TSUNAMI SOURCES L. Proceedings of the 9th U.S. National and 10th Canadian Conference on Earthquake Engineering, July 25-29, 2010, Toronto, Canada
Ludwin, R.S., R. Dennis, D. Carver, A.D. McMillan, R. Losey, J. Clague, C. Jonientz-Trisler, J. Bowechop, J. Wray, and K. James, 2005. Dating the 1700 Cascadia earthquake: great coastal earthquakes in Native stories, Seismological Research Letters, 76(2), 140-148
Nistor, I., Saatcioglu M. and Ghobarah, A. “Tsunami Hydrodynamic Impact Forces on Physical Infrastructures in Thailand and Indonesia”, Annual Conf. of the Canadian Society for Civil Eng., CSCE, 2006, Calgary, Canada
Okada T., Sugano T., Ishikawa T., Ohgi T., Takai S., and Hamabe C., Structural Design Method of Buildings for Tsunami Resistance (SMBTR), a code proposed by The Building Technology Research Institute of The Building Center of Japan, 2000
Okada T., Sugano T., Ishikawa T., Ohgi T., Takai S., and Hamabe C., Structural Design Method of Buildings for Tsunami Resistance (SMBTR), a code proposed by The Building Technology Research Institute of The Building Center of Japan, 2005
Palermo D., Nistor I. Al-Faesly T., and Cornett A. “Impact of Tsunami Forces on Structures: The University of Ottawa Experience”, Proceedings of the Fifth International Tsunami Symposium (ISPRA-2012) Tsunami Society International, 3-5 Sept. 2012, Joint Research Centre, Ispra, Italy
Ruffman, A., and T. Murty, “Tsunami hazards in the Arctic regions of North America, Greenland and the Norwegian Sea”, International Tsunami Society 3rd Tsunami Symposium, May 2006, 23-25, Honolulu, HI
Roger, J., M.A. Baptista, D. Mosher, H. Hébert, and A. Sahal, “Tsunami impact on Newfoundland,
Canada, due to far-field generated tsunamis: implications on hazard assessment”, this volume, 2010
Paper 1837, 6p
Takeuchi, K., Chavoshian, A., and Tanaka, S., Quick Report of Great Eastern Japan Earthquake and Tsunami, ICHARM, Tsukuba 305-8516, Japan, April, 2011
UKY, image of seawall Taro town, Japan, Available at: http://www.research.uky.edu/odyssey/features /karan.html [Accessed February 15, 2015]