remote measurement of atmospheric n_2o with a df laser lidar
TRANSCRIPT

Remote measurement of atmospheric N 20 with aDF laser lidar
J. Altmann, W. Lahmann, and C. Weitkamp
The ambient background concentration of N2 0 has been measured with a differential-absorption lidar usinga DF laser in multiline operation. Return signals from topographic targets at distances up to 8 km were de-tected. An abundance level of 0.29-ppm N2 0 was observed, in good agreement with previous in situ mea-surements.
1. IntroductionRemote sensing of atmospheric gases with lidar
techniques has been a growing field for several years.Since none of the major components of the atmosphere,but both lesser atmospheric constituents and most airpollutants, exhibit specific absorption bands in the IR,IR wavelengths are considered the most promisingspectral region for lidar measurements. It is now gen-erally accepted that adequate sensitivity, range, anddepth resolution can only be obtained with differentialabsorption and scattering, or DAS, lidar, which relieson the time-resolved detection of return signals gener-ated mainly by Mie backscattering from atmosphericdust particles and water droplets. Differential ab-sorption with the use of topographic targets (DAT)provides large return signals and long range but yieldsthe path-integrated concentration between the trans-mitter-receiver and target; a certain depth resolutionappears possible by choosing targets at different dis-tances along the same line of sight.
In the IR, DAS has been successfully tested only withintense CO2 lasers for measurement of H2 0,1 C2H4,2 and03.3 DAT has been reported for measurement of at-mospheric CO and CH4 and of SO 2 in cells at targetdistances of 100 and 300 m with an optical parametric
When this work was done all authors were with GKSS Fors-chungszentrum Geesthacht, Institut fur Physik, D-2054 Geesthacht,Federal Republic of Germany; J. Altmann is now with UniversitbtMarburg, Arbeitsgruppe Angewandte Physik und ExperimentelleBiophysik, D-3550 Marburg, Federal Republic of Germany.
Received 10 May 1980.0003-6935/80/203453-05$00.50/0.C 1980 Optical Society of America.
oscillator,4 -6 and HCl, CH 4 , and N2 0 have been mea-sured with a DF laser in a cell at a distance of 300 M.7
C2 H2 has been detected in a refinery flare at a 20-mdistance with an HF laser.8
This work describes the first remote measurement ofthe ambient background concentration of N2 0 withoutuse of a gas cell. A DF laser-based lidar system wasutilized that was constructed to explore the possibilitiesof the DF laser for detection of atmospheric gases. Inmultiwavelength operation the output of the DF laserat the lines of interest was so low that due to the smallbackscattering coefficient in the IR no DAS measure-ments were possible. However, DAT measurementsusing topographic targets were successful up to dis-tances of 8 km. With these target distances it waspossible to measure the low background concentrationof N2 0 in the atmosphere.
II. Principle of MeasurementThe lidar equation for reflection by a topographic
target with reflectivity p at a distance Zt is 9
P(z) = Po p expl-2 f x (z)dzi (Il. Zt L '
(1)
where Po and P are the transmitted and received pulsepower, respectively, A is the receiver area, and cx(z) isthe extinction coefficient at distance z. In the IR, ex-tinction is due to scattering and absorption by aerosolsand to absorption by the molecules of interest andpossibly other atmospheric gases. The extinctioncoefficient of the aerosols ae0 and the reflectivity p of thetarget can be considered constant for two adjacentwavelengths X1 and X0 within and outside of an ab-sorption line of the gas to be detected. If interferenceby another gas must be considered, the absorptioncoefficients at X0 and Xi are given by
a(X,) = ao + ai,(Xi)pl + a°2(i)P2, (i = 0, 1), (2)
15 October 1980 / Vol. 19, No. 20 / APPLIED OPTICS 3453
where p and P2 denote the partial pressures of the gasof interest and the interfering gas, respectively, andO(X ) and a°(Xi) the corresponding specific absorptioncoefficients.
Upon inserting Eq. (2) into Eq. (1) for both wave-lengths X0 and XA and dividing the resulting equations,one obtains
f l(z)dz X 1 in P(zt'Xo)Po(Xl)o la (i) - cai(Xo) 2 P(ztXj)Po(Xo)
-Ztp2[a2'(X,) - a2(Xo)]j (3)
Table 1. Specific Absorption of N20 and Water Under AtmosphericConditions at Two DF Laser Wavelengths
Specific absorption coefficient aaDF laser Wave numbera N2Ob Waterc
line cm-1 cm- 1 atm-1 cm- 1 atm-
P3(6) 2594.198 0.0811 24.7 X 10⁻⁶P3(7) 2570.522 1.33 23.0 X 10⁻⁶
a From Ref. 15.b From Ref. 12.c Line absorption including HDO from Ref.
sorption from Ref. 14.13, continuum ab-
where P2 has been assumed constant in space. Fromthe measurement of the ratios of the transmitted pulsepowers PO(Xo), Po(Xl) and the received pulse powersP(zt, X0), P(zt, XI), the determination of the path-inte-grated gas concentration is thus possible if the partialpressure P2 of the interfering gas and the specific ab-sorption coefficients are known.
The wavelength-dependent measurement of thetransmitted pulse powers can be circumvented by tak-ing the ratios of the received power from various targetdistances. With the assumption of a homogeneouslydistributed gas concentration (as in the case of the at-mospheric N20), Eq. (3) can be modified to
ln P(Zt, X) = -2Ip,[a(X) - a(Xo)]P(Zt,X0)
+ P2[a2*(Xl) - a2(Xo)lzt + n Po(Xi) (4)
If the ratio of the laser power at wavelengths X and Xo,Po(X,)/Po(Xo), is constant, an assumption that must beverified in each practical case, the left-hand side of Eq.(4) plotted vs Zt is a straight line. Its slope divided by-2 gives the differential absorption coefficient
Aa Pl[a(X,) - a(Xo)] + P2[a(X - a2*(Xo)], (5)
or
1 = A ; Aa - P2[a2*(Xi) - a2(Xo)jj. (6)
For known partial pressure P2 of the interfering gas thepartial pressure pi of the gas of interest can thus bedetermined.
For the detection of N20 with a DF laser, the P3(7)laser line is well suited since it shows strong absorption,according to Ref. 10, in which absorption of several DFlaser lines by atmospheric constituents was studied. Anappropriate off-resonance wavelength 0 is the neigh-boring P3 (6) emission line. At these two wavelengthsthere is no interference from CH4 or C0 2, but interfer-ence must be taken into account with H 20 and HDO(line and continuum absorption) and with the N2 con-tinuum.
The difference in the absorption coefficients of theN2 continuum at 1-atm air pressure and 10'C temper-ature is 0.002 km-' according to Ref. 11, which corre-sponds to an apparent 6% increase in the N20 differ-ential absorption. Table I lists the specific absorptioncoefficients of N20 and water for the two DF lines. For
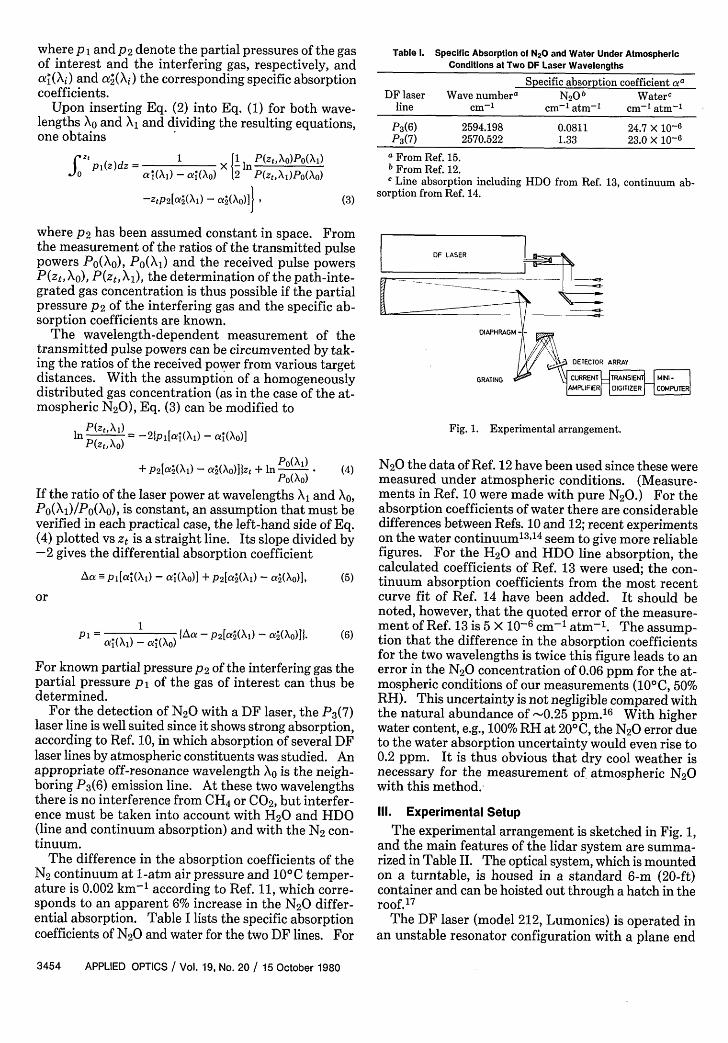
Fig. 1. Experimental arrangement.
N20 the data of Ref. 12 have been used since these weremeasured under atmospheric conditions. (Measure-ments in Ref. 10 were made with pure N20.) For theabsorption coefficients of water there are considerabledifferences between Refs. 10 and 12; recent experimentson the water continuum13" 4 seem to give more reliablefigures. For the H20 and HDO line absorption, thecalculated coefficients of Ref. 13 were used; the con-tinuum absorption coefficients from the most recentcurve fit of Ref. 14 have been added. It should benoted, however, that the quoted error of the measure-ment of Ref. 13 is 5 X 10⁻⁶ cm-' atm-1. The assump-tion that the difference in the absorption coefficientsfor the two wavelengths is twice this figure leads to anerror in the N20 concentration of 0.06 ppm for the at-mospheric conditions of our measurements (100C, 50%RH). This uncertainty is not negligible compared withthe natural abundance of -0.25 ppm.' 6 With higherwater content, e.g., 100% RH at 20'C, the N20 error dueto the water absorption uncertainty would even rise to0.2 ppm. It is thus obvious that dry cool weather isnecessary for the measurement of atmospheric N20with this method.
Ill. Experimental SetupThe experimental arrangement is sketched in Fig. 1,
and the main features of the lidar system are summa-rized in Table II. The optical system, which is mountedon a turntable, is housed in a standard 6-m (20-ft)container and can be hoisted out through a hatch in theroof.17
The DF laser (model 212, Lumonics) is operated inan unstable resonator configuration with a plane end
3454 APPLIED OPTICS / Vol. 19, No. 20 / 15 October 1980

Table 11. Specifications of the Mobile DF Laser Lidar System
DF laser:Pulse power (all lines)Pulse durationBeam diameterBeam divergence (full angle, 50% of energy)
Lidar system optics:Expanded beam diameterExpanded beam divergenceTransmitter-receiver arrangementReceiving mirror diameterReceiving mirror focal length
Polychromator:Diameter of entrance diaphragmGrating sizeNumber of groovesOff-axis mirror focal length
InSb detector array:TypeNumber of elementsSize of each element
(n
o
0
0((1
0I-0W; ,0I-w
500 kW0.5 psec38mm1 mrad
150 mm0.25 mrad
coaxial600 mm
3m
2 mm102 X 128 mm
300/mm150 mm
Photovoltaic20
0.2 X 0.4 mm
40 41 4240 41 42 Z
GRATING ANGLE,
mirror. In this mode multiline DF laser emission isobserved on -20 P transitions in the 3 - 2, 2 - 1, and1 - 0 vibrational bands of DF covering the 3.5-4.0-pumwavelength range. The backscattered radiation is fo-cused by a 600-mm diam parabolic mirror and entersa polychromator through a 2-mm diam diaphragm.This diaphragm effects a purely geometrical compres-sion of the lidar signal dynamics.' 8"19 The polychro-mator provides images of the entrance diaphragm in theexit plane, one for each laser line. The design chosenensures both sufficient dispersion and an image for-mation with reduction in scale so that the differentimages in the exit plane do not overlap but are suffi-ciently small to be seen by the small elements of thedetector array that is placed in the exit plane. Thepolychromator consists of a large plane grating that isdivergently illuminated20 and a large off-axis parabolicmirror that provides the required reduction in imagesize.
43Jeg
Figure 2 shows a spectrum of the dispersed returnsignals from a topographic target at a distance of 4 kmvs grating rotation angle as registered by one detectorelement at a fixed position. In Fig. 3 part of the spec-trum is reproduced as taken by varying the detectorposition at a fixed angle of the grating. The positionof the detector array is also indicated: the P3 (6) ref-erence line falls on element 6, the signal line P3(7) isdetected by element 10. The output current of thephotovoltaic detectors is converted to voltage and am-plified in specially designed fast amplifiers.2' Extremecare was necessary to keep rf interferences from thelaser high-voltage discharge off the amplifiers. Theanalog signals are digitized in a fast transient recorder(Biomation 8100) and transferred to a minicomputer(PDP 11/34) for further handling, such as integration,ratioing, and averaging (usually over twenty shots).
P. (7) P, (6) Fig. 2. Spectrum of DF laser re-
,! z nturn signal from the topographic
1° (3l P (S target at a 4-km distance with a
f.,! 1 i X jfixed detector position.
44rees
IV. Results
For the N 20 measurements the lidar container wasplaced on the site of the GKSS research center on thetop of the northern slope of the river Elbe, some 45 mabove and overlooking the marshland south of the river.Single trees or small forests at distances between 0.3 and8 km were used as reflectors. With a carefully alignedTV camera with a telelens installed to monitor the lidarfield of view, targets of suitable reflectivity could bechosen. The correct wavelength assignment and de-tector position were confirmed by injecting N20 froma gas cylinder into the stray light shielding of thetransmitting optics. With N20 in the optical path, theP3(7) signal on element 10 disappeared, whereas thereference pulse on element 6 did not change. When theN20 injection was stopped, the P3(7) signal returned asthe gas diffused.
15 October 1980 / Vol. 19, No. 20 / APPLIED OPTICS 3455
1t
P(8) 1
P 6) PS)\ i
-O~J ' I / VOJ
.

P3 F (8)
210
O
w0
0
0 2 6 8POSITION ALONG DETECTOR AXIS, mm
Fig. 3. DF laser spectrum around the P3 (7) line from a topographictarget at 4km with a fixed grating angle. Position of twenty-element
detector for DAT measurement is also indicated.
Figure 4 shows examples of return signals from tar-gets at distances of 0.3,4, and 8 km. The measurementswere made on 2 days. On 29 Nov. 1979, the air tem-perature was 100C, the relative humidity 46%, thepressure 1002 mbar, and the visibility -8 km. Twoseries of measurements using reflector distances be-tween 1.4 and 8 km were made. On 4 Dec. 1979, the airtemperature rose from 10'C in the morning to 12'C atnoon and then fell to 11IC, the humidity decreased from75 to 67%, the air pressure was 1010 mbar, and the vis-ibility was .20 km. Topographic reflectors at distancesbetween 0.3 and.8 km were used, and three sets of datawere obtained.
As an example, Fig. 5 shows the result of one series ofmeasurements. The decrease of the average ratio of thereturn pulse energies at the two laser wavelengths isplotted on a logarithmic scale vs reflector distance. Thepoints are averages of four measurements of twentylaser pulses each. As described in Sec. II, the slope ofthe straight line, which is equal to -Aca/2, is used for thedetermination of the concentration of N20 accordingto Eq. (6). Interferences from water and N2 have beentaken into account, whereas contributions from otheratmospheric gases need not be considered.
The concentration of atmospheric N20 thus obtainedis cN2O = (0.29 i 0.06) ppm. This value is in goodagreement with the published literature data -0.25ppm. 6
As discussed, the quoted error is mainly due to theuncertainty of the specific absorption coefficient ofwater vapor at the two DF laser lines used. For mea-surements at very low humidity the remaining error isdominated by the scatter of line energy ratios for con-secutive pulses. Although the mean deviation of thetwenty signal ratios of each measurement from the av-erage was 5% for short and medium distances and 15%
for the largest target distance of 8 km, the ratio wastreated as constant. The scatter of the ratios at thepower received from one distance can be corrected forby pulse-to-pulse normalization to the output energies.The ratio of output energies at the two wavelengths canbe measured with the same polychromator and signalprocessing circuits as used for the received signals if aportion of the transmitted light enters the polychrom-ator. This normalization was not performed in thepresent measurement because of the rf interference with
C
aa-
0
DISTANCE, km
Fig. 4. Return signal from topographic target at 0.3 (a), 4 (b), and7.5 km (c); (c) is the average of ten pulses. The beginning of the traces
shows heavy rf interference from laser firing.
3456 APPLIED OPTICS / Vol. 19, No. 20 / 15 October 1980
I D 11:1

C0,2
0
O 5 10DISTANCE, km
Fig. 5. Logarithm of the average ratio of the backscattered energy
of the N20 signal line [P3(7), A] to the reference line [P3 (6), B] vs thedistance of the topographic target.
the InSb detector signals at the time immediately afterthe firing of the laser (Fig. 4).
V. ConclusionIn this work the remote measurement of atmospheric
N20 using the DAT technique has been demonstrated.Although not a pollutant, N20 was chosen because ofthe magnitude (0.25 ppm) and small spatial and tem-poral variation (<10%) of its concentration and for itsabsorption coefficient of the P3 (7) line of deuteriumfluoride.
The apparatus used consists of a pulsed DF laser andreceiving and detection equipment suited for routinepollution monitoring. Variations of the ratio of thepower emitted at different wavelengths limited thepresent concentration measurement to an accuracy of
-I15%, but 2% precision in the measurement of theround-trip absorption appears feasible by pulse-to-pulse normalization of the signals received at bothwavelengths to the laser output power and again aver-aging over several shots.
Because the laser was operated in a multiline mode,too little pulse energy was available at the two lines ofinterest to allow DAS, i.e., depth-resolved measure-ments using distributed reflection. -This is because,according to recent measurements2 2 and in contradic-tion to current assumptions,23 the volume backscat-tering coefficient, which determines the fraction ofbackscattered radiation in DAS, is only of the order of10-4 km-' sr-'. An increase in the laser pulse energyby a factor of -10 appears adequate for operation of thesystem in a DAS regime, part of which may be obtainedwith single-line operation of the laser.
At least for two important pollutants, namely, HCl(ref. 24) and SO2 (ref. 25) with specific absorptioncoefficients of 5.64 for the P2(3) and 0.44 cm'1 atm-'for the P4(6) laser line, the DF laser may thus fulfill theexpectations as a valuable tool for remote monitoringof emissions.
References1. E. R. Murray, R. D. Hake, Jr., J. E. van der Laan, and J. G.
Hawley, Appl. Phys. Lett. 28, 542 (1976).2. W. Baumer, K. W. Rothe, and H. Walther, "Range Resolved
Measurements of Atmospheric Pollutants," in 9ILRC NinthInternational Laser Radar Conference, 2-5 July 1979, Munich,Conference Abstracts (DFVLR, Oberpfaffenhofen, 1979), pp.200-202.
3. K. Asai, T. Itabe, and T. Igarashi, Appl. Phys. Lett. 35, 60(1979).
4. T. Henningsen, M. Garbuny, and R. L. Byer, Appl. Phys. Lett.24, 242 (1974).
5. R. A. Baumgartner and R. L. Byer, Opt. Lett. 2, 163 (1978).6. R. A. Baumgartner and R. L. Byer, Appl. Opt. 17, 3555 (1978).7. E. R. Murray, J. E. van der Laan, and J. G. Hawley, Appl. Opt.
15, 3140 (1976).8. K. Giirs and G. Schweizer, "Determination of Hydrocarbon
Emissions of Refinery Flares using the Method of ComparativeAbsorption Measurements by Means of Laser," BMI-BMFT-DGMK Project 135, Subproject 135-04 (DGMK, Hamburg,1978).
9. R. L. Byer, Opt. Quantum Electron. 7, 147 (1975).10. D. J. Spencer, G. C. Denault, and H. H. Takimoto, Appl. Opt. 13,
2855 (1974).11. D. E. Burch, D. A. Gryvnak, and J. D. Pembrook, "Investigation
of the Absorption of Infrared Radiation by Atmospheric Gases:Water, Nitrogen, Nitrous Oxide," AFCRL-71-0124, Aeronutro-nics (January 1971); the N2 continuum data used here are re-produced in Ref. 10.
12. F. S. Mills, Dissertation, Ohio State U., Columbus (1975).13. K. 0. White, W. R. Watkins, C. W. Bruce, R. E. Meredith, and
F. G. Smith, Appl. Opt. 17, 2711 (1978).14. W. R. Watkins, K. 0. White, L. R. Bower, and B. Z. Sojka, Appl.
Opt. 18, 1149 (1979).15. W. Heath, Dissertation, Ohio State U., Columbus (1976).16. C. Junge and J. Hahn, J. Geophys. Res. 76, 8143 (1971).17. C. Weitkamp, J. Harms, W. Lahmann, and W. Michaelis, Soc.
Photo-Opt. Instrum. Eng. 164, 109 (1979).18. J. Harms, W. Lahmann, and C. Weitkamp, Appl. Opt. 17, 1131
(1978).19. J. Harms, Appl. Opt. 18, 1559 (1979).20. M. V. R. K. Murty, J. Opt. Soc. Am. 52, 768 (1962).21. J. Altmann, S. Kbhler, and W. Lahmann, submitted to J. Phys.
E.22. P. M. Livingston, Appl. Opt. 17, 818 (1978).23. R. T. H. Collis and P. B. Russell, "Lidar Measurements of Par-
ticles and Gases by Elastic Backscattering and Differential Ab-sorption," in Laser Monitoring of the Atmosphere, E. D. Hinkley,Ed. (Springer, Berlin, 1976), pp. 71-151.
24. C. H. Bair and F. Allario, Appl. Opt. 16, 97 (1977).25. J. Altmann and P. Pokrowsky, Appl. Opt. 19, 3449 (1980).
15 October 1980 / Vol. 19, No. 20 / APPLIED OPTICS 3457