remaining service life asset measure, phase 1
TRANSCRIPT

REMAINING SERVICE LIFE ASSET MEASURE, PHASE 1
Mihai Marasteanu, Principal InvestigatorDepartment of Civil, Environmental, and Geo- Engineering University of Minnesota
July 2018
Research ProjectFinal Report 2018-23
• mndot.gov/research

To request this document in an alternative format, such as braille or large print, call 651-366-4718 or 1-800-657-3774 (Greater Minnesota) or email your request to [email protected]. Please request at least one week in advance.

Technical Report Documentation Page 1. Report No. 2. 3. Recipients Accession No.MN/RC 2018-23 4. Title and Subtitle 5. Report Date
Remaining Service Life Asset Measure, Phase 1 July 2018 6.
7. Author(s) 8. Performing Organization Report No.Ravi Kumar, Jhenyffer Lorrany Matias de Oliveira, Arturo Schultz Mihai Marasteanu 9. Performing Organization Name and Address 10. Project/Task/Work Unit No.
Civil, Environmental and Geo-Engineering University of Minnesota, Twin Cities 500 Pillsbury Drive, Minneapolis, MN
CTS#2018007 11. Contract (C) or Grant (G) No.
(C) 1003325 (WO) 33
12. Sponsoring Organization Name and Address 13. Type of Report and Period Covered
Minnesota Department of Transportation Research Services & Library 395 John Ireland Boulevard, MS 330 St. Paul, Minnesota 55155-1899
Final Report 14. Sponsoring Agency Code
15. Supplementary Noteshttp://dot.state.mn.us/research/reports/2018/201823.pdf
16. Abstract (Limit: 250 words)
There is a critical need to use a common metric, such as a service life parameter, across many different types of infrastructure assets. MnDOT has used the remaining service life (RSL) measure for pavement condition for several years and is starting to use it for bridge condition. In this study, researchers examined what has been done to date and what tools and methodologies are available nationally and internationally, and made recommendations on a future measure that can be used to show the "true" condition of the system. First, a literature review was performed to summarize current methods used in asset management and life-cycle cost analyses. A survey was also performed to collect information from agencies around the country. An assessment of current practice used by MnDOT Bridge Office and Materials and Road Research Office was performed next to identify similarities and differences between the two approaches. Based on the information collected, suggestions for a common method were presented and guidelines for a work plan for a follow-up phase 2 were developed.
17. Document Analysis/Descriptors 18. Availability StatementPavement management systems, Bridge management systems, Service life, Maintenance management
No restrictions. Document available from: National Technical Information Services, Alexandria, Virginia 22312
19. Security Class (this report) 20. Security Class (this page) 21. No. of Pages 22. PriceUnclassified Unclassified 62

REMAINING SERVICE LIFE ASSET MEASURE, PHASE 1
FINAL REPORT
Prepared by:
Ravi Kumar
Jhenyffer Lorrany Matias de Oliveira
Arturo Schultz
Mihai Marasteanu
Department of Civil, Environmental, and Geo- Engineering
University of Minnesota
JULY 2018
Published by:
Minnesota Department of Transportation
Research Services & Library
395 John Ireland Boulevard, MS 330
St. Paul, Minnesota 55155-1899
This report represents the results of research conducted by the authors and does not necessarily represent the
views or policies of the Minnesota Department of Transportation and/or the University of Minnesota. This report
does not contain a standard or specified technique.
The authors and the Minnesota Department of Transportation and/or the University of Minnesota do not endorse
products or manufacturers. Trade or manufacturers’ names appear herein solely because they are considered
essential to this report.

ACKNOWLEDGMENTS
The financial support provided by the Minnesota Department of Transportation is gratefully
acknowledged.
The guidance provided by the project technical advisory panel, and in particular by the project
champion, Glenn Engstrom, are acknowledged.

TABLE OF CONTENTS
CHAPTER 1: INTRODUCTION ...............................................................................................................1
1.1 Background ......................................................................................................................................... 1
1.2 Objective ............................................................................................................................................. 1
1.3 Organization of the Report ................................................................................................................. 1
CHAPTER 2: LITERATURE REVIEW .......................................................................................................2
2.1 Bridge Literature Review .................................................................................................................... 2
2.1.1 Performance Measures ............................................................................................................... 2
2.1.2 Bridge Life Expectancy................................................................................................................. 8
2.2 Pavement Literature Review ............................................................................................................ 10
2.2.1 Performance Measures ............................................................................................................. 10
2.2.2 Reformulated Pavement Remaining Service Life ...................................................................... 14
2.3 Survey to assess methods used in asset management programs. ................................................... 15
CHAPTER 3: ASSESSMENT OF CURRENT PRACTICE ............................................................................. 17
3.1 Bridge Management ......................................................................................................................... 17
3.2 Pavement Management ................................................................................................................... 19
3.3 Conclusions ....................................................................................................................................... 21
CHAPTER 4: DEVELOP WORK PLAN FOR PHASE 2 ............................................................................... 23
4.1 Survey Results ................................................................................................................................... 23
4.1.1 Bridge Management Survey Results ......................................................................................... 23
4.1.2 Pavement Management Survey Results ................................................................................... 25
4.2 Task 2 Results ................................................................................................................................... 26
4.3 Work Plan for Phase 2 ...................................................................................................................... 27
CHAPTER 5: CONCLUSIONS AND RECOMMENDATIONS ..................................................................... 30
REFERENCES .................................................................................................................................... 31
APPENDIX A: SURVEY TO ASSESS METHODS USED IN ASSET MANAGEMENT PROGRAMS

LIST OF FIGURES
Figure 2.1 The concept of Lowest Life-Cycle Cost....................................................................................... 11
Figure 2.2 Minimal acceptable performance levels for lowest life-cycle cost ............................................ 12
Figure 4.1 Remaining Service Life Distribution (from Annual Minnesota Transportation Performance Report, 2015) .............................................................................................................................................. 26
Figure 4.2 Hypothetical Percent Service Life Distribution .......................................................................... 28
LIST OF TABLES
Table 2.1 United States of America Performance measures (Patidar et al., 2007a). ................................... 2
Table 2.2 NBI condition state rating (Patidar et al., 2007b) ......................................................................... 4
Table 2.3 Values of 𝑘𝑠 (Adams and Kang, 2009) ........................................................................................... 6

EXECUTIVE SUMMARY
There is a critical need to use a common metric, such as a service life parameter, across many different
types of infrastructure assets. In this investigation, preliminary work was performed to determine if a
common metric, such as a service life parameter, can be used across MnDOT’s bridge and pavement
assets. MnDOT has used remaining service life (RSL) for pavement condition for several years and has
started to use RSL for bridge condition.
First, a literature review was performed to summarize current methods used in asset management
followed by a survey used to collect information to understand the methods used by different DOTs in
their asset management programs. It was found that both MnDOT Bridge Office and Materials and
Research Office have very good management systems in place, compared to current systems reported
by other agencies.
Next, an assessment of current practice used in MnDOT Bridge Office and Materials and Research Office
was performed. It was found that both systems calculate RSL. However, the RSL value for bridges is
determined using different criteria than for pavements. The use of RSL in the two systems is also
different. However, there is very good potential to develop a new common metric that could be used by
both offices.
Based on the information collected, the research team recommended using Percent Remaining Service
Interval (PRSI) as a common metric. By using this common metric, it may be possible to propose target
average values that result in optimal life-cycle costs and use the concept of even distribution of the
values to make planning more consistent from year to year.
The research team also recommended using two additional metrics that could help fine-tune investment
strategies: Asset Sustainability Ratio and Deferred Preservation Liability (or Cost of Inadequate Funding).
A follow up phase two would consist of the following activities: obtain relevant data to calculate PRSI for
different categories of pavements and bridge decks, relate different levels of PRSI to funding
requirements, estimate how much time and funding is required to bring the system to a stable
configuration of even distribution of PRSI, which allows for more consistent planning, determine
optimum activities that could result in a more efficient use of funding, and explore the use of additional
metrics, such as those mentioned above, for both bridge and pavement offices.

1
CHAPTER 1: INTRODUCTION
1.1 BACKGROUND
In an era where system needs across all infrastructure components exceed available funding, planners
and decision makers need tools to make informed decisions about the value of their assets. There is a
critical need to use current data that is generated using different methods and convert it to a common
metric, such as a service life parameter, that can be used across many different types of assets. Using a
common service life parameter represents an important step in providing planners with simple but
efficient tools to make more informed decisions and, therefore, optimize the use of available funds.
1.2 OBJECTIVE
MnDOT has used the remaining service life (RSL) measure for pavement condition for several years and
is starting to use it for bridge condition. However, much work remains to be done. The purpose of this
study is to examine what has been done to date, what tools and methodologies are available nationally
and internationally, and make recommendations on a future measure that can be used to show the
"true" condition of the system.
1.3 ORGANIZATION OF THE REPORT
First, a literature review is performed to summarize the current methods used in asset management and
life-cycle cost analyses. The literature review also includes a survey used to collect information from
DOTs around the country to understand the methods used in their asset management programs.
Then, an assessment of current practice used in MnDOT Bridge Office and Materials and Road Research
Office is performed to identify similarities and differences between the two approaches.
In Chapter 4, based on the information presented in the previous chapters, suggestions for a common
method are presented, and implementation guidelines, that require minimum changes to the existing
system, together with a work plan for a phase 2, are developed.
A summary of the work performed in this investigation followed by the most relevant conclusions and
recommendations are provided in Chapter 5.

2
CHAPTER 2: LITERATURE REVIEW
MnDOT has used the remaining service life (RSL) measure for pavement condition for several years and
is starting to use it for bridge condition, however much work remains to be done. In this chapter, a
literature review is performed on current methods used in asset management for pavements and
bridges. The chapter also includes a survey that was distributed to understand the methods used by
departments of transportation in their asset management programs.
2.1 BRIDGE LITERATURE REVIEW
The literature addresses both performance measures as well as bridge life expectancy.
2.1.1 Performance Measures
Performance measures are indicators used to express condition or status of assets or services. Usually,
for highway bridges, performance measures have their bases in structural deficiency (SD) or general
condition ratings (Hearn, 2015). Some of the performance measures used for assessing and expressing
the condition of the bridges are listed below (Lake and Seskis, 2013):
Canadian Bridge Performance Indicators: 1. Bridge condition index (BCI)
Australian Bridge Performance Indicators: 1. Condition Rating 2. VicRoads Bridge Condition Number (BCN) 3. TMR Bridge Condition 4. RMS Bridge Health Indicator 5. RMS Deterioration Modeling Indexes 6. DTEI Bridge Health Index
For US, the performance measures are shown in Table 2.1.
Table 2.1 United States of America Performance measures (Patidar et al., 2007a).
Goal Performance measures
1. Preservation of bridge
condition
(a) Condition ratings
(b) Health index
(c) Sufficiency rating
2. Traffic safety enhancement (a) Geometric rating/functional obsolescence
(b) Inventory rating or operation rating

3
3. Protection from extreme
events
(a) Scour vulnerability rating
(b) Fatigue/fracture criticality rating
(c) Earthquake vulnerability rating
(d) Other disaster vulnerability rating (collision, overload, human-
made)
4. Agency cost minimization (a) Initial cost
(b) Life-cycle agency cost
5. User cost minimization (a) Life-cycle user cost
A summary of the performance measures for the prevention of the bridges that are commonly used in
the USA is presented below.
AASHTO Bridge Sufficiency Rating
AASHTO defines a sufficiency rating (SR) as the combination of the functional and condition data into a
single number from 0 to 100 % by combining four separate factors (Lake & Seskis, 2013). One hundred
percentage represents an entirely sufficient bridge, and an SR (Sufficiency Rating) value of 0 represents
an entirely insufficient or deficient bridge. Sufficiency Rating is calculated as follow (Patidar, Labi, Sinha
& Thompson, 2007b).
𝑆𝑅=𝑆1+𝑆2+𝑆3−𝑆4
Where:
S1 = structural adequacy and safety (55 maximum)
S2 = serviceability and functional obsolescence (30 maximum)
S3 = essentiality for public use (15 maximum)
S4= special reductions (13 maximum)
This rating emphasizes the functional and geometric characteristics of the bridge and doesn’t intend to
provide an overall rating for the bridge (Lake & Seskis, 2013). This rating is no longer used in the United
States but was superseded by the Moving Ahead for Progress in the 21st Century Act (MAP-21) (Chase,
Adu-Gyamfi, Aktan, & Minaie, 2016). The inspector rated each of the key components of the bridge by
identifying a deterioration that best described the condition of the component.
4
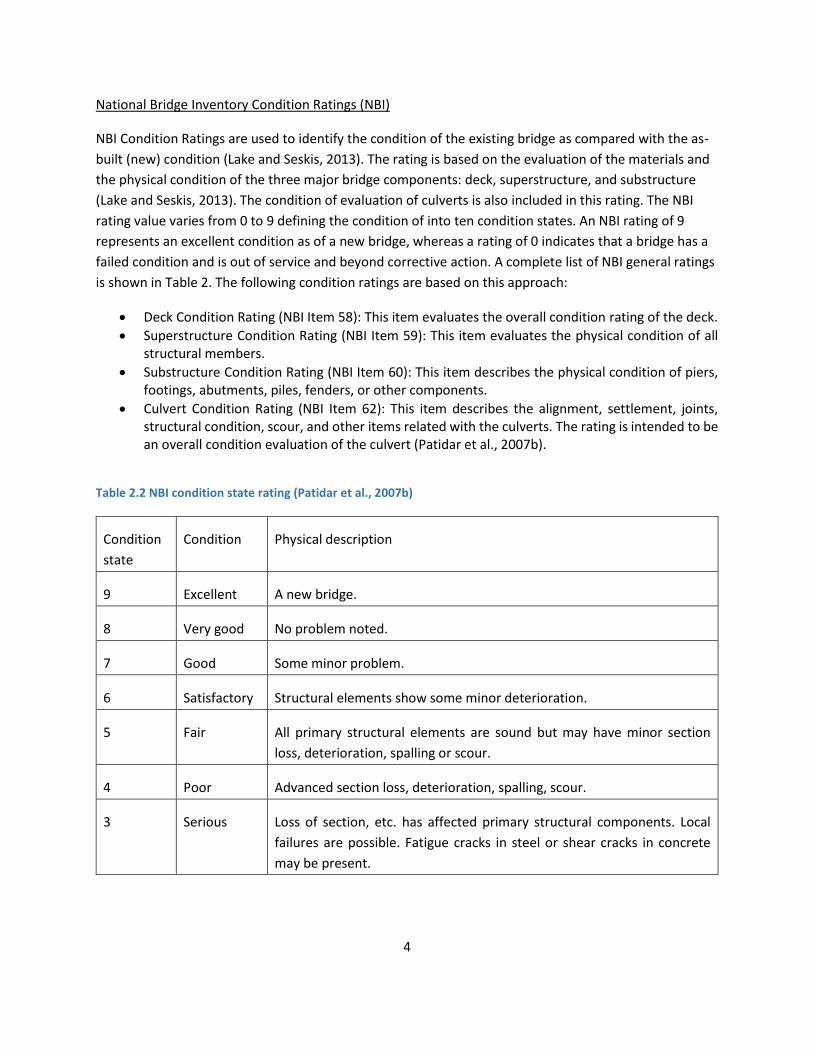
National Bridge Inventory Condition Ratings (NBI)
NBI Condition Ratings are used to identify the condition of the existing bridge as compared with the as-
built (new) condition (Lake and Seskis, 2013). The rating is based on the evaluation of the materials and
the physical condition of the three major bridge components: deck, superstructure, and substructure
(Lake and Seskis, 2013). The condition of evaluation of culverts is also included in this rating. The NBI
rating value varies from 0 to 9 defining the condition of into ten condition states. An NBI rating of 9
represents an excellent condition as of a new bridge, whereas a rating of 0 indicates that a bridge has a
failed condition and is out of service and beyond corrective action. A complete list of NBI general ratings
is shown in Table 2. The following condition ratings are based on this approach:
Deck Condition Rating (NBI Item 58): This item evaluates the overall condition rating of the deck.
Superstructure Condition Rating (NBI Item 59): This item evaluates the physical condition of all structural members.
Substructure Condition Rating (NBI Item 60): This item describes the physical condition of piers, footings, abutments, piles, fenders, or other components.
Culvert Condition Rating (NBI Item 62): This item describes the alignment, settlement, joints, structural condition, scour, and other items related with the culverts. The rating is intended to be an overall condition evaluation of the culvert (Patidar et al., 2007b).
Table 2.2 NBI condition state rating (Patidar et al., 2007b)
Condition
state
Condition Physical description
9 Excellent A new bridge.
8 Very good No problem noted.
7 Good Some minor problem.
6 Satisfactory Structural elements show some minor deterioration.
5 Fair All primary structural elements are sound but may have minor section
loss, deterioration, spalling or scour.
4 Poor Advanced section loss, deterioration, spalling, scour.
3 Serious Loss of section, etc. has affected primary structural components. Local
failures are possible. Fatigue cracks in steel or shear cracks in concrete
may be present.

5
2 Critical Advanced deterioration of primary structural elements. Fatigue cracks in
steel or shear cracks in concrete may be present or scour may have
removed structural support. Unless closely monitored it may be necessary
to close the bridge until corrective action is taken.
1 Imminent
failure
Major deterioration or loss of section in critical structural components or
obvious vertical or horizontal movement affecting structural stability.
Bridge is closed to traffic but corrective action may put back in light
service.
0 Failed Out of service and beyond corrective action.
An NBI rating of 4 or less is considered structurally deficient. The NBI rating presents the localized
condition of the major elements, but does not represent the overall condition of the bridge (Lake &
Seskis, 2013). It provides information on the severity of a condition but doesn’t quantify the degree of
the severity (Lake & Seskis, 2013).
Some states have developed their own performance measures. A few of them are presented below.
California Bridge Health Index (BHI)
BHI was developed by CALTRANS and is a single number assessment of a bridge’s condition based on the
economic worth of bridge. This index is assessed from the element level inspection as the ratio of
current to the initial value of all elements on the bridge (Lake & Seskis, 2013). BHI varies from 0 (worst
possible condition) to 100 (best condition). This index is an element condition-based measure. Element-
level inspection captures the conditions of more detailed components (Chase et al., 2016). For example,
instead of rating the condition of the whole deck, superstructure, or substructure (like in the NBI case),
the element level rates the condition of the individual components of the deck, superstructure or
substructure, respectively (Chase et al., 2016). AASTHO’s Guide for Commonly Recognized (CoRe)
Structural Elements defines a default set of structural elements for use in performing the bridge
inspection. Typically, various states use a customized/modified version of these definitions for their
inspections.
The two major shortcomings of NBI condition rating are overcome in the Bridge Health Index. First, BCI
represents the overall condition of a bridge as compared to the NBI rating. Second, BHI can
simultaneously capture the severity as well as the extent of the determination of an element (Chase et
al., 2016). i.e., it captures the percentage or extent of an element in different condition states (such as
20 percent in condition 1, 30 percent in condition 2, 40 percent in condition 3, and 10 percent in
condition 4).
Bridge inspectors rate each element of a bridge according to three, four or five condition states (Lake
and Seskis, 2013):

6
Protected (1)
Exposed (2)
Attacked (3)
Damaged (4)
Failed (5).
The number of states used depends on the type of element being rated. For example, reinforced
concrete columns have four condition states whereas concrete deck has five (Lake and Seskis, 2013). For
each element, the BHI is calculated as (Lake and Seskis, 2013):
He = (∑ ksqss
∑ qss)×100%
Where:
He = Individual element health index
s = element condition state index
qs = quantity of element in condition state s
ks = coefficient corresponding to sth condition state
The value of 𝑘𝑠 is calculated based on the number of condition states as shown in the table below:
Table 2.3 Values of 𝒌𝒔 (Adams and Kang, 2009)
Number of condition states k1 k2 k3 k4 k5
3 1.00 0.50 0.00 - -
4 1.00 0.67 0.33 0.00 -
5 1.00 0.75 0.50 0.25 0.00
The overall bridge health index is calculated as (Lake and Seskis, 2013):
BHI = (∑ Hee QeWe
∑ QeWeE)
Where:
e = the index of the bridge′s elements
Qe = total quantity of the element e
We = weighting factor for element

7
The weighting factor 𝑊𝑒 is typically based on element failure costs (i.e., sum of authority cost and user
failure cost) (Lake & Seskis, 2013).
Denver BHI (DBHI)
DBHI is a modification of California BHI. A study by Jiang & Rens (2010) claims that BHI is subjective to
municipality’s often imprecise cost data, and focused on failure or repair cost rather than safety. In
DBHI, the cost of the bridge element is eliminated from the California BHI formula; instead, it stresses
the effect of element damage on the bridge health and function (Jiang & Rens, 2010). A non-linear
health index coefficient 𝑘𝑠𝑛 corresponding to sth condition state is used (the value of 𝑘𝑠 used in BHI is
linear for the condition state 3, 4, and 5 is linear) which has proven to be more realistic, and the health
index obtained is more conservative (Jiang & Rens, 2010). Also, weight coefficient used in BHI is adjusted
to account the severity of the element to the overall condition of the structure (Jiang & Rens, 2010). A
variable adjustment factor is introduced to the DBHI to increase the weight coefficient as the element
health index declines (Jiang & Rens, 2010).
NYSDOT’s condition rating
NYSDOT rates their bridges using a seven-point scale (0-7) similar to the NBI condition ratings based on
47 elements. 1 represents the worst condition, and 7 represents the best condition below (Lake and
Seskis, 2013).
Ohio Bridge Condition Index (OBCI)
This is a proposed metric which is capable of evaluating bridges at the element, component, bridge and
network levels (Fereshtehnejad et al., 2017). Unlike BHI, OBCI reflects the impacts of effective
improvements actions on the condition index (or performance) of the bridge (Fereshtehnejad et al.,
2017). OBCI incorporates direct and indirect consequences of various bridge conditions for users and
agencies in terms of MR&R (maintenance, repair, and rehabilitation) implementation cost and structural
or operational failure cost (Fereshtehnejad et al., 2017). Due to the complexity in the evaluation of
structural or operational failure cost, OBCI minimum thresholds are defined in order to incorporate
structural or operational failure cost in OBCI (Fereshtehnejad et al., 2017). These thresholds ensure an
acceptable level of bridge serviceability and safety (Fereshtehnejad et al., 2017).
OBCImin = 1 −∑ cost of meeting minimum threshold($)
replacement cost ($)
According to Fereshtehnejad et al. (2017), 𝑂𝐵𝐶𝐼𝑚𝑖𝑛 provides a set of MR&R actions needed to bring the
bridge or its elements to a minimum threshold and therefore, it can be useful for emergency decision
making and in case of a limited fund to provide the minimum required level of safety and service.
In order to compare the state of the bridge to like-new condition, the OBCI current is proposed
(Fereshtehnejad et al., 2017).

8
OBCIcurrent = 1 −∑ cost of going back to like − new condition ($)
replacement cost ($)
The healthier the bridge, the closer OBCI current will be to one. OBCI current identifies how close the
system is to its desirable conditions.
The bridge owners use one or more of the above-mentioned performance measures to track the
condition of their asset. Typically, the inspection is carried out once in two years.
2.1.2 Bridge Life Expectancy
When an asset is either physically deteriorated or can no longer provide the designated service, it is
considered to have reached its life expectancy. Expected bridge life can be defined as the time until the
bridge is retired, replaced or removed from service (Jeong, Kim, Lee & Lee, 2017) The average age of the
American bridges is 43 years (Gina, Paul & Charles, 2015). Considering that the theoretical design of
these bridges is usually 50 years a large proportion of the bridges in the United States are considered
deficient, thus it is critical for the highway agencies to estimate the remaining life of bridges to take
appropriate MR&R measures at the appropriate time (Gina et al., 2015).
There are a number of ways to predict the life expectancy of the bridge. Corrosion is commonly used as
a function in Mechanistic methods to predict the service life (Ford et al., 2010). Empirical method that
includes survival probability curves (Lin, 1995; Lounis, 2000; Estes and Frangopol, 2001; Akgul and
Frangopol, 2004; Biondini et al., 2006; Saber et al., 2006; Oh et al., 2007; Strauss et al., 2008) (Ford et al.,
2010), linear and non-linear regression (Rodriguez et al., 2005)(Ford et al., 2010), neural networks
(Narasinghe et al., 2006) (Ford et al., 2010), ordered probit models(Rodriguez et al., 2005) (Ford et al.,
2010), constitutive models using Lamb wave technique(Desai, 2001) (Ford et al., 2010), and Markov
chains (Jiang and Sinha, 1989; Estes and Frangopol, 2001; Zhang et al., 2003; Hallberg, 2005; Morcous,
2006; Ertekin et al., 2008) (Ford et al., 2010) have also been applied to predict the service life of bridges.
To account for uncertainties and randomness in deterioration process in life prediction, stochastic
(probabilistic) approach is recently used (Lake & Seskis, 2013; Ford et al, 2010). Markov chain is a
stochastic approach.
Some studies have shown that individual bridge components can be used to calculate the life
expectancy. Among all the components bridge deck are usually studied (Bettigole, 1989; Adams, 2002;
Kirkpatrick et al., 2002) (Ford et al, 2010). According to Bettigole (as cited in Ford et al., 2010) bridge
deck life corresponds to one half of the overall bridge life. In Pontis 5.2, the life expectancy of individual
bridge elements is considered (Ford et al., 2010). In 2008, Caner et al. proposed a simple method to
estimate the remaining service life a bridge based on the relationship between its present condition
rating and its age by assessing a set of bridges at different ages from which deterioration trend can be
computed. This method was suggested for the agencies that either does not inspect their bridges
periodically or do not inspect them at all (Caner et al., 2008). For example, Turkey performs bridge
MR&R based on an as-needed basis (Caner et al., 2008).

9
A condition-based approach using bridge Inspection data (e.g., NBI rating) are often used to forecast the
bridge life expectancy. Based on the inspection data collected, deterioration models are generated. The
deterioration models describe the likelihood of the change of an element condition from one condition
to another over a given period. Some states like (California, Delaware, Florida, South Dakota, New York,
Colorado) use Bridge Management Software (BMS) for deterioration USDOT Office of Asset
Management, 2005, 2012). The most commonly used BMS is Pontis (now also known as AASTHOware
Bridge Management software (BrM)). A few other programs are also in use, for example, Kansas uses a
program developed in-house whereas Indiana uses dTIMS Bridge Management System (MnDOT Office
of Transportation System Management, 2016). Pontis has Markov Chain deterioration modeling built in
it. On the other hand, there are several states that use Pontis for collecting inventory and inspection
data only USDOT Office of Asset Management, 2005). According to Adams & Sianipar (1995) and Ford et
al. (2012), bridge engineers use these models and pre-defined thresholds in order to estimate the time
(years) since the bridge physical condition reaches a given threshold for reconstruction or rehabilitation
which, according to Bu et al., are subsequently used to plan the maintenance, repair, and rehabilitation
(MR&R) schedule over the bridge life cycle or remaining service life (as cited in Saeed et al.) This time
interval is often referred to as the service life or the remaining life. (Saeed et al. 2017) The models are
also used for life-cycle cost analysis (Zimmerman, Olson & Schultz, 2007). Commonly, the NBI Condition
rating of 4 is used by bridge owners and managers as the threshold for the rehabilitation and
replacement purposes.
Minnesota Department of Transportation (MnDOT)
MnDOT Office of Bridges and Structures has been collecting both the NBI condition data as well as
element-level data. They have been collecting the element condition ratings since 2003 whereas the NBI
data available is from 1983 (Nelson, 2014). Because of a larger database of NBI codes, these codes are
used to track the bridge deterioration rates (Nelson, 2014). However, MnDOT intends to use element
condition rating in future.
In 2007, a study was performed by Zimmerman et al. on the performance of low slump concrete
overlays on 492 bridges in Minnesota. The study found that the deterioration rates for the decks (and
overlays) were non-linear. Rather, it was best described by a series of piecewise linear curves. In a
recent report, it is mentioned that the deck deterioration rates are determined by the length of time
bridge deck stays or drop, at NBI condition codes (Nelson, 2014). For this task, Excel spreadsheets were
used. The deterioration tables were created which are recommended to be used for the long-term
planning (Nelson, 2014). These tables can be used by MnDOT to approximate the deck NBI condition
code in future with a caution that MnDOT considers the number of years a bridge deck had already been
at an NBI condition code (Nelson, 2014). A deterioration curve is assigned to each bridge based on the
deck design used when the deck was constructed. RSL is the number of years until a bridge reaches poor
condition (NBI condition code of 4) (MnDOT Bridge Office, 2017).
10
MnDOT has used an analysis tool called Bridge Replacement and Improvement Management (BRIM) to
predict future bridge needs and aid in the develop the bridge construction projects (MnDOT Bridge
Office, 2015, 2017). The principles of risk assessment are applied to determine the probability of a
service interruption and potential user consequences (in terms of traffic volume, roadway network,
detour length, and the length of the bridge) in order to establish a Bridge Planning Index (BPI) (MnDOT
Bridge Office, 2015, 2017). BPI ranges from 0 (highest priority) to 100 (lowest priority). BPI enables
MnDOT to prioritize the improvement and replacement projects, along with identifying funding needs
for both short term and long range planning activities (MnDOT Bridge Office, 2017). Local bridge experts
review the draft projects generated by BRIM, and they use their knowledge of the bridge, and local
transportation needs to adjust the priority list or to modify the scope or schedule of the planned
projects (MnDOT Bridge Office, 2017). BRIM is also used to predict the future condition of MnDOT’s
inventory of bridges (MnDOT Bridge Office, 2017). The predictive model in BRIM utilizes the
deterioration curves developed from the historical bridge deck inspection data collected over more than
30 years (MnDOT Bridge Office, 2017).
2.2 PAVEMENT LITERATURE REVIEW
A summary of some of the most relevant pavement performance measures used in pavement
management, including the use of remaining service life, is presented below.
2.2.1 Performance Measures
Washington Department of Transportation
Washington Department of Transportation (WSDOT) has one of the best and most recognized pavement
management programs. In a recent publication on Pavement Asset Management, Uhlmeyer et al. (2016)
provided an excellent overview of Pavement Management at WSDOT. WSDOT has a long history of
pavement management, which began in 1963. The Washington State Pavement Management System
(WSPMS) was developed in late 1970s to analyze and interpret pavement information, which makes it
one of the longest running Pavement Management Systems. Significant changes were adopted in 1993
to fit the framework of asset management and the asset management principle of Lowest Life Cycle Cost
was selected for pavement management. Managing by Lowest Life Cycle Cost is still the primary
objective of Pavement Management at WSDOT.
According to the authors “The concept of life cycle costs, and finding the lowest one, is straightforward.
The Life Cycle Cost (LCC) is defined as the total cost of ownership over the whole life of an asset. When
there are different alternatives to manage an asset, choosing the one with the lowest Life Cycle Cost is
referred to as the Lowest Life Cycle Cost. If rehabilitation is done too early, pavement life is wasted. If
rehabilitation is done too late, very costly repair work may be required, especially if the underlying
structure is compromised, and the user incurs higher fuel and ownership costs.” An example is shown in
Figure 1.

11
Figure 2.1 The concept of Lowest Life-Cycle Cost
One of the key components within the Lowest Life Cycle Cost framework is establishing the minimal
acceptable performance levels. WSDOT uses several condition indicators, including cracking, rutting,
roughness, and skid resistance for this purpose. The data collected from periodic survey is converted
into different indices, which are scaled from 0 (very poor) to 100 (very good), with rehabilitation
thresholds set at the index value of 50, as shown in Figure 2.
The three main indices for asphalt pavements are:
PSC (Pavement Structural Condition) – Assesses the structural health of the pavement based on cracking and patching present. The input is equivalent cracking and the model is a power function.
PPC (Pavement Profile Condition) – Assesses the roughness of the road. The input is IRI and the model is linear.
PRC (Pavement Rutting Condition) – Assesses the rutting of the road. The input is rutting and the model is linear.

12
Figure 2.2 Minimal acceptable performance levels for lowest life-cycle cost
For concrete, additional indexes were developed and used since 2009:
RCN (Reconstruction) – Assesses the need to perform concrete reconstruction based on faulting and PSC
GRND (Grinding) – Assesses the need to perform diamond grinding based on low faulting, IRI and rutting
DBR (Dowel Bar Retrofit) – Assesses the need to perform dowel-bar retrofit, if none has yet been completed, based on faulting
Since 2012 (Gray Notebook, 2012), three other performance measures were introduced to better
evaluate the predictability of pavement preservation needs: Remaining Service Life, Asset
Sustainability Ratio, and Deferred Preservation Liability.
Remaining Service Life (RSL) is a cumulative measure of the years of service life left in the network and is
expressed as a percentage of typical pavement life. It is assumed that a healthy system has an RSL
between 45% and 55% and an ideal system would have an RSL of 50%.

13
The Asset Sustainability Ratio measures the annual sustainability of investments in pavement asset
protection by quantifying how WSDOT’s pavement replenishment is keeping up with pavement wear.
Annual replenishment is calculated as a summation of average life added per rehabilitation activity
performed. The goal for WSDOT is to have a value of 0.9.
The Deferred Preservation Liability estimates the funding required to address the cumulative backlog of
deferred pavement rehabilitation. The estimate takes into consideration the higher cost of rehabilitation
as pavement condition gets worse and more extensive repairs are needed. An alternative approach to
the liability measure is the Cost of Inadequate Funding, which represents the additional costs achieved
at the lowest life cycle.
Minnesota Department of Transportation
Minnesota Department of Transportation (MnDOT) also has a long pavement management tradition and
has one of the best pavement management programs. Unlike WSDOT, the data collected is used to
obtain four pavement condition indices: Ride Quality Index (RQI), Surface Rating (SR), Pavement Quality
Index (PQI), and Remaining Service Life (RSL). Each index describes a specific aspect of pavement
performance and are used to identify the need for future intervention actions (MnDOT, 2017).
The Ride Quality Index (RQI) describes how smooth the pavement is (higher RQI describes smoother
roads). The front mounted lasers on the digital inspection vehicle measure the pavement’s longitudinal
profile, which is used to calculate the International Roughness Index (IRI). IRI is then converted to RQI
using a rating panel. The RQI ranges from a 0 to 5 scale. A road with a RQI of 2.5 is consider to need
major rehabilitation.
The Surface Rating (SR) is used to quantify pavement distress. SR is estimated from the digital images
captured by the inspection vehicle. The images are analyzed and the roads are rated from 0 to 4, where
a road that has a SR of 4 would present no defects and a road that has a SR of 2.5 would need major
rehabilitation.
The Pavement Quality Index (PQI) is calculated as the square root of the product of RQI and SR. The PQI
ranges from 0 to 4.5 and is used to gauge whether or not the state highway system meets the
performance requirements of the Government Accounting Standards Board, Standard 34 (GASB 34).
The Remaining Service Life (RSL) is an estimation of the time until the next major rehabilitation of the
pavement section. Using pavement deterioration curves, the time when a pavement section reaches an
RQI of 2.5 is predicted and the RSL is simply calculated as the difference between the predicted and the
present time.
Michigan Department of Transportation
Michigan Department of Transportation (MDOT) uses a three-prong approach to manage the rate of
deterioration of its pavements. The three-prong approach is composed of reconstruction and

14
rehabilitation (R&R), capital preventive maintenance (CPM) and reactive maintenance. Reconstruction
and rehabilitation is used when the pavement Remaining Service Life (RSL) is less than two years.
Pavements with RSL greater than two years are treated with capital preventive maintenance.
MDOT conducts pavement condition surveys and use the data collected for bridges, pavement,
congestion, intermodal, and safety analyses. The evaluation is conducted using two processes:
Pavement Management System (PMS) Rating and Sufficiency Rating.
PMS Rating is a detailed collection of pavement condition data collected during two years, and includes
distress, ride-quality ratings, and measurements of rutting and surface friction. The Distress Index (DI) is
calculated based on cracking, raveling, flushing, spalling, faulting, roadway curvature, pavement grade,
cross slopes and rutting, and then used to predict the RSL. The ride quality is based on Michigan Ride
Quality Index (RQI). A RSL value of zero corresponds to a RQI of 50.
Sufficiency Rating is a windshield survey performed annually and rates the pavement ride quality and
distress condition on a scale from 1 to 5. The rating is based on observed factors such as cracking,
faulting, wheel tracking and patching.
Illinois State Toll Highway Authority
The Illinois State Toll Highway Authority (Tollway) with over 2000 lane miles of pavement utilizes the
condition rating system (CRS) methodology to rate pavement performance. Pavement performance
models developed in the past for the Illinois Department of Transportation (IDOT) are used by the
Tollway to predict the future condition of its network. The model projects future CRS ratings based on
pavement type, thickness, traffic, pavement age and current CRS rating. However, with time and
inclusion of newer pavement types there was a need to calibrate the existing pavement performance
models, as well as, develop models for newer pavement types.
The CRS provides an overall pavement condition rating on a 1-to-9 scale, with 9 representing a newly
constructed or resurfaced pavement and 1 representing a completely failed pavement. CRS ratings are
based on the type, amount, and severity of the evident pavement distresses, as well as the overall
roughness of the pavement surface, level of wheel path rutting, and magnitude of transverse joint
faulting. The CRS surveys are performed in each direction of traffic, and the resulting CRS ratings
represent the entire roadway width for a given traffic direction.
2.2.2 Reformulated Pavement Remaining Service Life
The Office of Infrastructure Research and Development at Federal Highway Administration has
published a technical report that investigates the short comings of the RSL concept and proposed a new
measure called remaining service interval (RSI). The authors point out that a major source of
uncertainty in the current RSL definition is the use of the term “life” to represent multiple points in the
pavement construction history and they recommend a more consistent approach by adopting

15
terminology of time remaining until a defined construction treatment is required. Some of the
inconsistencies of using RSL are summarized next.
One common RSL definition is the time until the next rehabilitation or reconstruction event. The rule of
thumb is that rehabilitation treatments should be applied before a pavement has suffered too much
structural damage. Reconstruction is generally warranted after a pavement has reached an advanced
degree of deterioration. Typically, during the planning process, an agency decides to apply a
rehabilitation treatment to extend the time until reconstruction is required. Attempting to interpret
combined RSL estimates from mixed rehabilitation and reconstruction units can cause confusion for
decision makers.
Another common RSL definition is the time until a condition index limit is reached. This approach shares
the same issues as rehabilitation and reconstruction RSL units but also introduces other service and
safety condition indices, which further complicate the meaning of RSL. Setting threshold limits for
pavement conditions that are not based on human subjective ratings, such as cracking, can be
complicated to justify. Moreover, interpretation of a single RSL number gets even more complicated
when it is based on multiple condition states. For example, if RSL for roughness is 2 years, RSL for
cracking is 5 years, RSL for friction is 7 years, and RSL for rutting is 20 years, expressing that the current
pavement RSL equals 2 years can lead to imperfect construction decisions since the construction
treatment selected to correct roughness may not necessarily address the more serious cracking issue
expected to occur soon after the roughness threshold is reached. Since there are many construction
treatments that can be used to correct excessive pavement roughness that can be classified as
pavement preservation, this approach adds maintenance-type activities to RSL units.
One unintentional consequence of using current RSL terminology, which is defined as the time to
reconstruction or major rehabilitation, is that it tends to promote worst-first approaches to correcting
pavement deficiencies. By expressing pavement condition in terms of RSL, laymen and politicians expect
that pavements in the worst condition get treated first. Construction treatments on pavements in the
worst condition tend to cost the most. Applying a life extending corrective rehabilitation treatment
before the pavement condition gets too bad tends to cost less than reconstruction treatments.
Optimum allocation of annual pavement resurfacing, rehabilitation, and reconstruction budgets will be a
mixture of pavements with differing remaining lives and not based solely on a worst-first approach.
2.3 SURVEY TO ASSESS METHODS USED IN ASSET MANAGEMENT PROGRAMS.
A survey was developed to gather information on current methods used in each state as part of their
asset management programs. The survey consists of questions designed to collect information on
condition estimation and Remaining Service Life, and will be directed to several Department of
Transportation Bridge and Pavement offices. Google Form will be used to collect and analyze the
information received. The software was chosen because it is accessible, user-friendly, provides the

16
possibility of creating different questions types and offers a variety of tools for processing and analyzing
the data collected.
The following questions were used to survey bridge offices:
1. Does your Office quantify bridge deterioration?
1.1. If no, do you plan to quantify bridge deterioration in future?
1.2. If yes, what measure do you intend to use to quantify the condition of the bridge?
2. How do you compute the time when a major intervention is required? Kindly, mention the
metric used and its threshold value.
3. Does your Office use remaining service life (RSL) to quantify bridge deterioration?
3.1. If yes, how is RSL defined, calculated and used in your bridge management program?
3.2. What are the types of assets managed in your organization using RSL?
4. Whether your Office uses RSL or not, should RSL be used only for bridge decks, or should it be
used for all bridge components (decks, girders, bents, piers, etc.)?
5. Does your Office have access to data that links RSL (or other deterioration measures) to Bridge
Condition?
6. Are there other performance parameters used in bridge management that can be calibrated to
RSL?
7. Do you use or intend to use RSL to compute and predict the values of assets owned by your
organization?
8. Are there any common management measures for bridge and pavement assets in your State?
9. What do you think is the most effective way to present the condition of bridges and pavements
to others (e.g., legislators and tax-payers)?
The following questions were used to survey pavement offices:
1. What measures are used by your Office to quantify the condition of your pavement network? 2. If your Office uses remaining service life (RSL), how is RSL defined and calculated? If RSL is not
used, what other measures do you use? 3. How is RSL used in your pavement management program? 4. Are there any common asset management measures for pavement and bridge assets in your
state?

17
CHAPTER 3: ASSESSMENT OF CURRENT PRACTICE
In this task, the current systems used by MnDOT Bridge Office and by the Materials and Road Research
Office are investigated to identify similarities and differences between the two approaches. The results
of this assessment will be used in task 3 to select the best methodologies that can be applied to MnDOT
existing data and can be implemented in the future.
3.1 BRIDGE MANAGEMENT
The MnDOT Office of Bridges and Structures has been collecting both the NBI condition data as well as
element-level data. Element condition ratings have been collected since 2003 whereas the NBI data is
available from 1983 to the present (Nelson, 2014). Because of a larger database of NBI codes, these
codes are used to track the bridge deterioration rates (Nelson, 2014). However, the MnDOT Bridge
Office intends to continue collecting element data and will use element condition ratings in the future
once sufficient element data is collected to establish a reliable baseline.
Typically, a bridge deck has an initial NBI condition code of 9 (excellent) and may drop to zero (failed),
during its lifetime. However, the MnDOT Bridge Office intervenes with repair or replacement before a
bridge deck drops below an NBI condition rating of 4. A recent report mentions that the deck
deterioration rates are determined by the length of time bridge deck stays or drop at specific NBI
condition codes (Nelson, 2014). For this task, Excel spreadsheets were used. Two factors that are
considered crucial in deck deterioration are deck type (categorized based on the type of reinforcement,
the presence of overlay or no overlay, amount of concrete cover to the top mat of reinforcement) and
Average Daily Traffic (ADT) (Nelson, 2014). On the other hand, maintenance practice and de-icing
application are not considered in the analysis of the deterioration of the deck due to the difficulty in
their tracking even though they are likely to play vital roles in deck deterioration (Nelson, 2014).
The bridge deck deterioration tables were created for the MnDOT Bridge Office and are recommended
for use in long-term planning (Nelson, 2014). These tables can be used by MnDOT to approximate the
deck NBI condition code in future with a caution that MnDOT considers the number of years a bridge
deck has already been at a given NBI condition code (Nelson, 2014). A deterioration curve is assigned to
each bridge based on the type of deck, and the remaining service life (RSL) of the bridge deck is
estimated from the assigned deterioration curve. (MnDOT Bridge Office, 2017). RSL is the number of
years until a bridge reaches poor condition, that is, an NBI condition code of 4 (MnDOT Bridge Office,
2017). If the structure does not deteriorate as predicted by the deterioration curves, then expert review
becomes essential in identifying the intervention needs. Other than scour and vertical clearance, no
other extreme events or limiting conditions are used in the prediction of the deterioration pattern of the
bridge. The life expectancy of the bridge is determined solely from the condition of the deck, whereas
superstructure and substructure NBI condition is reviewed and local repair/maintenance is performed to
extend the life of the bridge. Additionally, the Bridge Office has an ongoing program to paint steel
superstructures.

18
The MnDOT Bridge Office uses an analysis tool called Bridge Replacement and Improvement
Management (BRIM) to predict future bridge needs and develop bridge construction projects (MnDOT
Bridge Office, 2015, 2017). BRIM makes use of NBI condition ratings and some of the element level
condition data along with other bridge characteristics like the year of construction, average daily traffic
(ADT) (Bektas, 2015). The principles of risk assessment are applied to determine the probability of
service interruption (MnDOT Bridge Office, 2017). The service interruption is based on eight resilience
factors: deck, superstructure, and substructure condition; scour; fracture critical condition; fatigue; load
rating; and vertical clearance (Bektas, 2015). The score of each factor decreases with an increase in the
probability of service interruption (MnDOT Bridge Office, 2015, 2017). The score is then adjusted to
include the potential user service interruption consequences, based on the numbers of users, detour
length, and potential service interruption mitigation time (MnDOT Bridge Office, 2017). The adjusted
BRIM score described above for each bridge is used to determine its relative priority for replacement or
improvement; this priority is called the Bridge Planning Index (BPI), and it ranges from 0 (highest
priority) to 100 (lowest priority) (MnDOT Bridge Office, 2015, 2017). In addition to prioritizing
improvement and replacement projects, the BPI enables MnDOT to identify funding needs for both
short-term and long-range planning activities (MnDOT Bridge Office, 2017).
RSL for each bridge is calculated in BRIM based on the NBI condition of the bridge obtained from the
inspection data and the deterioration curve assigned to the bridge. Upon inspection, if the condition of
the bridge is found not to have improved or if the life is found not to have increased after intervention
or repair, then the RSL value of the bridge is updated manually in the BRIM (A. Blanchard and D.
Thomas, personal communication, Dec. 21, 2017). BRIM uses bridge inspection data and inventory data
in order to generate a draft list of needed bridge projects and their expected cost and anticipated
schedules (MnDOT Bridge Office, 2017). BRIM is also used to predict the future condition of MnDOT’s
inventory of bridges (MnDOT Bridge Office, 2017). The predictive model in BRIM utilizes the
deterioration curve developed from the historical bridge deck inspection data collected over more than
30 years (MnDOT Bridge Office, 2017).
The use of RSL in the MnDOT Bridge Office has been limited to the planning process. It acts as a piece of
information in the planning process in addition to other factors like BPI (Bridge Planning Index), NBI
rating, element level inspection data, load rating and clearance, among others (A. Blanchard and D.
Thomas, personal communication, Dec. 21, 2017). According to the Bridge Office staff, it is not viable to
have only one predictive tool that can account for all the attributes that need to be considered in the
planning process, even though the Bridge Office staff claim that RSL can be used to predict the time
frame when a bridge deck will require work (A. Blanchard and D. Thomas, personal communication, Dec.
21, 2017). Also, according to the Bridge Office staff, RSL may be used for network-level planning but not
for project-level considerations (A. Blanchard and D. Thomas, personal communication, Dec. 21, 2017).
The RSL value of a bridge is not updated to account for preservation actions taken before the deck
reaches poor condition in order to extend the life of the bridge deck or to restore it to a better condition
(A. Blanchard and D. Thomas, personal communication, Dec. 21, 2017). The RSL value derived from the
deterioration curve, as stated before, does not incorporate the conditions of the superstructure,

19
substructure, expansion joint condition (which impacts greatly the life of bridge deck), approach
roadway and such other factors that may affect the timing of a project (A. Blanchard and D. Thomas,
personal communication, Dec. 21, 2017). The Bridge Office uses Remaining Good Service Life (GSL) for
defining the breakdown between poor and good bridge decks (i.e., percent poor and percent good) (A.
Blanchard and D. Thomas, personal communication, Dec. 21, 2017). Bridge Office staff further suggest
that RSL could be used for the quantification of bridge deterioration if element level inspection data is
used to determine and predict future deterioration. Further research would be required, though.
Local bridge experts are brought into the process to review the draft projects generated by BRIM, and
they use their intimate knowledge of the bridge and local transportation needs to adjust the priority list
or to modify the scope or schedule of the planned projects (MnDOT Bridge Office, 2017).
The MnDOT Bridge Office has not quantified the worth of the bridge network even though it is required
for the Transportation Asset Management Plan (TAMP) (A. Blanchard and D. Thomas, personal
communication, Dec. 21, 2017). The Bridge Office would prefer to view worth of the network in terms of
service life and condition, though (A. Blanchard and D. Thomas, personal communication, Dec. 21,
2017).
The MnDOT Bridge Office does not quantify the deterioration of culverts. BRIM has a separate decision
matrix incorporated in it for culverts which generates time frame and cost for the replacement of
culverts (A. Blanchard and D. Thomas, personal communication, Dec. 21, 2017).
3.2 PAVEMENT MANAGEMENT
Minnesota Department of Transportation (MnDOT) uses the data collected every year to obtain four
pavement condition indices: Ride Quality Index (RQI), Surface Rating (SR), Pavement Quality Index (PQI),
and Remaining Service Life (RSL). Each index describes a specific aspect of pavement performance and
are used to identify the need for future intervention actions (MnDOT, 2017).
The Ride Quality Index (RQI) describes how smooth the pavement is (higher RQI describes smoother
roads). The front mounted lasers on the digital inspection vehicle measure the pavement’s longitudinal
profile, which is used to calculate the International Roughness Index (IRI). IRI is then converted to RQI
using a rating panel. The RQI ranges from a 0 to 5 scale. A road with a RQI of 2.5 is consider to need
major rehabilitation.
The Surface Rating (SR) is used to quantify pavement distress. SR is estimated from the digital images
captured by the inspection vehicle. The images are analyzed and the roads are rated from 0 to 4, where
a road that has a SR of 4 would present no defects and a road that has a SR of 2.5 would need major
rehabilitation.

20
The Pavement Quality Index (PQI) is calculated as the square root of the product of RQI and SR. The PQI
ranges from 0 to 4.5 and is used to gauge whether or not the state highway system meets the
performance requirements of the Government Accounting Standards Board, Standard 34 (GASB 34).
The Remaining Service Life (RSL) is an estimation of the time until the next major rehabilitation of the
pavement section. RSL is defined as “the number of years until the RQI is predicted to reach a value of
2.5”. That is the value of RQI where people start to feel the ride is getting uncomfortable.
According to Dave Janisch, MnDOT pavement management engineer (personal communication, Dec. 08,
2017), each year when another data point is added, the software takes all data points since the last
major rehab or construction activity and does a regression fit through the data. This is done for each
mile of road and if it results in a reasonable fit, it uses that curve to predict the future value. If the fit is
not reasonable, the software uses the default curves, developed from statewide data for each type of fix
in the system. Reasonableness is defined by the regression fit predicting an RQI of 2.5 somewhere
between what we call the minimum and maximum life limits. For example, a Thin Mill/OL should reach
an RQI of 2.5 between 8 and 20 years after placement. If, based on the regression curve, it predicts 2.5
before 8 years or after 20, the fit is considered not reasonable fit and the default is used. Once each
section has either a regression curve or default curve identified, the RSL is calculated. In order to get the
Average RSL of the network, a length weighted average is calculated. This calculation is performed
based on a do nothing scenario, or a scenario based on loading all projects planned for the next 4-10
years.
RSL was first used around 2000, when MnDOT began recording performance measures. At that time, it
was determined what “Good” and “Poor” would be and what percent should be used for targets (Dave
Janisch, personal communication, Oct. 17, 2017). The director of the office of materials wanted another
measure that would give a look forward rather than just a snapshot of a single year. Since FHWA
requires that IRI is reported each year, it was decided to use RQI for this purpose, since it was calculated
directly from IRI and was used as a Good/Poor measure. It was then decided that calculating RSL, also
based on the RQI, would give a look forward as to how much of the system would be approaching Poor
and would provide a good comparison to the current conditions since they are based on the same index.
Although PQI is not one of the official performance measures, some people still use it to rank projects in
their districts, although it is not used as much as it had been in the past.
Different agencies use RSL in different ways to predict investment needs. For example, in the Annual
Minnesota Transportation Performance Report 2015 it is stated that “An even distribution of remaining
service life across the system makes for a more predictable need for investment in pavement. This
makes planning easier and more consistent from year to year. When the distribution is skewed to the
left, it indicates a looming near-term need for investment in order to maintain ride quality
performance.” The system is grouped into miles with RSL of 0-2, 3-5, etc. and it is assumed that a
uniform distribution is best since it translates into the needed to fix the same amount of miles each

21
year. However, just because the same amount of miles need to be fixed each year, does not mean the
funding needs will be the same each year, since difference roads need different fixes.
WSDOT uses RSL as a cumulative measure of the years of service life left in the network that is
expressed as a percentage of typical pavement life. It is assumed that a healthy system has an RSL
between 45% and 55% and an ideal system would have an RSL of 50%.
At this time, it is not clear what role RSL will have at the federal level. Currently, FHWA requires all state
DOT agencies to elaborate a Transportation Asset Management Plan (TAMP). MnDOT has a TAMP draft
since 2014. The MAP-21 created requirements to be fulfilled by October 1, 2019 (elaboration and
maintenance of the TAMP). However, MAP-21 has expired and was substituted by FAST, which provides
long-term funding certainty for federal fiscal years 2016-2020. It is not clear at this time how RSL fits
into MAP-21/FAST. The current requirements are based on roughness (IRI), cracking and
rutting/faulting, that are used to set targets for the interstate system regarding the amount each state
can have in Good/Poor. Each state sets their own target for the rest of the National Highway System.
RSL is not mentioned in the new rules.
3.3 CONCLUSIONS
The review performed in this task of the current systems used by MnDOT Bridge Office and by the
Materials and Research Office has identified similarities and differences between the two systems.
Both systems calculate RSL, however, the RSL value for bridges is determined using different criteria
than for pavements, and the use of RSL in the two system is also different.
The MnDOT Office of Bridges and Structures has been collecting for bridge decks both NBI condition
data, since 1983, as well as element-level data, since 2003. Because of a larger database of NBI codes,
these codes are used to track and predict the bridge deterioration rates.
The use of RSL in MnDOT Bridge Office has been limited to the planning process. The RSL value of a
bridge is not updated to account for preservation actions taken before the deck reaches poor condition,
and it does not incorporate the conditions of the superstructure, substructure, expansion joint condition
(which impacts greatly the life of bridge deck), approach roadway and such other factors that may affect
the timing of a project. The Bridge Office uses Remaining Good Service Life (GSL) for defining the
breakdown between poor and good bridge decks (i.e., percent poor and percent good). Bridge Office
staff suggested that RSL could be used for the quantification of bridge deterioration if element level
inspection data is used to determine and predict future deterioration, which would require further
research.
For pavements, the concept of RSL was first used around 2000, when MnDOT began recording
performance measures. One of the main pavement condition indices calculated is the Ride Quality
Index (RQI) that describes how smooth the pavement based on ratings from a panel of individual users.

22
RQI is directly related to IRI measurements, and, as a consequence, it was selected as a Good/Poor
measure. The RQI ranges from a 0 to 5 scale, and a road with a RQI of 2.5 is consider to need major
rehabilitation. Future RQI values are predicted from individual performance curves or on default curves,
developed from statewide data for each type of fix in the system. Calculating RSL based on a RQI value
of 2.5 can give a reasonable prediction of how much of the system would be approaching Poor and can
provide a good comparison to the current conditions, since they are based on the same index.
RSL is currently used as planning tool. It is assumed that an even distribution of RSL values across the
system makes planning easier and more consistent from year to year. When the distribution is skewed
to the left, it indicates a looming near-term need for investment in order to maintain ride quality
performance.

23
CHAPTER 4: DEVELOP WORK PLAN FOR PHASE 2
In this task, the results from tasks 1 and 2 are summarized and used to develop a work plan for selecting
a common measure that can be fine-tuned and implemented to local conditions with minimum changes
to the existing system.
4.1 SURVEY RESULTS
4.1.1 Bridge Management Survey Results
The bridge management survey received a total of 31 responses from 30 different DOTs. It was found
that most states calculate the time of major intervention based on the NBI condition rating and bridge
inspection report. The methods used range from very simple to more complex Markov probabilities, as
shown in the next examples:
West Virginia does not have a metric and quantifies their bridges based on visual means.
Utah uses chloride concentration, load rating and capacity, and clearance. Virginia uses
combination of condition states, chloride penetration and GCR.
Texas defines the structures as structurally deficient or functionally obsolete and identifies the
structures with a sufficiency rating less than 50 eligible for replacement or major rehabilitation
through Highway Bridge Program (HBP). A life-cycle cost analysis is performed to better evaluate
the value of a preservation project with high cost estimates against the replacement of the
structure.
Montana and North Carolina do not quantify their bridge deterioration. Montana is in the
process of scoring RPF responses for a Bridge Analytical Tool to help them track bridge
deterioration, whereas North Carolina plans to use defect specific element condition and
maintenance history. Louisiana DOT does not quantify bridge deterioration either, but plans to
use BrM 5.3 to quantify the condition of bridge and to calculate the intervention time.
Models/tools/software recommendation and experience were also found to be used for
planning of the intervention. Arkansas uses deterioration curves and software that uses NBI
ratings, SD, and in-house built software for generating intervention recommendations. Oregon
uses something similar to deterioration curves. Michigan computes deterioration using Markov
probabilities and has a rehabilitation and repair matrix that drives the intervention. Delaware
uses AASTHO BrM with their deficiency formula based on condition and functionality.
Only Oregon and Maine are using RSL for bridge condition. Oregon plots the age of bridges that have
historically been replaced and assumes that when a bridge reaches that age or 10 years after it
transitions to an NBI code of 4, whichever is sooner, that it has reached the end of life in order to define
RSL. Maine DOT does not use RSL in their bridge management program as it considers RSL as an
inaccurate, subjective measure. RSL is used as a target for getting the full value out of an asset.

24
Approximately 25% of the respondents intend to use RSL to compute and predict the values of assets
owned by their organization. The two States that uses RSL for bridge condition do not use RSL to
compute and predict their asset worth. Some already have performance parameters in bridge
management that can be calibrated to RSL:
Virginia and Oregon state that the condition of the bridge and its elements can be calibrated to
RSL.
Michigan does not intend to use RSL to compute and predict their asset worth, but has
identified parameters, such as historical performance measures for certain materials/structural
details, and performance of specific materials for given environmental exposures.
Texas proposes that steel and concrete coatings as well as expansion joint seals could be
managed with RSL.
Utah responded that performance parameters, such as anticipated treatment life, environment,
ADT, percent truck traffic, concrete cover, structure flexibility (more flexibility = more cracks),
surface treatment, structure age, stay-in-place forms, and structure type can be calibrated to
RSL.
Delaware intends to use RSL for computation and prediction of their asset worth, and considers
age, bridge functionality, and environment as potential parameters that could be calibrated to
RSL.
Colorado does not intend to use RSL to compute and predict their asset worth, but has
identified joint condition, deck condition and functional obsolescence as potential parameters.
44.8 % of the respondents indicated they have common management measures for bridge and
pavement, as shown below:
VDOT, Oregon, and Pennsylvania DOT use condition as a common management measure for
bridge and pavement assets.
New Hampshire has a bridge management committee that implements recommended
investment and maintenance schedules for both pavement and bridges.
Michigan uses the Road Quality Forecasting System (RQFS) and the Bridge Condition Forecasting
System (BCFS) models to do pavement and bridge life cycle analysis and condition forecasting.
Texas uses ‘Key Performance Measures’. The Key Performance Measures for bridges are
intended to use Bridge Inspection Condition Ratings to evaluate the condition of the state bridge
inventory. Similarly, the pavement assets have pavement condition scores based on the ride
quality and pavement distress, adjusted for traffic and speed.
INDOT uses DRUMS software for both pavement and bridge.
Oklahoma manages both bridge and pavement through traffic management. Some respondents
provided suggestions on the most effective ways to present the condition of bridges and
pavements to legislators and taxpayers:
Michigan suggested making simple comparisons to things that taxpayers understand. For
example, changing the oil in your car, or replacing the roof on your house, as opposed to
replacing the car, or replacing the house.
25
Delaware stated that showing cost information does not work because we are talking about
dollar amounts that a layperson cannot fathom (i.e., billions of dollars).
Pictures/videos of minor deterioration that needs addressing (i.e., spalls, torn joints, etc.)
combined with the effect on the bridge or user are easier to comprehend.
Wyoming suggested that providing visuals showing how various budget scenarios affect
performance measures over time could be effective.
Other states suggest using age, percentage in good, fair, and poor condition, presenting
condition in terms of structural deficiency to justify the need for funding, and relating condition
to reliability and funds needed for maintenance.
4.1.2 Pavement Management Survey Results
The pavement management survey received a total of 17 responses. Only 4 states, Washington, Kansas,
Kentucky and New Mexico, use remaining service life. RSL is defined and calculated as the number of
years until the pavement reaches an established threshold and requires major intervention.
Washington DOT, however, uses percent RSL as the ratio between remaining years to the average
expected life. The average life is determined by looking at historical data by region, since some regions
have milder climates than others. A healthy system has a percent RSL between 45 and 55%, with an
ideal value of 50%.
New Mexico uses RSL to determine the benefit and performance of a given treatment. Washington and
Kansas both use RSL to determine the pavement condition and the need for intervention. Kentucky uses
RSL to determine trends in the system based on investments and pavement sustainability ratio.
The state of California DOT uses remaining life until next treatment is due, instead of one general RSL.
They set thresholds for IRI, cracking and faulting, then track parameters such as smoothness life and use
performance models to determine the remaining life until the thresholds are reached.
Only two states have a common asset management measure that could be used for both pavement and
bridge assets. New York uses percentage of assets in the poor condition (% poor), and Wyoming uses
measures required in Highway Performance Monitoring System (HPMS).
Percentwise, the results are similar with the results reported in the NCHRP Synthesis by Zimmerman et
al. (2017), who found 31% of the responding states use RSL. The survey results indicated that 49% of
the state DOTs and 38% of the Canadian MOTs that responded to the survey, use customized pavement
management software. The survey also found that 42% of the agencies have a database with
information on routine maintenance activities, 31% with remaining service life, 13% with detailed
performance data, and 2% with drainage information. It is interesting to note that when asked what
capabilities their pavement management systems provided, the most common answers were:
Forecast expected conditions under different funding scenarios (85%).
Prioritize project recommendations under constrained funding (80%).

26
Estimate funding required to achieve performance targets (80%).
Contribute to the development of a transportation asset management plan (74%).
Evaluate the cost-effectiveness of different treatments (74%).
Set program budget allocations (72%).
Allocate funding to regions based on needs (70%).
Set performance targets for portions of the network (70%).
Analyze gaps between current and desired performance (61%).
Prepare Highway Performance Monitoring System submittals for FHWA (48%).
4.2 TASK 2 RESULTS
A review of the current systems used by MnDOT Bridge Office and by the Materials and Road Research
Office has identified similarities and differences between the two systems. Both systems calculate RSL,
however, the RSL value for bridges is determined using different criteria than for pavements, and the
use of RSL in the two system is also different.
For pavements, RSL is calculated based on the Ride Quality Index (RQI) that describes how smooth the
pavement based on ratings from a panel of individual users. RQI is directly related to IRI measurements,
and, as a consequence, it was selected as a Good/Poor measure. A road with an RQI of 2.5 is considered
to need major rehabilitation, and associating an RQI value of 2.5 to zero RSL can give a reasonable
prediction of how much of the system would be approaching Poor. In pavement management, RSL is
used as planning tool. It is assumed that an even distribution of RSL values across the system makes
planning easier and more consistent from year to year. When the distribution is skewed to the left, it
indicates a looming near-term need for investment in order to maintain ride quality performance, as
shown in Figure 1.
Figure 4.1 Remaining Service Life Distribution (from Annual Minnesota Transportation Performance Report,
2015)

27
4.3 WORK PLAN FOR PHASE 2
Based on the information collected in the first two tasks and on input from TAP members, the following
suggestions and recommendations are made for advancing the use of RSL as a common metric for
assessing the condition of bridge decks and pavement networks.
Since an RSL of zero does not represent an unsafe condition of bridges and pavements, it is
recommended that the name changes to remaining service interval (RSI) or something similar. In many
instances, pavements in poor condition that are still operational have in fact negative values of RSL,
since their rehabilitation activities were deferred to future budget years. However, they are still
reported as having RSL values of zero.
Using a numeric value for RSL in pavements does not offer a clear picture of the condition of the
network, since some pavements have a design life of 30 years, others 20 years or less. It is
recommended that the numeric value is replaced with a percent value that normalizes the RSL over
different types of pavements. For example a 10 year old pavement with a design life of 20 years will
have a percent RSL of 50 (i.e. 50%). An average value of percent RSL (or percent RSI) of the network
could be more representative of the aging condition of the network than a numeric value. Percent RSL
can also be calculated and used for bridge decks. In addition, percent RSL can be used for other asset
management components, and provide a more representative picture of the age of all assets in the
system.
By using percent RSL metric, it may be possible to propose target average values that result in optimal
life cycle costs, and use the concept of even distribution of the values to make planning more consistent
from year to year, as suggested by MnDOT pavement management. For example, if we assume an
average design life of 20 years and the system at present time has an hypothetical even distribution of
percent RSL, as shown in the next figure, it becomes apparent that by fixing 1/20th of the pavements
every year (i.e. move the pavements approaching 0 %RSL to 100 %RSL) the even distribution will not
change and the average of the distribution would be 50%, the ideal value recommended by WSDOT.
Small deviations could bring the average between 45% and 55%, recommended by WSDOT for a healthy
system.
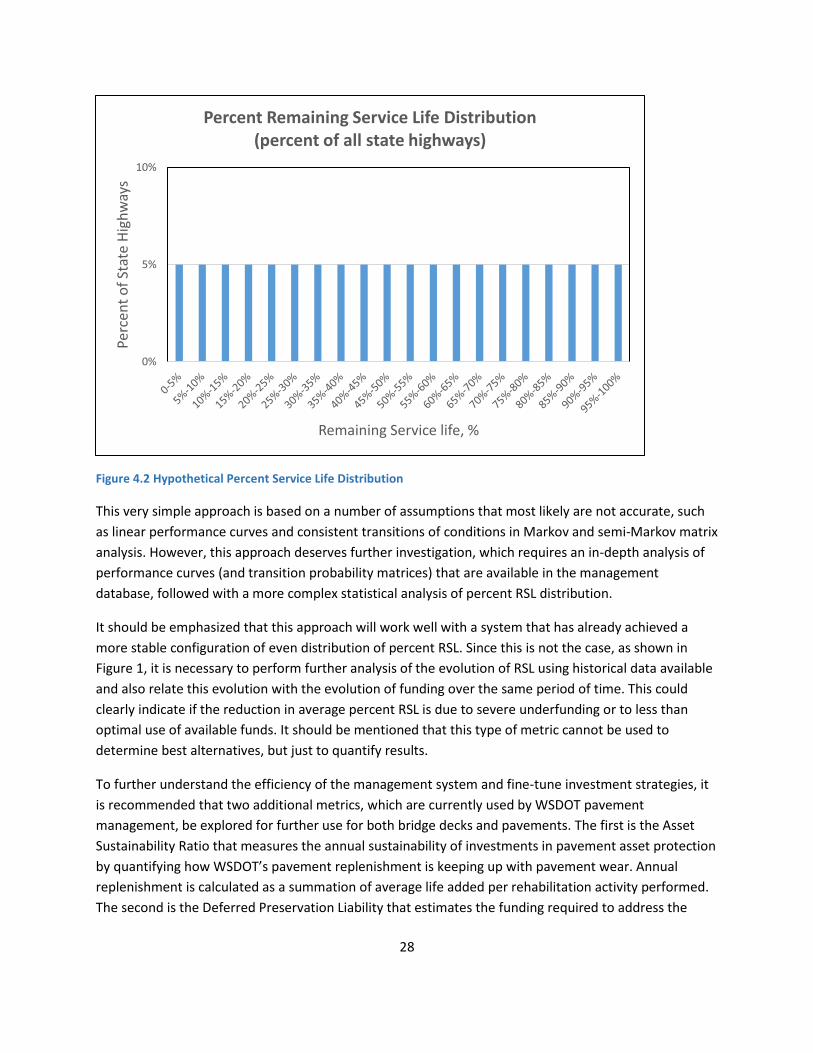
28
Figure 4.2 Hypothetical Percent Service Life Distribution
0%
5%
10%
Perc
ent
of
Stat
e H
igh
way
s
Remaining Service life, %
Percent Remaining Service Life Distribution(percent of all state highways)
This very simple approach is based on a number of assumptions that most likely are not accurate, such
as linear performance curves and consistent transitions of conditions in Markov and semi-Markov matrix
analysis. However, this approach deserves further investigation, which requires an in-depth analysis of
performance curves (and transition probability matrices) that are available in the management
database, followed with a more complex statistical analysis of percent RSL distribution.
It should be emphasized that this approach will work well with a system that has already achieved a
more stable configuration of even distribution of percent RSL. Since this is not the case, as shown in
Figure 1, it is necessary to perform further analysis of the evolution of RSL using historical data available
and also relate this evolution with the evolution of funding over the same period of time. This could
clearly indicate if the reduction in average percent RSL is due to severe underfunding or to less than
optimal use of available funds. It should be mentioned that this type of metric cannot be used to
determine best alternatives, but just to quantify results.
To further understand the efficiency of the management system and fine-tune investment strategies, it
is recommended that two additional metrics, which are currently used by WSDOT pavement
management, be explored for further use for both bridge decks and pavements. The first is the Asset
Sustainability Ratio that measures the annual sustainability of investments in pavement asset protection
by quantifying how WSDOT’s pavement replenishment is keeping up with pavement wear. Annual
replenishment is calculated as a summation of average life added per rehabilitation activity performed.
The second is the Deferred Preservation Liability that estimates the funding required to address the

29
cumulative backlog of deferred pavement rehabilitation. The estimate takes into consideration the
higher cost of rehabilitation as pavement condition gets worse and more extensive repairs are needed.
An alternative approach to the liability measure is the Cost of Inadequate Funding, which represents the
additional costs achieved at the lowest life cycle.

30
CHAPTER 5: CONCLUSIONS AND RECOMMENDATIONS
In this investigation, preliminary work was performed to determine if a common metric, such as a
service life parameter, can be used across MnDOT’s bridge and pavement assets. MnDOT has used
remaining service life (RSL) for pavement condition for several years and has started to use RSL for
bridge condition. However, much work remains to be done.
First, a literature review was performed to summarize current methods used in asset management
followed by a survey used to collect information to understand the methods used by different DOTs in
their asset management programs. Next, an assessment of current practice used in MnDOT Bridge
Office and Materials and Research Office was performed. Based on the information collected,
suggestions for a possible common method and implementation guidelines were presented.
The following relevant conclusions were drawn at the end of this investigation:
Both MnDOT Bridge Office and Materials and Research Office have very good management systems in place, compared to current systems reported, as part of the survey, by other DOT.
Both systems calculate RSL. However, the RSL value for bridges is determined using different criteria than for pavements, and the use of RSL in the two systems is also different.
There is very good potential to develop a new common metric that could be used by both offices to make more informed decisions and optimize the use of available funds.
Based on the work performed in this phase, the research team recommends using Percent Remaining Service Interval (PRSI) as a common metric.
By using PRSI, it may be possible to propose target average values that result in optimal life-cycle costs, and use the concept of even distribution of the values to make planning more consistent from year to year.
The research team also recommends exploring the use of two additional metrics that could help fine-tune investment strategies: Asset Sustainability Ratio and Deferred Preservation Liability (or Cost of Inadequate Funding).
As part of a follow up phase two, the research team could perform the following activities:
Work closely with staff from the two offices to obtain relevant data to calculate PRSI for different categories of pavements and bridge decks
Perform analyses that relate different levels of PRSI to funding requirements
Perform calculations to determine how much time and funding is required to bring the system to a stable configuration of even distribution of PRSI, which allows for more consistent planning
Determine what type of activities, such as timely preservation, could provide a more efficient use of funding
Calculate and explore the use of additional metrics, as mentioned above, for both bridge and pavement offices
Explore the use of PRSI for other components of MnDOT asset management.

31
REFERENCES
Adams, T. M., Kang, M., & Pincheira, J. A. (2009). Sensitivity Analysis of Bridge Health Index to Element
Failure Costs and Conditions. Midwest Regional University Transportation Center, Madison, WI.
Bektas, B. A. (2015). Next Generation Bridge Management Tools and Inspection (No. MN/RC 2015-47).
Minnesota Department of Transportation, Research Services & Library. St. Paul, MN.
Blanchard, A., & Thomas, D. (December 21, 2017). Meeting at MnDOT Bridge Office, Oakdale, MN.
Caner, A., Yanmaz, A. M., Yakut, A., Avsar, O., & Yilmaz, T. (2008). Service life assessment of existing
highway bridges with no planned regular inspections. Journal of performance of constructed facilities,
22(2), 108-114.
Chase, S. B., Adu-Gyamfi, Y., Aktan, A. E., & Minaie, E. (2016). Synthesis of National and International
Methodologies Used for Bridge Health Indices (No. FHWA-HRT-15-081). Research, Development, and
Technology Turner-Fairbank Highway Research Center, McLean, VA.
Fereshtehnejad, E., Hur, J., Shafieezadeh, A., & Brokaw, M. (2017). Ohio Bridge Condition Index:
Multilevel Cost-Based Performance Index for Bridge Systems. Transportation Research Record: Journal of
the Transportation Research Board, (2612), 152-160.
Ford, K. M., Arman, M., Labi, S., Sinha, K. C., Shirole, A., Thompson, P., & Li, Z. (2010). Methodology for
estimating life expectancies of highway assets. Washington, DC: National Cooperative Highway Research
Program.
Gina L.C., Paul A, N., & Charles B., MRICS (2015). Service Life Predictions for Reinforced Concrete
Bridges. STRUCTURAL FORENSICS, 11.
Hearn, G. (2015). Element-Level Performance Measures for Bridge Preservation. Transportation
Research Record, 2481, 10–17.
Jeong, Y., Kim, W., Lee, I., & Lee, J. (2017). Bridge service life estimation considering inspection
reliability. KSCE Journal of Civil Engineering, 21(5), 1882-1893.
Jiang, X., & Rens, K. L. (2010). Bridge health index for the city and county of Denver, Colorado. II: Denver
bridge health index. Journal of performance of constructed facilities, 24(6), 588-596.
Lake, N. & Seskis, J. 2013, Bridge Management through performance models, No. AP-T258-13, ISBN 978-
1-925037-36-4, AUSTROADS, New South Wales, Australia.
Michigan Department of Transportation. Pavement Management System. Transportation Asset
Management. Retrieved from www.michigan.gov/documents/pavement_16566_7.pdf

32
Minnesota Department of Transportation (2017). 2016 Pavement Condition Annual Report. MnDOT,
Office of Materials and Road Research, Pavement Management Unit, Maplewood, MN.
MnDOT Bridge Office (2015). Bridge Preservation and Improvement Guidelines Fiscal Year 2016 through
2020, MnDOT, Oakdale, MN.
MnDOT Bridge Office (2017). Bridge Replacement and Improvement Management (BRIM), MnDOT,
Oakdale, MN.
MnDOT Office of Transportation System Management (2016). Quantifying the Impact of Bridge
Maintenance Activities on Deterioration: A Survey of Practice and Related Resources. Transportation
Research Synthesis, TRS 1509, 12, MnDOT, St. Paul, MN.
Nelson, S. L. (2014). Deterioration Rates of Minnesota Concrete Bridge Decks (No. MN/RC 2014-40).
Minnesota Department of Transportation, Research Services & Library, St. Paul, MN.
Patidar, V., Labi, S., Sinha, K., Thompson, P., Shirolé, A., & Hyman, W. (2007a). Performance measures
for enhanced bridge management. Transportation Research Record: Journal of the Transportation
Research Board, (1991), 43-53.
Patidar, V., Labi, S., Sinha, K., & Thompson, P. (2007b). Multi-objective optimization for bridge
management systems (Vol. 67). Transportation Research Board, Washington, D.C
Premkumar, L., & Vavrik, W. R. (2016). Enhancing pavement performance prediction models for the
Illinois Tollway System. International Journal of Pavement Research and Technology, 9(1), 14-19.
doi:10.1016/j.ijprt.2015.12.002
Elkins, G. E., Thompson, T. M., Groeger, J. L., Visintine, B., & Rada, G. R. (2013). Reformulated Pavement
Remaining Service Life Framework US Department of Transportation Federal Highway Administration.
Publication NO. FHWA-HRT-13-038. Research, Development, and Technology Turner-Fairbank Highway
Research Center, McLean, VA
Saeed, T. U., Moomen, M., Ahmed, A., Murillo-Hoyos, J., Volovski, M., & Labi, S. (2017). Performance
Evaluation and Life Prediction of Highway Concrete Bridge Superstructure across Design Types. Journal
of Performance of Constructed Facilities, 31(5), 04017052.
Uhlmeyer, J., Luhr D. & Rydholm, T. (2016). Pavement Asset Management, WSDOT, Tumwater, WA.
USDOT Office of Asset Management (2005). Transportation asset management case studies: Bridge
management experiences of California, Florida, and South Dakota. Retrieved from
https://www.fhwa.dot.gov/infrastructure/asstmgmt/bmcs7.pdf

33
USDOT Office of Asset Management (2012). Transportation asset management case studies: Bridge
management Practices in Idaho, Michigan and Virginia. Retrieved from
https://www.fhwa.dot.gov/asset/hif12029/hif12029.pdf
Hammond, P. J., (2012). The Gray Notebook GNB Edition 48. WSDOT’s quarterly performance report on
transportation systems, programs, and department management, Tumwater, WA.
Zimmerman, J.M., Olson, S.A, & Schultz, A. E. (2007). Determining Economic Strategies for Repair and
Replacement of Low Slump Overlays of Bridge Decks, MN/RC-2007-14. Minnesota Department of
Transportation, Minneapolis, MN.

APPENDIX A: SURVEY TO ASSESS METHODS USED IN ASSET
MANAGEMENT PROGRAMS

A-1
Bridge Survey Responses
1. Name, Position/Title, Name of Organization, and email address
Text Response
Adam Matteo, Assistant State Bridge Engineer, VDOT, [email protected]
Richard I. Kerr, P.E., Bridge Management Inspection Engineer, Florida Department of Transportation,
Jessen Mortensen, State Bridge Engineer, Nevada Department of Transportation, [email protected]
Amanda Jackson, Bridge Management Engineer, Montana Department of Transportation,
Billy Varney, State Bridge Engineer, WVDOT, [email protected]
Bob Landry, Administrator of Bridge Design, New Hampshire Department of Transportation,
Ray elhami, Bridge Management Engineer, LADOTD, [email protected]
Michael Hill, State Heavy Bridge Maintenance Engineer, ARDOT, [email protected]
Daniel Muller, Structures Policy Development Engineer, NCDOT, [email protected]
Thomas E. Quinn, Assistant Director of Structures, Tennessee Dept. of Transportation, [email protected]
Bruce Johnson, State Bridge Engineer, Oregon DOT, [email protected]
Robert Kelley, Bridge Management Systems Engr, Michigan Dept of Transportation,
Matthew Chynoweth, Chief Bridge Engineer, Michigan Department of Transportation,
Chris Duncan, Preventive Maintenance Program Manager, Mississippi Department of Transportation ,
Steven Austin, Transportation Engineer, Texas Department of Transportation, [email protected]
Jon Ketterling, ND State Bridge Engineer, NDDOT, [email protected]

A-2
Jera Irick, Bridge Inspection Manager, Utah Dept. of Transportation, [email protected]
Ryan Bowers, Structures Asset Management Engineer, Wisconsin DOT, [email protected]
Walter Peters, Assistant Bridge Engineer - Maintenance, ODOT, [email protected]
Tim Keller, Administrator Office of Structural Engineering, Ohio DOT, [email protected]
Dave Coley, Bridge Management Engineer, South Dakota DOT, [email protected]
Carl Puzey, Engineer of Bridges and Structures, Illinois Department of Transportation,
Paul Cortez, Asst State Bridge Engineer, Wyoming DOT, [email protected]
Adam Post, Bridge Asset Manager, INDOT, [email protected]
Jason Hastings, State Bridge Engineer, Delaware DOT, [email protected]
Chester Kolota, P.E., Asst. Bridge Management Engineer, Maine DOT, [email protected]
Harjit S Bal, P.E., Project Engineer, NJDOT, [email protected]
Tom Macioce, Chief Bridge Engineer, Pennsylvania Department of Transportation, [email protected]
Michael Collins, Bridge Asset Management Engineer, Colorado Department of Transportation,
Scott Stotlemeyer, Assistant State Bridge Engineer, Missouri DOT, [email protected]
Scott Neubauer, Bridge Maintenance and Inspection Engineer, Iowa D.O.T., [email protected]
2. Does your Office quantify bridge deterioration?
# Answer Response %
1 Yes 24 77.4
2 No 7 22.6

A-3
3. If yes, how do you compute the time when a major intervention is required?
Kindly, mention the metric used and its threshold value.
Text Response
Condition - combination of condition states, chloride penetration and GCR
We do not use a set time, we base our actions on the condition of the structure. Generally using the bridge
inspection reports
condition rating of 4
We don't compute usually just by visual means. Reactive.
whenever a major bridge element becomes a 4 or worst
We have bridge deterioration curves for our bridges and software that makes
replacement/rehab/preservation recommendations based on triggers (NBI numbers, postings, SD and our
developed Bridge Condition Index). All recommendations are then reviewed by an engineer to verify it is
appropriate.
We simply plot the time it has historically take for an average bridge to transition from one NBI condition
code to a lower one and then assume a bridge in fair condition (code 5 or 6) will need preservation
treatments and a bridge in poor condition (code 4) will need rehabilitation.
Serious and critical structures (those with major condition ratings <4) addressed immediately. Poor
structures (major condition rating=4) replaced or rehabilitated as funds are available and not at expense of
maintaining structures in fair or good condition.
We compute deterioration rates using Markov Probabilities, and we have thresholds for work types based
on good/fair/poor. We have established rehabilitation and repair matrices based on bridge deck percent
deterioration, which typically drives the decision making as to when to rehab/replace a bridge.
Replacement Index, 60
Structures identified to be structurally deficient or functionally obsolete with a sufficiency rating less than
50 are eligible for replacement or major rehabilitation through a program called the Highway Bridge
Program (HBP). Programming for the HBP occurs annually and is for a 5 year outlook. Structures neither
structurally deficient nor functionally obsolete are prioritized at the district level for bridge maintenance or
improvement (preservation) work. Various criteria are used at the district level to select projects. However,
a specific metric with a threshold value is not a requirement. For preservation projects with high cost
estimates, a life-cycle cost analysis is performed to better evaluate the value of a preservation project
against replacement.

A-4
Condition! Typically planned when NBI is a 5 so does not get to NBI of 4
We determined that it is time for a major rehabilitation or replacement of the deck based on the following
metrics:
For Deck Replacement Only: CS3 and 4 of Deck (Potholes), Chloride Concentration and If a Structure
Replacement is warranted
For Structure Replacement: BHI, CS3 and 4 of all primary elements, Load Rating, Capacity, Clearance
NBI value, and threshold depends on time of work to be done.
GA equal to or less than 4. We also have metrics for deck, wearing surface, and coatings.
Currently major work is condition based and no time is calculated. We expect to use deterioration curves in
the near future.
We've developed deterioration models based on NBI Condition Ratings. Rehabilitation actions are then
associated with the NBI Condition Ratings.
Using a combination of dTIMS deterioration modeling software and asset engineer input. Threshold values
vary depending on component which each have different triggers based on component age, rating, and
potentially other component ratings.
We use AASHTO BrM in conjunction with our deficiency formula to rank the bridges based on condition and
functionality. From there, we identify the top 120-150 bridges that should have work done (maintenance,
rehab, or replacement) and send them to the group that we think should be responsible (Bridge
Maintenance for in-house or contracted maintenance up to patches and small joint replacements or Bridge
Design for rehabs or replacements).
NBI Condition Rating less than 5.
Currently, we are using expert solicitation. In future, we are going to develop methodology that works for
NJ.
Not clear about what metrics are being referred to.
Current: Condition based; components or multiple components classified as structurally deficient.
2018+: to be complaint with FAST Act, deterioration models predict span of time in future when
rehabilitation is most effective to achieve lowest life cycle cost.

A-5
Currently we only model deterioration at a network level. Our inventory is prioritized based on current
condition and programmed to recommend (Bridge Preventative maintenance including rehabs) BPM
treatments at a high-fair condition. The model is recommended to the Regions. Decisions on treatments /
intervention for rehabs on specific structures is is managed through the regions based on model
recommendations and regional experience. As bridges become poor they qualify and are prioritized within
our Bridge Enterprise program and are planned for replacement.
We don't use threshold values to make decisions.
Based on engineering judgment and experience of District Bridge Maintenance Engineers and Programming
Engineers, NBI condition ratings and internal programming/prioritization criteria which is based on
numerous factors such as NBI condition ratings, load ratings and postings, ADT etc.
Major interventions (i.e., rehabs and replacements) are planned based on an assessment of the structure's
condition, the relative change in condition over the course of time (i.e., how quickly is it deteriorating),
experience with similar structures in our inventory, and available funding. We do not use deterioration
curves or an algorithm to predict/compute remaining service life or time to intervention.
4. If no, do you plan to quantify bridge deterioration in future?
# Answer Response %
1 Yes 5 71.4
2 No 2 28.6
5. If yes, what measure do you intend to use to quantify the condition of the
bridge?
Text Response
We don't know yet. Hopefully, we will find out soon. We are in the process of scoring RFP responses for
a Bridge Analytic Tool that will help us track bridge deterioration.
BrM 5.3
Combination of Defect Specific Element Condition and Maintenance History

A-6
performance measure of bridge as good, fair or poor according to FHWA definition based on NBI coding
NBI data
6. Does your Office use remaining service life (RSL) to quantify bridge
deterioration?
# Answer Response %
1 Yes 22 91.7
2 No 2 8.3
7. If yes, how is RSL defined, calculated and used in your bridge management
program?
Text Response
We simply have plotted the age of bridges that have historically been replaced and assume that when a
bridge reaches that age or 10 years after it transitions to an NBI code of 4, which ever if sooner, that it
has reached the end of life.
RSL is not used in our bridge management program as it is an inaccurate subjective measure. RSL is
mainly used as a target for getting the full value out of an asset.
8. What are the types of assets managed in your organization using RSL?
# Answer Response %
1 Bridge 1 50
2 Pavement 0 0

A-7
3 None 1 50
9. Whether your Office uses RSL or not, should RSL be used only for bridge decks,
or should it be used for all bridge components (decks, girders, bents, piers, etc.)?
# Answer Response %
1 Decks only 5 20.8
2 All components 19 79.2
10. Does your Office have access to data that links RSL (or other deterioration
measures) to Bridge Condition?
# Answer Response %
1 Yes 7 29.2
2 No 17 70.8
11. Are there other performance parameters used in bridge management that
can be calibrated to RSL?
# Answer Response %
1 Yes 7 29.2
2 No 17 70.8
12. If yes, please list those performance parameters.
Text Response
Condition

A-8
Good, Fair, Poor Federal Bridge Measures
Historical performance measures for certain materials/structural details, performance of specific
materials given the environmental exposure.
Management of steel and concrete coatings as well as expansion joint seals have performance that could
be managed with RSL.
Anticipated Treatment Life, Environment, ADT, % Truck Traffic, Concrete Cover, Structure Flexibility (aka
more Flex = more cracks), surface treatment, structure age, stay in place forms, structure type
Joint cond, Deck cond, FO
13. Do you use or intend to use RSL to compute and predict the values of assets
owned by your organization?
# Answer Response %
1 Yes 6 25
2 No 18 75
14. Are there any common management measures for bridge and pavement
assets in your State?
# Answer Response %
1 Yes 13 44.8
2 No 16 55.2

A-9
15. If yes, please list those common management measures.
Text Response
Condition: Good, Fair, Poor, Deck expansion joints
Pavement - none for bridges
we have a bridge management committee that is implementing Recommended Investment and
Maintenance Schedules
We use several NBI numbers, whether or not it is posted, whether or not it is SD and a Bridge Condition
Factor that was developed internally
Bridge Health Index (% Good) and %SD
Bridges not Distressed, Bridges in Good, Fair, Poor condition, Pavements in Good, Fair, Poor condition
Percent of poor bridges by deck area, condition distribution of network over time with respect to lowest
of NBI items 58, 59, 60, and 62.
The DOT currently has a robust asset management system for both pavements, and bridges, which
influencing overall asset management for all local agency assets as well.
TxDOT has adopted a “Key Performance Measures” to ensure improvement trends and management of
our assets. The Key Performance Measures for bridges are intended to use Bridge Inspection Condition
Ratings to evaluate the condition of the state bridge inventory. The goal of the bridge specific Key
Performance Measure is to ensure that the condition of the Department's Bridge Inventory is improving
over time. Similarly, the pavement assets have pavement condition scores based on the ride quality and
pavement distress, adjusted for traffic and speed. The goal of the pavement specific Key Performance
Measure is to report on the percentage of lane miles in good or better condition and identify the change
over time.
condition states
Traffic management
DRUMS software
Bridge Condition: Good, fair, poor
Pavements: IRI and OPI
Other assets: Condition based

A-10
16. What do you think is the most effective way to present the condition of
bridges and pavements to others (e.g., legislators and tax-payers)?
Text Response
Age, percentage in Good condition
FDOT has established performance measures at various levels and reports the system wide higher-level
ones to legislatures and publishes them.
good, fair, poor condition
% of deck area in good, fair, poor condition seems to be the best way, especially if shown graphically.
Structurally deficient is a term we're trying to away from but it is something that people respond to. It's
easier to justify the need for more funding than just to say that something is poor.
area of bridges structurally deficient
social media
We will probably stick with Good/Fair/Poor as defined by FHWA
Relating condition to reliability and funds needed for maintenance.
we use FHWA definition of good, fair or poor according to NBI coding and whether structurally deficient
Good, Fair, Poor
For bridges, percentage of poor bridge deck area over time.
Make simple comparisons to things they understand. For example, changing the oil in your car, or
replacing the roof on your house, as opposed to replacing the car, or replacing the house. Our law
makers need to understand the importance of true asset management, where assets in all condition
states are maintained appropriately.
Presenting the physical conditions of bridges along with anticipated maintenance/repair costs is the most
effective way.

A-11
TxDOT is currently developing a Transportation Asset Management Plan. A summary of the condition of
bridges and pavements will be a part of this plan. It is believed that this document will provide much of
the information of interest to legislators and tax-payers.
Additionally, our office produces annual statistics on bridges and posts these "Bridge Facts" to the
internet: http://www.txdot.gov/inside-txdot/forms-publications/consultants-
contractors/publications/bridge.html. This document is a standalone document that can provide
legislators and tax-payers a summary of the state bridge inventory.
Trends for network-wide average for percentage of network in "Good”, “Fair" and "Poor" bands. The
actual measure used is less important than past and projected trends.
Please see our Annual Bridge Report at this link:
https://www.udot.utah.gov/main/uconowner.gf?n=39515520661261033
Good-Fair-Poor
Good, fair, poor condition
Good, fair and poor is better than SD and FO
Provide visuals showing how various budget scenarios affect performance measures over time.
Percent of bridges in good, fair, poor condition
I don't think just putting out cost information works because we are talking about dollar amounts that a
lay person cannot fathom (i.e., billions of dollars). Pictures/videos of minor deterioration that needs
addressing (i.e., spalls, torn joints, etc.) combined with the effect on the bridge or user (i.e., misaligned
car from a pothole or rusting beam ends from joint leaks) show the issue, which is easier to comprehend.
Good, Fair, and Poor approach along with the funding level necessary to maintain a state of good repair.
Percent Poor by deck area using elements.
Percent Good by deck area using elements.
Use the performance measures by FHWA.
As elementary as possible.
It seems to work best when you can provide dollar values for the needs of the inventory.

A-12
Pavement Survey Responses
1. Email
Text Response
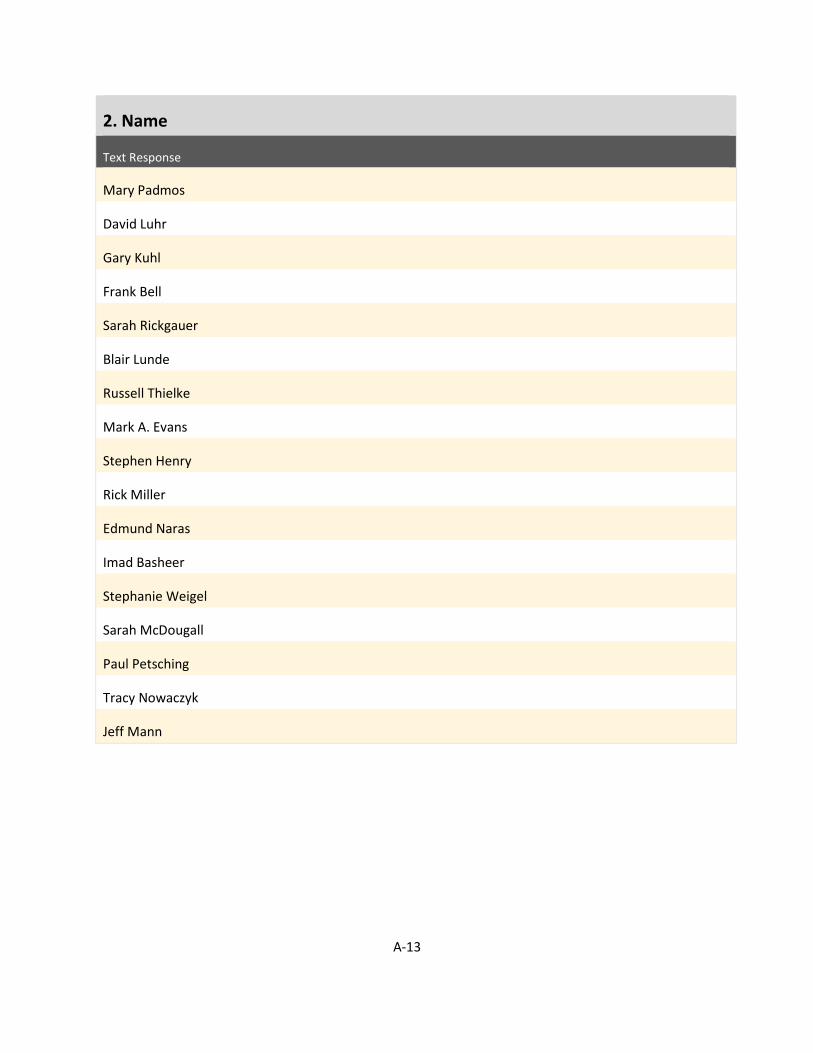
A-13
2. Name
Text Response
Mary Padmos
David Luhr
Gary Kuhl
Frank Bell
Sarah Rickgauer
Blair Lunde
Russell Thielke
Mark A. Evans
Stephen Henry
Rick Miller
Edmund Naras
Imad Basheer
Stephanie Weigel
Sarah McDougall
Paul Petsching
Tracy Nowaczyk
Jeff Mann

A-14
3. Name of your organization
Text Response
Montana Department of Transporation
Washington State DOT
Utah DOT
ALDOT
Wyoming Department of Transportation
SDDOT
NYSDOT
Arkansas Department of Transportation
Colorado DOT
Kansas Dept. of Transportation
MassDOT-Highway Division
California Department of Transportation
NDDOT
DelDOT
Rhode Island Department of Transportation
Kentucky Transportation Cabinet
NMDOT

A-15
4. Position
Text Response
Pavement Management Engineer
State Pavement Management Engineer
Pavement Management Engineer
Pavement Management Engineer
Pavement Management Engineer
Pavement Management Engineer
Chief of Pavement Management Systems
Assistant Division Engineer
Pavement Manager
Pavement Management Engineer
Pavement Management Engineer
Senior Pavement Management Engineer
Pavement Management Engineer
Pavement Management Engineer
Senior Civil Engineer
Pavement Management Branch Manager
Pavement Engineer

A-16
5. What measures are used by your Office to quantify the condition of your
pavement network?
Text Response
ride, rut, cracking, etc
1) Remaining Service Life 2) Deferred Preservation Liability 3) Asset Sustainability Ratio 4) Pavement
Condition Index
surface distress: iri, rutting, cracking, spalling, faulting, bleeding, raveling
Composite Pavement Condition Rating and individual indexes based on MRI, MRUT, wheelpath cracking
(R 55-like) and age of pavement
In-house composite number and HPMS guidelines
We use various distresses to evaluate condition.
Surface Score
Pavement Condition Index (Asphalt - IRI, rutting, cracking; Concrete - JCP - IRI, cracking, faulting;
Concrete - CRC - IRI, cracking)
Drivability Life
Roughness, Transverse Cracking, Joint Distress, Rutting, and Faulting
Pavement Serviceability Index (PSI)
AC: cracking, IRI. JPCP: cracking, faulting, IRI
IRI, Rutting, Faulting, Distress/Cracking
Overall Pavement Condition
Pavement Structural Health Index (PSHI)
Pavement Distress Index IRI Pavement Sustainability Ration Remaining Service Interval
Typical pavement distress in line w FHWA LTPP, HPMS and internal including cracking, rutting, IRI, edge
cracking, raveling, faulting, etc.

A-17
6. Does your Office uses remaining service life (RSL)?
# Answer Response %
1 Yes 4 23.5
2 No 13 76.5
7. (If not) What other measures do you use?
Text Response
overall pavement condition (opi)
---
we use Index values for our deterioration model
answered in previous question...
Ride, Rutting, Friction, Crack Percentage, Faulting, Composite value for evaluation.
This question doesn't make any sense.
%VMT on Good and Excellent, %Poor, Backlog
FWD is used to determine RSL only on a project level. We collect statewide friction tests but the data is
not currently used in the Pavement Management System. We use ground penetrating radar (GPR) in
conjunction with our FWD units. We are in the process of implementing GPR at a network level for
pavement thickness data and hope to use it as a condition tool if possible (voids, water, etc.)
Index Values (scale of 0-100) for Transverse, Longitudinal, Fatigue, Corner Break, IRI, and Rutting
Ride Quality (IRI)
We collect a lot of surface condition data but we do not use them in decision making.
None
We have many pavement condition indices for individual distresses that go into our overall pavement
condition number.
Will report according to HPMS requirements for FHWA

A-18
8. (if yes) How is RSL defined and calculated?
Text Response
Number of years to the next pavement rehabilitation
RSL is the time until the first of any of the distresses reach established thresholds through a Monte Carlo
simulation. I will dig a little to see if I have any documents describing this. If so, I will email them.
Time from year of survey to time of next recommended intervention
Each treatment has a corresponding cost-benefit of which benefit is used to establish area of curve
suggesting pavement remaining life
9. (If yes) How is RSL used in your pavement management program?
Text Response
Indicates the year when pavement rehabilitation is needed for an individual project. And, at the network
level indicates the average RSL for the system.
It is a tie breaker to determine which pavements in what condition are in need of the more significant
recommended action type.
Currently calculated to check trending on the system against investments and pavement sustainability
ratio
To establish benefit and/or performance of a given treatment
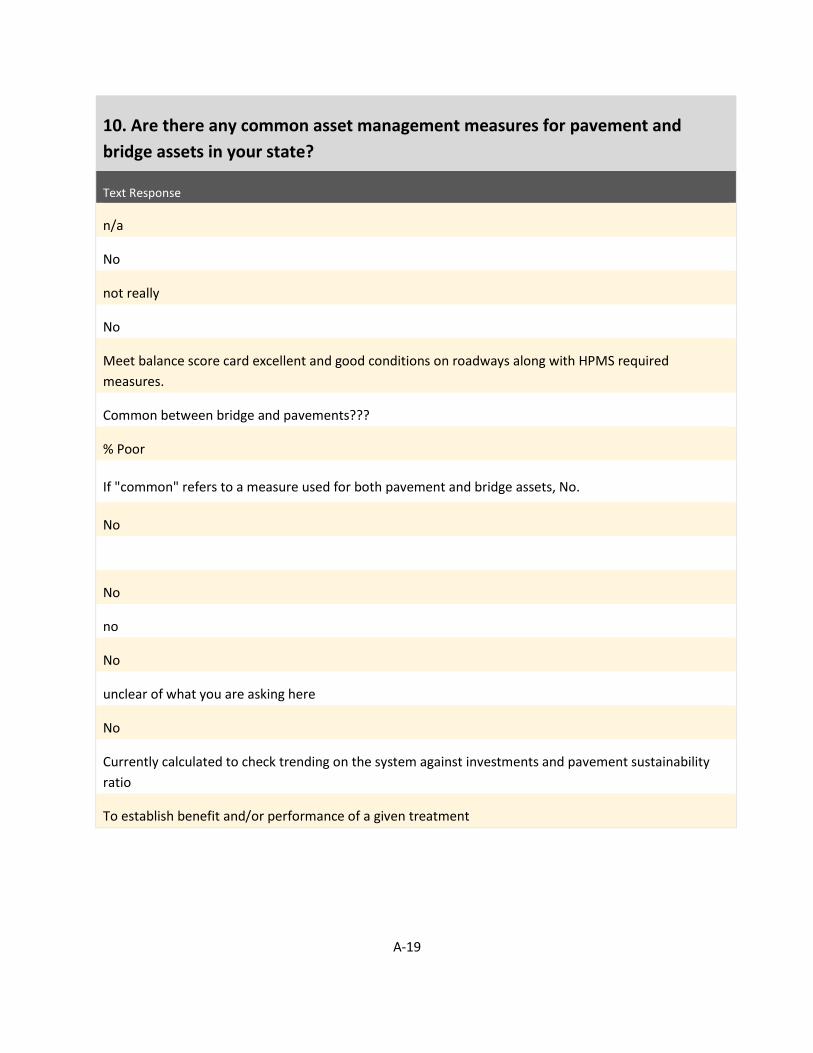
A-19
10. Are there any common asset management measures for pavement and
bridge assets in your state?
Text Response
n/a
No
not really
No
Meet balance score card excellent and good conditions on roadways along with HPMS required
measures.
Common between bridge and pavements???
% Poor
If "common" refers to a measure used for both pavement and bridge assets, No.
No
No
no
No
unclear of what you are asking here
No
Currently calculated to check trending on the system against investments and pavement sustainability
ratio
To establish benefit and/or performance of a given treatment

A-20
11. If you are willing to share any relevant document regarding the pavement
management process in your Office, please send it as an email attachment to
Text Response
OK
https://sites.google.com/a/utah.gov/pavement/home
will send data collection procedure
Agile Assets is used to house all of our data and make projections based on decision trees. We have a
document that we publish every year with the information for a state wide "candidate list" for the
districts to pick projects regarding pavement preservation.
We haven't developed a Drivability Life manual yet, but I am willing to chat about our metric with
someone. (303.398.6579)
I am looking.
Not Available at this time.
We use remaining life till next treatment rather than one RSL. WE track smoothness life and our
performance model determine remaining life till IRI increases to some threshold. Same thing applies to
cracking and faulting.