reliability of vocational assessment: an evaluation of ... · of the human-marked test. what if?...
TRANSCRIPT

Reliability of Vocational Assessment:
An evaluation of level 3
electro-technical qualifications
A project report prepared for the Office of Qualifications and Examinations Regulation by City & Guilds in collaboration with Assessment Europe and the Institute for Employment Studies
Sandra Johnson, Assessment Europe
Rod Johnson, Assessment Europe
Linda Miller, Institute for Employment Studies
Andrew Boyle, The City and Guilds of London Institute
Ofqual/13/5259 January 2013
This report has been commissioned by the Office of Qualifications and Examinations Regulation.

Contents Preface ............................................................................................................................. i Acknowledgements ......................................................................................................... ii Executive summary ........................................................................................................ iii
1 Introduction .............................................................................................................. 1
1.1 Vocational qualifications .................................................................................... 1
1.2 Previous VQ reliability research ........................................................................ 2
1.3 Research aims for this project ........................................................................... 4
1.4 The qualifications selected for evaluation .......................................................... 5
2 Reliability .................................................................................................................. 8
3 The computer-generated on-demand tests (2377) ................................................. 20
3.1 The 2377 certificates and their assessment .................................................... 20
3.2 An approach to reliability estimation ................................................................ 24
3.3 Analysis results ............................................................................................... 26
4 The traditional-format unit test (2391) ..................................................................... 30
4.1 Unit 301 and its assessment ........................................................................... 30
4.2 The multiple-marker study ............................................................................... 32
4.3 Analysis results ............................................................................................... 35
4.3.1 Section results ......................................................................................... 35
4.3.2 Whole-test results: composite score reliability .......................................... 38
4.4 A focus on marker performance ...................................................................... 41
4.5 Study limitations .............................................................................................. 45
5 Discussion and implications ................................................................................... 46
5.1 Study findings and implications ....................................................................... 46
5.2 Conclusions and recommendations................................................................. 47
References .................................................................................................................... 51

i
Preface
This report documents the findings of a five-month collaborative research project
commissioned by the Office for Qualifications and Examinations Regulation (Ofqual)
within its reliability programme. The given replication-based definition of reliability
that the project addressed was the following:
Reliability refers to the consistency of outcomes that would be observed from an assessment process were it to be repeated. High reliability means that broadly the same outcomes would arise. A range of factors that exist in the assessment process can introduce unreliability into assessment results. Given the general parameters and controls that have been established for an assessment process – including test specification, administration conditions, approach to marking, linking design and so on – (un)reliability concerns the impact of the particular details that do happen to vary from one assessment to the next for whatever reason.
City & Guilds provided the response data for the two on-demand computer-delivered
multiple-choice tests described in Section 3, and organised the multiple-marker study
for the two-section written paper described in Section 4. Rod Johnson and Sandra
Johnson analysed the response data for all three tests. Report production was a
collaborative effort with the following contributions: Andrew Boyle (Section 1), Rod
Johnson (Section 2), Sandra Johnson (Sections 3 and 4), Linda Miller (Section 5).
Andrew Boyle was project manager on behalf of City & Guilds.

ii
Acknowledgements
We would like to thank Lisa Pacioni at City & Guilds for providing essential
qualification-related documentation, preparing fieldwork materials, coordinating
markers, managing the multiple-marker study described in Section 4, and
contributing to this report. Thanks are also due to Jenny Carter and Joel Bild for
support and advice on the qualifications considered here, and to Zeeshan Rahman
for supplying the response data for the on-demand multiple choice tests and for
reviewing an earlier draft of this report. Our gratitude extends to Qingping He of
Ofqual for extremely constructive feedback on the interim report, and to Jo Taylor for
efficient and helpful support throughout the project’s lifespan.
Last but definitely not least, the markers who participated in the multiple-marker
study deserve special mention for their interest, time and effort – without their
cooperation the designed reliability study could not have taken place.

iii
Executive summary
The project reported here is one of a very small number of assessment reliability
studies that have been conducted in the vocational education sector in the UK over
the past two decades. Previous studies have looked at portfolio assessment or at the
sharing of standards between workplace assessors and their internal verifiers in the
context of performance assessment. This study was different in that it explored the
reliability of written knowledge tests. Of the several hundred vocational qualifications
now provided by City & Guilds, the project focused on three high-stakes electro-
technical qualifications that were developed for already-qualified electricians to
certificate their professional knowledge. Two of the tests were ‘on demand’, delivered
online and machine-marked. The third was delivered in traditional paper-based
format and marked by electricians with extensive marking experience. In all three
cases pass-fail decisions were based on application of single cut-scores. The cut
scores were pre-determined in the case of the on-demand tests, but agreed in a
post-testing standard setting meeting in the case of the paper-based test.
Generalizability theory was adopted as the framework for reliability estimation in this
criterion-referenced context. For the on-demand tests three years’ worth of
electronically-stored response data were made available for analysis. In contrast, a
designed multiple-marker study was organised for the traditional human-marked test.
This was to provide the kind of data required to enable the exploration of effects on
assessment reliability of both marker-related and test-related factors, data that the
routine operational marking process with its single marking of scripts could not
provide.
Reliability coefficients and standard errors of measurement were estimated for
candidate assessment in all three cases, and also for marker assessment in the case
of the human-marked test. What if? analyses were also carried out to estimate the
reliability that might be achieved if tests and/or marking procedures were to be
modified.
The reliability measures for both the on-demand tests and the human-marked test
were satisfactory, if not high. For both types of test the clearest strategy available to
improve reliability further would be to increase test length, perhaps in the case of the
written test by replacing the existing test with two shorter ones of longer combined
length, should that be feasible within financial and logistic constraints.

1
1 Introduction
1.1 Vocational qualifications
Technical education and training systems in England have histories running back to
the industrial revolution (Lang, 1978) and beyond (Evans, 2007). Institutions that will
be familiar to modern-day readers had started providing examinations in technical
subjects as far back as the 1870s, in particular the Society of Arts, subsequently the
Royal Society of Arts (RSA) and now the ‘R’ in the OCR awarding organisation
(Watts, 2008), and the City and Guilds of London Institute (Lang, 1978; City & Guilds,
1993).
Vocational education and training (VET) and associated vocational qualifications
(VQs) have always appeared to be on a ‘parallel but separate track’ to academic
education and examinations. Notwithstanding this, vocational organisations have
instigated many high quality educational institutions; for instance, City & Guilds
founded Imperial College London in 1907, established the Associated Examinations
Board (AEB) in 1953, (AEB is now an integral part of the Assessment and
Qualifications Alliance (AQA)), and established the Technician Education Council
(TEC) and Business Education Council (BEC) in 1973; BEC and TEC later merged to
form BTEC (City & Guilds, 2011a).
Advocates of VQs enumerate their advantages, both in their own right and in contrast
to academic qualifications:
Despite its slow and at times haphazard development, the technical examination system in England has possessed a number of positive features. It offered real opportunities to students for entry and subsequent promotion in their chosen occupations. The examinations offered were more flexible than their school and university counterparts, matching the wide range of crafts, trades, vocations and occupational sectors involved. In addition to written examinations, assessments of practical activity were undertaken in special workshops or science laboratories. Teachers, employers and other key players were more closely involved, with some examinations set by teachers themselves and externally moderated. (Evans, 2008, p.13)
Millions of people achieve VQs every year. Ofqual’s latest ‘qualifications market
report’ (Ofqual, 2011a, pp.60-63) shows total qualification achievements by type for
the year 2009/10 as follows:
National Vocational Qualifications (NVQs) 979,000
Vocationally-related qualifications (VRQs) 2,607,300
Qualifications & Credit Framework (QCF) 771,300

2
Very high stakes can attach to some VQs, both for the qualification holders as
individuals and for society more broadly. For example, City & Guilds offers a level 2
NVQ in Domestic Natural Gas Installation and Maintenance. Operatives who hold
this qualification will be eligible to apply to become a member of one of the UK’s Gas
Registration Bodies without the need to undertake further independent assessments
in the areas covered by the NVQ. In like vein, City & Guilds NPTC Level 2 Award in
the Safe Use of Pesticides (QCF) is a legal requirement of the Chemical Regulatory
Directorate for anyone applying pesticides on a commercial basis. City & Guilds
keeps the National Register of Sprayer Operators, which facilitates Continuing
Professional Development to ensure ongoing training.
Both of the above qualifications are examples of ‘licences to practise’ (LTP) (City &
Guilds, 2011b). LTP has been defined as follows:
The term 'licence to practise' (LTP) refers to any requirements, including professional standards, voluntary or statutory, to which employers and employees in a sector must adhere. (ibid.)
LTP is widely used in some countries, including Germany and Demark, and, at state
level, the USA, but it is less prevalent in the UK. Whilst some political commentators
have bemoaned LTP as bureaucratic and burdensome on employers, others have
noted its advantages; these include eliminating unqualified workers from
occupations, improving consumer health & safety and confidence, and promoting
continuing professional development (CPD) of workers (ibid.).
LTP is an umbrella term that can cover several elements, such as criminal records
checks, a register of professionals, commitments to ongoing CPD, and so on. VQs,
too, can be an important element of LTPs. A VQ that is part of an LTP can form a
basis for training and a method of skills recognition amongst workers, and provide a
framework for career progression within a licensed industry (ibid.). Although LTP is
relatively rarely used in the UK, increasing numbers of qualifications are becoming
more and more prevalent within their industries.
1.2 Previous VQ reliability research
Assessment in the vocational field is assumed to be quite heavily focused on
performance assessment in the workplace. To a great extent this is true. Workplace
assessors might be site managers, senior care home assistants, hairdressers,
electricians, and so on; they can equally be peripatetic tutors and/or assessors who
travel to workplaces from training provider organisations or colleges. Workplace
assessors typically assess the growing and final competence of their charges against

3
the appropriate set of national occupational standards (NOS), using detailed
criterion-referenced assessment schemes (for an example see Harth & Hemker,
2012). Criterion-referenced assessments of performance lead only to the judgement
that the candidate is competent or not yet competent.
Typically, workplace assessors observe candidates as they perform the kinds of task
that might be required in the course of carrying out the occupation concerned. The
assessment might be of a process or of an end-product, such as a project write-up or
a repaired windscreen. This might involve assessment of the activity as it occurs, or a
record of that process (e.g. a video), and equally the outputs from that process may
be examined at the point of production (e.g. the repaired windscreen) or some time
after the activity has been completed (e.g. as a record – perhaps a photograph –
contained within a portfolio).
Assessors are required to ensure that candidates produce sufficient evidence “to
enable reliable and consistent judgements to be made about the achievement of all
the learning outcomes against the stated assessment criteria” (Ofqual, 2008a, p.26).
Internal verifiers are responsible for ensuring that assessors carry out proper
procedures, and apply assessment criteria appropriately. External verifiers, who are
appointed by the awarding bodies, are responsible for “ensuring that assessment
decisions are fair, consistent and meet the requirements set out by the national
occupational standards” (Harth & Hemker, 2012, p.329).
Assessment reliability was never a central concern in the vocational system,
assessment validity being considered paramount (Jessup, 1991). It was not that
reliability was considered an unimportant aspect of assessment, but rather that it was
considered to be guaranteed by the specificity of the competence-based assessment
criteria that were drawn up for each qualification. Not surprisingly in light of this, the
issue of reliability has been little researched in this field (Johnson, 2011). A handful of
portfolio-based studies have been conducted (Murphy et al. 1995; Greatorex, 2005;
Johnson, M., 2008), but their very small scale has meant that no meaningful
quantification of reliability achieved could be produced and generalised.
Interest in the reliability of performance assessments is growing, however. For
example, the reliability of performance assessment has been explored in the context
of postgraduate medical education, using generalizability theory (see Murphy et al.,
2009), while Harth and Hemker (2012) explored agreement rates between workplace
assessors and internal verifiers working in the same centres. Quite large numbers of
candidate portfolios were examined in the study, covering three different

4
qualifications, one of them an electro-technical qualification and two hairdressing
qualifications. Agreement rates were very high. However, the researchers were
unable to look at agreement rates between workplace assessors in one workplace
and internal verifiers working in another, or between internal verifiers working in
different companies. Such studies would be particularly revealing, but would require
specially designed studies that would be quite complex to organise.
Apart from these exceptions, most of the reliability investigations that have been
undertaken previously have focused on academic school leaving examinations, and
almost uniquely on the issue of inter-rater reliability (see, for example, Meadows &
Billington for a recent review). No prior research has been published for written
testing in the vocational sector. Yet knowledge tests are now fairly common here,
forming a component, often the only component (as end-of–unit tests), in
assessment for many vocational qualifications. The project described in this report is
one of two funded by Ofqual to look at the reliability of VQ knowledge tests (for the
other project see Boyle & Rahman, 2012).
1.3 Research aims for this project
The specification for this project set out the following research requirements:
The selection of one or more vocational/occupational subjects for study
The identification of sources of unreliability to be explored in the selected
vocational/occupational assessments
The compilation of the necessary data for analysis or the design of experiments
to collect data for analysis
The development of a mechanism for quantifying the reliability measures and the
standard error of measurement for the selected assessments
The analyses, interpretation and reporting of the reliability evidence generated.
Subsumed within the above requirements, the project objectives were to:
identify sources of unreliability that potentially affect the fate of candidates in
individual units within particular selected vocational qualifications
quantify the contributions to measurement error, i.e. to unreliability, of the
identified sources
estimate the reliability, and standard error of measurement, of each unit on the
basis of the empirical findings about measurement error contributions
estimate (where possible) the reliability of whole qualifications, using the
information about component unit reliability

5
identify how reliability of units and of whole qualifications might be improved,
should improvement appear necessary and achievable within logistics, budgets
and routine operational procedures
illustrate through application an appropriate approach to estimating and improving
the reliability of units and the qualifications to which they contribute
identify ways in which ongoing data planning, archiving and retrieval might be
improved within City & Guilds (and other vocational qualification providers) to
more readily meet what will inevitably be increasing future demands for the kind
of assessment research that is essential to assure assessment quality in this
field.
The given definition of reliability for the project is the following:
Reliability refers to the consistency of outcomes that would be observed from an assessment process were it to be repeated. High reliability means that broadly the same outcomes would arise. A range of factors that exist in the assessment process can introduce unreliability into assessment results. Given the general parameters and controls that have been established for an assessment process – including test specification, administration conditions, approach to marking, linking design and so on – (un)reliability concerns the impact of the particular details that do happen to vary from one assessment to the next for whatever reason.
It was intended that the project would adopt generalizability theory (G-theory) as the
theoretical basis for its analytical framework (Cronbach, Gleser, Nanda &
Rajaratnam, 1972; Brennan, 2001; Cardinet, Johnson & Pini, 2010).
1.4 The qualifications selected for evaluation
Given the experience of previous VQ reliability researchers, we proposed to
investigate qualifications and assessments with the following properties:
The qualifications would be high-stakes for candidates and users.
Relatively large amounts of data would be readily available electronically.
The qualifications structure would be relatively simple, with no optionality.
A suite of electro-technical qualifications satisfied these criteria. The qualifications
are intended for already-qualified electricians, and essentially offer CPD opportunities
leading to confirmation of specific types of specialised professional knowledge. They
are also qualifications for which City & Guilds receives high numbers of appeals.
The qualifications are the following:
1) Level 3 Certificates for the Code of Practice for In-Service Inspection and Testing of Electrical Equipment (2377):

6
Level 3 Certificate in Management of Electrical Equipment Maintenance 100/4338/X
Level 3 Certificate for the Inspection and Testing of Electrical Equipment 100/4339/1
These one-unit qualifications:
… are aimed at those with administrative responsibilities for the maintenance of electrical equipment and for those undertaking practical inspection and testing of electrical equipment. It also allows those with an administrative responsibility for the testing and inspection of electrical equipment to gain a qualification suitable to their job role. (City & Guilds, 2008a, p.6)
The single unit in each of these qualifications is assessed using an online on-demand
multiple-choice knowledge test.
2) Level 3 Certificate in the Certification of Electrical Installations (inspection, testing and certification of electrical installations) (2391-10)
This two-unit qualification was developed:
… to satisfy the requirements for Proposed Qualified Supervisors (PQSs) for various scheme operatives to ensure they are conversant with the requirements of BS7671 for inspection, testing and certification of electrical installations (City & Guilds, 2008b, p.6)
Unit 301 was assessed using a written examination while unit 302 was assessed
through a practical task. For logistic reasons to do with the constraints of operational
delivery, unit 302 was not included in this project – the research therefore examined
unit 301 only.
There is no absolute statutory requirement for electricians to hold these
qualifications, but nonetheless they are widely used within the electrical sector to
indicate competence in areas beyond that certified by the NVQ and effectively
constitute a standard that electricians need in order to work in certain areas.
Membership bodies encourage their affiliates to hold these qualifications – they see it
as a form of professional development for the highly skilled electricians that they
seek to support. Employers also use these qualifications; for example, the 2391
number is often quoted on job adverts and used as a benchmark indicator – for
instance, as a sifting tool by HR departments.
The 2377 suite is continually reviewed and updated in accordance with the Institution
of Engineering and Technology (IET) Code of Practice for In-service Inspection and
Testing of Electrical Equipment and other industry related regulations. The average
number of candidates registering for assessment per annum for the 2377-100 and
2377-200 qualifications are around 2,000 and 13,000, respectively.
The 2391 suite had approximately 11,000 candidate entries per annum across the
two units. The suite has recently been reviewed and updated in accordance with the

7
IET Wiring Regulations: 17th Edition, Amendment 1 and the QCF, and has as a result
been split into two qualifications from 2012:
2394 Level 3 Award in the Initial Verification and Certification of Electrical
Installations
2395 Level 3 Principles, practices and legislation for the periodic inspection,
testing and condition reporting of electrical installations
For each of these qualifications assessment is now based on the use of computer-
generated multiple-choice tests and a practical task.
Before considering the details of the research carried out for the selected
qualifications we offer in Section 2 a general overview of the concept of ‘reliability’,
and in doing so identify the particular interpretation of reliability that has been applied
in this project.
In Section 3 we consider the machine-marked on-demand tests of the 2377
qualifications before moving on in Section 4 to look at the traditional human-marked
unit test of qualification 2391. In Section 5 we summarise findings, and offer a
relatively broad interpretation. Finally we draw out some possible implications for
future practice within City & Guilds, for the assessment of these and related
qualifications.

8
2 Reliability
Practically all modern treatments of the reliability of educational assessment are built
on the conceptual foundations of classical measurement theory, which are long
established and extremely well documented. We limit discussion here to a few
issues which we have found to be most relevant to questions of vocational
assessment, but which do not do justice to a century of thoughtful scholarship. For
more extensive treatment, the reader is referred to the classic formulation of Lord
and Novick (1968) and to more recent overviews, among which we suggest Haertel
(2006), Johnson and Johnson (2012a), Meyer (2010) and Raykov and Marcoulides
(2011).
In the basic formulation of the theory a test is submitted to a group of individuals. The
‘test’ can in fact be any assessment instrument designed to measure some aspect of
an individual’s performative or cognitive capacity, often evaluated by an observer: for
example playing a designated piece on a musical instrument, baking a cake,
changing a dressing on a wound, or responding to a series of multiple-choice
questions. In deference to tradition, we adopt the conventional term ‘test’ for any
such assessment instrument and ‘marker’ for the observer and, reflecting the
emphasis here on vocational assessment, ‘candidate’ for the individual being tested.
Tests of the kind we are concerned with are typically imperfect, in the sense that if
they could plausibly be repeated we would not necessarily expect exactly the same
outcome, or score, for any individual on each repetition. Technically, the theory of
measurement attributes the differences between (hypothetical) replications of the
same test (or between applications of two or more equivalent test forms) to
measurement error. The difference on any given replication between the observed
score and the measurement error is what measurement professionals call the true
score.
The reasoning in the previous paragraph leads to the well-known fundamental
equation of measurement theory:
{observed score} = {true score} + [measurement error},
or, in the more familiar symbolic form:
[1]
It would actually be more accurate to write [1] as
[1a]

9
using the subscript f to distinguish between particular test replications or, more
plausibly, equivalent test forms. Note that the true score, , does not carry a
subscript, because the theory depends on an individual’s true score remaining
constant across test replications.
To complete the picture, we need to extend [1a] to reflect the fact that tests are
usually applied simultaneously to a number of candidates, giving us:
[1b]
In words, [1b] says that the observed score, X, of candidate c on test form f is equal
to c’s true score plus some measurement error associated with c taking test form f.
We have used the upper case for the true score, reflecting the fact that we are
now dealing with a variable, defined over a population of candidates.
To develop the theory we need a few simple and reasonable assumptions (see for
example Johnson and Johnson, 2010), notably that the expected value (i.e. the
hypothetical long-run average) of an individual’s observed score is the same as the
true score (so that the expected value of the measurement error is zero), and that
observed scores are not correlated with measurement error. Note that, contrary to
what is sometimes claimed, we do not need to assume that measurement errors are
normally distributed.
Using these assumptions, it can be easily shown that the relation of equation [1]
between observed scores, true scores and measurement error extends also to the
variances of the three quantities, namely
[2] Var(X) = Var(T) + Var(E)
Equation [2] is more usually written, using the standard notation for the variance
of some variable Y, in the form
[2a]
Equation [2] says that the observed variation in candidates’ scores on a test can be
partitioned into variation among individuals’ true scores, and variation due to
measurement error.
What, though, has all this to do with reliability? To see what an answer might be, we
need to revisit a few more of the standard results of measurement theory. The results
are simply restated here without derivation or proof; we refer the interested reader to
any introductory text on measurement theory, including those cited above.

10
In effect, given [1] and [2] and the associated assumptions, all of the quantities listed
below in Table 2.1 are defined as indicators of reliability, and each is equal to any of
the others:
the squared correlation between true score and observed score
the correlation between the scores on a test X and on a second equivalent test X’
the intraclass correlation, the correlation between the scores of two candidates with the same true score;
(
)⁄
the ratio of true score variance to true score variance plus error variance
⁄ the ratio of true score variance to observed score variance
⁄ the complement to unity of the ratio of error variance to observed score variance
Table 2.1: Equivalent forms of reliability index
Table 2.1 is not exhaustive: a few simple algebraic manipulations involving these
quantities and equation [2] can yield any number of equivalent expressions:
(
) (
)⁄ could be one, for example.
The indices in Table 1 only refer to whole tests, whereas in real situations we more
often than not have to deal with composite tests made up of several parts, including
the special case of a test consisting of a number of items. Specifically, suppose that
a test score X is made up of k item scores Y1, Y2, …, Yk, so that
Suppose further that all the items Yj have the same variance and the same reliability
. Then the reliability of the composite test X can be shown to be:
[3] ( ) ( ( ) )⁄
Equation [3] is a generalisation of the Spearman-Brown prophecy formula
(Spearman, 1910; Brown, 1910), which underlies many of the most influential results
in reliability theory, including the derivation of coefficient alpha (Cronbach, 1951),
undoubtedly the most frequently used reliability index. It is also the precursor to the
‘what-if’ analyses of G-theory, as illustrated in Chapters 3 and 4 of this report.
Now that we see how a reliability index is constructed, we can begin to understand
what it might be telling us. Take, for instance, the variance ratio (
)⁄ . What
we see from this is that there are potentially two sources of variation which can
contribute to reliability: true score variance and error variance. Thus, a reliability of,

11
say, 0.7 suggests that 30% of total variation in observed scores of a test is due to
measurement error
It also follows from the variance ratio formulation of reliability that a low level of
variation among the true scores of candidates for a test will tend to lower the
reliability of the test, (this is a somewhat counterintuitive result, which we shall return
to several times in this report). Alternatively, a low level of error variance compared to
true score variance will tend to increase reliability as measured by any of these
indicators. In fact, this second behaviour is closer to what we naturally anticipate,
because intuitively we expect that measurement error should be what reliability is all
about: the smaller the measurement error associated with a test the closer a
candidate’s score is likely to be, on average, to the ‘true’ score; and hence the
greater the confidence we can have in the test as an accurate reflection of the
attribute being measured. An alternative approach to reliability, then, is to seek ways
to find the amount of variability in the errors, by using [2] to estimate the error
variance, or its square root, called the standard error of measurement, or SEM. In
this perspective, the aims of measurement theory might more appropriately be
characterised as
a) to design assessment strategies which minimise the amount of measurement
error;
b) where measurement error cannot be eliminated, to find ways of quantifying
the amount of error in a test.
Note that, in the logic of (a), investigations into the reliability of a test may be more
effective when carried out before the test is used operationally than a posteriori,
when the test has already been used in a practical setting. We revisit this question
later.
In practice, though, more effort has been expended on finding ways of reporting the
reliability of a test, typically of one that is already in use. Indeed, a brief glance at the
literature on reliability can soon reveal a bewildering variety of reliability coefficients,
most of which reduce essentially to one of the equivalent forms listed above,
depending essentially on the estimation strategy used. So, correlational definitions,
like , suggest procedures like test-retest or split halves, which involve comparing
the observed results of tests regarded as ‘equivalent’; while definitions in terms of
ratios of true score and error variances lead naturally to ‘internal consistency’
estimates of reliability based on a single test administration.
Unfortunately, all the reliability coefficients of Table 1 are fairly blunt instruments,
based as they are on the simple relationship expressed in Equations [1] and [2]. They

12
may serve as a starting point for reasoning about reliability, but they give us little help
in figuring out how we can disentangle from all of the circumstances surrounding the
construction, administration and scoring of a test those which contribute to the
candidates’ true scores and those which are part of measurement error.
In a realistic testing situation, a variety of factors can potentially contribute to
variation in observed scores: candidates, test items, the form of the test (short
answer, essay, completing a task), markers, occasion of testing (morning, afternoon
or evening, beginning or end of training), instruction styles and strategies are among
the most important. Orthodox treatments of assessment reliability single out the
contribution of just one of these – typically candidates, occasionally markers, rarely
any other – as ‘true score’ and treat everything else indiscriminately as measurement
error. As a consequence, however ingenious and sophisticated the mathematics
involved in defining and calculating a reliability coefficient, its precision and
descriptive power will necessarily be constrained to the effect of a single factor.
There is, however, no reason why we may not extend equation [2] to include
additional sources of variation on the right hand side, some of which we may want to
treat as being associated with the true score and some with measurement error. For
example, consider a testing situation involving observations, Ycqmo, representing
marker m rating candidate c on question q at occasion o. We might partition the
score variation associated with this situation as
[4]
.
Note that, as well as terms representing the variance of candidates, questions,
markers and occasions, we have added a fifth term, , on the right hand side of [4]
which we call the residual variance, taking the place of the error variance in [2]. The
residual variance, like the error variance in [2], is a catch-all for everything else which
does not explicitly appear on the right hand side of the equation. We deliberately
avoid using the term ‘error’ to describe the residual, since figuring out the contribution
to measurement error of each of the other terms on the right hand side for a
particular testing situation will be the main point of the exercise.
Equation [4], as it stands, suggests that the different sources of variation are not
related to each other: that certain types of markers never favour particular
candidates, for example, or that there is no consistent relationship between particular
types of candidate and specific times of the day (morning, afternoon or evening, for
example). A more realistic model would include interaction terms, representing
effects which vary systematically in the same direction. Interactions between two

13
effects are denoted by two subscripts, like , the interaction variance between
candidates and questions, whose magnitude reflects the extent to which the different
candidates tend to do well (or badly) on the same questions. Three-way interactions
are notated by three subscripts, like , and so on.
A model whose right hand side includes all possible interactions (except with the
residual) is called a fully crossed model. Here is the fully crossed version of [4]:
[5]
We often refer to an equation like [5] as a design, in deference to an extensive
literature on experimental design, in which the partition of variance plays a major
role.
Note that with the kind of data with which we typically have to deal it is generally not
possible to disentangle the residual variance from the highest-order interaction
variance (i.e. in [5]). We normally expect the effects of these two sources of
variation to be conflated, or confounded, and consequently we use either notation to
refer to both simultaneously. We return to this question in a little more detail below.
Recall that our goal is to distinguish between sources of variation generated by
differences in true scores and those which are part of measurement error. To
illustrate the point, we need to use an example which is less complicated than [5].
Our example, [6], distinguishes just two sources of variation, candidates and
questions:
[6]
,
where the residual variance, , is, as above, confounded with the higher-order
interaction variance .
Suppose now that [6] corresponds to a situation where we prepare a set of test
questions designed to rank candidates, perhaps with a view to sending the best few
on a management training course. In this situation, we take the variance between
candidates, as usual, as the indicator of true score variation. As regards error
variance, we consider only the candidate-question interaction (confounded, of
course, with the residual); since we are only concerned with ranking candidates, and
all candidates take the same questions we simply discard the question variance
altogether as it contributes neither to true score nor to measurement error. The
resulting value for the error variance will be called relative error variance (because it

14
arises from a design which is intended to rank candidates relative to one another). It
corresponds to the notion of norm-referencing in test design.
Given values for true score variance and measurement error variance, we can define
a corresponding reliability coefficient, which we call the relative reliability coefficient,
for a single question:
[7] (
)⁄ .
If there are nq questions on the test form, we can ramp up [7] from the reliability of a
single question to produce a relative reliability coefficient for the full test of nq
questions.
[7a]
(
⁄ )⁄
It can be shown (cf Cronbach et al, 1972) that [7a], originally called , is
algebraically equivalent to Cronbach’s coefficient alpha. The relative reliability
coefficient, however, in contrast to alpha, can be defined for any design, not just one
involving candidates and questions.
Designs like [6] are not just used to rank candidates. Very frequently their purpose
may be to evaluate candidates relative to an external criterion (indeed assessment
intended for this purpose is called criterion-referenced, as opposed to norm-
referenced, assessment). Clearly, in terms of the design [6], the only specific
provision in the available conditions of testing for linking the assessment to an
external criterion is through the questions; the selection of the questions themselves,
then, as well as the interaction between questions and candidates, is a potential
contributor to measurement error. In this kind of situation, we call the error variance
absolute error variance, and the associated reliability coefficient an absolute reliability
coefficient.
The absolute reliability coefficient for a single question under design [6] is
[8] (
)⁄
As is the case for the relative coefficient, we can ramp up [8] using [3] to produce the
absolute reliability coefficient for the whole test of nq questions:
[8a]
(
⁄ ⁄ )
⁄

15
The coefficient [8a] for the design [6] is equivalent to the (phi) coefficient (Brennan
and Kane, 1977).
The coefficients defined in [7], [7a], [8] and [8a] are abstract quantities, expressed in
terms of generally unknown population variances. In practical applications they have
to be estimated by replacing the variance components , for each sequence of
subscripts , by their corresponding estimates . It is not always evident that
appropriate estimation strategies exist, nor do observed data always permit
estimation of the chosen index. The issues surrounding estimation of variance
components in all but the simplest cases are difficult and complex, and beyond the
scope of this report. Brennan (2001a) gives what is probably the most thorough
treatment, though interspersed with discussion of many aspects of the dependability
of assessments. Searle, Casella and McCulloch (2006) remains the defining
treatment of the topic of variance component estimation in general.
A special, but important and frequent, case of criterion-referenced assessment arises
in constructing tests which are intended to place candidates on either side of one or
more ordered threshold values (pass-fail, allocation of examination grades, accept-
reject, and so on). A common use of such tests occurs in mastery testing, designed
to determine whether candidates have achieved a particular skill or competence.
Where the underlying test yields a numerical score, it is usual to define a fixed cut
score as the threshold above which mastery can be deemed to have been achieved.
Writing for the cut score, it can be of interest to construct a reliability-like index for
the difference score , rather than for a candidate’s true score, , as would be
the case for a general reliability coefficient. We can achieve this by substituting the
candidate (true-score) variance in [8a] with the variance of ( ),
[9] ( ) ( ) .
.
The result is the index known today as ( ) (phi(lambda))
[10] ( ) (
( ) )(
( ) ⁄
⁄ )⁄
We say ‘known today’ since, when ( ) was introduced by Brennan and Kane
(1977), it was originally called ( ). Somewhere along the line it was renamed ( ).
Some caution is required in estimating [10] from observed data, because while the
variance components can reasonably be replaced by their sample counterparts,

16
simple substitution of the sample mean, , as the ‘natural’ estimator of actually
yields a biased estimate of ( ) . The unbiased estimate of ( ) is ( )
. If in doubt, it is probably safer to use a reputable software package to do the
estimation. Another potential pitfall is that the standard derivation of ( ) requires
that , and hence , be on the item score, rather than the test score, metric. When
using standard software, we should expect to have to scale accordingly. Yet
another issue is that ( ) increases with the size of the distance between the cut
score and the population mean score . Consequently, we can always make our
test look more ‘reliable’ by further distancing the cut score from the mean, up to a
limit of 100% (or, theoretically, zero).
In fact, we should be cautious about reporting any reliability or reliability-like
coefficients for criterion-referenced tests. It can frequently happen that these tests,
whose purpose, we recall, is not to spread candidates on a scale, are applied to a
self-selecting group of candidates whose true scores might be expected a priori to
cluster about a value or values corresponding to the criterion around which the test is
designed. As a result, candidates’ scores could be predicted to be concentrated in a
narrow band, with correspondingly low true score variance. We have already
remarked that a reliability coefficient is influenced by two factors: the size of the true
score variance and the size of the error variance. In the case we are discussing,
then, it could be quite possible that an entirely predictable low true score variance
might result in a counter-intuitive low reliability irrespective of the amount of
measurement error associated with the test. For this reason, in a context of criterion-
referenced assessment, we advise reporting a second quantity, the standard error of
measurement, or SEM, in preference to – or at least alongside – the reliability
coefficient.
The standard error of measurement is just the square root of the error variance for
the test, and is on the same scale as the mean item score for the test. Just as there
is a relative and an absolute reliability coefficient, so there are absolute and relative
standard errors of measurement. The two standard errors of measurement
corresponding to design [6] are:
[11a] √ ⁄
[11b] √ ⁄
⁄

17
We have already mentioned that in designs like [5] and [6] above we typically cannot
separate out the residual from other components. Informally, the reason is this. Think
of a data set of observations associated with [6]. The data can be arranged in a
matrix, as they might be displayed in Excel or SPSS, with nc rows corresponding to
the candidates, nq columns corresponding to the questions, and cells containing the
scores. The general picture would be something like Figure 2.1
Question 1 Question 2 Question
Candidate 1
Candidate 2
Candidate
Figure 2.1: candidate question matrix
Looking at Figure 2.1, it is clear that there are nq data points in row 1 that can
potentially be used to estimate the score of candidate 1, nq points in row 2 to
estimate the score of candidate 2, and so on. Similarly, there are nc points in column
1 available for estimating the score for question 1, nc points in column 2 for
computing an estimate for question 2, and so forth. On the other hand, for estimating
the effect of interaction between each candidate c and each question q, we have just
one value Ycq. Consequently, there is no information left in the data which we can
use to estimate any residual effects independently of the effect of any candidate-
question interaction. Technically, we say that the residual is confounded with the
candidate-question interaction. It would be possible to find independent estimates of
the residual effect if there were more than one observation per cell, but such
situations are rare in educational assessment. In general, in situations we are likely
to encounter, the residual will typically be confounded with the highest order-
interaction. This is why we remarked earlier, when discussing variance
decompositions like [5] and [6], that we would normally be unable to distinguish
between the highest-order interaction variance and the residual variance.
Figure 2.1 shows schematically the data organisation corresponding to a fully
crossed design. But we are not always in a position to work with fully crossed data.
Take, for example, on-demand tests, typically computer generated, where each

18
candidate is allocated a set of questions generated randomly from an item pool. We
can assume that items are extracted from the pool without replacement, so that all
candidates within the same session receive different questions. Technically, we say
that items are nested within candidates, and we use the notation i:c, as opposed to i
c (which we read as “i crossed with c”). This nesting scheme is a simplified variant
of the on-demand tests which we analyse in Chapter 3.
In this simple nested arrangement, we cannot separate an independent item effect
from an item-candidate interaction effect. The corresponding design is therefore
more simple than the crossed design [6], namely:
[12]
Moreover, because we still only have one observation per cell, just as in the crossed
case, we are unable to distinguish the item-candidate interaction from the residual. In
this case therefore only one reliability coefficient is available, because effectively on
the right hand side we only have one useable term, , for our error variance. The
reliability for a single item is therefore
[13] (
)⁄
The scaled-up coefficient for a test with items nested in candidates is then
[13a] (
⁄ )⁄
And the associated standard error of measurement is
[13b] √ ⁄
Before going on to discuss the application of the principles discussed in this chapter,
we conclude with some general remarks on how and why we should be concerned
with the reliability of our assessments.
It is normal practice in the testing community to construct tests, to apply them in
practice and then, perhaps, to report the reliability of their results. We say “perhaps”
because considerations of reliability often come second, for understandable reasons,
to the day-to-day business of making sure that the right tests are developed,
delivered, marked and the results published, all to very tight schedules. But the need
to ensure that our tests are consistent is also important, for consistency is an
essential component of fairness and strong moral, ethical and legal pressures should
constrain us to ensure that our tests are as fair to candidates as we can possibly
make them. In this perspective it makes sense to publish reliability information along
19
with test results whenever possible, so that it can be seen that the test producer is
striving to be as fair as possible to consumers of what can often be high-stakes
assessments.
While there are laudable reasons for producing reliability statistics along with test
results, there are even better reasons for evaluating the reliability of tests, wherever
possible, before the test is actually administered to candidates, or, where this is
logistically impossible, for building into the test administration procedure
methodologies for extracting the maximum amount of reliability information from live
testing situations.
We claimed at the beginning of this chapter that there are two goals of measurement
theory:
a) to design assessment strategies which minimise the amount of
measurement error;
b) where measurement error cannot be eliminated, to find ways of
quantifying the amount of error in a test.
We suggest that the first goal is equally as important as, and logically prior to the
second.
In Chapters 3 and 4 we give the outline of a methodology which can indeed be used
in practical situations to improve the amount of reliability in a test.

20
3 The computer-generated on-demand tests (2377)
3.1 The 2377 certificates and their assessment
In this section we look at a form of assessment that has been introduced relatively
recently into examining practice in awarding bodies in the UK, including in City &
Guilds, and which is growing in popularity. This is flexible on-demand assessment
using computer-generated and computer-marked multiple-choice tests. The two
specific tests that we evaluate here are among several hundred end-of-unit multiple-
choice tests of knowledge that centres now deliver to candidates online on behalf of
City & Guilds (see Boyle & Rahman, 2012, for further examples). As noted in Section
1, the tests belong to single-unit level 3 electro-technical certificates ‘for the Code of
Practice for in-Service Inspection and Testing of Electrical Equipment’ designed to
confirm specialised knowledge in two particular areas:
Management of Electrical Equipment Maintenance (Certificate 2377-100)
Inspection and Testing of Electrical Equipment (Certificate 2377-200)
Before accepting candidates onto the 2377-200 course centres are obliged to give
them a practical skills test in which they must demonstrate an ability to inspect and
test an item of Class 1 equipment (such as an iron, kettle or toaster), and to complete
specific record sheets correctly. This practical assessment is the responsibility of
centres, and is not investigated here.
Achievement of each of the 2377 qualifications was uniquely dependent on passing
an on-demand online end-of-unit multiple-choice test; at the time this project was
carried out the 2377-100 test form was composed of 45 items to be answered in 90
minutes, while that for 2377-200 comprised 30 items to be answered in 60 minutes.
Tests were created by drawing items from a pre-existing item pool using stratified
random sampling, stratification ensuring that given test specifications were met.
In the case of 2377-100 the specification required that the test include a different pre-
defined number of items representing each of six learning outcomes (see Table 3.1;
note that the number of items representing each learning outcome was itself made
up of 1-4 items from each of a series of sub-outcomes). The items were drawn from
an item pool that was by 2011 around four times the size of a generated test.

21
In the case of 2377-200 the specification demanded for each test an equal number of
items representing each of five learning outcomes (Table 3.2). In this case the item
pool contained around five times the number of items needed in any one test.
Outcome Title No. items
1.1 Law and scope of legislation relevant to the management of electrical equipment maintenance
7
1.2 Types, use and testing of electrical equipment used for in-service inspection and testing
10
1.3 Categories, frequency and practicalities of in-service inspection and testing
12
1.4 Procedures, documentation and user responsibilities that are required for in-service inspection and testing
10
1.5 Training that is required for in-service inspection and testing
2
1.6 Appropriate test instruments and how they are used within in-service inspection and testing
4
Total items 45
Table 3.1: Test specification for 2377-100 Management of Electrical Equipment Maintenance (Source: City & Guilds, 2008a, p.24)
Outcome Title No. items
2.1 Equipment construction 6
2.2 Inspection 6
2.3 Combined inspection and testing 6
2.4 Use of instruments and recording of data 6
2.5 Equipment 6
Total items 30
Table 3.2: Test specification for 2377-200 Inspection and Testing of Electrical Equipment (Source: City & Guilds, 2008a, p.24)
The content covered by the tests was based on the IEE Code of Practice for In-
Service Inspection and Testing of Electrical Equipment, and an ’80 per cent correct’
cut-score was applied to distinguish passes from fails for each qualification (i.e. 36 of
the available 45 marks for 2377-100 and 24 of the available 30 marks for 2377-200).
Several thousand candidates entered for these tests each year.

22
Until quite recently, these and similar tests were delivered to candidates in paper-
based form, with all the candidates in any test session taking the same test. Now test
forms are newly generated for individual candidates on demand. Candidates are
allowed to access a test at any time from four hours before the scheduled test time to
four hours after it, and they are free to retake tests (as different test forms) as many
times as they choose within a testing window. When a candidate elects to be
assessed a complete set of items is selected for delivery, following the relevant test
specification (there is no targeted testing element here). While the majority of
candidates work systematically through their allocated items, there are occasionally
instances where a candidate gives up before the end of the test or where a technical
problem arises that invalidates that particular assessment.
The response datasets supplied for analysis spanned the three-year period from
October 2008 to September 2011: for candidate numbers see Table 3.3. The pattern
of performance barely differed from one testing window to another, so that in this
section we consider each test dataset over the entire period. A total of 5,346
candidates attempted a 2377-100 test over the three-year period; as Table 3.3
shows, after excluding all but the first attempt of resit candidates (i.e. candidates
submitting to assessment more than once over the period) and incomplete records
(i.e. candidates with fewer than 45 recorded item responses) the number of useable
records was 4,646. Over the period, 34,904 candidates were entered for 2377-200
assessment; after excluding second and subsequent resits and incomplete records
28,671 records were available for analysis.
2377-100 2377-200
Registrations 5,346 34,904
Resits* 509 4,737
Too few responses 218 1,799
Useable total 4,646 28,671
* First attempts are included in the analysis total
Table 3.3: Candidate statistics for 2377-100 and 2377-200 for the period October 2008 to September 2011
The test score distributions in both cases were severely left-skewed, almost all
candidates having total scores in the top half of the mark scale, or even in the top
third in the case of 2377-100 (see Figures 3.1 and 3.2).

23
Figure 3.1: The mark distribution for the 2377-100 tests (4,646 candidates over a 3-year period)
Figure 3.2: The mark distribution for the 2377-200 tests (28,671 candidates over a 3-year period)
The mean score achieved for 2377-100 was 38.6. After application of the cut score
(36 marks), 3,680 candidates passed the test and achieved the qualification (a 79.2%
pass rate). The mean test score for 2377-200 was 25.4 and the cut score 24. Of the
28,671 candidates in the analysis dataset, 21,575 achieved or exceeded the cut
score and so gained the 2377-200 qualification (a 75.3% pass rate).

24
So, how reliable were these high-stakes tests? This is a central question for this
research project.
3.2 An approach to reliability estimation
The 2377 tests are in some sense ‘mastery’ tests, even if the criterion for mastery is
not as clear-cut as it might be for narrow skills assessment. The examiners
responsible for each of these qualifications made the decision that the success rate
required for a candidate to achieve a pass, and therefore to gain the qualification,
was to be high, at 80 per cent. In principle, for an individual candidate it is irrelevant
how well or how badly other candidates might do on the test. The goal for each
candidate is to study the content domain sufficiently well to have the highest possible
chance of meeting the ’80 per cent correct’ criterion. Maximally spreading candidates
on the score scale to facilitate a separation of ‘successful’ candidates from others is
not the aim. Indeed, it would be perfectly acceptable for all candidates at any one
time to be clustered above the cut score, and for all therefore to pass the test and
achieve the qualification.
The usual aim of knowledge assessment in VQs, and certainly the aim of knowledge
testing in the cases of 2377-100 and 2377-200, is not to maximally differentiate
among candidates in terms of their test scores, but rather to provide ‘absolute’
information about each candidate in order to serve a pass-fail decision that is
referred to the predetermined ‘mastery’ cut score. It follows that Cronbach’s alpha
coefficient, which is relevant in norm-referencing application, is not the appropriate
measure of reliability to use here, and indeed it cannot even be calculated when not
all candidates take the same test items, In principle the appropriate reliability
coefficients to use are the phi coefficient and phi(lambda), both of which are fully
described in Section 2.
In fact, this model of assessment does not lend itself well at all to the concept of a
reliability coefficient, since such coefficients typically estimate the proportion of ‘true
score’ variance, in this case between-candidate variance, in total observed score
variance, as explained in Section 2. Where candidates might legitimately cluster
around a single cut score the between-candidate variance will be low, as in
consequence will be any calculated ratio-based reliability coefficient. A better
indicator of reliability would be the standard error of measurement (SEM) associated
with candidates’ true scores, from which can be calculated confidence intervals
around observed test scores. The smaller the standard error of measurement
25
associated with a generic test score the lower will be the risk of candidate
misclassification on application of the cut score.
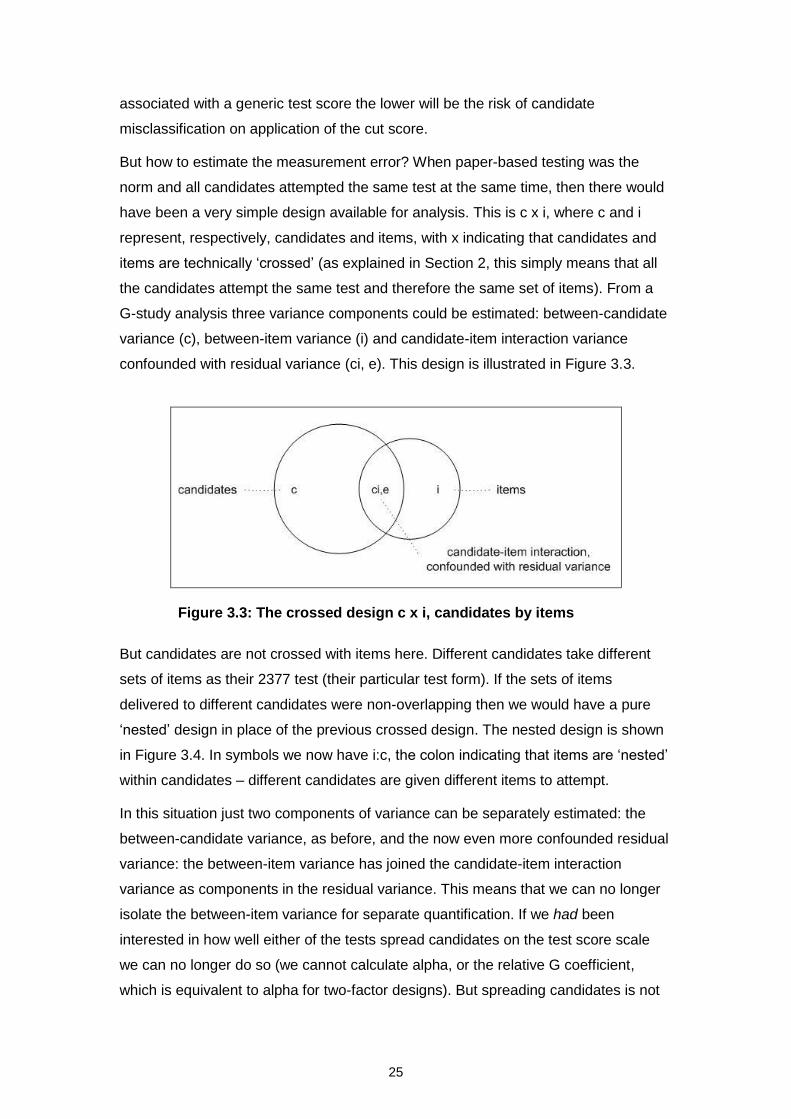
But how to estimate the measurement error? When paper-based testing was the
norm and all candidates attempted the same test at the same time, then there would
have been a very simple design available for analysis. This is c x i, where c and i
represent, respectively, candidates and items, with x indicating that candidates and
items are technically ‘crossed’ (as explained in Section 2, this simply means that all
the candidates attempt the same test and therefore the same set of items). From a
G-study analysis three variance components could be estimated: between-candidate
variance (c), between-item variance (i) and candidate-item interaction variance
confounded with residual variance (ci, e). This design is illustrated in Figure 3.3.
Figure 3.3: The crossed design c x i, candidates by items
But candidates are not crossed with items here. Different candidates take different
sets of items as their 2377 test (their particular test form). If the sets of items
delivered to different candidates were non-overlapping then we would have a pure
‘nested’ design in place of the previous crossed design. The nested design is shown
in Figure 3.4. In symbols we now have i:c, the colon indicating that items are ‘nested’
within candidates – different candidates are given different items to attempt.
In this situation just two components of variance can be separately estimated: the
between-candidate variance, as before, and the now even more confounded residual
variance: the between-item variance has joined the candidate-item interaction
variance as components in the residual variance. This means that we can no longer
isolate the between-item variance for separate quantification. If we had been
interested in how well either of the tests spread candidates on the test score scale
we can no longer do so (we cannot calculate alpha, or the relative G coefficient,
which is equivalent to alpha for two-factor designs). But spreading candidates is not

26
the aim, so that nothing is lost in a technical sense. However, one small issue that
remains is that we do not actually have pure nesting going on here, as there is
almost always some degree of overlap between test forms in terms of common
items.
Figure 3.4: The nested design i:c, meaning items are nested within candidates
Before presenting the results of the analyses we could usefully consider ‘learning
outcomes’ as a potential factor in the analysis design. The test specifications for both
the 2377-100 and the 2377-200 tests were designed with a given structure in terms
of representation of the different learning outcomes (see Tables 3.1 and 3.2 in
Section 3.1). It would be possible in principle to add ‘learning outcomes’ to the nested
i:c design, as another nesting factor for items, giving the design i:(co). But the
numbers of items included in each test to represent the different learning outcomes
are small, and in the case of 2377-100 they also vary across outcomes. Any analysis
results would therefore not be well-based. In any case, the factor ‘learning outcomes’
can play no role in terms of measurement error. This is because the six learning
outcomes of 2377-100 and the five learning outcomes of 2377-200 account for the
totality of the content domain being assessed in the respective qualifications.
Outcomes are not sampled in the assessment. ‘Learning outcomes’ is therefore by
definition a fixed factor, and as such it cannot contribute to measurement error, either
alone or through interaction with candidates. For these reasons the reliability
analyses focused on candidates and test items only.
3.3 Analysis results
Before presenting the analysis results, one small issue deserves mention. This has to
do with the way that item deliveries and candidate responses were recorded.
Candidates’ responses to the items in their test forms were recorded as the answer
options that they chose (A to D). But no code was recorded when a candidate did not
respond to an item. No ‘test form identifier’ was recorded either. The consequence

27
was that when a candidate had fewer than 45 responses in the dataset for 2377-100,
or fewer than 30 for 2377-200, it was impossible to know whether that candidate had
reneged on the test at some point, or there had been a technical problem, or certain
items had simply not been attempted. Given this, for the purpose of the analyses
carried out here, to maximise the validity of results interpretation, all candidates with
fewer than the requisite number of item responses were excluded from the dataset.
Data analysis was carried out using both EduG (SSRE, 2006) and urGENOVA
(Brennan 2001b). The results for each of the three years separately were virtually
identical for both qualifications. Table 3.4 therefore presents the results for the entire
3-year period for both qualifications. As the table confirms, the number of candidates
who took a test for one or other of these qualifications in the period was extremely
high, particularly for 2377-200.
variance source
sum of squares
degrees of
freedom
mean square
variance component
estimate
%*
2377-100
candidates (4,646) 2262.115 4645 0.487 0.008 7
confounded residual 23202.124 204424 0.114 0.114 93
2377-200
candidates (28,671) 11571.212 28670 0.404 0.009 7
confounded residual 100379.466
7
831459 0.121 0.121 93
* Variance component estimates as percentages of total item score variance
Table 3.4: ANOVA tables for the 2377-100 and 2377-200 tests
We also see from Table 3.4 that in both qualification tests the between-candidate
variance accounted for just 7% of the total variance, leading to predictably lowish
reliability coefficients – recall that these are variance ratios in which the numerator is
the between-candidate variance. For interest we nevertheless offer the values of phi
and of phi(lambda) – see Section 2 for the relevant formulae. In computing
phi(lambda), the cut score, lambda, conventionally expressed on the mean item
score metric, is 0.8 for both of the 2377 tests. This is because while the actual cut
scores for the two tests were different – a total test score of 36 in the case of the 45-
item 2377-100 test and 24 in the case of the 30-item 2377-200 test – the cut score as
a percentage test score in both cases was 80 per cent, giving an average item mark
of 0.8 for the binary-scored items.

28
Using the component information from Table 3.4, we calculate that the phi estimate
for the 2377-100 test is 0.77, with phi(0.8) higher at 0.82. The phi estimate for 2377-
200 is 0.70 with phi(0.8) at 0.74. These values are consistent with those for the
majority of other similar City & Guilds tests analysed in the same way (Boyle &
Rahman, 2012). These are modest values, entirely to be expected from peaked test
distributions that have arisen by design, since the testing aim is not candidate
spread. The 95% confidence intervals around a candidate’s total test score are,
respectively, ± 4.4 marks and ± 3.7 marks for 2377-100 and 2377-200; corresponding
intervals around percentage mean scores are ± 9.8 percentage points and ± 12.4
percentage points, respectively.
While the value of phi is not particularly important in this context, given the expected
clustering of candidates around the cut score, we can nevertheless predict its values,
and those of phi(lambda), for test forms of different lengths (should longer tests be
feasible to develop and to operate). For these particular tests, the what if? analyses
simply require the substitution of different numbers of test items into the expressions
for the reliability coefficient and the SEM given in Section 2 (expressions 13a and
13b, respectively).
Table 3.5 provides the results of this prediction, and also shows how the 95%
confidence intervals can be expected to change as item numbers increase. From the
results we can deduce that for both qualifications, should an increase in test length
be an option, increasing tests to 50 items would produce phi coefficient values of
around 0.8 and phi(lambda) coefficients above 0.8.
Simultaneously, the precision of candidate mean scores would improve, with 95%
confidence intervals around candidates’ percentage mean test scores reducing from
the previous value of ± 9.8 percentage points to roughly ± 9.3 percentage points for
2377-100, and from the previous ± 12.4 percentage points to ± 9.6 percentage points
for 2377-200. For 2377-100, confidence intervals around test total scores would
decrease from 9.8 per cent of the previous nominal 45-mark scale (i.e. ± 4.4 marks)
to 9.4 per cent of the new 50-mark scale (± 4.7 marks); for 2377-200 intervals would
decrease from 12.3 per cent of the previous 30-mark scale (i.e. ± 3.7 marks) to 9.6
per cent of the new 50-mark scale (i.e. ± 4.8 marks). Increases to 60 items would
barely affect the phi coefficient, but would continue to have a positive impact on the
95% confidence intervals around test total scores.

29
2377-100 2377-200
95% CI* 95% CI*
phi phi(0.8) P R phi phi(0.8) P R
50 items 0.78 0.84 ± 9.3 ± 4.7 0.80 0.83 ± 9.6 ± 4.8
60 items 0.81 0.86 ± 8.5 ± 5.1 0.82 0.85 ± 8.8 ± 5.3
* Figures in ‘P’ columns are margins of error associated with percentage mean test scores, and are expressed in percentage points; figures in ‘R’ columns are margins of error around total test scores, and are expressed in raw marks.
Table 3.5: Predicted values of phi, phi(0.8) and 95% confidence intervals around percentage mean test scores and test total scores for longer tests

30
4 The traditional-format unit test (2391)
4.1 Unit 301 and its assessment
Qualification 2391 is a two-unit level 3 certificate entitled Certification of Electrical
Installations (inspection, testing and certification of electrical installations) (2391-10).
It was developed to serve the needs of already qualified electricians aiming to
become qualified supervisors, in confirming their knowledge and understanding of
the requirements of BS7671.
Unlike the 2377 units described in Section 3, unit 2391-301 was assessed using a
traditional human-marked written examination. The 2½-hour knowledge test
comprised a total of 26 questions jointly spanning three knowledge domains:
‘preparation for inspection and testing’, ‘inspection’ and ‘testing’. Section A comprised
20 multi-part short answer questions, each worth three marks, while Section B
comprised six structured questions meriting 15 marks each, giving a possible test
total mark of 150. Unit assessment was offered on specific dates throughout the
year, with all the candidates in any particular series taking the same paper-based
test.
Markers attended an initial standardisation meeting before starting their work, and
were then periodically monitored over the marking period using a small number of
seeded scripts pre-marked by the team leader, as is standard practice in the major
awarding organisations at this time. In the operational process centres posted all of
their completed scripts directly to their allocated markers, who then marked and
forwarded the marked scripts and accompanying mark record sheets to City &
Guilds.
Candidates were graded pass-fail on the basis of a cut score determined during a
post-assessment standard setting meeting. Like the test itself, the meeting followed a
traditional format (see, for example, Robinson 2007 for details). Participants, in this
case the chief examiner, a team leader and an examiner, reviewed:
the current and past examination papers
statistical evidence about candidate performances on these papers (frequency
distributions and summary statistics)
pass rates for past papers, and pass rates on the current paper for alternative cut
score choices (within a few points either way of the previous year’s cut score)
a handful of candidate scripts in the range of potential cut scores.

31
A total of 2,915 candidates registered for the December 2011 test session, and 2,401
candidates actually completed the test. The total marks achieved varied from 0 to
136, the mean mark was 83.7 and the standard deviation 22.5. Application of the cut
score of 94, arrived at during the post-assessment standard setting meeting, resulted
in a pass rate for the test of just over 37 per cent (896 candidates).
The examiners responsible for this unit paper reported that a principal reason for the
low pass rate is that year after year many candidates were being entered for the test
by their centres when they did not yet have the necessary technical knowledge or
appropriate practical experience; improvements in pay and job prospects that
typically follow from acquisition of this qualification explain its attractiveness, as does
the availability to centres of funding based on enrolments and not outcomes. Other
explanations offered by the examiners included inadequate candidate study
preparation (intensive cramming rather than systematic study over a period of time),
candidate unfamiliarity with classroom-based learning and timed tests, and
inadequately trained teachers/tutors within some centres.
Figure 4.1 illustrates the slightly left-skewed mark distribution, and indicates the
locations of the mean score and the cut score.
Figure 4.1: The mark distribution for the December 2011 test
The principal question of interest here is how technically reliable was this
assessment exercise?

32
4.2 The multiple-marker study
In the operational situation each candidate is marked by just one marker, and not all
markers are required to mark the few seeded scripts that are typically used for the
ongoing monitoring of marking standards. The regular operational data do not,
therefore, lend themselves to reliability investigation, because potentially important
factors, in particular marker effects, are ‘hidden’.
The potential contributions of markers to measurement error include between-marker
differences in severity, i.e. differences in general standards of marking. Familiarly
known as ‘inter-marker reliability’, this contribution to measurement error is generally
small after marker standardisation, particularly when compared with the contributions
associated with the implicit question sampling that test development involves. Less
well-researched interaction effects involving markers are also pertinent. Among these
are marker-question interaction, marker-candidate interaction and marker-time
interaction (‘marker drift’):
Marker-question interaction is where different markers have different opinions
of the worth of different questions. At its most simplistic, one marker might
give generally higher marks to candidates’ performances on question 1 than
on question 2, while another marker might do the reverse.
Marker-candidate interaction arises when different markers rate different
scripts differently, such as one marker marking candidate A higher than
candidate B and another doing the opposite (or rating candidate A much
higher than candidate B compared with the first marker).
Marker- occasion interaction is where markers change their relative standards
of marking from one occasion to another, for example as they mark from start
to finish of an operational marking period.
These are all examples of interactions involving markers that are commonly
subsumed under the term ‘intra-marker’ variability.
To provide a dataset that would serve the kind of reliability investigation needed for
this type of test, a multiple-marker study was organised, albeit of small scale. The
study used candidate scripts and markers from the December 2011 test session. The
principal aim of the exercise was to furnish appropriate data for a G-study analysis,
from which interpretable and generalisable estimates of assessment reliability might
be produced. We needed to be able to quantify the contributions to score variance
that could be attributed to candidates themselves, to the questions they attempted, to

33
the markers who marked their responses, and to interactions among these main
factors. We were also interested in exploring the issue of possible marker ‘drift’.
A total of 15 markers participated in the operational marking of the 2391 scripts. Of
these, 12 markers, including the team leader, agreed to take part in the designed
multiple-marker study. The markers participated in the usual marker standardisation
meeting organised by City & Guilds for the unit paper (early December 2011), and
marked a normal allocation of candidate scripts during the regular operational
marking exercise (mid-December 2011 to mid-January 2012). In addition, these
volunteers also marked scripts whose marking results would contribute to the
multiple-marker study.
The maximum number of additional scripts that it was considered feasible to add to
markers’ normal operational allocation was 30. Thus, 30 candidates were randomly
selected from the unit 301 entry list, and this selection was in turn divided at random
into two groups of 15. Once the relevant scripts became available they were
photocopied and batched for delivery to the markers. One batch of 15 scripts was
distributed to the study markers at the end of the operational standardisation meeting
for at-home marking in the week following the meeting. The second batch of 15
scripts was sent to them by post after the Christmas/New Year break for marking
toward the end of the relatively short operational marking period. Mark record sheets
were completed by the markers and sent by email to City & Guilds immediately after
each of the assigned study marking sessions.
The two sections of questions that comprised the test differed in terms of:
the type of question they contained (multi-part short-answer questions in Section A, longer structured questions in Section B);
the number of questions they contained (20 in Section A, six in Section B);
the mark tariffs attached to the questions (three marks each in Section A, 15 marks each in Section B).
By its nature, Section B would in principle be the most vulnerable to marker-related
sources of score variation. For all these reasons it made sense to analyse the two
sections separately in the first instance. The analyses were based on question
scores and not on part-question scores, even though markers recorded their marking
decisions at the level of part questions. The reason is that the mark tariffs associated
with question parts differed both within and across questions, thus complicating not
only any data analysis but also results interpretation.

34
For each section the analysis design followed a four-factor mixed model. All the
candidates attempted the same test paper and in consequence attempted, or had the
opportunity to attempt, all the questions in that paper. So, candidates were ‘crossed’
with questions. Moreover, the markers who participated in the study marked all the
candidate scripts. Markers were, therefore, crossed both with questions and with
candidates. This three-factor crossing is reflected in the expression c x q x m, with c,
q and m representing, respectively, the factors candidates, questions and markers.
While markers and questions are also crossed with occasions, all the markers
marking scripts at the beginning and towards the end of the operational marking
period, candidates cannot be. ‘Occasions’ must be considered as a nesting factor for
candidates, because it would not have been meaningful for markers to mark the
same candidate scripts on two different occasions so close together in time. There
might – certainly would – have been recall effects at play, so that it could never be
assumed that the marks given to the question responses in a candidate’s script in
mid-December 2011 would be quite independently given to those same question
responses in mid-January 2012. Thus, inevitably, the scripts marked on the different
occasions had to be from different candidates, meaning that candidates were
‘nested’ within occasions of marking. This nested relationship is denoted as c:o,
where c and o represent candidate and occasions, respectively.
The design that therefore underpinned the G-study analysis of each section is:
c:o x q x m
with c, o, q and m representing, respectively, candidates (i.e. scripts), occasions,
questions and markers. This design, and the sources of variance that can be
separately quantified in the analysis, is shown schematically in Figure 4.2.
The nesting relationship involving candidates and occasions is shown in Figure 4.2
as concentric circles, while crossed relationships are indicated by intersecting circles.
The resulting sectors in the diagram represent the potential sources of score
variation that can be separately quantified in the analysis – though note that sector
sizes bear no intended relationship with the importance of the different variance
sources. The variance components open to isolation and estimation here are those
for questions, occasions, candidates (within occasions) and markers, along with
components associated with the following interaction effects: questions-occasions,
markers-occasions, markers-questions, candidates- questions, candidates-markers.
The highest order interaction, candidates-questions-markers, is confounded in the
residual variance with all unidentified effects and random error.

35
Figure 4.2: The underpinning analysis design for each paper section
4.3 Analysis results
4.3.1 Section results
Tables 4.1 and 4.2 present the analysis results for Section A and Section B,
respectively; these were produced using the software package urGENOVA (Brennan
2001b). The first feature to note in both tables must be the small negative variance
component estimates. In theory variances cannot be negative. But these are
ANOVA-based variance estimates, and if the variances themselves are close to zero
then their estimates might emerge with values close to zero in either direction. So
that while the variance estimate for ‘occasions’ in Table 4.1 is small and negative, the
variance estimate for ‘markers’ is equally small but positive. When negative
estimates are very small conventional practice is to set them to zero in follow-on
calculations. The same practice is not usually followed in the case of small positive
estimates, but it could legitimately be.
The second important point to note in both tables is the absence of any evidence of
important marker or occasion effects. Inter-marker variation, though it exists, is
extremely small, as are interaction effects involving markers, including marker drift.
Note, though, that marker contributions to question score variance are simply being
dwarfed here by contributions from other sources, in particular candidates and
questions. The identifiable sources of variation that almost all the mark variation in
the two datasets can be attributed to are between-candidate variance (higher in
Section B than in Section A), between-question variance (higher in Section A than in
Section B) and, above all, the candidate-question interaction variance, that accounts

36
for over half the total variance in each case. The residual variance, which contains
the marker-candidate-question interaction variance, accounts for 12% of the total
variance for each section.
source of variance
sum of squares
degrees of
freedom
mean square
variance component
estimate
%*
occasions 33.6200 1 33.6200 -0.0018 -
questions 2151.5683 19 113.2399 0.2954 23
markers 17.0083 11 1.5462 0.0016 -
occasion-question interaction 125.7300 19 6.6174 -0.0082 -
marker-occasion interaction 3.3467 11 0.3042 0.0002 -
marker-question interaction 116.7083 209 0.5584 0.0098 1
candidates (within occasions) 1162.1880 28 41.5067 0.1398 11
marker-question-occasion
interaction
55.4367 209 0.2653 0.0075 <1
candidate-question interaction 4242.2783 532 7.9742 0.6518 52
candidate-marker interaction 43.6117 308 0.1416 -0.0005 -
confounded residual 891.3883 5852 0.1523 0.1523 12
* Variance component estimates as percentages of total question score variance
Table 4.1: ANOVA table for Section A
source of variance
sum of squares
degrees of
freedom
mean square
variance component
estimate
%*
occasions 94.5852 1 94.5852 -0.3423 -
questions 2767.9444 5 553.5889 1.1761 6
markers 169.1833 11 15.3803 0.0563 <1
occasion-question interaction 638.0315 5 127.6063 0.0101 <1
marker-occasion interaction 29.1926 11 2.6539 -0.0039 -
marker-question interaction 312.7889 55 5.6871 0.1173 <1
candidates (within occasions) 12931.3593 28 461.8343 4.6811 25
marker-question-occasion
interaction
169.7241 55 3.0859 0.0612 <1
candidate-question interaction 17482.4963 140 124.8750 10.2256 55
candidate-marker interaction 642.2630 308 2.0853 -0.0137 -
confounded residual 3338.0148 15400 2.1675 2.1675 12
* Variance component estimates as percentages of total question score variance
Table 4.2: ANOVA table for Section B

37
Figure 4.3 shows the compositions of the total question score variance for each
section in terms of the main contributing sources.
Figure 4.3: The composition of the total question score variance for
Sections A and B
The high interaction variance reflects the fact that different candidates found the
different questions in each section harder or easier than others to differing degrees. It
was not the case that one candidate did better on all the questions than some other
candidate, and to the same extent. The candidates’ performance profiles were
‘jagged’. Again, the examiners responsible for this paper threw useful light on this
phenomenon. The 2391 qualification certifies electricians to work in various different
environments – domestic, industrial, commercial. For this reason questions related to
different environments are included in the examination. Perhaps not surprisingly,
candidates perform differently on different questions based on their experience. For
some questions the answer is the same regardless of the context in which it is set,
but due to lack of experience in the environment under question some candidates
struggle and give a wrong answer. Other related factors already mentioned are
candidates being enrolled too early, with varying levels of knowledge and experience,
and teachers/tutors being themselves insufficiently trained.
Using the component estimates in Tables 4.1 and 4.2 we find that for the data from
12 independent multiple markings the value of phi is 0.74 for Section A and 0.70 for
Section B. The SEM for a candidate section total score, averaged over the 12
markers, is 4.4 marks in the first case and 8.4 marks in the second. It follows that
95% confidence intervals around candidate section scores are ± 8.4 marks for
Section A (an interval spanning almost 30 per cent of the 0-60 mark scale) and ±16.4
marks for Section B (an interval spanning 37 per cent of the 0-90 mark scale).

38
Although there was rather little inter-marker or intra-marker variation evident in the
analysis results (for analyses based on mean score and not total score metrics) there
was nevertheless some. When question marks are totalled to produce section totals,
then any degree of marker variability will affect the reliability of candidate assessment
should just one marker mark each script, as in the regular operational processing.
Table 4.3 offers what if? estimates of section reliability and score precision for single
marking (the current operational situation) and for blind double marking. These
estimates are produced simply by substituting the new numbers of markers into the
relevant formulae for phi and the SEM.
Section A (20 3-mark questions)
Section B (6 15-mark questions)
phi 95% CI* Phi 95% CI*
Single marking 0.71 ± 9.4 0.66 ± 18.0
Double marking 0.73 ± 9.0 0.68 ± 17.1
* These are given as marks around candidates’ section total scores
Table 4.3: Estimated reliabilities for single and double marking
In both cases, while it would increase overall test length, score precision could be
improved by adding more questions, should this be a feasible option (for example, by
splitting the two sections into two separate tests, between them including more
questions). In fact, as Section 1 notes, the 2391 qualification was replaced with two
new narrower qualifications in 2012, with different assessment arrangements, so that
these findings no longer have relevance for this particular unit. Notwithstanding, we
move on to consider the reliability of candidate total test scores across the two
sections.
4.3.2 Whole-test results: composite score reliability
We have seen in the previous section the reliability evidence for candidate
measurement for Section A and Section B separately. But what is the result of adding
the two sections together? To answer this question we need to carry out a composite
score analysis. In the case of unit 301 the composite test score is the simple sum of
the two section scores. Since Section A has a maximum total mark of 60 while
Section B has a maximum total mark of 90, this means that Section A carries a lower
weight than Section B in the total test score (40 per cent versus 60 per cent).

39
Since there was no evidence for either section of any marker drift over time or of any
other effects involving occasions, the factor ’occasions’ can be dropped, so that a
new design underpinning analysis could be:
c x q:s x m
where c, q and m represent, as before, candidates, questions and markers, and s
represents sections. Candidates, questions and markers are crossed, while
questions are nested within sections.
However, a univariate analysis would not be appropriate here, because the questions
in the two sections are different in nature and in mark tariff. We need at this point to
appeal to a multivariate generalizability analysis (see Brennan, 2001, Section 10, for
full details; He, 2012, for a summary and simulated example; Johnson & Johnson,
2012b, for real-data example applications). Each section is separately analysed
following the fully crossed random effects design c x q x m (see Figure 4.4), the
estimated variance components for the sections then being weighted appropriately to
produce reliability information for composite scores. The analysis was carried out
using mGenova (Brennan 2001c); the results are shown in Table 4.4.
Figure 4.4: The random effects design c x q x m
As Table 4.4 shows, the dependability coefficient for the 2391-301 composite test is
estimated to be a modest 0.71, while the cut score reliability estimate (for a cut score
of 94) is higher at 0.86.
Of greater importance than the reliability coefficient, however, is the SEM, and the
associated 95% confidence interval around a generic candidate total test score. In

40
Table 4.3 we saw that the 95% confidence intervals around total scores for the two
sections of the test, i.e. Section A and Section B, were ± 9.4 marks and ± 18 marks,
respectively, spanning around 30% and 40% of the respective mark scales of 0-60
and 0-90. Table 4.4 shows that for the test as a whole the SEM is 10.4 marks, giving
a 95% confidence interval around a composite test score of ± 20.3 marks, or around
a quarter of the 0-150 mark scale. The SEM, and hence the confidence interval, can
be expected to differ at different points in the mark distribution; a larger-scale multiple
marking study could have allowed a more targeted investigation, such as an analysis
of the situation for candidates near the cut score.
variance component estimates and % contributions to question score variation
Section A Section B whole test*
candidates (0.1388, 4.5041)
q
11 25
questions (0.2914, 1.1809) 23 6
markers (0.0017, 0.0544 ) - <1
candidate-question interaction (0.6476, 10.2308) 52 56
candidate-marker interaction (-0.0005, -0.0157)
)ininteractionQuestions within Sections
- -
marker-question interaction (0.0134, 0.1163) 1 <1
confounded residual (0.1562, 2.1992) 13 12
Reliability estimates for the operational case of single marking:
phi 0.71 0.66 0.71
phi(3.615) ** 0.86
SEM for a candidate total score 4.8 9.2 10.4
95% confidence interval around total scores ± 9.4 ± 18.0 ± 20.3
* There were 20 3-mark questions in Section A and six 15-mark questions in Section B, giving section maximum marks of 60 and 90, respectively, and a maximum possible test score of 150; 2,401 candidates. ** The cut score for the test was 94 marks out of the total of 150 marks; lambda is conventionally expressed in the mean score metric, and in this case a test score of 94 over 26 questions gives a lambda value for computational use of 3.615
Table 4.4: G-study results for the whole 2391-301 unit test
Within the constraints of budget, logistics and operational timescales, one or other of
the following options might have been considered for feasibility had there been a
need to further improve reliability: encouraging centres to reduce the heterogeneity in
the candidature (in terms of relevant experience and test preparedness, thus
minimising the contribution to measurement error of the candidate-question

41
interaction), increasing the number of questions in the test (perhaps splitting the
sections into tests in their own right, as noted earlier, to avoid an increased risk of
test fatigue should the current test be replaced by another of even longer length), and
rechecking the Section B marking of the small percentage of candidates within two or
three marks of the cut score (to minimise the chances of any candidate
misclassification - see section 4.4). In the event, qualification 2391 had already been
identified for replacement by two alternative qualifications when this project was in
the planning stage, so that reliability improvement is in effect an irrelevant issue for
this particular qualification.
4.4 A focus on marker performance
The analysis results presented earlier in this section confirm that the estimated
contribution of markers to score variation at question level appeared to be negligible.
This is a welcome finding. But it is perhaps not a surprising one. The domain against
which candidates’ electro-technical knowledge was being assessed is by definition
highly technical and well-defined. Section A of the test comprised short-answer
factual recall questions that had very clearly identified correct answers. Even in
Section B the marking scheme for the structured questions was very detailed and in
general awarded single digit marks for specific atomistic elements in candidates’
responses. Marker quality assurance was also rigorous (see below, and City &
Guilds 2011c), with markers showing any weaknesses in their own electro-technical
knowledge being identified for team leader support and perhaps dismissal. The
consequence both of a tightly specified knowledge domain combined with a very
detailed relatively atomistic mark scheme and strong marker quality assurance could
be expected to be high levels of agreement in mark awarding. This will be the case
for many VQ written tests sharing similar characteristics.
In addition, it must be noted that the markers who took part in the reliability study
were fully aware that the batches of scripts they were marking at the beginning and
near the end of the operational marking period were ‘special’. This could potentially
have had some effect on their marking behaviour, but the impact for this particular
test was probably not important – given the constraints on marking noted above.
Nevertheless, should similar studies be organised in the future it would be better if
the identities of the study scripts could be kept from the markers. In other words,
markers should be sent the ‘additional’ papers mixed with their normal papers so that
they could not readily be distinguished. Finally, it must be remembered that marker
42
contributions to mark variability at the question level are dwarfed by variance
contributions from candidates, questions and their interaction.
What can we now say about how well markers could have been measured in this
same exercise? If we think about a marker’s total mark on each section, averaged
over candidates, then we know that the precision of that mark will be affected by
question-related and candidate-related factors, just as the precision of candidates’
section scores was influenced by marker-related and question-related factors. For
the given section tests, the larger the candidate sample that markers are asked to
mark, i.e. the larger the number of scripts they are asked to rate, the more precisely
we can expect to measure their ‘true scores’, i.e. their absolute standards of marking,
as evidenced in their section total marks.
Using the variance component information in Tables 4.1 and 4.2 again, we can shift
attention from candidate measurement to focus on marker measurement, and
calculate 95% confidence intervals around markers’ section total scores. For the
situation in the multiple-marker study, the 95% confidence intervals around a
marker’s section total mark (averaged over 30 scripts) is ± 5.7 marks for Section A
(which had a 0-60 mark scale) and ± 7.8 marks for Section B (which had a 0-90 mark
scale); in both cases the confidence interval is around 10 per cent of the length of the
section mark scale. If these confidence intervals were considered too wide for
individual markers to be fairly judged in terms of their ‘absolute’ overall marking
standards, they could be reduced by increasing the number of candidate scripts their
section marks are averaged over.
Even for situations like the 2391-301 testing, where differences in marker standards
might confidently be assumed to be relatively low, City & Guilds nevertheless
engages in ongoing quality assurance, through the use of seeded scripts. These are
a small number of scripts that are pre-marked by an expert marker, usually the team
leader. The scripts are delivered to the regular markers at points throughout the
marking period and their marks then compared with those of the expert (the regular
markers are unaware of the marks given by the expert marker). In this way ‘aberrant’
markers can be identified. These are typically markers whose allocated total mark for
one or more scripts falls outside some given threshold when compared with the mark
allocated by the expert. But on these occasions rather few scripts are used – five or
10 on each check (City & Guilds, 2011c) – and the criterion for team leader action is
quite strict. In the December 2011 marking process two of the 12 markers that
participated in the multiple-marking study were identified as aberrant. In both cases

43
all the scripts marked by those markers were re-marked. But could the ‘threshold
test’ give misleading results at times?
Figure 4.5 shows the degree of agreement/disagreement in the whole-script mark
allocations of the 12 study markers for the 30 scripts that they evaluated in the
multiple-marker study, with scripts ordered from lowest performing candidate (with an
average over markers of around 38 marks) to best performing candidate (with an
average over markers of 124 marks). The first feature of interest to note is the
general degree of agreement in mark allocations, the majority of the markers
following the same pattern of marking (for reference, marker H was the team leader).
Note also, though, the greater divergence of outcome for middle-performing scripts
compared with high and low performing scripts. This would be expected, since high
performing and low performing candidates will generally offer consistent
performances across the questions. Other features to note are the sometimes large
differences in the marks awarded by markers to several individual candidates within
this generally tidy pattern. This is a common phenomenon that is not confined to City
& Guilds or to this particular test paper.
Grey lines relate to the nine markers other than markers A, G and H that were involved in the study
Figure 4.5: Marker agreement across the range of candidate performance
High inter-marker correlations (the average here was 0.97) and low contributions of
marker variability to total score variation at question level (as shown in Tables 4.1

44
and 4.2) can lead to false confidence that all is well and nothing needs improvement.
High correlations simply mean that markers rank candidates similarly; the longer the
mark scale the greater the chance that high inter-marker correlations will emerge.
Low contributions of marker-related variability to score variation at question level, for
its part, might simply reflect the fact that candidate-related and question-related
variability is much higher, as in this case.
When we look at the results of cumulating the marks that the different markers
awarded to the 26 question attempts of individual candidates to produce total test
scores, we see quite large differences in some cases. Even for the best and worst
performing candidates shown in Figure 4.5 we see differences of 10 to 20 marks in
the total test scores awarded by the different markers. For the handful of candidates
in this small sample who emerged from the exercise with total marks within two or
three marks of the cut score (94, recall), there was an almost even chance of passing
or failing the test, and therefore of gaining or not gaining the qualification. This is
because around half the markers produced total marks at or above 94 and half
below. Outside this interval there was unanimous agreement in pass-fail outcome, if
not in total marks awarded.
Among the12 markers in Figure 4.5, two are clearly distinguishable from the rest.
One of these is marker G, who tended to be more lenient than the other markers,
especially in the middle of the script range; this marker was in fact identified as
aberrant during the routine City & Guilds quality assurance checks. The other is
marker A, who tended to be more severe than the others, though for only a handful of
scripts. This marker was not identified as aberrant in the operational quality
assurance checks, and on further investigation the reason for the unusually low
marks awarded to particular scripts in the marker study became clear: they were
mark transcription errors rather than inappropriate mark allocations. In contrast, a
marker whose performance in the multiple-marker study was entirely in line with the
general pattern was identified as aberrant in a seeded script check.
It should be a relatively straightforward matter to identify individual markers as being
more or less severe in their marking than all other markers – although, as we have
established earlier in this section, markers’ marks would need to be averaged over
more than a handful of scripts if their absolute marking standards are to be estimated
with confidence. If a discrepancy were found to be consistent across scripts then that
marker’s marks could simply be adjusted up or down by some appropriate amount
(the fact that markers typically mark all the scripts from particular centres risks

45
confusing the issue). If discrepancies were inconsistent then an across-the-board
adjustment would not be an option, and in that case the only sensible strategy
available would indeed be to re-mark all of that individual’s assigned scripts, as was
organised for this test in the case of marker G.
4.5 Study limitations
For unavoidable reasons the multiple-marker study was on this occasion very small-
scale in terms of the number of scripts that it was anticipated could be independently
marked by the 12 markers on top of their normal operational workload. The 30 scripts
reviewed were, however, randomly selected from the 2391 test entry, and the
performance of the 30 candidates do appear to be a fair reflection of that of the entire
candidate group (see Figure 4.1). In that sense the results of the study can be
generalised to the larger group of candidates. The 12 markers who elected to
participate in the study were not unusual either, and, as a sample, their
performances, too, can be generalised to all markers of similar type (similar personal
and professional characteristics). In other words, despite the small size of the
candidate and marker samples the results of the study can reasonably be
generalised to the whole marking operation.
What is lost as a result of the small scale of the study is the ability to look closely at
the reliability situation for particular candidate subgroups, in particular for those
candidates within a few marks of the cut score. In any repeat venture it would be
good if the number of scripts evaluated could be at least tripled, and if the scripts
could all be selected from around that critical cut score. This latter feature would not
necessarily require that the script sample be selected and the marking study carried
out after the entire operational assessment had taken place, since cut score
possibilities within a fairly narrow range are typically identified quite early in the
process on the basis of previous years’ results.

46
5 Discussion and implications
5.1 Study findings and implications
Ofqual’s reliability programme was prompted by concerns regarding the lack of a
coherent body of knowledge on the issue of assessment reliability. As a result there
has been a flurry of research in this area, leading to the publication of a compendium
of knowledge on this issue (Opposs & He, 2012). Despite this, work looking at
reliability in vocational assessments remains relatively scarce, as noted in Section 1.
The current study, together with a partner study that looked at the picture across
multiple-choice knowledge tests in many different units (Boyle & Rahman, 2012),
constitutes a significant step in building and broadening the body of knowledge
relating to the reliability of vocational qualifications.
The aims of this particular project were to investigate the reliability of unit knowledge
tests undertaken as part of electro-technical qualifications, and, where reliability
improvement was indicated, to identify strategies for achieving that improvement.
The findings indicate that for the most part there are grounds for confidence in these
qualifications, with consistent levels of marker reliability being maintained over time
for the marked unit paper, and satisfactory if not high levels of reliability being
obtained for candidate assessment overall in all three qualifications.
Increases to the numbers of items included in the machine-delivered on-demand
multiple-choice tests explored in the study would improve reliability. In fact, this has
already happened, as during the progress of this research the introduction of new
wiring regulations necessitated the review and revision of both tests. While
undertaking this activity City & Guilds also took the decision to increase the test
lengths in terms of numbers of items. During the review some items were amended
or removed and the subject expert undertook a further quality check of all the
remaining items. The shorter test format for qualification 2377-100 has now been
extended from 45 to 50 items, while that for qualification 2377-200 has been
extended from 30 to 45 items. Therefore the recommendations arising from this work
have in part already been implemented.
Turning next to the traditional marked paper-based unit test of qualification 2391, the
designed multiple-marker study allowed the post-standardisation judgements of 12
City & Guilds assessors to be compared at two time points: immediately after the
standardisation meeting and four weeks later towards the end of the operational
marking period. Analysis revealed very similar patterns of marking behaviour on the

47
two occasions, with no evidence of ‘marker drift’. Moreover, in general inter-assessor
agreement was good. Agreement following the standardisation meeting is to be
expected: achieving agreement in ratings across all assessors is after all the main
purpose of such exercises. What is particularly encouraging about these findings,
though, is that there was no fall from that initial post-standardisation level of
reliability. This is an extremely important finding, because it speaks to the
maintenance of assessor standards and the consistency of likely assessment
outcomes over time.
However, despite these positive headline findings there is evidence of some room for
improvement. The main conclusions from this part of the work are that while markers
are largely marking consistently, the confidence intervals around candidates’ total
scores are nevertheless larger than they perhaps could be. The research suggests
that assessment reliability for candidates could be improved by increasing the
number of questions in the test, either by developing a single longer test or by
replacing the two-section test with two tests, with respective assessment objectives
matching those of the two original sections. The feasibility of either option would
need to be evaluated against implications for cost and logistics. It should be noted
that, as mentioned in Section 1, City & Guilds had been in the process of reviewing
qualification 2391 before this project began, and had decided to replace it with two
narrower qualifications, each assessed using the on-demand multiple-choice test
format plus a practical assignment.
5.2 Conclusions and recommendations
As we noted at the outset of this work, reliability is central to the esteem in which
vocational qualifications are held, for without reliability in assessment there can be
little by way of quality assurance or comparability – in other words, the qualifications
would fail in their duty to provide a benchmark of performance. Given current
concerns over (lack of) parity of esteem for vocational qualifications across Europe
(see Brockmann, Clarke & Winch, 2011), and in particular within the UK the
continued questioning by some commentators of the value of vocational
qualifications, there is particular reason for examining the reliability of vocational
assessments. There is however another reason for concern regarding reliability, and
this is at the level of the individual. Issues of reliability are fundamental to notions of
equitable treatment during the process of assessment.
Some writers (see, for example, Parkes, 2007) have noted that the absence of
evidence can be construed as the absence of reliability itself: in other words, the lack

48
of evidence relating to reliability is taken as proof that tests are themselves not
reliable. It is true that there has been little research in this area, but this is now being
addressed through the commissioning of research such as that reported here. This
research is important for two main reasons: to reassure candidates (and their
teachers and families) that they are likely to be treated as fairly in assessments for
these qualifications as they would be were they to opt for an ‘academic’ qualification;
and secondly, to inform future item reviews and the actions of scheme managers,
chairs, and lead assessors. Given the real momentum behind apprenticeships in the
UK at present, both these points are likely to assume ever-greater prominence.
Given the relatively little exploration to date of the reliability of vocational
assessments, this work constitutes an important contribution to the current limited
body of knowledge regarding reliability in these qualifications. While there has been
some investigation of assessor behaviours in judging portfolios of evidence (i.e. a mix
of records of observation, questioning and documentation; see Greatorex and
Shannon, 2003) there has been little research focused specifically on the actions of
markers in assessing the knowledge tests used within vocational qualifications. In
part the dearth of research on the testing of knowledge may be attributable to the
history of the role of knowledge within vocational qualifications (and in particular
within NVQs, as the primary vocational route in the UK since 1986). It will be recalled
that when NVQs were first introduced there were no explicit tests of knowledge,
because the desire was for all knowledge to be assessed through performance. The
range statement (see also range variables and range indicators) established the
contexts within which the performance should be exhibited and assessed and in so
doing, also implied the knowledge needed to perform in that range of contexts (Miller,
1992). It was only where assessment would become unnecessarily laborious and
drawn-out that knowledge would be assessed directly, and in the early stages this
was envisaged as being through questioning by the assessor.
This in turn may be one of the reasons for one of the long-standing myths
surrounding vocational assessments: that no knowledge tests are used in vocational
qualifications. In fact, within a few years of the introduction of NVQs several issues
had emerged regarding the testing of underpinning knowledge: if testing was to be
left to the questioning strategies of individual assessors, how could verifiers assess
extent and sufficiency of coverage? Recording of questions and answers could add
significantly to the assessment burden. Some high risk occupations raised particular
concerns. But it was perhaps the case of apprenticeships that lent the greatest
weight of argument to the debate. If young people were to gain their major

49
preparation for the workplace through this type of qualification and assessment,
would this provide a sufficient and coherent body of knowledge to underpin their
occupational competence and to form a foundation for any future learning?
Subsequently, technical certificates were introduced, which in some cases were
designed from scratch and elsewhere were re-designed from the certificates and
diplomas that had existed prior to, and sometimes had continued in parallel with,
NVQs. Awarding organisations such as City & Guilds had retained long-standing item
banks which they had continued to use (with updating as appropriate) within their
bespoke qualifications provided to companies. These were once again pressed into
service when explicit knowledge testing returned to the vocational arena.
As we noted above, it was particularly in high risk areas of work that written (or, more
recently, online) tests were viewed as essential to guarantee competent
performance. The tests examined in the current study related to the knowledge
needed to assure competent performance with electrical equipment and installations.
Whilst these certificates assess knowledge within a relatively high-risk sector of the
economy, the domains assessed are well-defined and delimited. The tests appear to
show reasonable levels of reliability and assessors’ marks are also generally
dependable.
However, these tests provide only limited room for variance in the answers sought,
one being multiple-choice, the other consisting of a short-answer section and a
second section requiring slightly longer answers. As answers become longer, factors
such as phraseology come more to the fore, and markers have a greater role to play
in interpreting responses. It is perhaps in these types of assessment that less
reliability might be expected. However, the types of assessment chosen for study in
this project were circumscribed by the need to ensure the work could be successfully
undertaken within both the tight timescale and the available budget. Examination of
less well-constrained tests and other modes of assessment (of observed
performance, for example) would be valuable, but would require greater resources
than those available for the research described in this report. Nonetheless, as
interest grows in vocational options, there is likely to be a need for evidence that
these assessment options are at least as reliable as their academic equivalents.
It should be noted that at the time of writing, City & Guilds was planning research into
the validity of observational workplace-based assessment. It is also the
organisation’s intention to follow up this sponsored research with an internal project
to look at how the insights gained from reliability studies can be implemented within

50
day-to-day operations. This process had already begun immediately after the end of
the study, when the research findings were presented to the relevant chief
examiners, team leaders and markers during the routine post-award debriefing
meeting. Further wider follow-up will take into account matters such as how to
present statistical findings, how to generate indices operationally for hundreds of
tests, and so on.

51
References
Boyle, A. & Rahman, Z. (2012). The internal reliability of some City & Guilds tests.
Report prepared for the Office of Qualifications and Examinations Regulation.
Brennan, R.L. (2001a). Generalizability theory. New York: Springer-Verlag.
Brennan, R.L. (2001b). Manual for urGENOVA version 2.1. Iowa testing programs
occasional papers, no. 49.
Brennan, R.L. (2001c). Manual for mGENOVA version 2.1. Iowa testing programs
occasional papers, no. 50.
Brennan, R.L. (2006) (ed). Educational Measurement (4th Edition). Westport, CT:
American Council on Education and Praeger Publishers.
Brennan, R.L. & Kane, M.T. (1977). An index of dependability for mastery tests.
Journal of Educational Measurement, 14, 277-289.
Brockmann, M., Clarke, L. & Winch, C. (eds) (2011). Knowledge, Skills and
Competence in the European Labour Market. What’s in a vocational qualification?
Abingdon and New York: Routledge.
Brown, W. (1910). Some experimental results in the correlation of mental abilities.
British Journal of Psychology, 3, 296-322.
Cardinet, J., Johnson, S. & Pini, G. (2009). Applying Generalizability Theory using
EduG. New York: Routledge.
City & Guilds (1993) City & Guilds of London Institute: a short history, 1878 – 1992.
London: City and Guilds of London Institute.
City & Guilds (2008a). Level 3 Certificates for the Code of Practice for In-Service
Inspection and Testing of Electrical Equipment (2377). Qualification handbook.
London: City and Guilds of London Institute.
City & Guilds (2008b). Level 3 Certificate in the Certification of Electrical
Installations(inspection, testing and certification of electrical installations)(2391-10)
Qualification handbook. London: City & Guilds of London Institute.
City & Guilds (2011a). History. http://www.cityandguilds.com/42627.html.
City & Guilds (2011b) Licence to practise: special report.
http://www.cityandguilds.com/21094.html.

52
City & Guilds (2011c). Procedures and instructions for standardising and awarding
multi-examiner marked tests. Version 1. London: City & Guilds of London Institute.
Cronbach, L.J. (1951). Coefficient Alpha and the internal structure of tests.
Psychometrika, 16, 297-334.
Cronbach, L.J., Gleser, G.C., Nanda, H. & Rajaratnam, N. (1972). The dependability
of behavioral measurements: Theory of generalizability for scores and profiles. New
York: Wiley.
Evans, D. (2007). The history of technical education: a short introduction (second
edition). http://www.tmag.co.uk/extras/history_of_Technical_Education_v2.pdf.
Evans, D. (2008). History of technical and commercial examinations: a reflective
commentary.
http://www.tmag.co.uk/extras/history_of_Technical_Commercial_Exams08.pdf.
Greatorex, J. (2005). Assessing the evidence: different types of NVQ evidence and
their impact on reliability and fairness. Journal of Vocational Education and Training,
57, 149-164.
Greatorex, J. & Shannon, M. (2003), How can NVQ assessors’ judgements be
standardised? Paper presented to the British Education Research Association
Conference, September 2003.
Haertel, E.H. (2006). Reliability. Section 6, pp 65-110, of Brennan (2006).
Harth, H. & Hemker, B. (2012). On the reliability of results in vocational assessment:
the case of work-based certification. Chapter 8 in Opposs & He (2012).
He, Q. (2012). Estimating the reliability of composite scores. Chapter 12 in Opposs &
He (2012).
Jessup, G. (1991). Outcomes: NVQs and the emerging model of education and
training. London: The Falmer Press.
Johnson, M. (2008). Exploring assessor consistency in a Health and Social care
qualification. Journal of Vocational Education and Training, 60, 173-187.
Johnson, S. (2012). A focus on teacher assessment reliability in GCSE and GCE.
Chapter 9 in Opposs & He (2012).
Johnson, S. & Johnson, R. (2012a). Conceptualising and interpreting reliability.
Chapter 11 in Opposs & He (2012).

53
Johnson, S. & Johnson, R. (2012b). Component reliability in GCSE and GCE.
Chapter 6 in Opposs & He (2012).
Lang, J. (1978). City & Guilds of London Institute: centenary 1878 – 1978. London:
City and Guilds of London Institute.
Lord, F.M. & Novick, M.R (1968). Statistical Theories of Mental Test Scores.
Reading, MA: Addison-Wesley.
Meadows, M., & Billington, L. (2005). A review of the literature on marking reliability.
London: National Assessment Agency.
Meyer, P. (2010). Understanding measurement: reliability. New York: Oxford
University Press (Series in Understanding Statistics).
Miller, L (1992). Range issues in National Vocational Qualifications. City & Guilds
Research Report 56. London: City and Guilds of London Institute.
Murphy, D.J., Bruce, D.A., Mercer, S.W. & Eva, K.W. (2009). The reliability of
workplace-based assessment in postgraduate medical education and training: a
national evaluation in general practice in the United Kingdom. Advances in Health
Sciences Education, 14, 219-232.
Murphy, R., Burke, P., Content, S., Frearson, M., Gillispie, J., Hadfield, M., Rainbow,
R., Wallis, J. & Wilmut, J. (1995). The reliability of assessment of NVQs. Report
presented to the National Council for Vocational Qualifications. School of Education,
University of Nottingham.
Ofqual (2008a). Regulatory arrangements for the Qualifications and Credit
Framework. Coventry: Office of Qualifications and Examinations Regulation.
Ofqual (2011). Annual qualifications market report: version two – August 2011.
Coventry: Office of Qualifications and Examinations Regulation.
Opposs, D. & He, Q. (eds)(2012), Ofqual’s Reliability Compendium. Coventry: Office
of Qualifications and Examinations Regulation.
Parkes, J. (2007) Reliability as argument. Educational Measurement: Issues and
Practice, 26, 2-10.
Raykov, T. & Marcoulides, G.A. (2011). Introduction to psychometric theory. New
York: Routledge.
Robinson, C. (2007). Awarding examination grades: current processes, in Newton,
P., Baird, J-A., Goldstein, H., Patrick, H. & Tymms, P. (eds.) Techniques for

54
monitoring the comparability of examination standards. London: Qualifications and
Curriculum Authority.
Searle, S.R., Casella. G. & McCulloch, C.E. (2006). Variance Components.
Second edition. Hoboken: Wiley.
Spearman, C. (1910). Correlation calculated from faulty data. British Journal of
Psychology, 3, 271-295.
SSRE (2006). EduG User Guide. Neuchatel: Institut Romand de Recherche et de
Documentation Pédagogique. Available online at www.irdp.ch/edumetrie.
Watts, A. (2008). Independent examination boards and the start of a national system.
Research Matters, 5, 2-6.

We wish to make our publications widely accessible. Please contact us if you
have any specific accessibility requirements.
First published by the Office of Qualifications and Examinations Regulation in
2013
© Crown copyright 2013
You may re-use this publication (not including logos) free of charge in any
format or medium, under the terms of the Open Government Licence. To view
this licence, visit The National Archives; or write to the Information Policy
Team, The National Archives, Kew, Richmond, Surrey, TW9 4DU; or email:
This publication is also available on our website at www.ofqual.gov.uk
Any enquiries regarding this publication should be sent to us at:
Office of Qualifications and Examinations Regulation
Spring Place 2nd Floor
Coventry Business Park Glendinning House
Herald Avenue 6 Murray Street
Coventry CV5 6UB Belfast BT1 6DN
Telephone 0300 303 3344
Textphone 0300 303 3345
Helpline 0300 303 3346