reliability and availability calculation for the
TRANSCRIPT
RELIABILITY AND AVAILABILITY CALCULATION FOR THEEDUCATIONAL LABORATORY
Vaclav Oujezsky, Bohumil NovotnyDoctoral Degree Programme (2), FEEC BUT
E-mail: [email protected], [email protected]
Supervised by: Vladislav SkorpilE-mail: [email protected]
Abstract: The basic task was to define the reliability of network equipment in the Laboratory ofTransport Networks which is a part of “Sensor, Information and Communication Systems” researchcenter (SIX). The whole educational process in the laboratory depends on the reliability of networkequipment and our intention is to propose a method to define availability and reliability of usednetwork equipment. It also serves the purpose of effective and predictable equipment renewal. Thisarticle describes mentioned method.
Keywords: availability, equipment, educational process, laboratory, reliability
1 INTRODUCTION
The emerging educational equipment such as PCs or servers may require very high reliability andavailability. Educational tools where services for students are running can also be taken in considera-tion. Improving the quality of teaching and the experience from it are the most important things. Weshould to know the approximate lifetime of our equipment to support effectively replace it in advance.We should somehow assure the reliability and availability of these things and fittings. The basic ideaabout measuring reliability is well known nowadays. We have focused on mean time between failure(MTBF) and mean time to recover (MTTR). MTBF is used for more than 50 years as a basic mea-surement for various decisions. Over the years about 30 methods and procedures to predict life cycleshas been developed. MTBF is still a subject of endless debates. The intention was to use these MTBFand MTTR values to calculate the overall reliability of the lab, as if it was one integral element toensure the operation and look at this as a unit.We have a server room in the laboratory, where servers, routers and switches are running for student’stasks. PCs and tools for the same purpose are placed outside of the server room in a class room. Tomeasure the reliability and availability the laboratory has been divided into five subsystems. For the
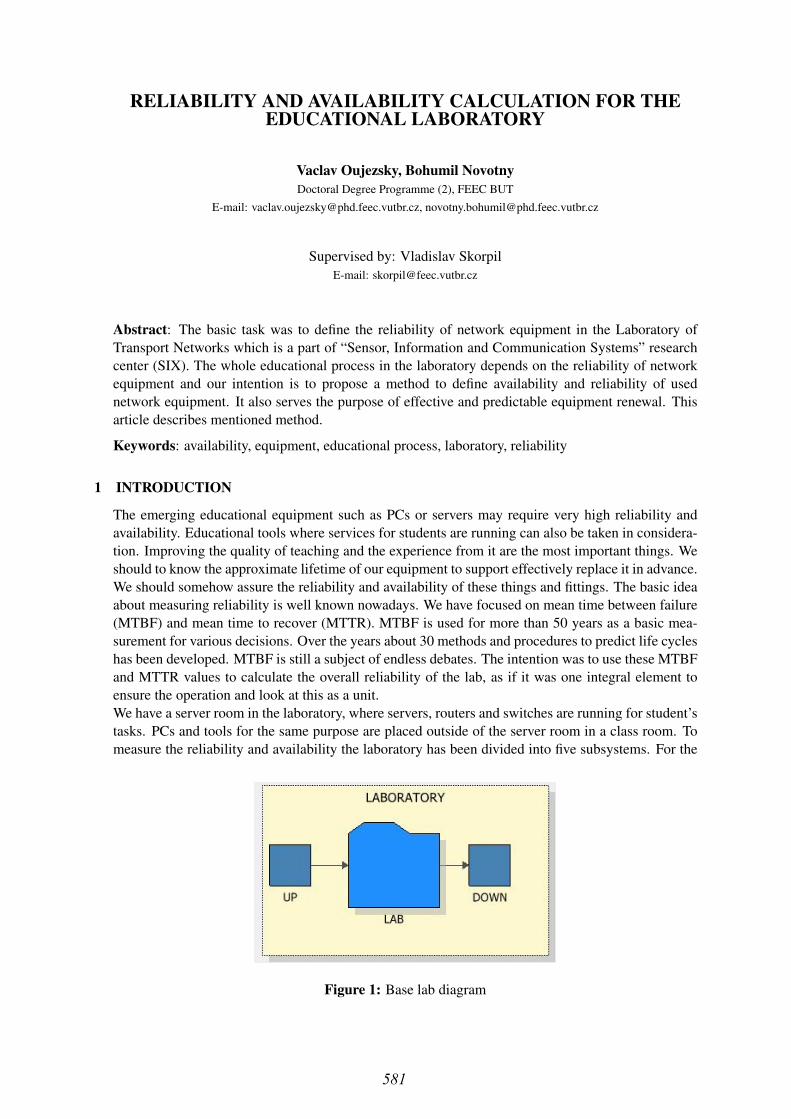
Figure 1: Base lab diagram
581

each subsystem the reliability block diagram (RBD) and fault trees (FT) were created, these subsys-tems were then compounded together to achieve the final result as is shown in Fig. 1.1 The LABblock is the sub-block which consists of five blocks.
2 THE THEORY OF ASSESSMENT THE AVAILABILITY AND RELIABILITY OF SYSTEMS
The authors Liptak and Bela in their book discuss the whole issue of mentioned problem. For thedetailed introduction to this theory and issues we refer readers to this source [1]. For the quickreview; the reliability expresses the probability of the system when the system does its requiredfunctions under stated conditions for a stated period of time at a given confidence level. Then theMTBF represents a unit, usually in hours, how reliable the system is. The higher the MTBF we have,the more reliable the system is. It is calculated by total test time T divided by the total number offailures V . Failures are typically defined by drops, also including human factor. The failure rate λ istypically given by λ = 1/MT BF . Mean time to failure (MTTR) is used for non-repairable systemsand has the same calculation as MTBF, which is used for repairable systems. Availability A, incomparison to reliability, expresses the probability that the system will be correctly running at a giventime, as is shown in Equation 1:
A =MT BF
MT BF +MT T R(1)
The reliability R of systems is given by Equation 2:
R = e−(λ) (2)
For predicting the reliability numerous methods were developed. Significant part of these methodsimprovement was brought by NASA. We can name some of these methods such as MIL-HDBK 217[2], Handbook for Reliability Data for Electronic Components (HRD5) which is used for telecom-munication systems, Reliability Block Diagram (RDB) or Fault Trees. MIL-HDBK 217 which wasproven as an unreliable method and it is not being used.
2.1 RELIABILITY BLOCK DIAGRAM
Reliability block diagram represents tools to calculate and model system reliability and availabilityusing block diagrams as is shown in Fig. 2. In this figure an example of serial system reliabilityblock diagram is shown. We refer readers to the source of information [3], where the mathematicalrelationships are clearly described. Each block in RBD represents one component, subsystem orother representative failure. It also serves an analysis tool to show how a system works and how eachelement can affect the whole system.
Power Unit
R1/λ
Motherboard
R2/λ
RAM
R3/λ
Figure 2: Serial reliability block diagram example
1The quality of exported pictures from RENO is not so good due to the features of the program and our screen resolution.We were unable to export pictures in better quality.
582

Table 1: Simple equipment specifications overviewName Current Age / Yr MTBF sets /HourUPS 1 87.246Cisco 2821** 6 170.000Cisco 871 9 380.000Cisco 1812 9 301.886Cisco SGE2010P** 2 400.000Cisco SG500 3 143.124PCLFPGA server 4 45.753HBA 4 252.550Storage Array 4 68.961Cisco 2960 1 336.409Cisco 1841 6 301.886Cisco VOIP** 6 100.000PC Student** 0.5 150.000TERM 7 72.872TERM2/3 0.5 52.400SMC DSP205 — —
2.2 FAULT TREES
Fault trees is a method that was developed by Bell Telephone Laboratories. Fault trees can help in thedetailed description of the path of events. These events can be normal events, disturbances that causefailures at the component or unexpected events in the analysis. Reliability is calculated by convertinga completed fault tree into the equivalent set of equations. This is done by using the algebra of events,also referred to as Boolean algebra.
Figure 3: LAB Block Diagram RENO RBD
583
3 PROPOSED SOLUTION AND STEPS
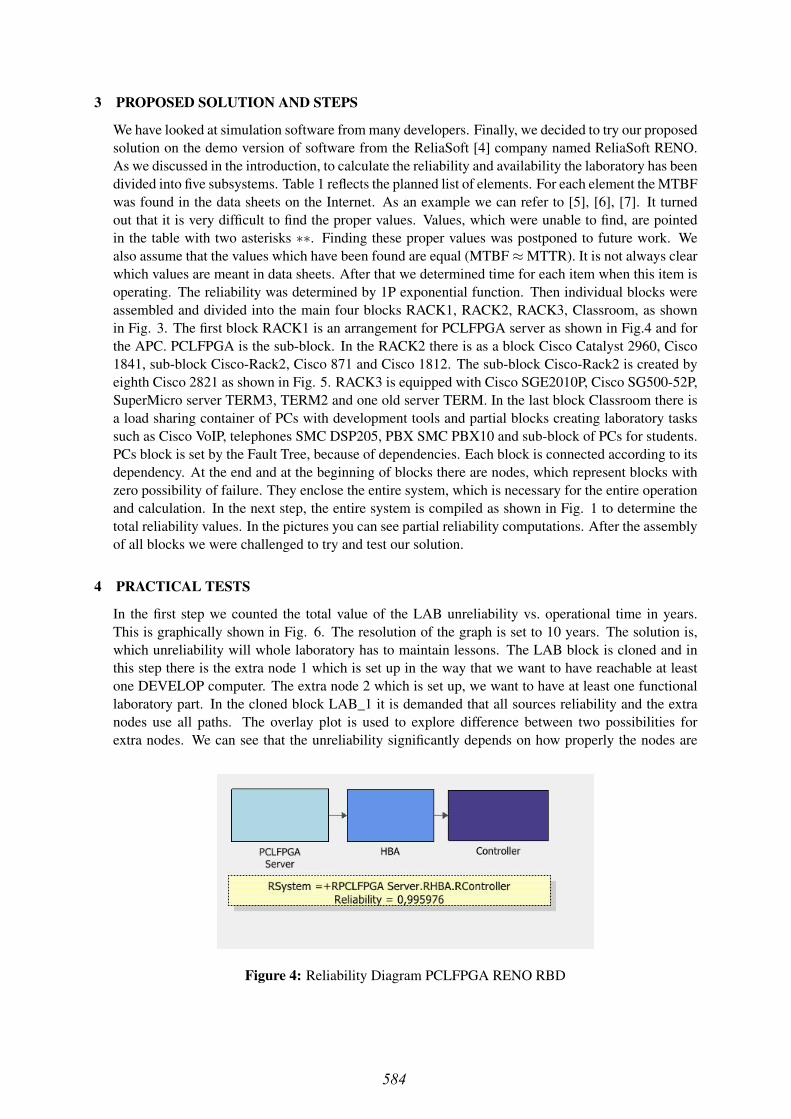
We have looked at simulation software from many developers. Finally, we decided to try our proposedsolution on the demo version of software from the ReliaSoft [4] company named ReliaSoft RENO.As we discussed in the introduction, to calculate the reliability and availability the laboratory has beendivided into five subsystems. Table 1 reflects the planned list of elements. For each element the MTBFwas found in the data sheets on the Internet. As an example we can refer to [5], [6], [7]. It turnedout that it is very difficult to find the proper values. Values, which were unable to find, are pointedin the table with two asterisks ∗∗. Finding these proper values was postponed to future work. Wealso assume that the values which have been found are equal (MTBF ≈ MTTR). It is not always clearwhich values are meant in data sheets. After that we determined time for each item when this item isoperating. The reliability was determined by 1P exponential function. Then individual blocks wereassembled and divided into the main four blocks RACK1, RACK2, RACK3, Classroom, as shownin Fig. 3. The first block RACK1 is an arrangement for PCLFPGA server as shown in Fig.4 and forthe APC. PCLFPGA is the sub-block. In the RACK2 there is as a block Cisco Catalyst 2960, Cisco1841, sub-block Cisco-Rack2, Cisco 871 and Cisco 1812. The sub-block Cisco-Rack2 is created byeighth Cisco 2821 as shown in Fig. 5. RACK3 is equipped with Cisco SGE2010P, Cisco SG500-52P,SuperMicro server TERM3, TERM2 and one old server TERM. In the last block Classroom there isa load sharing container of PCs with development tools and partial blocks creating laboratory taskssuch as Cisco VoIP, telephones SMC DSP205, PBX SMC PBX10 and sub-block of PCs for students.PCs block is set by the Fault Tree, because of dependencies. Each block is connected according to itsdependency. At the end and at the beginning of blocks there are nodes, which represent blocks withzero possibility of failure. They enclose the entire system, which is necessary for the entire operationand calculation. In the next step, the entire system is compiled as shown in Fig. 1 to determine thetotal reliability values. In the pictures you can see partial reliability computations. After the assemblyof all blocks we were challenged to try and test our solution.
4 PRACTICAL TESTS
In the first step we counted the total value of the LAB unreliability vs. operational time in years.This is graphically shown in Fig. 6. The resolution of the graph is set to 10 years. The solution is,which unreliability will whole laboratory has to maintain lessons. The LAB block is cloned and inthis step there is the extra node 1 which is set up in the way that we want to have reachable at leastone DEVELOP computer. The extra node 2 which is set up, we want to have at least one functionallaboratory part. In the cloned block LAB_1 it is demanded that all sources reliability and the extranodes use all paths. The overlay plot is used to explore difference between two possibilities forextra nodes. We can see that the unreliability significantly depends on how properly the nodes are
Figure 4: Reliability Diagram PCLFPGA RENO RBD
584

Figure 5: Reliability Diagram Cisco Rack 2 RENO RBD
set up. In the second step we measured the reliability of all nodes. The results are represented ingraph in Fig. 7. As we expected, the worst value is in block Cisco-Rack2 due to the entered values.The results of the mean life for whole system in this case is Mean Li f e = 7,732263Y r , Probability
Figure 6: Graph Reliability LAB
of Failure Q(t = 10) = 0,743212 where t = years, Reliable Life t(R = 0,85) = 3,070425 Y r andFailureRate = 0,201384 Y r. Same calculation stands for the sub-block, for Cisco-Rack2 the resultsare: Mean Live Mean Li f e = 2,424637 Y r, Reliability R(t = 10) = 0,016206, Probability of Failure
585

Q(t = 10) = 0,983794, Reliable Life t(R = 0,85) = 0,394238 Y r. For the PCLFPGA : Probabilityof Failure Q(t = 2) = 0,506560, Probability of Failure Q(t = 10) = 0,970747, Reliable Life t(R =0,85) = 0,460162 Y r, Mean Life Mean Li f e = 2,830082 Y r. The resulting report on the reliabilityand importance is graphically shown in Fig. 8, where it is possible to see each equipment’s values.
Figure 7: Graph Reliability LAB - all nodes
Figure 8: Reliability and importance
We used the Quick Calculation Pad (QPC) tool to calculate (predict) time of the device replacementas shown in Fig. 9. QPC tool is part of ReliaSoft RENO. The value of the required reliabilityof equipment was set at 50 percent. It is also called as the “warranty time calculation”. For anexample, we can suggest from this precursory calculation the following values of time to equipmentrenewal: Cisco-Rack-2 = 1,681436 Y r, PCLFPGA = 1,962604 Y r, PC-Student = 1,978160 Y r. Thisresult is affected by the input values of MTBF discussed in Cap. 3.
586
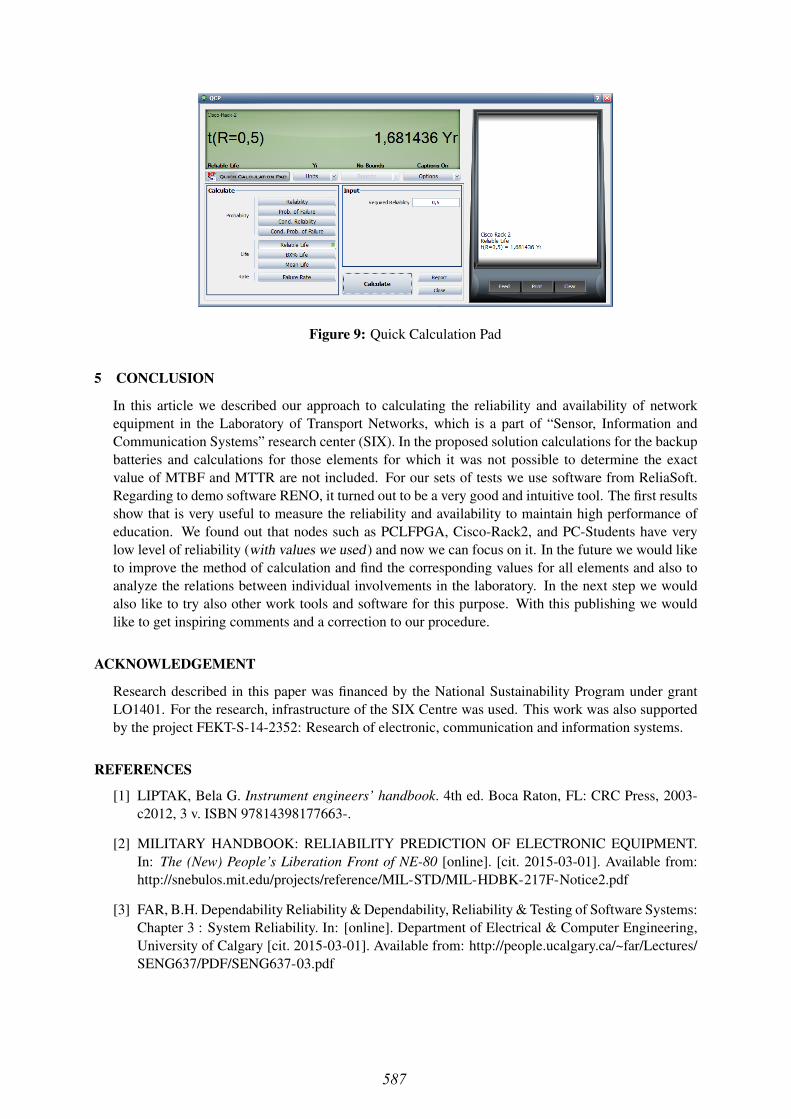
Figure 9: Quick Calculation Pad
5 CONCLUSION
In this article we described our approach to calculating the reliability and availability of networkequipment in the Laboratory of Transport Networks, which is a part of “Sensor, Information andCommunication Systems” research center (SIX). In the proposed solution calculations for the backupbatteries and calculations for those elements for which it was not possible to determine the exactvalue of MTBF and MTTR are not included. For our sets of tests we use software from ReliaSoft.Regarding to demo software RENO, it turned out to be a very good and intuitive tool. The first resultsshow that is very useful to measure the reliability and availability to maintain high performance ofeducation. We found out that nodes such as PCLFPGA, Cisco-Rack2, and PC-Students have verylow level of reliability (with values we used ) and now we can focus on it. In the future we would liketo improve the method of calculation and find the corresponding values for all elements and also toanalyze the relations between individual involvements in the laboratory. In the next step we wouldalso like to try also other work tools and software for this purpose. With this publishing we wouldlike to get inspiring comments and a correction to our procedure.
ACKNOWLEDGEMENT
Research described in this paper was financed by the National Sustainability Program under grantLO1401. For the research, infrastructure of the SIX Centre was used. This work was also supportedby the project FEKT-S-14-2352: Research of electronic, communication and information systems.
REFERENCES
[1] LIPTAK, Bela G. Instrument engineers’ handbook. 4th ed. Boca Raton, FL: CRC Press, 2003-c2012, 3 v. ISBN 97814398177663-.
[2] MILITARY HANDBOOK: RELIABILITY PREDICTION OF ELECTRONIC EQUIPMENT.In: The (New) People’s Liberation Front of NE-80 [online]. [cit. 2015-03-01]. Available from:http://snebulos.mit.edu/projects/reference/MIL-STD/MIL-HDBK-217F-Notice2.pdf
[3] FAR, B.H. Dependability Reliability & Dependability, Reliability & Testing of Software Systems:Chapter 3 : System Reliability. In: [online]. Department of Electrical & Computer Engineering,University of Calgary [cit. 2015-03-01]. Available from: http://people.ucalgary.ca/~far/Lectures/SENG637/PDF/SENG637-03.pdf
587

[4] ReliaSoft Corporation [online]. 2015. release. [cit. 2015-02-28]. Available from: http://reliasoft.com/
[5] Cisco Catalyst 2960-S and 2960 Series Switches with LAN Base Software: EnhancedNetwork Security, Availability, and Manageability for Small and Medium-Sized Busi-nesses. In: [online]. USA: Cisco Systems, Inc., 2008-2010 [cit. 2015-02-28]. Avail-able from: http://www.cisco.com/cisco/web/solutions/small_business/products/routers_switches/catalyst_2960_series_switches/docs/C78-481303-02_2960-LAN_DS_FINAL.pdf
[6] Dell Power Solutions: DELL [online]. 2015 [cit. 2015-02-28]. Available from: http://www.dell.com/content/topics/global.aspx/power/en/ps3q02_shetty?c=us
[7] TORELL, Wendy a Victor AVELAR. Performing Effective MTBF Comparisons for Data Cen-ter Infrastructure: White Paper 112. In: AVELAR, Victor. [online]. Schneider-Electric [cit.2015-02-28]. Revision 1. Available from: http://www.apcmedia.com/salestools/ASTE-5ZYQF2/ASTE-5ZYQF2_R1_EN.pdf?sdirect=true
588