relaxation dynamics and cold crystallization of poly ... · poly(pentamethylene terephthalate) as...
TRANSCRIPT

Loughborough UniversityInstitutional Repository
Relaxation dynamics andcold crystallization ofpoly(pentamethylene
terephthalate) as revealed bydielectric spectroscopy
This item was submitted to Loughborough University's Institutional Repositoryby the/an author.
Citation: SOCCIO, M. ... et al., 2014. Relaxation dynamics and cold crys-tallization of poly(pentamethylene terephthalate) as revealed by dielectric spec-troscopy. Polymer 55 (6), pp. 1552 - 1559.
Additional Information:
• This article was published in the journal Polymer [ c© El-sevier Ltd.] and the definitive version is available at:http://dx.doi.org/10.1016/j.polymer.2014.02.005
Metadata Record: https://dspace.lboro.ac.uk/2134/26697
Version: Accepted for publication
Publisher: c© Elsevier
Rights: This work is made available according to the conditions of the Cre-ative Commons Attribution-NonCommercial-NoDerivatives 4.0 International(CC BY-NC-ND 4.0) licence. Full details of this licence are available at:https://creativecommons.org/licenses/by-nc-nd/4.0/
Please cite the published version.

1
Relaxation Dynamics and Cold Crystallization of Poly(pentamethylene
terephthalate) as Revealed by Dielectric Spectroscopy
M. Soccioa*
, A. Nogalesa, I. Martín-Fabiani
a, N. Lotti
b, A. Munari
b, T.A. Ezquerra
a*
a Instituto de Estructura de la Materia, IEM-CSIC, Serrano 119, Madrid 28006, Spain
bDipartimento di Ingegneria Civile, Chimica, Ambientale e dei Materiali, Universita di
Bologna, Via Terracini 28, Bologna 40131, Italy
Abstract
The relaxation dynamics of poly(pentamethylene terephthalate) has been investigated
by means of dielectric spectroscopy. The sub-glass dynamics is characterized by the
existence of a bimodal β process whose faster and slower components have been
assigned to the relaxation of the bond between the ester oxygen and the aliphatic carbon
and to the link between the aromatic ring carbon and the ester carbon, respectively. By
comparison with other closely related aromatic polyesters it is shown that the faster
component strongly depends on the amount of methylene groups while the slower one is
not considerably affected by the nature of the glycol subunit. The changes in the
process associated to the segmental relaxation during cold crystallization reveal the
formation of a rigid amorphous phase fraction. Combination of dielectric experiments
with X-ray scattering ones suggests that during cold crystallization PPT crystal lamellae
tend to fill the space homogeneously.
Keywords: Poly(pentamethylene terephthalate); Dielectric Spectroscopy; Dynamics;
Cold Crystallization
* Corresponding authors. Instituto de Estructura de la Materia, IEM-CSIC, Serrano 119,
Madrid 28006, Spain.
Tel. (0034) 915616800 - 942412
E-mail addresses: [email protected] (M. Soccio), [email protected] (T.A.
Ezquerra).

2
1. Introduction
Poly(pentamethylene terephthalate) (PPT) is a semicrystalline aromatic polyester, not
yet industrially available, belonging to the same family of other more studied
terephthalic polyesters such as poly(ethylene terephthalate) PET, poly(trimethylene
terephthalate) PTT and poly(butylene terephthalate) PBT1. Taking into account the
outstanding properties of these polymers, PPT could be also a promising engineering
thermoplastic material. An interesting difference with respect to the best known
terephthalic polyesters, is its lower glass transition temperature, Tg, below room
temperature. This can make semicrystalline PPT to have lower strength and rigidity
leading, among others, to a better impact resistance at room temperature and above. It is
well established that the final properties of semicrystalline polymers directly depend on
the structure, the morphology, and the relaxation dynamics of the material.
Crystallographic studies on PET have shown that it crystallizes with the chain in a fully
extended conformation while PTT, PBT and PPT crystallize with the chain contracted2.
Crystallographic data on higher members of the series from poly(hepta methylene
terphthalate) until poly( deca-methylene terephthalate)3 indicates that while the odd
members are contracted, the even members are extended. Although several works
related to the crystallization and morphology of PPT have been published2, 4-6
less
attention has been devoted to the study of the relaxation dynamics of PPT. Dielectric
spectroscopy (DS) is a technique especially suited to investigate the dynamics in
polymers. The segmental mobility is revealed in DS experiments by the relaxation
while the β relaxation is associated to the local dynamics7-10
. In this respect it is
noteworthy to remark the influence of the crystalline phase on the segmental dynamics
of the amorphous regions in semicrystalline polymers. Most commonly, during polymer
crystallization, the segmental relaxation ( process) becomes less intense, broader, and
slower as compared with that of the analogous amorphous polymer10-15
. By monitoring
these changes during crystallization, one can extract both dynamical and structural
information on the amorphous fraction hardly attainable by other techniques. Generally
the semicrystalline state of most crystallizable polymers cannot be simply described by
means of a two-phase model consisting of crystalline and amorphous phases.
Consequently, a third phase, referred to as “rigid-amorphous phase” (RAP) has to be
considered16, 17
. The RAP can be defined as that portion of material that even though
non-crystalline is not able to relax at the same rate as the mobile amorphous fraction.
DS measurements have evidenced the existence of a rigid amorphous phase in different

3
polymers including PET11, 18
, PTT19, 20
and PBT17
. Moreover, simultaneous DS and X-
ray diffraction experiments during isothermal crystallization close above Tg (cold
crystallization) support that while PET exhibits an heterogeneous distribution of
crystalline lamellar stacks11
, PTT shows and homogeneous filling of lamellar crystals20
.
Considering that PBT is not suitable for these studies since cannot be obtained
amorphous at room temperature then, it is clear that a detailed study of PPT can be of
interest as a complement of the previous data in order to get a better description of the
interrelation between structure and dynamics in aromatic polyesters. This work presents
experimental results on the relaxation behavior of PPT as revealed by dielectric
spectroscopy in order to provide information on both local and segmental dynamics in
this aromatic polyester. Moreover isothermal cold crystallization, has been studied both
by dielectric spectroscopy and wide-angle X-ray scattering (WAXS), to shed light on
the structure-dynamics relationships of PPT and compare these with other
semicrystalline aromatic polyesters.
2. Experimental part
2.1. Samples.
Poly(pentamethylene terephthalate) (PPT) was synthesized according to the two-stage
polycondensation procedure21
, starting from 1-5 pentanediol (PD) and
dimethylterephthalate (DMT) with a molar ratio PD/DMT=1.7/1, employing titanium
tetrabutoxide as catalyst (about 0.2 g of Ti(OBu)4/kg of polymer). The synthesis was
carried out in a 200 mL stirred glass reactor, with a thermostatic silicon oil bath;
temperature and torque were continuously recorded during the polymerization. In the
first stage, under pure argon flow, the temperature was raised to 230 ºC and maintained
there until more than 90% of the theoretical amount of methanol was distilled off (about
2 h). In the second stage, the pressure was reduced to facilitate the removal of the glycol
in excess and the temperature was raised to 250 ºC and maintained there until a torque
constant value was measured. The chemical structure, presented in Figure 1, was
corroborated by means of 1H-NMR spectroscopy (Varian INOVA 400 MHz
instrument). The chemical shift assignments (, ppm) are the following: 8.16 (4Ha), 4.43
(4Hb), 1.95 (4H
c), 1.65 (2H
d) (see Figure 1). The polymer was obtained with a
molecular weight Mn = 54000 g/mol and a polydispersity D = 2.2. The as prepared
polymer is semicrystalline with a calorimetric glass transition temperature (Tg) of 16 ºC
and a melting temperature (Tm) of 129 ºC.

4
Figure 1. Chemical structure of the repetitive unit of poly(pentamethylene terephthalate).
Labels indicate the atoms giving rise to 1H-NMR chemical shift signals.
PPT amorphous films can be prepared as follows: after vacuum drying at 25 °C for 24
h, the powders originated from the synthesis were melt pressed at 160 °C for 4 min and
subsequently quenched using iced water and kept below the calorimetric Tg (16 ºC) to
avoid the crystallization process. In that way polymer amorphous films of about 250 μm
thick were obtained.
2.2. Broadband Dielectric Spectroscopy (DS). Complex dielectric permittivity
measurements (ε* = ε′ − iε″) were performed over a 10−1
< F/Hz < 106 frequency range
in a temperature range of −150 °C < T < +125 °C. A Novocontrol system integrating an
ALPHA dielectric interface was employed. The temperature was controlled by means of
a nitrogen gas jet (QUATRO from Novocontrol) with a temperature error of ±0.1º C
during every single sweep in frequency. PPT films were sandwiched between the two
metallic electrodes of the spectrometer. Due to the low glass temperature of PPT no
gold evaporated/sputtered electrodes were used in order to avoid crystallization induced
by the deposition. In order to characterize the influence of crystallization in both local
and segmental relaxation two different types of DS experiments were performed. In the
first one, PPT amorphous film was isothermally crystallized inside the Novocontrol
spectrometer, at 30 ºC, with a time interval between dielectric measurements of 10 min.
At this temperature the process appears well centred within the frequency range. In
the second type of experiment, firstly the sample was cooled down to -85ºC at 5º C/min
and a dielectric measurement was performed. At this low temperature the β relaxation
can be well characterized and the crystallization process is in standby because the
temperature is well below Tg. Subsequently, the sample was heated up to T=30 ºC > Tg
in order to perform another frequency sweep, and held at this temperature for a
controlled period. This procedure was repeated several times until crystallization was
estimated to stabilize. Every single sweep in frequency lasted 2 min. For the
crystallization experiments with DS the samples was melt pressed between two metallic
a a
a a
b b c c d

5
electrodes using Kapton© spacers in order to keep the thickness of the sample to a fix
value22
.
2.3. X-ray Scattering (WAXS). Wide-angle X-ray scattering measurements as a
function of time during isothermal crystallization at 30 ºC were performed by means of
a Nanostar equipment from Bruker using Ni-filtered Cu K wavelength (λ = 1.542 Å).
The experiment was performed in transmission geometry. The sample to detector
distance was set to 10 cm. The crystallinity index (Xc) was calculated as the ratio
between the integrated area below the deconvoluted crystalline peaks to the total
experimental scattered integral intensity23, 24
. The contribution of the amorphous halo
was taken from the initial pattern (crystallization time tc=0).
3. Results and discussion.
3.1. Dielectric spectroscopy of initially amorphous PPT
Figure 2 shows the dielectric loss values as a function of temperature and frequency for
initially amorphous PPT. The relaxation processes appear as maxima in ε versus
frequency whose frequency of maximum loss moves toward higher values as
temperature increases. Below the glass transition temperature, a broad maximum of the
dielectric loss, labelled as β process, appears. At temperatures above the Tg a strong
increase in ε values, labelled as process, is observed. Slightly above Tg the
relaxation undergoes a sudden decrease in ε. This effect is typical of a polymer that
crystallizes at T > Tg during the dielectric scan20
. Therefore, during the dielectric run of
the initially amorphous polymer we can distinguish two relaxation processes. The
first one related to the sample before crystallization () and a second one related to the
polymer after crystallization ().

6
Figure 2. Dielectric loss values (ε) as a function of temperature and frequency for initially
amorphous PPT.
3.1.1. The β relaxation of amorphous PPT
The β relaxation process observed below the Tg as a broad maximum in Figure 2 looks
very similar to those observed in other aromatic polyesters10, 19, 20
. Accordingly, it can
be related to the local chain dynamics. Figure 3 shows, for three given temperatures, the
β relaxation of amorphous PPT. Close inspection of the β relaxation reveals that it is
rather broad and clearly composed of two processes, designated as β2 and β1 in order of
increasing frequency. The slowest β process (β2) shows smaller intensity as compare to
the β1 one.
Figure 3. Isothermal ε data of initially amorphous PPT, at different temperatures. Continuous
lines represent best fits according to CC equation, dashed lines show the separated contribution
of the different relaxation processes.
0,0
0,1
0,2
0,3
0,4
0,5
-10
12
34
56
-100 -50 0 50 100
''
log 10[F
/Hz]
T (ºC)
b
10-1
100
101
102
103
104
105
106
0,000
0,005
0,010
0,015
0,020
10-1
100
101
102
103
104
105
106
10-1
100
101
102
103
104
105
106
0,000
0,005
0,010
0,015
0,020-75ºC-85ºC
''
F (Hz)
-95ºC
F (Hz)
b2
b2
b2
b1b
1
F (Hz)
b1

7
The dielectric relaxations can be described in general in terms of the Havriliak−Negami
(HN) equation25
:
* 0
1c
bi
(1)
which describes the dependence of the complex dielectric permittivity, *, with the
angular frequency . Here ε0 and ε∞ are the relaxed (ω = 0) and unrelaxed (ω = ∞)
dielectric constant values, τ is the central relaxation time of the relaxation time
distribution function, and b and c (0 < b, c < 1) are shape parameters which describe the
symmetric and the asymmetric broadening of the relaxation time distribution function,
respectively9, 25
. The average relaxation time (max) value of the distribution can be
calculated as follows9:
𝜏𝑚𝑎𝑥 =1
2𝜋𝐹𝑚𝑎𝑥= 𝜏𝐻𝑁 [𝑠𝑖𝑛
𝑏𝜋
2+2𝑐]
−1
𝑏[𝑠𝑖𝑛
𝑏𝑐𝜋
2+2𝑐]
1
𝑏 (2)
Where Fmax is the frequency at which the maximum in dielectric loss appears, and HN is
the central relaxation time of eq.1. For the temperature region of the β relaxation, below
Tg, a satisfactory description of the experimental data can be achieved by assuming an
sum of two process (eq.1) with symmetric shapes (c=1). In this case eq.1 is referred to
as Cole−Cole (CC) equation9. The dotted lines in Figure 3 correspond to the
contribution of the different β1 and β2 processes described by two independent CC-
processes. The continuous line is the total fit considering the additive contribution of
both processes.
Figure 4 shows the τmax as a function of the reciprocal temperature for the β relaxation
processes. In this representation both β components follow an Arrhenius behaviour as
expected for sub-glass relaxation processes7.

8
Figure 4. Logarithm of the average relaxation time as a function of the reciprocal temperature
for amorphous PPT, for the local processes β1 and β2, and for the segmental relaxation .
Continuous lines correspond to best fits to Arrhenius (β relaxations) and VFT equations ( relaxation).
From the slope of the τmax it is possible to obtain the activation energy, Ea. The Ea
calculated for the β1 and β2 processes are 32 kJ mol-1
and 47 kJ mol-1
, respectively. The
β relaxation in aromatic polyesters has been investigated in detail by molecular
dynamics simulation26
. The multimodal shape of the β relaxation in aromatic polyesters
has been proposed to be a contribution of the three conformationally flexible bonds of
the monomer, namely, the aromatic ring carbon to ester carbon bond (CA-C), the ester
ether oxygen to aliphatic carbon bond (O-C) and the aliphatic carbon-carbon bond (C-
C). By modelling the conformational transition rates of these bonds it was reported that
the O-C bond should relax faster than the C-C one and both faster than the CA-C
bond26
. This latter bond is responsible for the β* relaxation appearing in polyesters
based on 2,6-naphthalenedicarboxylic acid like Poly(ethylene naphthalene-2,6-
dicarboxylate) (PEN)27, 28
or Poly(butylene naphthalene-2,6-dicarboxylate) (PBN)29
. In
our case for PPT, the experimental dielectric data for the βrelaxation can be
experimentally described by two components, β1 and β2. On the basis of the activation
energy and on the previous discussion26, 28
, the molecular origin of the faster mode of
the β relaxation (β1) can be associated with the relaxation of the O-C bond of the diol
subunit. It is worth to mention that due to the small dipole moment of the C-C bond, its
relaxation is not likely to be detected by DS. Actually, polyolefins are not inherently

9
dielectrically active and dielectric labelling through appropriate oxidation is needed in
order to perform DS measurements30
. In this respect we can associate the slowest
component (β2) with the relaxation of the aromatic ring carbon to ester carbon bond
(CA-C) although the influence of the C-C bond to the β2 component, if not through its
dipole moment by its conformational motion, should not be discarded. In the present
case for PPT the activation energy values are consistent with the above described
assignment26, 28
. A multimodal shape of the glassy dynamics was already observed in
other terephthalic acid containing polyesters like poly(ethylene terephthalate) PET28
,
poly(trimethylene terephthalate) PTT31
, poly(butylene terephthalate) PBT32
among
others28, 29
. The aromatic polymers mentioned above differ by the number of methylene
groups of the glycol subunit: 2, 3 and 4 for PET, PTT and PBT respectively. Table 1
reports the measured values of the activation energies of the β and β processes for
different aromatic polyesters with varying number of –CH2- groups in their monomer
glycol subunits. For the sake of comparison, the data for poly(neopenthyl terephthalate)
(PNT) were also taken into account31
. PNT has similar chemical structure than that of
PTT but with two methyl groups instead of the two hydrogen atoms in β-position with
respect to the oxygen atom.
Table 1. Activation energies (Ea) of the β relaxations and D and T0 parameters of the
process, for amorphous PPT and other terephthalic acid containing amorphous
polyesters: PET33
, PTT31
, poly(neopenthyl terephthalate) (PNT)31
. Data for
semicrystalline PBT 32
have been included for discussion.
Polymer Number of
-CH2- Ea
β1
kJ/mol
Ea β
kJ/mol
D
T0
K
PET 2 17 48 4.7 308
PTT 3 23 49 5.2 272
PNT 3* - 49 6.2 290
PBT 4 43 62 4.9 276
PPT 5 32 47 6.4 240
*For PNT this number refers to the following chemical structure of the glycolic subunit: -CH2-CX2-CH2-,
where X= -CH3.
As one can see from the data collected in Table 1, PBT presents higher energy values
for the two components of the β process. This is probably due to the semicrystalline
nature of the sample that cannot be quenched in the amorphous phase. As one can see,
two different behaviours can be distinguished. The slower process (β2) presents
essentially similar activation energy values for all the amorphous aromatic polyesters
regardless of the methylene group number. On the contrary, the faster process (β1)
10
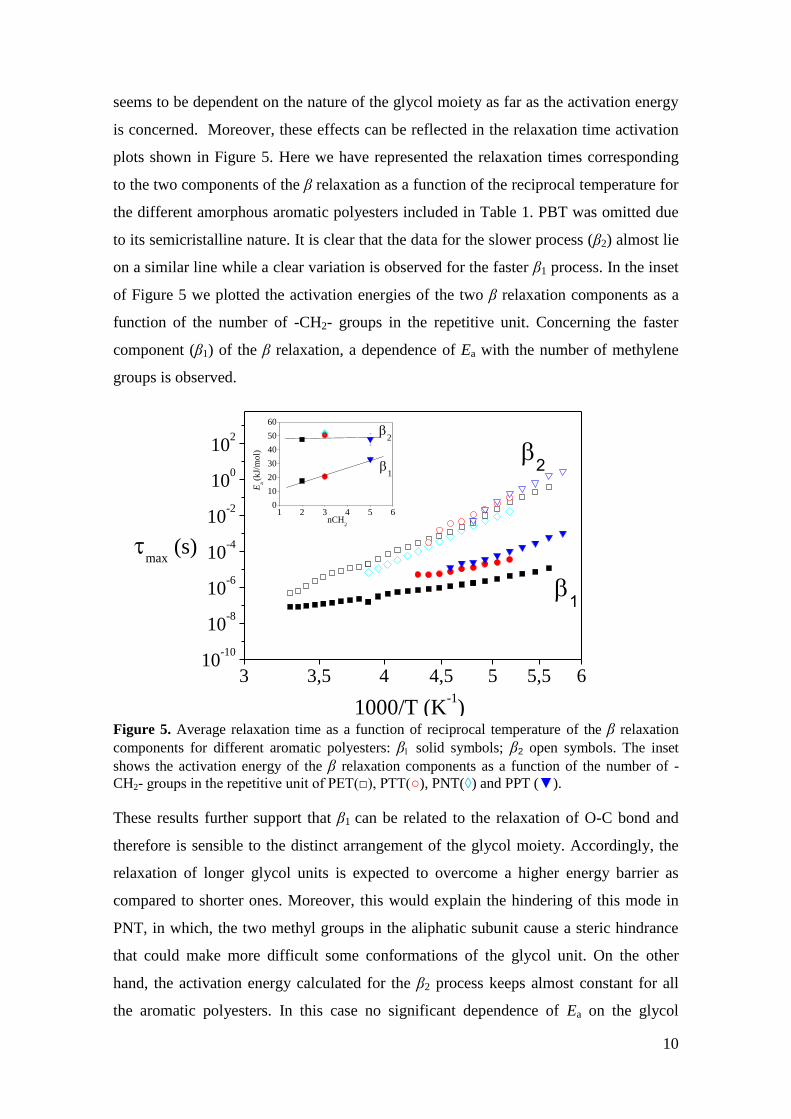
seems to be dependent on the nature of the glycol moiety as far as the activation energy
is concerned. Moreover, these effects can be reflected in the relaxation time activation
plots shown in Figure 5. Here we have represented the relaxation times corresponding
to the two components of the β relaxation as a function of the reciprocal temperature for
the different amorphous aromatic polyesters included in Table 1. PBT was omitted due
to its semicristalline nature. It is clear that the data for the slower process (β2) almost lie
on a similar line while a clear variation is observed for the faster β1 process. In the inset
of Figure 5 we plotted the activation energies of the two β relaxation components as a
function of the number of -CH2- groups in the repetitive unit. Concerning the faster
component (β1) of the β relaxation, a dependence of Ea with the number of methylene
groups is observed.
Figure 5. Average relaxation time as a function of reciprocal temperature of the β relaxation
components for different aromatic polyesters: β solid symbols; β2 open symbols. The inset
shows the activation energy of the β relaxation components as a function of the number of -
CH2- groups in the repetitive unit of PET(□), PTT(○), PNT(◊) and PPT (▼).
These results further support that β1 can be related to the relaxation of O-C bond and
therefore is sensible to the distinct arrangement of the glycol moiety. Accordingly, the
relaxation of longer glycol units is expected to overcome a higher energy barrier as
compared to shorter ones. Moreover, this would explain the hindering of this mode in
PNT, in which, the two methyl groups in the aliphatic subunit cause a steric hindrance
that could make more difficult some conformations of the glycol unit. On the other
hand, the activation energy calculated for the β2 process keeps almost constant for all
the aromatic polyesters. In this case no significant dependence of Ea on the glycol
1 2 3 4 5 60
10
20
30
40
50
60
b1
Ea (k
J/m
ol)
nCH2
b2
3 3,5 4 4,5 5 5,5 610
-10
10-8
10-6
10-4
10-2
100
102
b2
max
(s)
1000/T (K-1)
b1

11
subunit length is observed. This fact supports that the molecular origin of the β2 process
can be related to the aliphatic CA-C bonds, since this bond does not changes by
increasing the amount of -CH2- units.
3.1.2 The relaxation of amorphous PPT
Figure 6 shows the dielectric loss values at 30º C as a function of frequency for the
amorphous PPT.
Figure 6. Dielectric loss values (ε″) as a function of frequency, at T=30º C, for
amorphous PPT. Continuous line represents the best fit according to HN equation,
dashed lines show the separated contribution of the different relaxation processes.
In the explored frequency window one can clearly see the relaxation is accompanied
at higher frequencies by the less intense contribution of the β process and at low
frequencies by a conductivity contribution. For fitting purposes, we consider here the β
process as a single relaxation since at high temperatures the two β components tend to
merge (Figure 3). In this case the dielectric loss spectrum can be described as a
superposition of one CC function, accounting for the influence of the β relaxation, an
HN function related to the relaxation and an additional term -i(σ/(εvacω))s describing
the low frequency conductivity contribution. Here σ is related to the direct current
electrical conductivity, εvac is the dielectric constant of vacuum, and the value of the
coefficient 0 < s < 1 depends on the conduction mechanism9. The dashed lines in Figure
6 correspond to the contribution of the different processes and the continuous line is the
total fit. The relaxation of the amorphous polymer is characterized by a relatively
narrow maximum in ε″ as a function of frequency with a symmetric broadening b= 0.8
and an asymmetric broadening c= 0.5. To estimate the relaxation time of maximum
10-1
100
101
102
103
104
105
106
0,0
0,1
0,2
0,3
0,4
F (Hz)
b''

12
loss, τmax, a strategy based on the Coburn and Boyd procedure10, 27
was followed. The
τmax values are shown in Figure 4 as a function of the reciprocal temperature. The τmax
values of relaxation exhibits a typical Vogel−Fulcher−Tamann (VFT) dependence
described by:
0max 0
0
expDT
T T
(3)
where τ0 is a characteristic time, T0 is the Vogel temperature, and D is the fragility
strength parameter9. This behaviour is characteristic of cooperative segmental motions
appearing above the glass transition temperature. To obtain accurate fits, and in
accordance with Angell’s proposal34
, a value of τ0 of 10−14
s was assumed. Continuous
line in Figure 4 represents the best fit of the experimental τmax values to eq.3 before
crystallization occurs (up to about 20 ºC). The corresponding parameters are collected
in Table 1. For the sake of comparison, data for other aromatic polyesters have been
included in this table. As one can see by comparing the results, the T0 values, which are
directly related to the glass transition temperature, decrease as the aliphatic methylene
groups of the repetitive unit increase. This is expected on the basis of the progressive
increasing of backbone flexibility as the glycol unit length increases. Although PNT
seems to be an exception to this trend, being its T0 value higher than PTT, one must
consider the effect of the two side-chain methyls on the central carbon atom of the
glycol unit. On the other hand, the D parameter, which is inversely proportional to the
fragility35
, increases with the methylene groups number evidencing that the larger is the
aliphatic unit the lower is the fragility of the polymer. Nevertheless, looking at the PBT
results32
, it is evident that crystallinity affects the D and T0 parameters, resulting in an
extra lowering of the chain flexibility (higher T0 values) accompanied by an increasing
of the fragility (lower D values).
3.2. Isothermal cold-crystallization of PPT.
Figure 7 shows the time-resolved dielectric loss spectroscopy spectra collected during
the crystallization experiment at a crystallization temperature of Tc= 30 ºC. The data
have been normalized to the maximum at t=0 s. At this temperature the relaxation is
well resolved and clearly visible within the frequency range and the crystallization rate
is slow enough to allow us to follow the process by DS in real time. As one can see, the
initial amorphous state is characterized by an intense maximum in ε associated to the
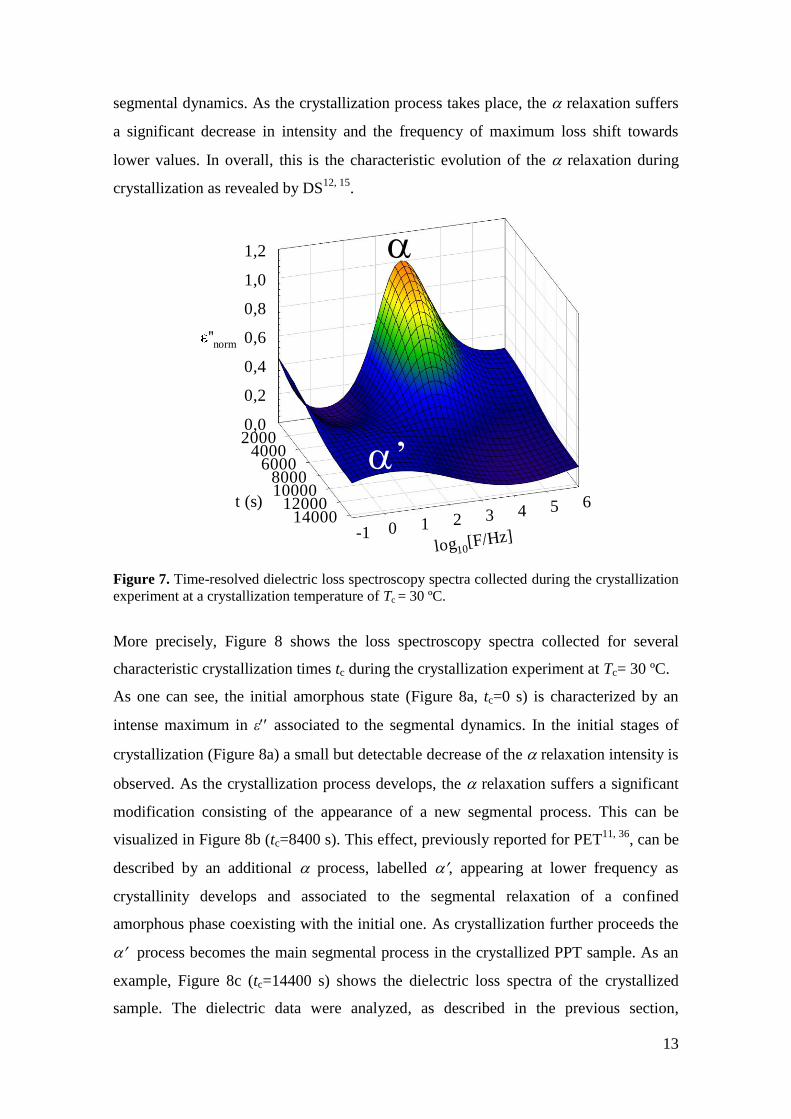
13
segmental dynamics. As the crystallization process takes place, the relaxation suffers
a significant decrease in intensity and the frequency of maximum loss shift towards
lower values. In overall, this is the characteristic evolution of the relaxation during
crystallization as revealed by DS12, 15
.
Figure 7. Time-resolved dielectric loss spectroscopy spectra collected during the crystallization
experiment at a crystallization temperature of Tc = 30 ºC.
More precisely, Figure 8 shows the loss spectroscopy spectra collected for several
characteristic crystallization times tc during the crystallization experiment at Tc= 30 ºC.
As one can see, the initial amorphous state (Figure 8a, tc=0 s) is characterized by an
intense maximum in ε associated to the segmental dynamics. In the initial stages of
crystallization (Figure 8a) a small but detectable decrease of the relaxation intensity is
observed. As the crystallization process develops, the relaxation suffers a significant
modification consisting of the appearance of a new segmental process. This can be
visualized in Figure 8b (tc=8400 s). This effect, previously reported for PET11, 36
, can be
described by an additional process, labelled , appearing at lower frequency as
crystallinity develops and associated to the segmental relaxation of a confined
amorphous phase coexisting with the initial one. As crystallization further proceeds the
process becomes the main segmental process in the crystallized PPT sample. As an
example, Figure 8c (tc=14400 s) shows the dielectric loss spectra of the crystallized
sample. The dielectric data were analyzed, as described in the previous section,
0,0
0,2
0,4
0,6
0,8
1,0
1,2
20004000
6000800010000
1200014000
-1 0 1 2 3 4 5 6
''norm
t (s)
log10[F/Hz]
’

14
considering an additional H−N contribution for the process. The analysis of the
experimental data is based on previous published works. In order the get a meaningful
description of the evolution of the segmental relaxation with time during crystallization
a model fitting for the process has to be assumed. The model fitting is based on the
known fact that the segmental relaxation of semicrystalline polymers is a symmetric
process11, 12, 20
. Accordingly we can assume that since the relaxation is the segmental
motion restricted by the crystals it will have a c=1 value. The broadening parameter of
the process was fixed to the value obtained at the end of the crystallization when the
segmental relaxation mostly consists on the process. Good fits with physical meaning
can be obtained then by letting the relaxation time of the relaxation to slightly vary
around the final value. In this way, estimates of the dielectric strength of the process
in addition those parameters of the process can be obtained during the crystallization
process. The results of the fittings are shown by the dotted lines.
Figure Isothermal ε″ data of initially amorphous PPT, at Tc= 30ºC, for different
crystallization times. Continuous lines represent best fits according to HN equation, dashed
lines show the separated contribution of the different relaxation processes and conductivity.
0,0
0,2
0,4
0,6
0,8
1,0
0,0
0,1
0,2
0,3
0,4
10-1
100
101
102
103
104
105
106
0,0
0,1
0,2
0,3
0,4
0 s
2160 s
b
8400 s
b
'
'' n
orm
c)
b)
14400 s
F (Hz)
b'
a)

15
Figure 9 represents the evolution with crystallization time, at Tc= 30 ºC, of the dielectric
magnitudes. As one can see, as time increases the dielectric strength of the relaxation
decreases whereas the new process () grows up at the expense of the main process.
Crystallization affects not only the intensity of the dielectric relaxation but also its
broadening and position. The b and c parameters decrease and increase, respectively.
This means the relaxation curve becomes broader and more symmetric. As expected,
the b parameter, connected with large scale motions37
is dramatically changed by
crystallization. The relaxation parameters b, c and τmax, have been considered to be
constant during the whole crystallization process.
Figure 9. Havriliak-Negami parameters of the fitting of the relaxation dielectric data of
Figure 7 for the (●) and (○) relaxations as a function of crystallization time: dielectric
strength (ε); shape parameters (b and c); time of maximum loss (log10τmax) and crystallinity
degree (Xc).
0,0
0,5
1,0
0,0
0,5
1,0
-6
-4
-2
0
0 5000 10000 15000
05
101520
0,0
0,5
1,0
'
b
'
c
log
10 m
ax
Xc
t (s)
'
'
'
n
orm

16
In order to study the influence of crystallinity on the β relaxation we used a measuring
protocol in which the crystallization process at Tc= 30 ºC was interrupted at selected
times and the sample was cooled down to T=-85 º C where a DS measurement of the β
relaxation was performed. Subsequently, the sample was heated up again to Tc= 30 ºC
and after the relaxation observation the system was allowed to crystallize for a given
period. By repeating this procedure several times the β relaxation during the
crystallization process was characterized. Figure 10 shows the dielectric loss spectra of
the β relaxation collected by the described procedure for some characteristic
crystallization times during the crystallization experiment at Tc= 30 ºC. The continuous
lines in Figure 10 represent the fits accomplished as previously described. The β
relaxation was considered as formed by the contribution of two symmetric CC-
processes during the whole crystallization process. In the early stage of crystallization,
while the relaxation clearly decreases in intensity with time (Figure 8a), the β
relaxations remain almost unaffected. As crystallization proceeds the main effect is a
net decrease of the dielectric strength. As evidenced by the graphics in Figure 10, the β1
component suffers a more intense decrease in the dielectric strength than the β2 one. In
particular, the ε of the β1 decreases by 18% with respect to its initial value, while the ε
of the β2 just by 12%. This result further supports the assignment of the β1 component to
the O-C bond. In fact, this link is more mobile than the CA-C one and, for this reason,
could be more affected by the ordering of the chain during the development of the
crystalline phase. Therefore, it is reasonable to think that the constriction due to
crystallization may affect more the O-C bond than the CA-C one.
FigureDielectric loss as a function of frequency for the β relaxation measured at T= -85oC
for different crystallization times. Continuous lines represent best fits according to C-C
equation, dashed lines show the separated contribution of the different relaxation processes.
10-1
100
101
102
103
104
105
106
0,00,10,20,30,40,50,60,70,80,91,01,1
0 s
2160 s
14400 s
b2
'' m
ax
F (Hz)
b1

17
The study of the isothermal crystallization of PPT was also carried out by means of
Wide-angle X-ray scattering (WAXS). Figure 11 shows the X-ray diffractograms of the
isothermal cold-crystallized PPT sample. The Bragg maxima correspond to those
reported for phase with a triclinic unit cell of PPT2, 6
. The inset of Figure 11 shows
some diffraction patterns obtained during the isothermal crystallization of PPT at Tc =
30 ºC, for different crystallization times. The times were chosen in order to be
comparable with those of dielectric experiment (Figures 8 and 10). The occurrence of
the crystallization process is revealed in the WAXS patterns by the onset of several
Bragg reflections superimposed to the amorphous halo. An estimation of the fraction of
crystalline phase (Xc) in the sample can be obtained by deconvoluting the Bragg
reflections and the amorphous halo from the total reflections23, 24
.
Similarly to what happens to the β relaxations, until crystallization times equal to 2400
seconds, no appreciable changes in the diffractograms are evidenced. The crystallinity
degree (Xc) evolves with time in the characteristic sigmoidal shape represented in Figure
9 (bottom).
Figure 11. WAXS pattern of semicrystalline (Xc=20.8) PPT obtained by isothermal
treatment at T= 30ºC. The inset shows the WAXS diffracted intensity for PPT during
the isothermal crystallization (Tc = 30 ºC) at different crystallization times: 0s; 2400 s
and 14400 s (from bottom to top).
Figure 12 represents for PPT the dependence of the total dielectric strength of
relaxation (ε+ε) and β process (εβ1+εβ2), normalized with respect to their initial
value, as a function of the crystallinity degree evaluated by WAXS (Xc).
5 10 15 20 25 30 35
(010)
(012)
Inte
nsi
ty (
A.U
.)
2
(012)
5 10 15 20
Inte
nsi
ty (
A. U
.)
2

18
Figure 12. Normalized dielectric strength as a function of Xc for PPT ●. Data for PET (□)
and PTT (○) are included for comparison20
. ∆𝜀𝛼𝑛𝑜𝑟𝑚= ε+ε (top panel) and ∆𝜀𝛽
𝑛𝑜𝑟𝑚=
εβ1+εβ2 (bottom panel). The dashed lines are a guide for the eye.
The dielectric strength of both and b relaxation decreases linearly with Xc. However
the slope for the relaxation is significantly higher than that for the β one. In a first
approach, the dielectric strength is related to the amount of mobile amorphous phase
while crystallinity relates to the amount of material included in the crystals. The results
for the β relaxation show a linear dependence with the crystallinity degree (Figure 12b).
This fact indicates that the material incorporated into the crystalline phase is rather
effectively arrested in its local dynamics while the whole amorphous phase can locally
relax through the β process. The same effect has been previously reported for PET10
. As
observed in Figure 12a, the decreases of ∆𝜀𝛼𝑛𝑜𝑟𝑚 with Xc departs from the slope -1
which would be expected for a simple amorphous/crystal two phase model. This effect
can be interpreted as an indication that, during isothermal crystallization, the
immobilized polymer segments are not only those included in the crystals. On the
contrary, there should be a significant fraction of non-relaxing and non-crystallized
segments. As mentioned before, a common structural feature of polymers with a
medium degree of crystallinity is the existence of a fraction of amorphous material,
referred to as a rigid amorphous phase (RAP), which cannot relax at the same rate as the
0,0
0,2
0,4
0,6
0,8
1,0
three-phase model
norm
two-phase model
0,0 0,2 0,4 0,6 0,8 1,00,0
0,2
0,4
0,6
0,8
1,0
norm
b
Xc
a)
b)

19
main amorphous phase16, 17
. Moreover, the dielectric strength for PPT decreases
lineally with Xc with the same slope for the whole range suggesting that the rate of
reduction of relaxing species is almost constant during crystallization. This behaviour is
similar to that found for PTT20
. However, similar studies on PET have shown that the
dependence of ∆𝜀𝛼𝑛𝑜𝑟𝑚 with Xc changes the slope drastically from values lower than -1 to
values close to -120
. Recently a similar behaviour has been reported for poly(lactide)38
.
For the sake of comparison the results for two other terephthalic acid containing
polyesters, PET11
and PTT20
have been included in Figure 12a. In order to explain this
effect it was proposed that cold crystallization of PET proceeds by filling the space with
a heterogeneous distribution of stacks of lamellae separated by liquid pockets11
. In this
case, the RAP is mostly located in the inter-lamellar amorphous regions, being the
material in the liquid pockets (inter-lamellar stacks amorphous regions) the main
relaxing species giving rise to the dielectric segmental relaxation. In this view, the
initial strong decrease of ∆𝜀𝛼𝑛𝑜𝑟𝑚 with Xc can be associated to the immobilization of PET
segments in the intra-lamellar stacks amorphous regions while the second weaker
dependence can be associated to the formation of secondary lamellar stacks in the liquid
pockets11
. This scenario was also proposed for poly(butylene isophthalate)39
. For PTT,
and PPT the reduction of ∆𝜀𝛼𝑛𝑜𝑟𝑚 with Xc is weaker than in the previous cases and
exhibits a single regime. For PTT this effect has been interpreted considering a
homogeneous filling of the space by uniformly separated crystalline lamellae rendering
to an absence of liquid pockets. In this case the RAP should be associated to the
crystalline-amorphous interface rather than to the whole inter-lamellar amorphous
regions20
. Morphological40
and dielectric20
studies on PTT indeed suggested a quite
homogeneous crystal lamellae filling. For PPT the scenario is clearly closer to that of
PTT rather than to that of PET. This suggests for PPT a rather homogeneous filling of
the space by uniformly separated crystalline lamellae. Morphological studies on cold
and melt crystallized PPT reported on the formation of large and homogeneous
spherulites as for the PTT case41
. For polyesters of the type n-glycol terephthalate
(nGT) crystal structures determination have shown that 2GT (PET) crystallizes with the
chain within the unit cell in a fully extended conformation while 3GT(PTT), 4GT(PBT)
and 5GT(PPT) all crystallize with the chain contracted2. In our case we can propose that
data shown in Figure 12a indicate that these conformational differences of the crystals
may affect the homogeneity of the lamellar crystal distribution.

20
Conclusions
To sum up, the sub-glass dynamics of PPT as revealed by dielectric spectroscopy, is
characterized by the existence of two processes, β1 and β2, which have been assigned to
the relaxation of the bond between the ester oxygen and the aliphatic carbon of the
glycol subunit, and to the bond between the aromatic ring carbon to the ester carbon,
respectively. The comparison with the sub-glass dynamics of other closely related
aromatic polyesters like PET and PTT, evidenced that the faster component β1 strongly
depends on the amount of methylene groups of the monomer, β2 is not considerably
affected by the nature of the glycol subunit. During cold crystallization, the dielectric
strength of β relaxation linearly decreases indicating that the material incorporated into
the crystalline phase is rather effectively arrested in its local dynamics. The relaxation
suffers a significant modification consisting of the appearance of a new segmental
process () associated to the segmental relaxation of a confined amorphous phase
coexisting with the initial one. The evolution of the process suggest that for PPT the
crystal lamellar stacks are homogeneously distributed, lacking of broad amorphous
domains, liquid pockets, as observed for other similar polyesters.
Acknowledgments
Financial support by MAT2008-03232, MAT2011-23455, and MAT2012-33517 from
MINECO is gratefully acknowledged. M.S. thanks CSIC and the Fondo Social Europeo
(FSE) for cofinancing the JAE-Doc contract.
References
1. J. Schultz and J. Wu, edited by S. Fakirov (Wilwy-VCH Verlach, Weinheim,
2002), Vol. 1, pp. 551-573.
2. I. H. Hall, M. G. Pass and N. N. Rammo, Journal of Polymer Science Part B-
Polymer Physics 16 (8), 1409-1418 (1978).
3. I. Goodman, Angewandte Chemie-International Edition 74 (16), 606-& (1962).
4. L. W. Pi, E. M. Woo and H. L. Liu, Journal of Polymer Science Part B-Polymer
Physics 42 (23), 4421-4432 (2004).
5. P. L. Wu and E. M. Woo, Journal of Polymer Science Part B-Polymer Physics
42 (7), 1265-1274 (2004).
6. I. H. Hall and N. N. Rammo, Journal of Polymer Science Part B-Polymer
Physics 16 (12), 2189-2214 (1978).
7. McCrum N.G., Read B.E. and W. G., Anelastic and Dielectric Effects in
Polymeric Solids. (Wiley, London, 1967).
8. G. R. Strobl, The Physics of Polymers. ( Springer, Berlin, Germany, 2003).
9. F. Kremer and A. Schonhals, (Springer Verlag, Heidelberg, Germany, 2002).
10. J. C. Coburn and R. H. Boyd, Macromolecules 19 (8), 2238-2245 (1986).

21
11. C. Alvarez, I. Sics, A. Nogales, Z. Denchev, S. S. Funari and T. A. Ezquerra,
Polymer 45 (11), 3953-3959 (2004).
12. T. A. Ezquerra, J. Majszczyk, F. J. Baltacalleja, E. Lopezcabarcos, K. H.
Gardner and B. S. Hsiao, Physical Review B 50 (9), 6023-6031 (1994).
13. M. Soccio, A. Nogales, N. Lotti, A. Munari and T. A. Ezquerra, Physical
Review Letters 98 (3) (2007).
14. M. Soccio, A. Nogales, N. Lotti, A. Munari and T. A. Ezquerra, Polymer 48
(16), 4742-4750 (2007).
15. A. R. Bras, P. Malik, M. Dionisio and J. F. Mano, Macromolecules 41 (17),
6419-6430 (2008).
16. P. T. Huo and P. Cebe, Macromolecules 25 (2), 902-909 (1992).
17. M. Pyda, E. Nowak-Pyda, J. Mays and B. Wunderlich, Journal of Polymer
Science Part B-Polymer Physics 42 (23), 4401-4411 (2004).
18. J. Dobbertin, A. Hensel and C. Schick, Journal of Thermal Analysis 47 (4),
1027-1040 (1996).
19. S. Kalakkunnath and D. S. Kalika, Polymer 47 (20), 7085-7094 (2006).
20. A. Sanz, A. Nogales, T. A. Ezquerra, M. Soccio, A. Munari and N. Lotti,
Macromolecules 43 (2), 671-679 (2010).
21. M. Soccio, N. Lotti, L. Finelli, M. Gazzano and A. Munari, Journal of Polymer
Science Part B-Polymer Physics 46 (2), 170-181 (2008).
22. I. Šics, T. A. Ezquerra, A. Nogales, F. J. Balta-Calleja, M. Kalniņš and V.
Tupureina, Biomacromolecules 2 (2), 581-587 (2001).
23. D. J. Blundell and B. N. Osborn, Polymer 24 (8), 953-958 (1983).
24. Z. Denchev, A. Nogales, T. A. Ezquerra, J. Fernandes-Nascimento and F. J.
Balta-Calleja, Journal of Polymer Science Part B-Polymer Physics 38 (9), 1167-1182
(2000).
25. Havriliak.S and S. Negami, Polymer 8 (4), 161-& (1967).
26. S. U. Boyd and R. H. Boyd, Macromolecules 34 (20), 7219-7229 (2001).
27. A. Nogales, Z. Denchev, I. Sics and T. A. Ezquerra, Macromolecules 33 (25),
9367-9375 (2000).
28. S. P. Bravard and R. H. Boyd, Macromolecules 36 (3), 741-748 (2003).
29. M. Soccio, A. Nogales, M. C. Garcia-Gutierrez, N. Lotti, A. Munari and T. A.
Ezquerra, Macromolecules 41 (7), 2651-2655 (2008).
30. C. R. Ashcraft and R. H. Boyd, Journal of Polymer Science Part B-Polymer
Physics 14 (12), 2153-2193 (1976).
31. M. Soccio, A. Nogales, T. A. Ezquerra, N. Lotti and A. Munari,
Macromolecules 45 (1), 180-188 (2012).
32. A. Sanz, A. Nogales, N. Lotti, A. Munari and T. A. Ezquerra, Journal of Non-
Crystalline Solids 353 (41-43), 3989-3995 (2007).
33. A. Nogales, A. Sanz and T. A. Ezquerra, Journal of Non-Crystalline Solids 352
(42-49), 4649-4655 (2006).
34. C. A. Angell, Polymer 38 (26), 6261-6266 (1997).
35. R. Bohmer, K. L. Ngai, C. A. Angell and D. J. Plazek, Journal of Chemical
Physics 99 (5), 4201-4209 (1993).
36. K. Fukao and Y. Miyamoto, Physical Review Letters 79 (23), 4613-4616 (1997).
37. A. Schonhals and E. Schlosser, Colloid and Polymer Science 267 (2), 125-132
(1989).
38. E. Laredo, M. Grimau, A. Bello and D. Wu, European Polymer Journal 49 (12),
4008-4019 (2013).

22
39. A. Sanz, A. Nogales, T. A. Ezquerra, N. Lotti, A. Munari and S. S. Funari,
Polymer 47 (4), 1281-1290 (2006).
40. D. A. Ivanov, G. Bar, M. Dosiere and M. H. J. Koch, Macromolecules 41 (23),
9224-9233 (2008).
41. P. L. Wu, E. M. Woo and H. L. Liu, Journal of Polymer Science Part B-Polymer
Physics 42 (23), 4421-4432 (2004).