investigation of poly(lactic acid)/polyoxy … · i investigation of poly(lactic acid)/polyoxy...
TRANSCRIPT
i
INVESTIGATION OF POLY(LACTIC ACID)/POLYOXY
METHYLENE BLENDS: CRYSTALLIZATION
BEHAVIOR AND HEAT RESISTANCE
By
XIAOJIE GUO
A thesis submitted in partial fulfillment of
the requirements for the degree of
Master of Science in Materials Science and Engineering
WASHINGTON STATE UNIVERSITY
School of Mechanical and Materials Engineering
August 2012
ii
To the Faculty of Washington State University:
The members of the Committee appointed to examine the
thesis of XIAOJIE GUO find it satisfactory and recommend that
it be accepted.
__________________________________
Jinwen Zhang, Ph.D., Chair
__________________________________
Michael P. Wolcott, Ph.D.
__________________________________
Vikram Yadama, Ph.D.
iii
ACKNOWLEDGEMENT
I would like to give my special thanks to committee chair and my advisor, Dr.
Jinwen Zhang, for his constant professional guidance and patience in supervision.
Meanwhile, I am appreciated for the assistance and dedication from committee
member, Drs. Michael P. Wolcott and Vikram Yadama. I would like to express my
gratitude to Dr. Hongzhi Liu, who constantly provided constructive advice and
instructions through my whole experiments. I also feel grateful to the faculty and staff
of the Composite Materials and Engineering Center such as Bob Duncan, Suzanne
Hamada, Janet Duncan and Scott Lewis: without their assistance and support during
the last four years, I won’t able to complete my thesis. Finally, a special sign of
appreciation goes to my parents and husband for their unconditional support to me
while completing my graduate degree.
iv
INVESTIGATION OF POLY(LACTIC ACID)/POLYOXY
METHYLENE BLENDS: CRYSTALLIZATION
BEHAVIOR AND HEAT RESISTANCE
ABSTRACT
By Xiaojie Guo, M.S.
Washington State University
August 2012
Chair. Jinwen Zhang
In this research, poly(lactic acid) (PLA)/polyoxymethylene (POM) was prepared
through melt extrusion. Crystallizations of neat PLA and PLA in the presence of POM
were investigated by differential scanning calorimetry (DSC), polarized optical
microscope and X-ray diffraction (XRD) in detail for a comparative study of the
effects of different fillers on the crystallization and morphology of PLA. The results
suggest that the crystal structure of PLA remained unchanged by the addition of POM,
while the crystallization ability of PLA was enhanced in the presence of POM. The
PLA/POM blends presented higher light transmittance than neat PLA and the
PLA/talc blends, indicating POM was partially miscible with PLA, which was
v
consistent with the FTIR results. Well-defined banded spherulites were found in the
case of PLA/POM blends during isothermal crystallization. The thermodynamic
properties and phase morphology were examined using dynamic mechanical analysis
(DMA), differential scanning calorimetry (DSC) and scanning electron microscopy
(SEM). Heat deflection temperature (HDT) of PLA was improved by incorporating
POM, a highly crystalline polymer with excellent heat resistance. The HDT of neat
PLA was increased nearly 2-fold from 65.5 oC to 133
oC by adding 50 wt% POM.
Multiple-crack structure was observed on the surface of the PLA blends containing
high POM content. Fox equation was used to assess the miscibility of the PLA/POM
blends and showed that the PLA/POM blends were partially miscible, which was
consistent with the FTIR results in which a distinctive characteristic peak around at
1000 cm-1
for PLA/POM blends indicated partially miscible. The toughening effects
of two elastomers on the PLA/POM blend (50/50), i.e. thermoplastic polyurethane
(TPU) and poly(ethylene-glycidyl methacrylate) (EGMA), were investigated in detail
in this study. The experimental results suggested that TPU was more effectively on
toughening the PLA/POM blend than EGMA.
vi
TABLE OF CONTENTS
page
ACKNOWLEDGEMENT ........................................................................................... iii
ABSTRACT .................................................................................................................. iv
LIST OF TABLES ..................................................................................................... viii
LIST OF FIGURES ...................................................................................................... ix
Chapter 1 Introduction ................................................................................................... 1
1.1 Why biobased plastics .............................................................................................. 1
1.2 Development, synthesis and application of PLA ..................................................... 2
1.3 Effects of various nucleating agents on PLA crystallization ................................... 4
1.4 Methods and development of enhancing heat resistance of PLA ............................ 8
1.5 Research objectives .................................................................................................. 9
References .................................................................................................................... 12
Chapter 2 Crystallization and morphology of PLA Blends ......................................... 15
Abstract ........................................................................................................................ 15
2.1 Introduction ............................................................................................................ 16
2.2 Experimental .......................................................................................................... 18
2.3 Results and discussion ........................................................................................... 22
2.4 Conclusions ............................................................................................................ 61
Reference ..................................................................................................................... 63
Chapter 3 Properties and structure of PLA/POM blends with excellent heat resistance
...................................................................................................................................... 66
vii
Abstract ........................................................................................................................ 66
3.1 Introduction ............................................................................................................ 67
3.2 Experimental .......................................................................................................... 69
3.3 Results and discussion ........................................................................................... 73
Chapter 4 Conclusions ................................................................................................. 93
viii
LIST OF TABLES
Page
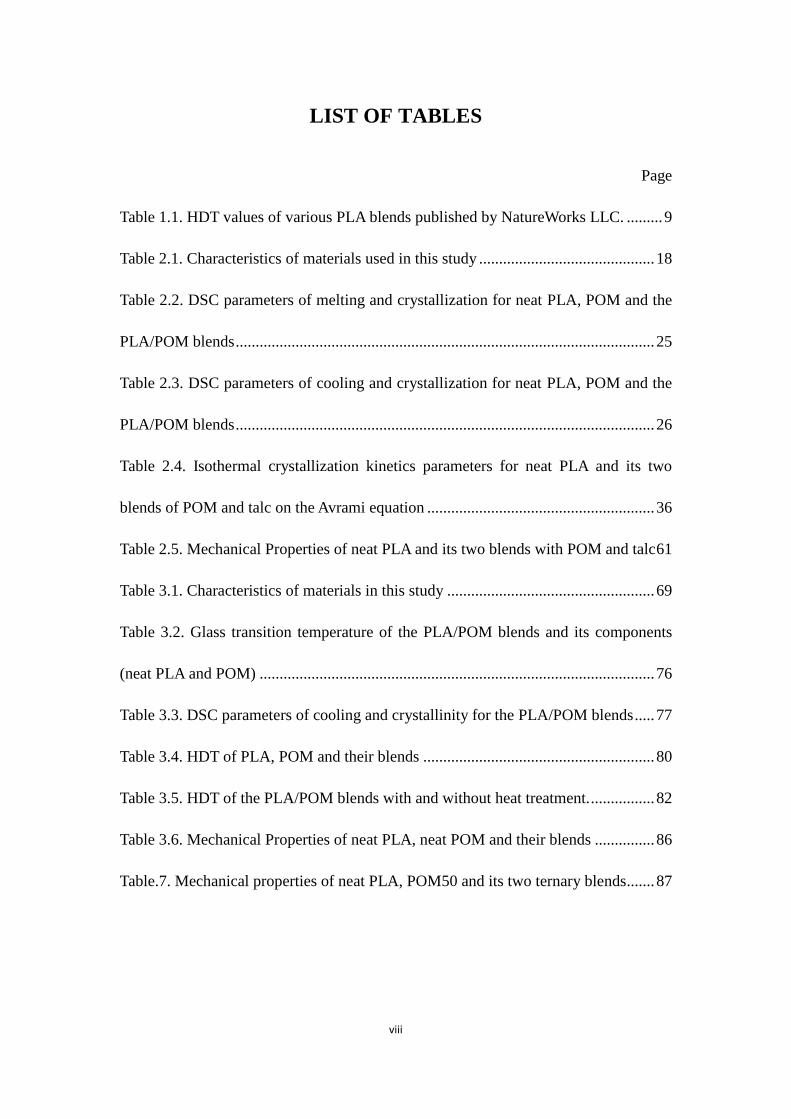
Table 1.1. HDT values of various PLA blends published by NatureWorks LLC. ......... 9
Table 2.1. Characteristics of materials used in this study ............................................ 18
Table 2.2. DSC parameters of melting and crystallization for neat PLA, POM and the
PLA/POM blends ......................................................................................................... 25
Table 2.3. DSC parameters of cooling and crystallization for neat PLA, POM and the
PLA/POM blends ......................................................................................................... 26
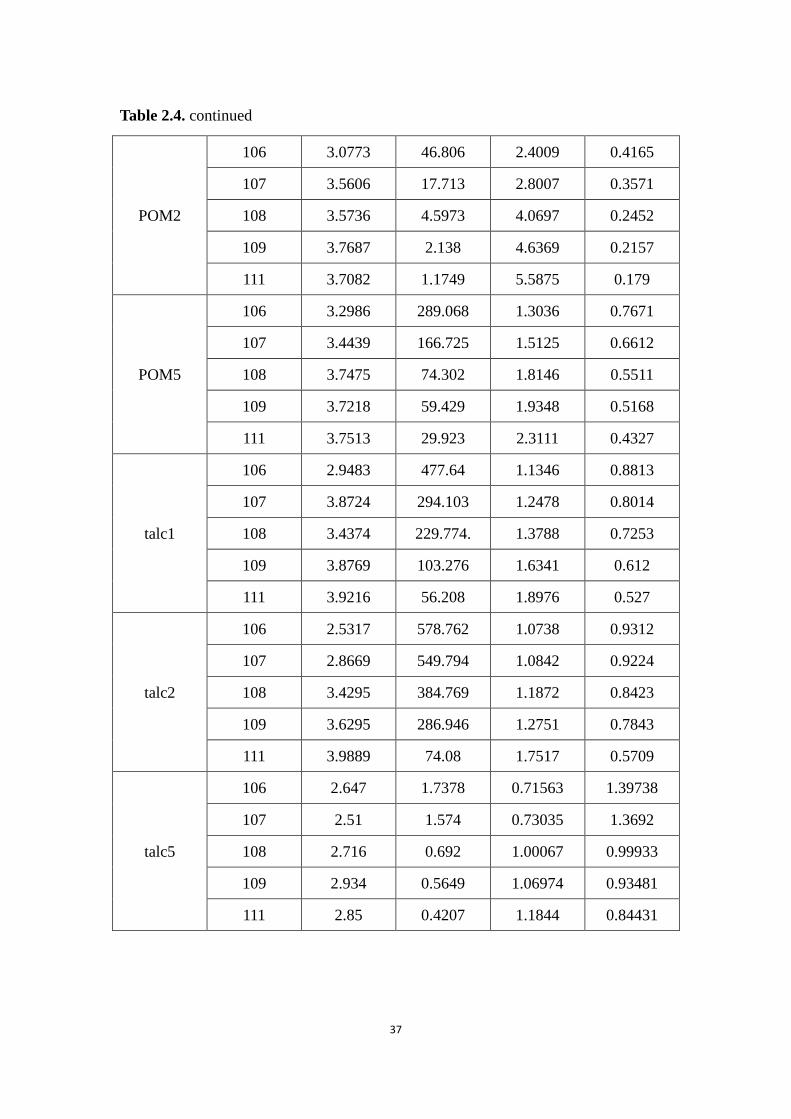
Table 2.4. Isothermal crystallization kinetics parameters for neat PLA and its two
blends of POM and talc on the Avrami equation ......................................................... 36
Table 2.5. Mechanical Properties of neat PLA and its two blends with POM and talc 61
Table 3.1. Characteristics of materials in this study .................................................... 69
Table 3.2. Glass transition temperature of the PLA/POM blends and its components
(neat PLA and POM) ................................................................................................... 76
Table 3.3. DSC parameters of cooling and crystallinity for the PLA/POM blends ..... 77
Table 3.4. HDT of PLA, POM and their blends .......................................................... 80
Table 3.5. HDT of the PLA/POM blends with and without heat treatment. ................ 82
Table 3.6. Mechanical Properties of neat PLA, neat POM and their blends ............... 86
Table.7. Mechanical properties of neat PLA, POM50 and its two ternary blends....... 87
ix
LIST OF FIGURES
page
Figure 1.1. Synthesis of poly(lactic acid) ............................................................... 3
Figure 2.1. First heating DSC curves of neat PLA, POM and the PLA/POM
blends .................................................................................................................... 24
Figure 2.2 First heating DSC curves of neat PLA, POM and the PLA/POM
blends .................................................................................................................... 24
Figure 2.3. First cooling DSC curves of neat PLA, POM and the PLA/POM
blends .................................................................................................................... 25
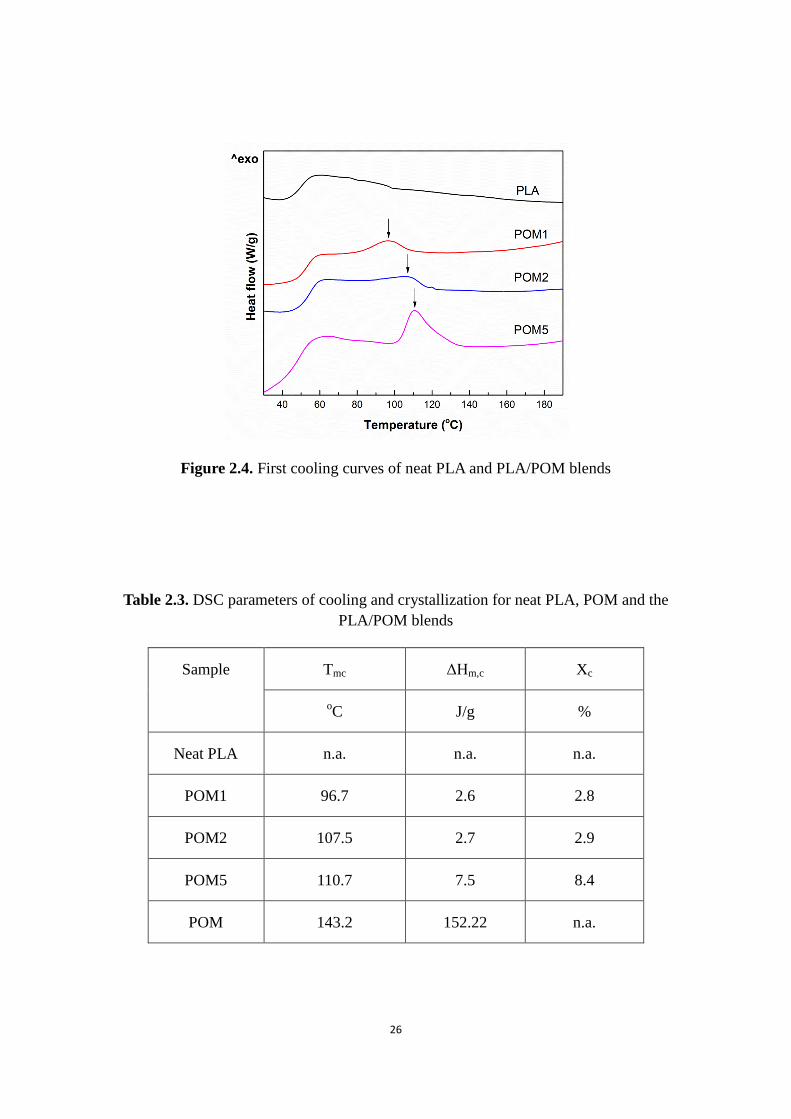
Figure 2.4. First cooling curves of neat PLA and PLA/POM blends ................... 26
Figure 2.5. Second heating of neat PLA, POM and the PLA/POM blends .......... 28
Figure 2.6. Crystallization isotherms of neat PLA, PLA/POM blends and
PLA/talc blends at 108 oC. The curves were vertically shifted for legibility ....... 29
Figure 2.7. Curves of heat flow versus time for the isothermal crystallization of
neat PLA, PLA/POM blends and PLA/talc blends ............................................... 32
Figure 2.8. Curves of relative crystallinity versus time for isothermal
crystallization of neat PLA, PLA/POM blends and PLA/talc blends ................... 34
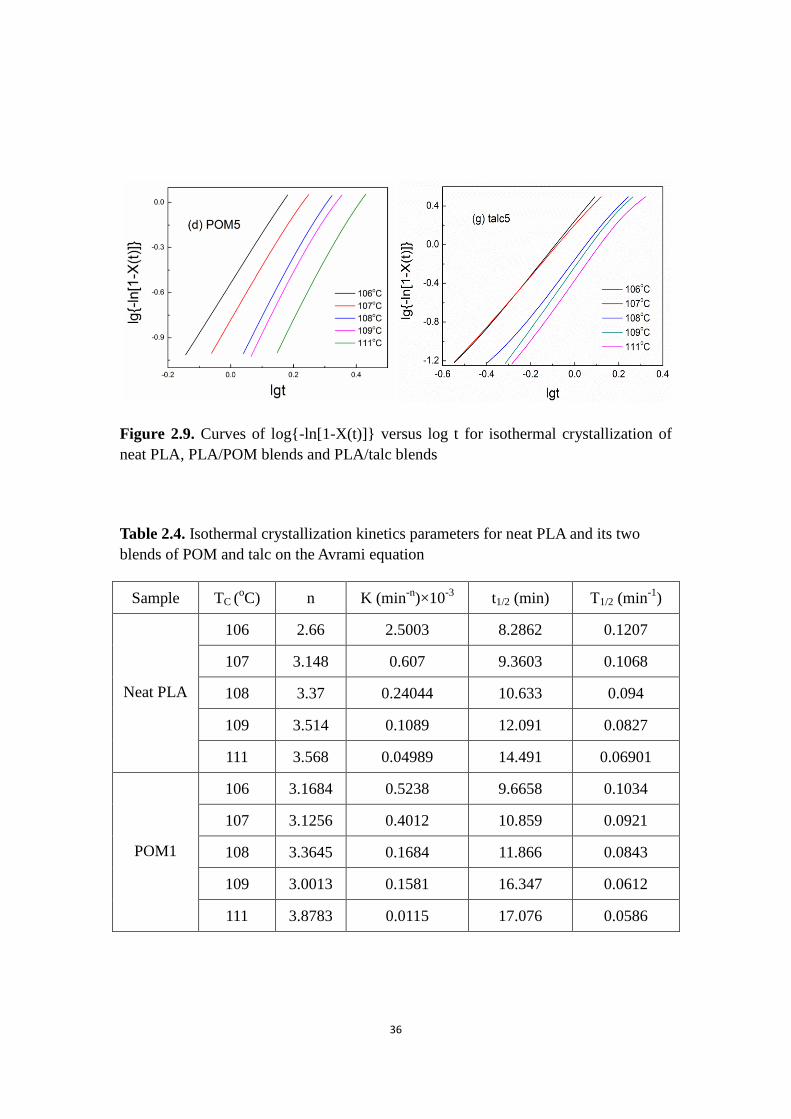
Figure 2.9. Curves of log{-ln[1-X(t)]} versus log t for isothermal crystallization
of neat PLA, PLA/POM blends and PLA/talc blends........................................... 36
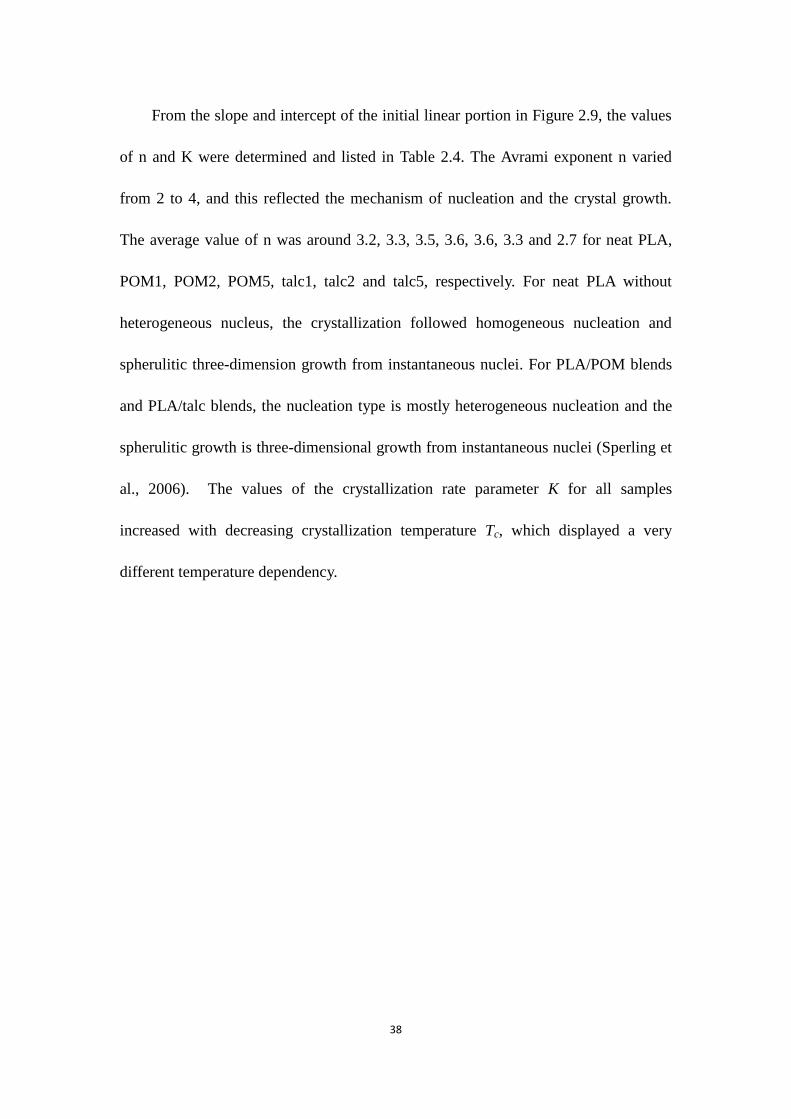
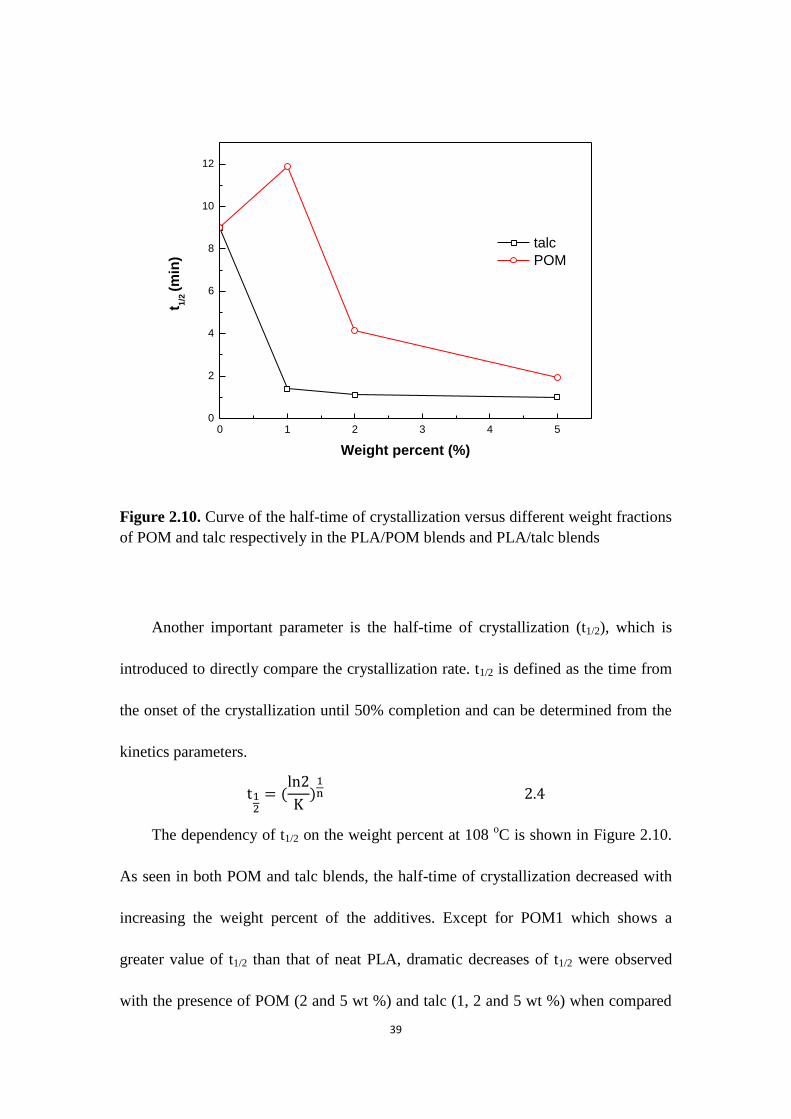
Figure 2.10. Curve of the half-time of crystallization versus different weight
fractions of POM and talc respectively in the PLA/POM blends ......................... 39
Figure 2.11. Curve of the half-time of crystallization versus different
x
crystallization temperatures of neat PLA and its two blends with POM and talc . 40
Figure 2.12. Curves of heat flow versus temperature for nonisothermal
crystallization of PLA/POM=95/5 at different cooling rates ................................ 42
Figure 2.13. Curves of relative crystallization versus (a) crystallization
temperature and (b) time for nonisothermal crystallization of PLA/POM=95/5 .. 43
Figure 2.14. Dependency of the melt-crystallization peak temperature on the
cooling rate (R) for nonisothermal crystallization of PLA/POM=95/5 ................ 44
Figure 2.15. Polarized optical micrographs of neat PLA, neat POM, PLA/POM
blends and PLA/talc blends isothermally crystallized at 130 oC .......................... 46
Figure 2.16. Crystalline growth of neat PLA during isothermal crystallization at
130 oC, the corresponding crystallization time is given in the graphs .................. 48
Figure 2.17. Crystalline growth of PLA/POM blends (PLA/POM=95/5) during
isothermal crystallization at 130 oC, the corresponding crystallization time is
given in the graphs ................................................................................................ 49
Figure 2.18. Polarized optical micrographs of the PLA/POM blends with vatious
POM content:(a) 5; (b) 10; (c) 20; (d) 25; (e) 35; (f) 50 wt% .............................. 51
Figure 2.19. Photographs of neat PLA and PLA blends with POM and talc on a
background paper for demonstrating their transparency ...................................... 52
Figure 2.20. UV-vis transmittance spectra of neat PLA, neat POM, PLA/POM
blends and PLA/talc blends .................................................................................. 53
Figure 2.21. XRD patterns of neat POM, neat PLA and the PLA/POM blends, all
film samples were isothermally hold at 120 oC for 45 min .................................. 55
xi
Figure 2.22. XRD patterns of neat PLA and its two blends with POM and talc, all
films samples were quenched from the melt ......................................................... 57
Figure 2.23. FTIR spectra in the wavenumber range of 700-1600 cm-1 of neat
POM, neat PLA and PLA/POM blends ................................................................ 57
Figure 2.24. Deconvolution curve of neat POM in the wavenumber range
900-1050 cm-1
....................................................................................................... 58
Figure 2.25. Cryo-fractured SEM images of blends: (a) neat PLA, (b) POM1, (c)
POM2 and (d) POM5 ............................................................................................ 60
Figure 3.1. Dynamic mechanical properties of the PLA/POM blends: (a) strorage
modulus, (b) loss modulus and (c) tan δ ............................................................... 74
Figure 3.2. First cooling DSC curves of the PLA/POM blends ........................... 77
Figure 3.3. Dynamic mechanical properties of the PLA/POM lends ................... 79
Figure 3.4. HDT of the PLA/POM blends ............................................................ 79
Figure 3.5. Dynamic mechanical properties of the PLA/POM blends with and
without heat treatment........................................................................................... 81
Figure 3.6. FTIR spectra in the wavenumber range of 700-1600 cm-1
of neat POM,
neat PLA and PLA/POM blends ........................................................................... 83
Figure 3.7. Cryo-fractured SEM images of the PLA/POM blends: (a) neat PLA,
(b) neat POM, (c) POM5, (d) POM10, (e) POM25 and (f) POM50..................... 85
Figure 3.8. Impact strength of ternary blends versus elastomer content .............. 88
1
Chapter 1 Introduction
1.1 Why biobased plastics
Conventional synthetic petroleum-based polymers such as polyethylene (PE),
polypropylene (PP), polystyrene (PS), poly(ethylene terephthalate) (PET), and
polyvinyl chloride (PVC) used to shared a major share of commodity plastics (Amass
et al., 1998). The non-degradability, non-renewability, emissions of greenhouse gases
and the diminishment of petroleum resources during production and incineration of
conventional synthetic petroleum-based polymers have restricted the versatility and
applications of these polymers. Concerns over the environmental issues and
sustainability of conventional petroleum-based synthetic polymer materials have
motivated a paradigm shift in developing biobased polymers, blends and composites
from renewable resources as potential substitutes to replace the conventional
petroleum-based polymers for the commodity applications. Abundant renewable
resources such as agricultural feedstocks used for the production of biomaterials can
facilitate the transition from nonrenewable sources to renewable bioresources
(Ragauskas et al., 2006). The global market for bioplastics was 291 thousand tons in
year 2007 and is estimated to touch 2.1 million tons by year 2017 (Bioplastics -
Global Market Overview, New York, Jan. 4, 2012;). The bio-based polymers such as
poly(lactic acid) (PLA), polyhydroxyalkanoates (PHAs) and biobased
poly(trimethylene terephthalate) (PTT) are examples of biologically derived materials
2
developed for mainstream applications (Carole et al., 2004; Kurian et al., 2005).
1.2 Development, synthesis and application of PLA
Among a few commercially biobased polymer plastics, PLA is the most
promising sustainable alternative to petroleum-based plastics and has been
investigated more than the rest. The primary interest in these biobased polymers is
due to the production of their precursor, lactic acid from renewable resources such as
sugarcane, sugar beet and corn starch (Drumright et al., 2000). The method of
polymerizing lactic acid was first introduced by Carothers in 1932 (Holten et al 1971),
but the breakthrough in pilot production of PLA was achieved by Cargill in 1992.
Currently NatureWorks with the PLA production capacity of 280 thousand tons
annually, is the single largest producer of PLA. PLA has been used in biomedical
applications such as tissue implants and surgical suture since several decades ago
while its use as a commercial commodity thermoplastic was obtained only in the last
two decades. Wal-Mart, the world’s largest retailer started using PLA in packaging
applications in the beginning of November 2005. The current applications of PLA are
in packaging, textile, and electronics (Bhardwaj et al 2007).
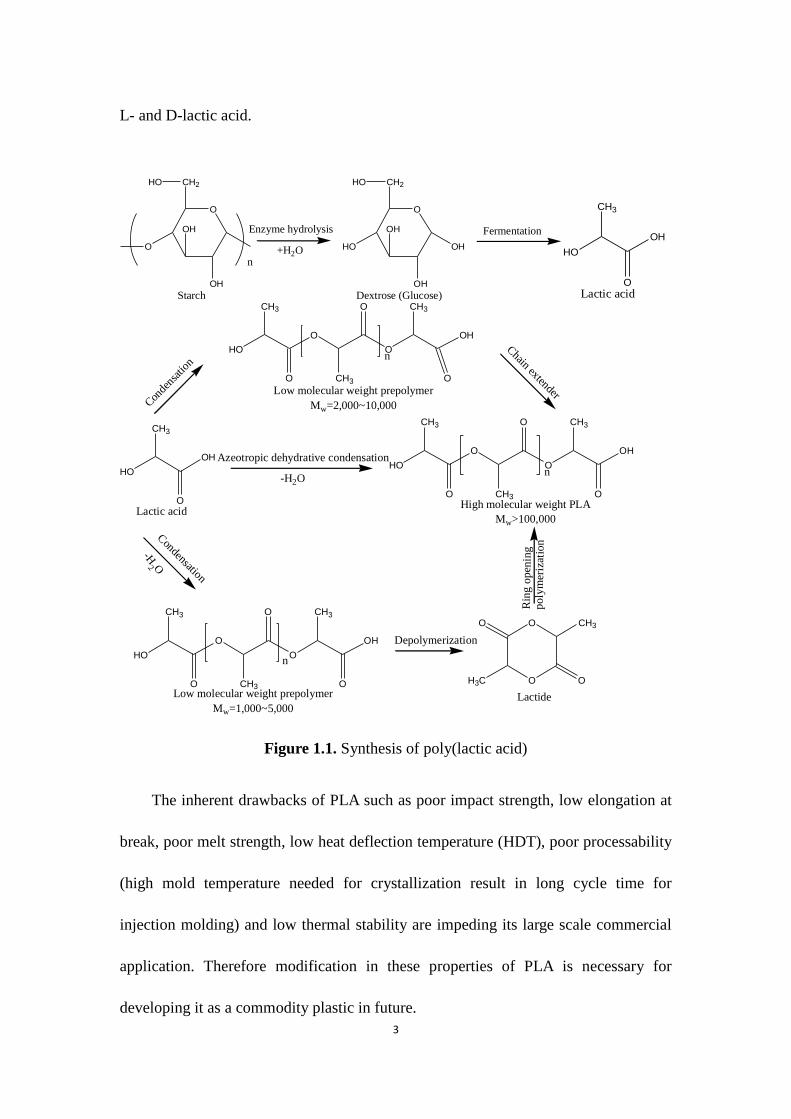
PLA is synthesized either through polycondensation of lactic acid (2-hydroxy
propionic acid) or ring-opening polymerization of lactide (the dimer of lactic acids),
as illustrated in Figure 1.1. The monomer, lactic acid, can be produced via bacterial
fermentation using enzyme thinned cornstarch or sugar directly as carbon sources.
Lactic acid is one of the simplest chiral molecules and exists as the two stereo isomers:
3
L- and D-lactic acid.
O
CH2HO
OH
O
OH
O
OHHO
CH2HO
OH
OH
n
Starch
Enzyme hydrolysis
+H2O
Dextrose (Glucose)
Fermentation
HO
CH3
OH
OLactic acid
HO
CH3
OH
O
HO
O
O
OH
CH3
CH3
CH3
O
O
O
OH
O
O
HO
CH3
CH3
CH3
O O
O
HO
O
O
OH
CH3
CH3
CH3
O
O
O
O
O
O
O
CH3
H3C
n
n
n
Con
dens
atio
n
Azeotropic dehydrative condensation
Depolymerization
-H2O
Condensation
Chain extender
-H2 O
Rin
g o
pe n
ing
po
lym
eriz
a tio
n
Lactic acid
Low molecular weight prepolymer
Mw=2,000~10,000
High molecular weight PLA
Mw>100,000
Low molecular weight prepolymer
Mw=1,000~5,000Lactide
Figure 1.1. Synthesis of poly(lactic acid)
The inherent drawbacks of PLA such as poor impact strength, low elongation at
break, poor melt strength, low heat deflection temperature (HDT), poor processability
(high mold temperature needed for crystallization result in long cycle time for
injection molding) and low thermal stability are impeding its large scale commercial
application. Therefore modification in these properties of PLA is necessary for
developing it as a commodity plastic in future.
4
1.3 Effects of various nucleating agents on PLA crystallization
Crystallization behaviors such as crystallization kinetics, crystal structure and
arrangement of crystallites have a profound effect on the physical and mechanical
properties of biodegradable polymers (Maiti et al., 2002; Gagnon et al., 1992; Tang et
al., 2011; Shi et al., 2012); therefore, study of crystallization behaviors of PLA is of
great importance because crystallization influences not only the crystal structure of
PLA but also the final physical and mechanical properties of PLA products.
The crystallinity and crystallization rate of semicrystalline polymers can be
enhanced through the presence of nucleating agent (NA) because the NAs improves
the nuclei generation of these polymers (Kawamoto et al., 2003). Thus, the use of
suitable nucleating agents is believed to be an effective method to resolve the issue
concerning the low crystallization rate of PLA in practical application.
1.3.1 Inorganic nucleating agent
Most of the nucleating agents reported for PLA are inorganic materials, such as
talc, montmorillonite, SiO2, CaCO3, etc. Talc is a widely used nucleating agent. Talc
has been known to nucleate poly(ethylene terephthalate) for a long time. It was shown
that talc nucleates the crystallization of polymers through an epitaxial mechanism
(Haubruge et al., 2003). In the case of PLA, it is shown that the crystallization
half-time can be reduced by more than one order of magnitude to less than 1 min
when 1% talc is added (Ke et al., 2003). Battegazzore et al. reported that the
incorporation of talc in PLA not only accelerated the crystallization rate of PLA but
5
also improved the thermal and mechanical properties of PLA. Moreover, the
crystallization rate increased slightly as the talc content in the PLA/talc blends
increased (Battegazzore et al., 2011). It was indicated that the crystallinity of
PLA/montmorillonite (MMT) nanocomposites increased remarkably at the MMT
loadings higher than 5 wt%, and the crystallization behavior of PLA was altered
significantly in the presence of MMT (Ublekov et al., 2012). Buzarovska stated that
the degree of crystallinity (Xc) of the PLA/TiO2 films was increased with the increase
of TiO2 content (up to 5 wt% of TiO2) (Buzarovska et al., 2012). After blending PLA
with a little amount of nucleating agents of CaCO3, TiO2 and BaSO4, the crystallinity
and crystallization rate of PLA increased. Moreover, nucleating agents BaSO4 and
TiO2 had better effects on the crystallinity than CaCO3 (Liao et al., 2007). Although
inorganic nucleating agents dramatically improve the crystallization rate and
crystallinity of PLA and possess better processability and lower cost, these inorganic
nucleating agents likely decrease the transparency and ultimately the physical
properties of PLA due to their low compatibility with PLA and easy aggregation to
sub-micrometer sizes (Nakajima et al., 2010). In addition, most inorganic fillers are
nondegradable and reduce the degradability of the composites.
1.3.2 Low molecular weight organic compound nucleating agent
Besides inorganic materials, many low molecular weight organic compounds
such as N, N’, N’’-tricyclohexyl-1,3,5-benzenetricarboxylamide (TMC-328),
triphenyl phosphate (TTP) and low molecular weight aliphatic amides can also be
6
used as nucleating agents to accelerate the crystallization process and increase the
crystallinity of PLA (Bai et al., 2011; Xiao et al., 2010; and Xing et al., 2012). Some
low molecular weight biodegradable organic nucleating agents not only enhance the
crystallization behavior of PLA but also retain the degradability of PLA. Nam et al.
(2006) detected that N, N’-Ethylenebis (12-hydroxystearamide) (EBH) which
crystallized at very early stage of PLA crystallization acted as an effective nucleating
agent to improve the crystallization of PLA. As a result, typical tanscrystallites
formed at the interface between PLA and EBH, and the overall crystallization rate was
increased by the addition of EBH. Harris observed that N, N’-ethylenebisstearamide
(EBSA) also improved the crystallization rate of PLA as well as the crystallinity for
both isothermal and nonisothermal crystallization processes (Harris et al., 2008). Xing
conducted a comparison between EBSA and EBH concerning the effect on the
nucleating ability and crystallization kinetics of PLA, finding that EBH showed a
stronger effect than that of EBSA. The hydrogen bond interaction between hydroxyl
groups in EBH and the carbonyl groups in PLA may be responsible for the stronger
nucleating ability of EBH (Xing et al., 2012). However, most low molecular weight
nucleating agents are either not commercially available or more expensive than
inorganic and polymeric nucleating agents.
1.3.3 Polymeric nucleating agent
Polymer blending is an effective way to modify properties of polymers.
Therefore, it is believed that blending with polymers with high crystallinity is a viable
7
method to enhance the crystallization process of semicrystalline polymers. In the case
of PLA, poly(D-lactic acid) (PDLA), poly(butylenes succinate) (PBS),
poly(ε-caprolactone) (PCL), poly(glycolic acid) (PGA), poly(propylene glycol) (PPG),
etc are reported to be effective polymeric nucleating agents for PLA. Blends of
isotactic poly(L-lactic acid) (PLLA) and poly(D-lactic acid) (PDLA) resulted in the
formation of a 1/1 stereocomplex: the stereocomplex had a higher melting
temperature (230 oC) than pure PLLA and crystallized at higher temperature from the
melt (Ikada et al., 1987). These stereocomplex crystallites acted as heterogeneous
nucleation sites for corresponding PLLA crystallization and were more effective than
talc on improving the crystallization of PLLA (Scott et al., 2001). Yokohara et al.
realized that crystallization of PLA is improved by the incorporation of
poly(butylenes succinate) (PBS) even in the molten state, thus PBS acted as a
nucleating agent for PLA and may be responsible for the pronounced cold
crystallization of PLA/PBS blends (Yokohara et al., 2008). The presence of
poly(ε-caprolactone) (PCL) in PLA was noted to accelerate the growth of crystallites
and increase the number of crystallites for the PLA matrix, indicating that PCL is an
effective nucleating agent for PLA crystallization (Lopez et al., 2006). Tsuji et al.
presented that the addition of poly(glycolic acid) (PGA) promoted the overall
crystallization of PLA during both heating and cooling processes and the causation of
the enhanced crystallization is different from that of the PLA stereocomplex (Tsuji et
al., 2008).Besides low molecular weight inorganic and organic compounds and
polymeric nucleating agents, some other novel materials such as carbon nanotubes
8
can be used as nucleating agents to enhance the crystallization of PLA as well (Barrau
et al., 2011).
1.4 Methods and development of enhancing heat resistance of PLA
Although PLA has many advantages such as high tensile strength and modulus,
the disadvantage of low heat deflection temperature (HDT) dramatically limits its
market potential. For example, the molded PLA parts could be deformed during
transportation or under operation because the ambient temperature was higher than
HDT of PLA (about 60 oC). Therefore, improvements in HDT must be done prior to
wide engineering applications. Several efforts have been tried to improve HDT of
PLA. HDT of PLA could be improved through the addition of nucleating agents such
as layered silicate, talc, methacrylate-butadiene-styrene (MBS),
ethylenebishydroxystearamide (EBH), etc. Nucleating agents not only decreased the
crystallization time, but also increased the mechanical properties (Ray et al., 2003, Yu
et al., 2012; Zhang et al., 2012; and Tang et al., 2012). However, low content of
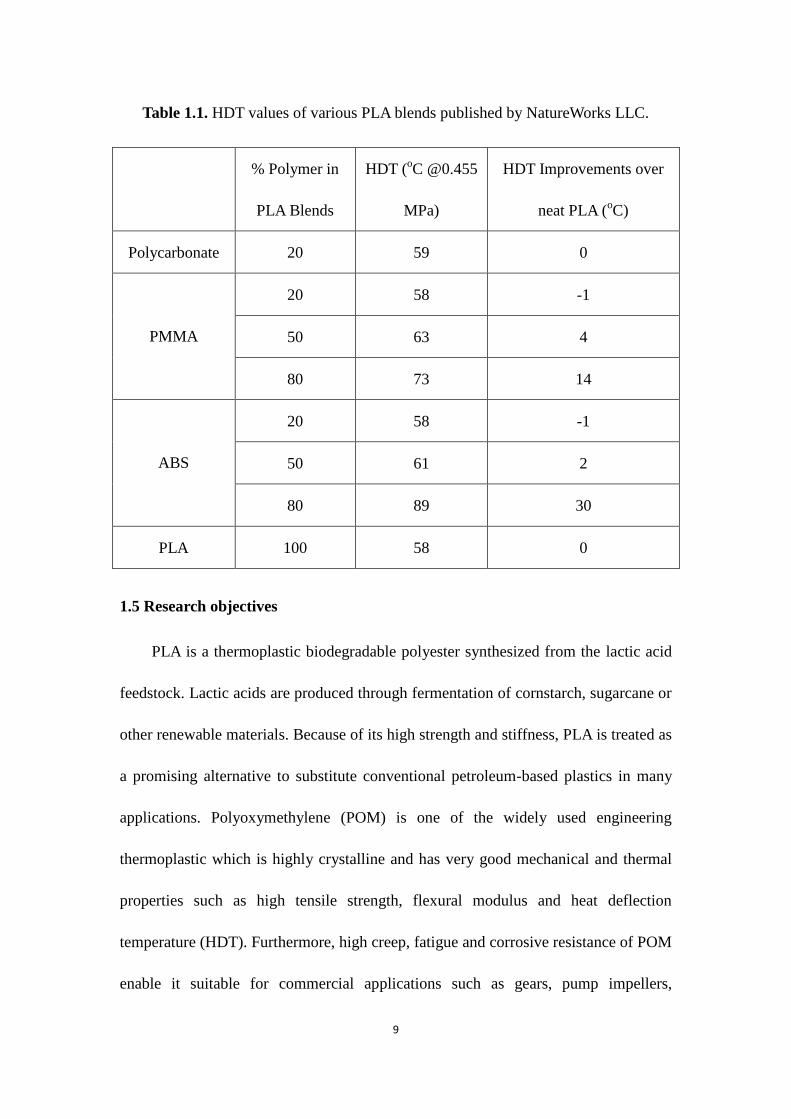
nucleating agent/fillers in PLA did not bring obvious improvements of HDT. As listed
in Table 1.1, adding 50 wt% PMMA only gave 4 oC HDT improvements over the neat
PLA control. To gain 14 oC improvements, 80 wt% PMMA was needed in the blends.
In this circumstance, PLA was no longer the primary component and the commercial
value of PLA blends as biobased materials was compromised (Zhu et al., 2009).
9
Table 1.1. HDT values of various PLA blends published by NatureWorks LLC.
% Polymer in
PLA Blends
HDT (oC @0.455
MPa)
HDT Improvements over
neat PLA (oC)
Polycarbonate 20 59 0
PMMA
20 58 -1
50 63 4
80 73 14
ABS
20 58 -1
50 61 2
80 89 30
PLA 100 58 0
1.5 Research objectives
PLA is a thermoplastic biodegradable polyester synthesized from the lactic acid
feedstock. Lactic acids are produced through fermentation of cornstarch, sugarcane or
other renewable materials. Because of its high strength and stiffness, PLA is treated as
a promising alternative to substitute conventional petroleum-based plastics in many
applications. Polyoxymethylene (POM) is one of the widely used engineering
thermoplastic which is highly crystalline and has very good mechanical and thermal
properties such as high tensile strength, flexural modulus and heat deflection
temperature (HDT). Furthermore, high creep, fatigue and corrosive resistance of POM
enable it suitable for commercial applications such as gears, pump impellers,
10
carburetor bodies, etc. To a certain extent, PLA and POM are complementary in many
aspects, because the good heat resistance and high crystallinity of POM is expected to
enhance the HDT and crystallization behavior for PLA.
The long-term goal of this research is to obtain high performance PLA blends to
successfully substitute conventional petroleum-based plastics in the current
commercial market. Specifically, the overall objective of this study is to develop
PLA/POM blends with enhanced heat resistance and illustrate the structure-property
relationship. In order to achieve the objective of this research, the following two
specific aims are proposed:
Specific aim 1: Investigate the effects of different fillers, talc as an inorganic
nucleating agent and POM as a polymeric nucleating agent, on the crystallization
behavior and crystalline morphology of PLA.
The hypothesis for this specific aim is that talc maybe more effective than POM on
accelerating the crystallization process of PLA. Moreover the crystalline morphology
maybe altered by the presence of POM and talc. Talc alters the spherulites to smaller
size while POM results in well-defined banded spherulites.
Specific aim 2: Investigate the changes of HDT of PLA through the presence of
POM, and the relationship between POM content and HDT.
The hypothesis for this specific aim is that the high content of POM will improve
the HDT of PLA.
11
The research of this thesis is creative and original; Blending PLA with POM
through melt extrusion has not been reported elsewhere in the literature, and using
POM as a nucleating agent to improve crystallization and resulting in higher HDT of
PLA will be introduced for the first time. The expected outcomes of this research are:
(1) Understanding of the influences of adding POM on the crystallization behavior i.e.
crystallization rate and crystalline morphology of PLA. (2) Understanding of the
structure-property relationship of PLA/POM blends. (3) Understanding of the
improvement of HDT of PLA by the presence of POM.
12
References
Amass, W.; Amass, A., “A review of biodegradable polymers: uses, current
developments in the synthesis and characterization of biodegradable polyesters,
blends of biodegradable polymers and recent advances in biodegradation studies.”
Polymer International, (1998) 47 (2): 89-144.
Ragauskas, J.; Williams, C., “The Path Forward for Biofuels and Biomaterials.”
Science, (2006) 311: 484-489.
Bioplastics - Global Market Overview, New York, Jan. 4, 2012; Available from:
http://www.prnewswire.com/news-releases/bioplastics---global
-market-overview-136647193.html
Carole, T.; Pellegrino, J., “Opportunities in the Industrial Biobased Products Industry.”
Applied Biochemistry and Biotechnology, (2004) 115: 871-885.
Kurian, J., “Polymer: Present Status and future Perspectives.” Natural Fibers,
Biopolymers and Future Perspectives, (2005).
Drumright, R.; Gruber, P., “Polylactic Acid Technology.” Advanced Materials, (2000)
12 (23): 1841-1846.
Holten, C., Lactic acid. Properties and chemistry of lactic acid and derivatives, Verlag
Chemie, Germany, (1971)
Bhardwaj, R.; Mohanty, A., “Advances in the Properties of Polylactides Based
Materials: A Review.” Journal of Biobased Materials and Bioenergy, (2007) 1:
191-209.
Haubruge, H.; Daussin, A., “Epitaxial Nucleation of Poly(ethylene terephthalate) by
Talc: Structure at the Lattice and Lamellar Scales.” Macromolecules, (2003) 36:
4452-4456.
Ke, T.; Sun, X., “Melting behavior and crystallization kinetics of starch and
poly(lactic acid) composites.” Journal of Applied Polymer Science, (2003) 89:
1203-1210.
Battegazzore, D.; Bocchini, S., “Crystallization kinetics of poly(lactic acid)-talc
composites.” eXPRESS Polymer Letters, (2011) 5 (10): 849-858.
Ublekov, F.; Badrian J., “Influence of Clay Content on the Melting Behavior and
13
Crystal Structure of Nonisothermal Crystallized Poly(L-lactic acid)/Nanocomposites.”
Journal of Applied Polymer Science, (2012) 124 (2): 1643-1648.
Buzarovska, A.; Grozdanow, A., “Biodegradable Poly(L-lactic acid)/TiO2
Nanocomposites: Thermal Properties and Degradation.” Journal of Applied Polymer
Science, (2012) 123 (4): 2187-2193.
Liao, R.; Yang, B., “Isothermal Cold Crystallization Kinetics of
Polylactide/Nucleating Agents.” Journal of Applied Polymer Science, (2007) 104:
310-317.
Bai, H.; Zhang, W., “Control of Crystal Morphology in Poly(L-lactide) by Adding
Nucleating Agent.” Macromolecules, (2011) 44: 1233-1237.
Xiao, H.; Li., “Isothermal Crystallization Kinetics and Crystal Structure of Poly(lactic
acid): Effect of Triphenyl Phosphate and Talc.” Journal of Applied Polymer Science,
(2010) 118: 3558-3569.
Xing, Q.; Zhang, X., “Low-molecular weight aliphatic amides as nucleating agents for
poly(L-lactic acid): Conformation variation induced crystallization enhancement.”
Polymer, (2012) 53: 2306-2314.
Nam, J.; Okamoto, M., “Morphology and crystallization kinetics in a mixture of
low-molecular weight aliphatic and polylactide.” Polymer, (2006) 47: 1340-1347.
Harris, A.; Lee, E., “Improving mechanical performance of injection molded PLA by
controlling crystallinity.” Journal of Applied Polymer Science, (2008) 107 (4):
2246-2255.
Ikada, Y.; Jamshidi, K., “Stereocomplex formation between enantiomeric
poly(lactides).” Macromolecules, (1987) 20 (4): 904-906.
Scott, C.; Marc, A., “Polylactide Seteocomplex Crystallites as Nucleating Agents for
Isotactic Polylactide.” Journal of Applied Polymer Science: Part B: Polymer Physics,
(2001) 39: 300-313.
Yokohara, T.; Yamaguchi, M., “Structure and properties for biomass-based polyester
blends of PLA and PBS.” European Polymer Journal, (2008) 44: 677-685.
Lopez-Rodriguez, A., “Crystallization, morphology, and mechanical behavior of
polylactide/poly(ε-caprolactone) blends.” Polymer Engineering & Science, (2006) 46
(9): 1299-1308.
Tsuji, H.; Tashiro, K., “Polyglycolide as a Biodegradable Nucleating Agent for
14
Poly(L-lactide).” Macromolecular Materials and Engineering, (2008) 293: 947-951.
Barrau, S.; Vanmansart, C., “Crystallization Behavior of Carbon Nanotube -
Polylactide Nanocomposites.” Macromolecules, (2011) 44 (16): 6496-6502.
Ray, S.; Yamada, K., “New polylactide-layered silicate nanocomposites. 2.
Concurrent improvements of material properties, biodegradability and melt rheology.”
Polymer, (2003) 44: 857-866.
Yu, F.; Liu, T., “Effects of Talc on the Mechanical and Thermal Properties of
Polylactide.” Journal of Applied Polymer Science, (2012) 125 (S2): E99-E109.
Zhang, H.; Liu, N., “Toughening of Polylactide by Melt Blending with Methyl
Methacrylate-Butadiene-Styrene Copolymer.” Journal of Applied Polymer Science,
(2012) 125 (S2): E550-E561.
Tang, Z.; Zhang, C., “The crystallization Behavior and Mechanical Properties of
Polylactic Acid in the Presence of a Crystal Nucleating Agent.” Journal of Applied
Polymer Science, (2012) 125 (2): 1108-1115.
Zhu, S., “PLA property improvement: Improving the practical heat resistance of
Polylactic Acid (PLA).” 2009.
15
Chapter 2 Crystallization and morphology of PLA Blends
Abstract
In this work, crystallizations of neat poly(lactic acid) (PLA) and PLA in the presence
of small portion of polyoxymethylene (POM) were investigated by differential
scanning calorimetry (DSC), polarized optical microscope (POM) and X-ray
diffraction (XRD) in detail for a comparative study of the effects of different fillers on
the morphology and crystallization of PLA. For comparison, PLA crystallization in
the presence of small amount of talc was also studied. Interpretation of the results
suggest that the crystal structure of PLA was changed by the additions of POM and
talc, and the crystallization ability of PLA was enhanced in both cases. Talc was found
to be more efficient than POM in enhancing the crystallization of PLA. The
PLA/POM exhibited higher transmittance than neat PLA and the PLA/talc, indicating
POM was miscible or semi-miscible with PLA. This result was consistent with the
FTIR results. In addition, well-defined banded spherulites were found in the
PLA/POM blends during isothermal crystallization.
Keywords: crystallization kinetics, crystalline morphology, transparency, crystal
structure, miscibility
16
2.1 Introduction
As a biodegradable aliphatic polyester, PLA has attracted increasingly attention
in recent years due to its excellent mechanical properties, biodegradability and
potential renewability. However, there is a critical issue concerning the low
crystallization rate of PLA. Despite the fact that PLA is a semicrystalline polymer,
almost no crystallization proceeds under fast cooling such as a practical molding
condition (Kawamoto et al., 2007). The low crystallization rate of PLA results in poor
heat resistance, processability and productivity (Defosse et al., 2005) and severely
limits the range of application of PLA.
In general, it is known that nucleating agents (NA) enhance the nuclei generation
in semicrystalline polymers during crystallization process and leads to higher
crystallization rate at higher temperature, resulting in increased crystallinity
(Kawamoto et al., 2003; Funamizu et al., 2005). Therefore, the utilization of suitable
nucleating agents is believed to be one of the solutions for the low crystallization rates
of PLA in practical application. Some inorganic compounds such as talc and zinc
phenylphosphonate (PPA-Zn) have been utilized for improving the crystallinity of
PLA. However, if an uniform nano-scale dispersion in the matrix is not achieved,
these inorganic compound, will likely decrease the transparency of PLA due to the
light scattering by the large particles. For this reason, organic crystal nucleators with
good compatibility are preferably used for enhancing the crystallization of PLA. It has
been reported that methylenebis(2,4-di-tert-butylphenyl)phosphate sodium salt
(NA-11) commercialized as nulceator for PP can also enhance crystallization of PLA
17
(Kawamoto et al., 2007). In this study, polyoxymethylene (POM) as a polymeric
nucleating agent was introduced to enhance the crystallization of PLA because the
regular structure (typical helical chain structure with a sequence of gauche C-O bonds)
of POM causes polymers to crystallize easily and to form large spherullites in the
melting processing.
Crystallization behaviors play an important role in affecting the physical and
thermal properties of biodegradable polymers (Maiti et al., 2002; Gagnon et al., 1992;
Tang et al., 2011; Shi et al., 2012); therefore, the crystallization kinetics study is of
great importance because it influences not only the crystalline structure and
morphology of semicrystalline polymers but also the final physical and thermal
properties of biodegradable polymers. The presence of fillers usually has the
following complicated effects on the crystallization of the polymer matrix:
acceleration/retardation of crystallization, changes in the spherulitic morphology, and
modification in the crystal structure in a few cases. The aim of this work is to conduct
a comparative study of the influences, POM (polymeric nucleating agent) and talc
(inorganic nucleating agent), on the crystallization behavior and morphology of PLA
for a better understanding of the crystallization behavior of polymers in polymer
blends.
18
2.2 Experimental
2.2.1 Materials
All the materials used in this study are listed in table 2.1.
Table 2.1. Characteristics of materials used in this study
Materials
(abbreviation)
Grade (supplier) Specifications
Poly(lactic acid)
(PLA)
PLA 2002D
(NatureWorks)
MI(201oC, 2.16kg) = 5~7g/10min
Specific Gravity = 1.24
Polyoxymethylene
(POM)
RTP 800
(RTP Co.)
Specific Gravity = 1.41
talc Magsil 3183A
(RBH Co.)
Specific Gravity = 2.75
All materials in this study were used as received without further purification.
2.2.2 Preparation of neat PLA and PLA blends with POM and talc
Prior to extrusion, pellets of PLA and POM, and talc powder were dried at least 1
day at 85 oC in an oven to remove any moisture present in the sample. The PLA and
the fillers were premixed manually through tumbling in a sealed plastic bag. A
co-rotating twin-screw extruder (Leistritz ZSE-18) equipped with a volumetric feeder
and a pelletizer was used to prepare the PLA/POM blends. The screw diameter and
L/D ratio of the extruder were 17.8 mm and 40, respectively. The screw speed was
19
maintained at 50 rpm for all runs, and the temperature profile of the barrel was (160,
160, 200, 200, 200, 170, 150 and 150 oC) from the first heating zone (next to the
feeding throat) to the die. The extrudate was cooled under water and subsequently
granulated. Blend compositions (in wt%) of the PLA/POM blends were 99/1, 98/2
and 95/5. Neat PLA and the PLA/talc blends (PLA/talc=99/1, 98/2 and 95/5 in wt%)
were prepared under the same conditions. Before injection molding, the blends were
dried at 85 oC for 1 day in a convection oven. Standard tensile (ASTM D638, Type I)
test specimens were prepared using injection molding (Sumitomo SE 50D) at melt
temperature of 190 oC and mold temperature of 40
oC. After injection molding, all
specimens were conditioned at 23 oC and 50% RH for 7 days prior to characterization.
The blends with 1, 2 and 5 wt% of POM are denoted as POM1, POM2 and POM5
hereafter.
2.2.3 Characterization
Differential Scanning Calorimetry (DSC). Crystallization of the PLA/POM blends
were studied using differential scanning calorimeter (Mettler Toledo, DSC 822e).
Sample ca. 5 mg were crimp sealed in 40-μL aluminum pans, each sample was tested
in duplicates. To determine the crystallization and melting temperatures, the samples
were first heated up to 200 oC at 10
oC/min and held isothermally for 5 min to erase
the thermal history, then cooled to 0 oC at 10
oC/min, and finally heated up to 200
oC
at the same rate. The isothermal crystallization was carried out with the same DSC
20
instrument. The samples were first heated up to 200 oC at 10
oC/min and held
isothermally for 5 min to erase the thermal history, then cooled to the predetermined
crystallization temperatures (106, 107, 108, 109 and 111 oC) at the cooling rate of 80
oC/min and held isothermally for 30 or 15 min depending on when the exothermic
peak appeared. For nonisothermal crystallization, the samples were first heated up to
200 oC and held isothermally for 5 min to erase thermal history, then cooled to 25
oC
at different cooling rates of 5, 10, 20, 30 and 40 oC/min. The exotherms of isothermal
and nonisothermal crystallization were recorded for analysis.
Polarized Optical Microscopy. Spherulitic crystal growth and morphology was
observed using a polarized optical microscope (Olympus BX51) equipped with a hot
stage (Linklam TMS 94). Thin film samples were prepared by melting the blends
between microscope cover slips. The samples were first heated up to 200 oC at 50
oC/min and held at 200
oC for 3 min to erase previous thermal history and press the
blends into thin film, then quenched to the designed isothermal crystallization
temperature (130 oC) to observe the spherulitic growth and morphology of the blends
and their components.
UV-Visible Spectrometry (UV-vis). The optical transmittances of neat PLA and its
two blends with POM and talc were measured at wavelength from 200 to 1100 nm
using a UV-vis spectrophotometer (Evolution 300, Thermo Scientific). Transmittance
21
spectra were measured using air as a reference. The sheets used for characterization
were prepared by melting and then quickly quenching into a thickness of ~100 µm
between two steel plates.
Fourier Transform Infrared Spectroscopy (FT-IR). The absorption spectra were
recorded using a Thermo Nicolet Nexus 670 spectrometer (Nicolet, Thermo Scientific)
with a resolution of 4 cm-1
and 32 scans and a Smart iTR (Thermo Scientific) with a
pointed pressure tip and a crystal plate of Ge crystal. The sheets of neat PLA and its
blends with POM used for characterization were prepared by melting and then quickly
quenching to room temperature.
Wide angle X-ray diffraction (WAXD). XRD patterns were recorded using a X-ray
diffractometer (Empyrean, PANalytical). The CuKα radiation (λ = 0.15418 nm)
source was operated at 40 kV and 40 mA. The sheets of neat PLA and its two blends
with POM and talc used for characterization were prepared by melting and then
quickly quenching to room temperature into a thickness of around 100 µm. XRD
patterns were recorded from 5 to 90o at 8
o/min.
Scanning electron microscopy (SEM). Cryo-fractured surfaces of neat PLA and
PLA blends samples were examined using a Quanta 200F field emission scanning
electron microscope (FE-SEM, FEI Co.) at an accelerated voltage of 15 kV. All
specimens were sputter-coated with gold prior to examination.
22
Mechanical test. Tensile tests were conducted on a universal testing machine (Instron
4466) following ASTM D638 (type I specimens). The crosshead speed was 0.2 in/min
(5.08 mm/min) for all the specimens, and the initial strain was measured using a 2 in
(50.8 mm) extensometer. Notched Izod impact tests were performed according to
ASTM D256 using a BPI-0-1 Basic Pendulum Impact tester (Dynisco, MA). Average
value of five replicates were taken for each sample.
2.3 Results and discussion
2.3.1 Crystallization behaviors of neat PLA and PLA blends
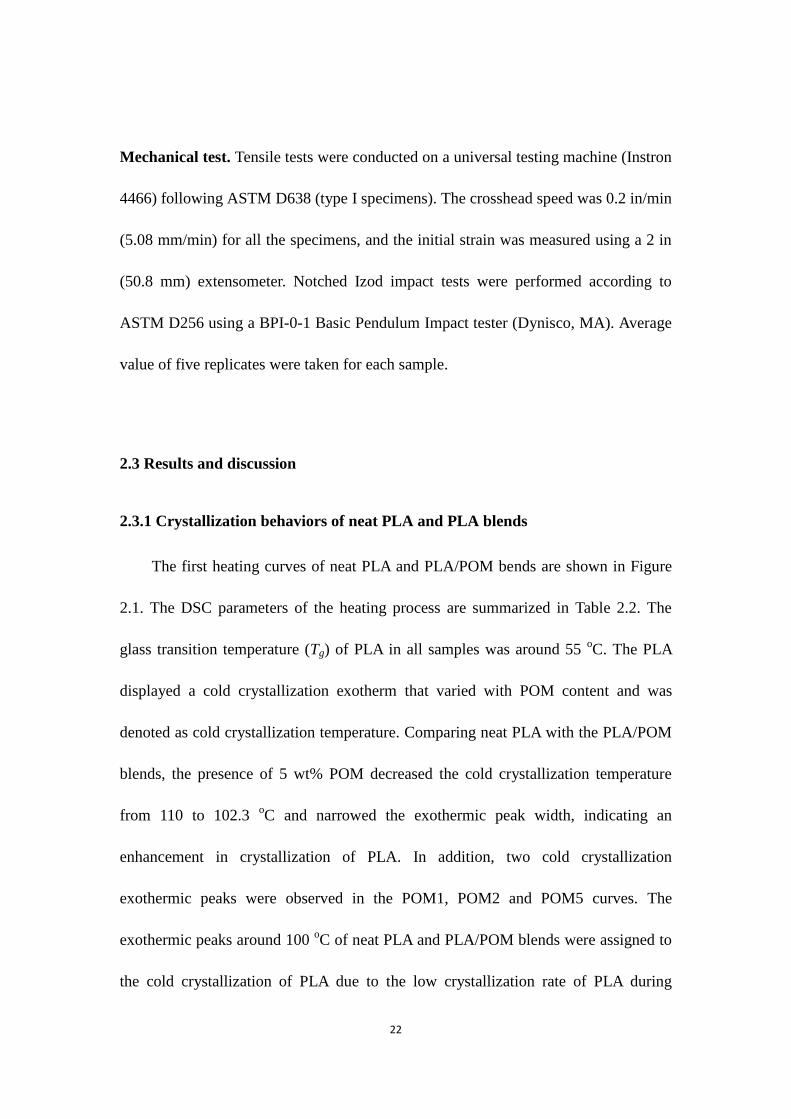
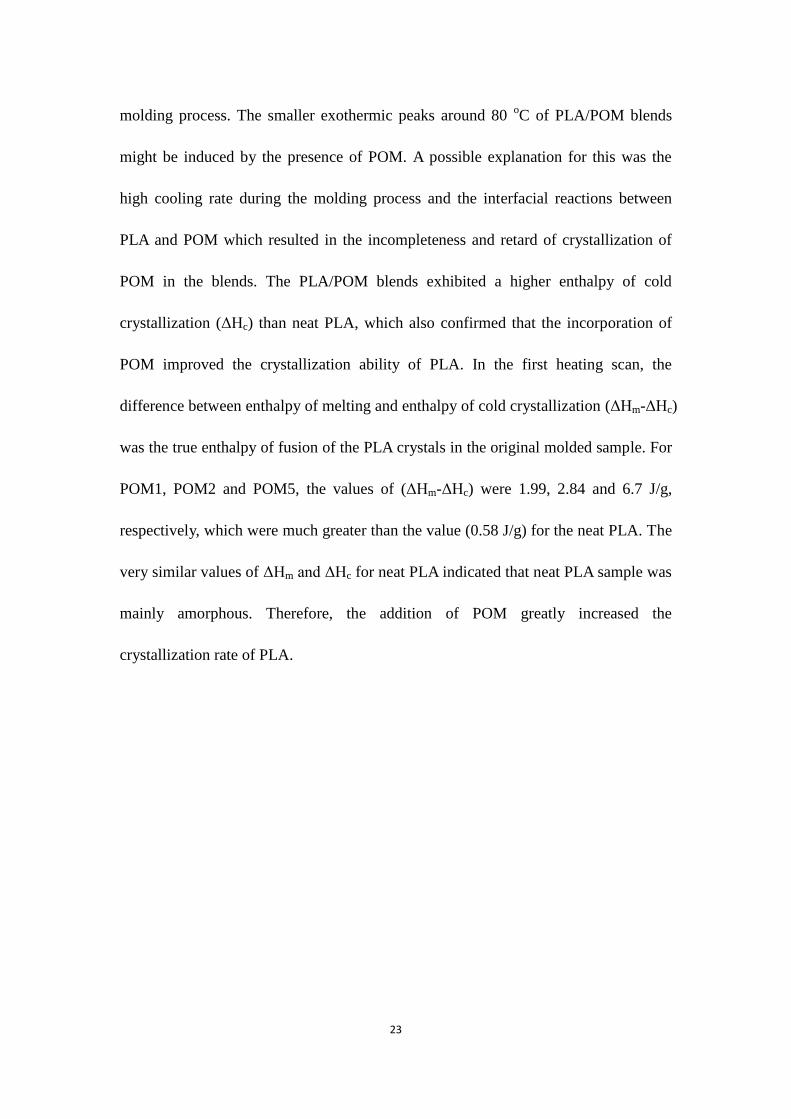
The first heating curves of neat PLA and PLA/POM bends are shown in Figure
2.1. The DSC parameters of the heating process are summarized in Table 2.2. The
glass transition temperature (Tg) of PLA in all samples was around 55 oC. The PLA
displayed a cold crystallization exotherm that varied with POM content and was
denoted as cold crystallization temperature. Comparing neat PLA with the PLA/POM
blends, the presence of 5 wt% POM decreased the cold crystallization temperature
from 110 to 102.3 oC and narrowed the exothermic peak width, indicating an
enhancement in crystallization of PLA. In addition, two cold crystallization
exothermic peaks were observed in the POM1, POM2 and POM5 curves. The
exothermic peaks around 100 oC of neat PLA and PLA/POM blends were assigned to
the cold crystallization of PLA due to the low crystallization rate of PLA during
23
molding process. The smaller exothermic peaks around 80 oC of PLA/POM blends
might be induced by the presence of POM. A possible explanation for this was the
high cooling rate during the molding process and the interfacial reactions between
PLA and POM which resulted in the incompleteness and retard of crystallization of
POM in the blends. The PLA/POM blends exhibited a higher enthalpy of cold
crystallization (ΔHc) than neat PLA, which also confirmed that the incorporation of
POM improved the crystallization ability of PLA. In the first heating scan, the
difference between enthalpy of melting and enthalpy of cold crystallization (ΔHm-ΔHc)
was the true enthalpy of fusion of the PLA crystals in the original molded sample. For
POM1, POM2 and POM5, the values of (ΔHm-ΔHc) were 1.99, 2.84 and 6.7 J/g,
respectively, which were much greater than the value (0.58 J/g) for the neat PLA. The
very similar values of ΔHm and ΔHc for neat PLA indicated that neat PLA sample was
mainly amorphous. Therefore, the addition of POM greatly increased the
crystallization rate of PLA.
24
40 80 120 160 200
He
at
flo
w (
W/g
)
Temperature (oC)
Tg T
m
Tm
^exoneat PLA
POM1
POM2
POM5
Figure 2.1. First heating DSC curves of neat PLA, POM and the PLA/POM blends
40 60 80 100 120 140 160 180 200
He
at
flo
w (
W/g
)
Temperature (oC)
PLA
POM1
POM2POM5
POM
^exo
Figure 2.2 First heating DSC curves of neat PLA, POM and the PLA/POM blends
25
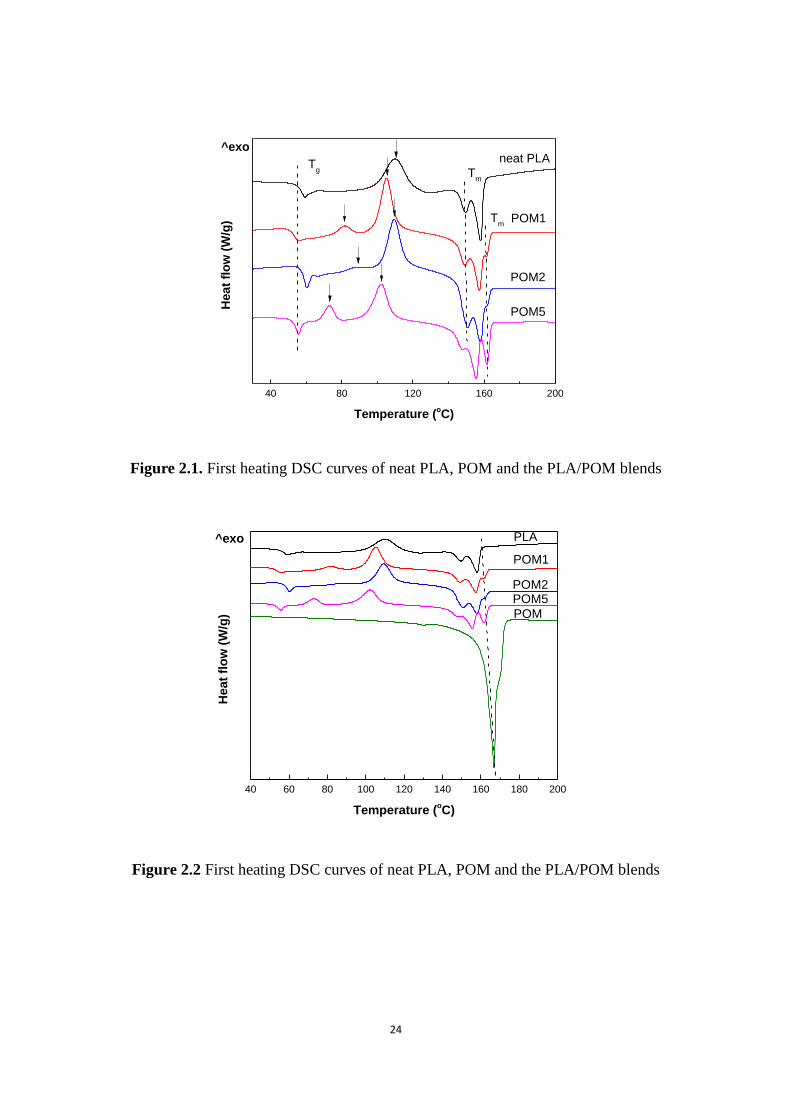
Table 2.2. DSC parameters of melting and crystallization for neat PLA, POM and the
PLA/POM blends
Sample
Tg Tcc ΔHc ΔHm ΔHm-ΔHc
o C
o C J/g J/g J/g
PLA 56.5 n.a. 110 20.83 21.41 0.58
POM1 52.7 81.5 105.2 26.76 28.75 1.99
POM2 57.4 88.5 108.3 26.34 29.18 2.84
POM5 53.4 73 102.3 26.15 32.85 6.7
POM n.a. n.a. n.a. n.a. 144.54 n.a.
40 60 80 100 120 140 160 180
He
at
flo
w (
W/g
)
Temperature (oC)
^exo
PLAPOM1
POM2
POM5
POM
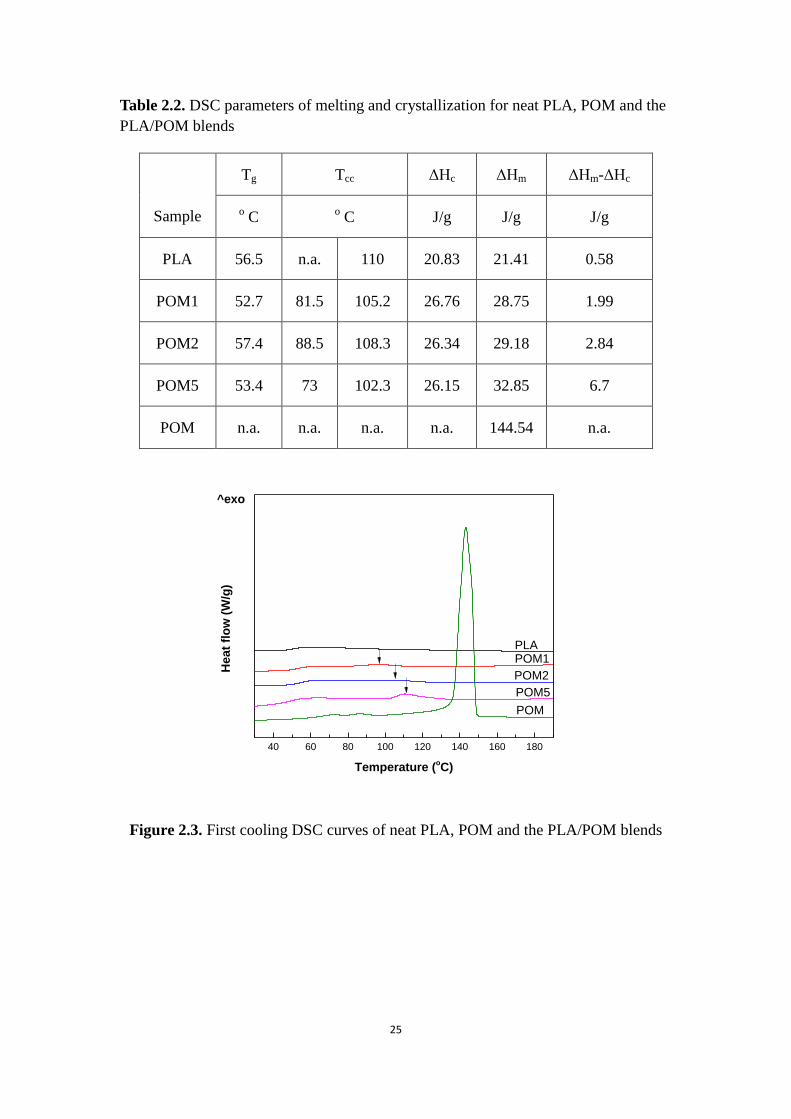
Figure 2.3. First cooling DSC curves of neat PLA, POM and the PLA/POM blends
26
Figure 2.4. First cooling curves of neat PLA and PLA/POM blends
Table 2.3. DSC parameters of cooling and crystallization for neat PLA, POM and the
PLA/POM blends
Sample Tmc ΔHm,c Xc
oC J/g %
Neat PLA n.a. n.a. n.a.
POM1 96.7 2.6 2.8
POM2 107.5 2.7 2.9
POM5 110.7 7.5 8.4
POM 143.2 152.22 n.a.
27
Figure 2.4 displays the thermograms from the first cooling scan of neat PLA and
PLA/POM bends. The DSC results from the first cooling scan are listed in Table 2.3.
Compared to neat PLA, obvious exotherms were observed during the cooling process
for PLA/POM blends. The melt crystallization temperature shifted to a higher value
(from 96.7 to 110.7 oC) with the POM content increasing from 1 to 5 wt%, and the
enthalpy of the melt crystallization increased with increasing POM content as well.
No exotherm was noted for neat PLA during the cooling. The crystallization of PLA
and POM couldn’t be separated in the case of POM5, for POM1 and POM2 the
contribution of POM in crystallization might be ignored due to the low content of
POM. Therefore, estimates of crystallinity of PLA/POM blends were obtained
through equation 2.1. The crystallinity of POM1, POM2 and POM5 were 2.8, 2.9 and
8.4%, respectively. In general, the crystallization of PLA was improved by adding
POM in the blends.
Δ
Δ
Where Δ is the enthalpy of melting crystallization during cooling scan;
is the enthalpy assuming 100% crystalline PLA (93.7 J/g) (Garlotta et al., 2011),
and is the weight fraction of PLA component in the blends.
Figure 2.5 displayed the thermograms from the second heating scan of neat PLA,
POM and PLA/POM blends. There was only one cold crystallization exothermic peak
for PLA/POM blends during second heating scan, which was ascribed to the cold
crystallization peak of PLA at 110 oC.

28
Figure 2.5. Second heating of neat PLA, POM and the PLA/POM blends

29
2.3.2 Crystallization Kinetics of neat PLA and PLA blends
2.3.2.1 Isothermal crystallization of neat PLA and PLA blends
5 10 15 20 25
Heat
flo
w (
W/g
)
Time (min)
POM2
POM5
talc1
talc2
talc5
PLA
POM1
^exo
Figure 2.6. Crystallization isotherms of neat PLA, PLA/POM blends and PLA/talc
blends at 108 oC. The curves were vertically shifted for legibility
Crystallization isotherms were performed by DSC to determine the
crystallization duration at 108 oC. As shown in Figure 2.6, the crystallization peak
time of neat PLA was observed at 11.15 min. The isotherm of POM1 displays a
broader peak at 14 min, which means 1 wt% of POM hinders the crystallization of
PLA. The crystallization peaks shifted to the left of neat PLA when adding more
POM, indicating that the crystallization rate of PLA was improved by the presence of
POM more than 1 wt%. Compared to the isotherm of neat PLA, the isotherms of talc1,
talc2 and talc5 show extremely sharp and intense crystallization peaks. As a result, we
30
can draw the conclusion that talc is more efficient than POM in increasing the
crystallization rate of PLA.
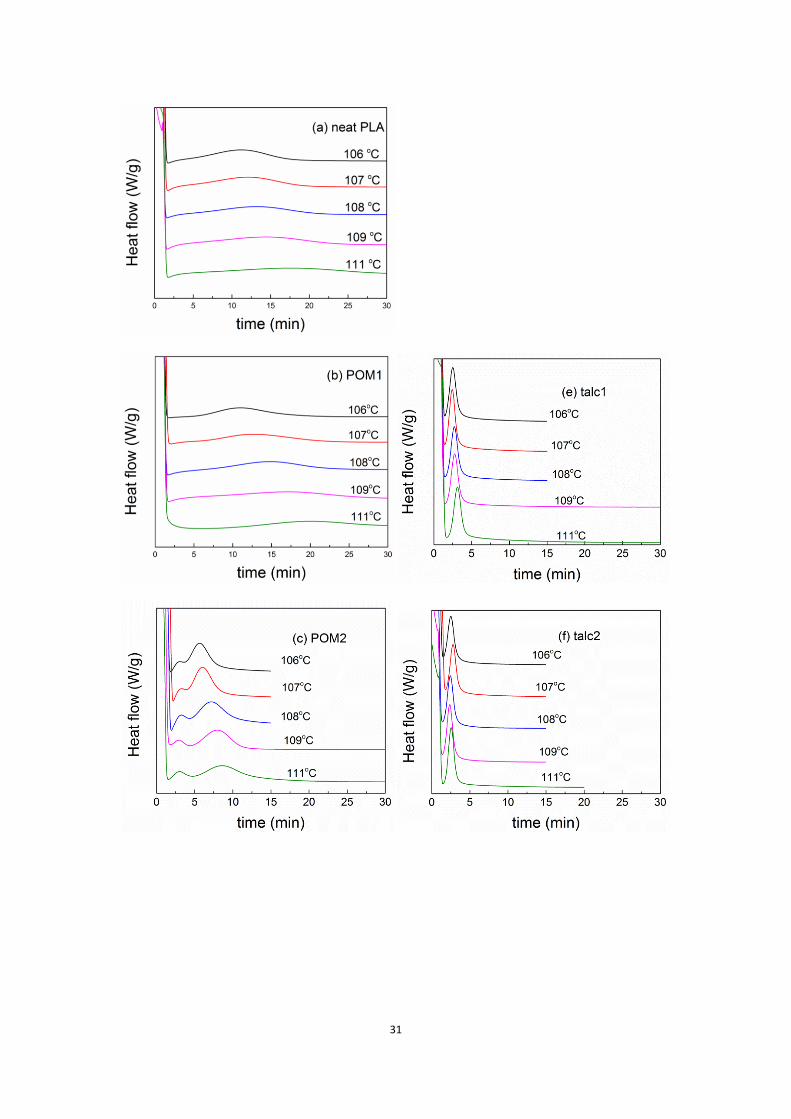
The overall isothermal crystallization kinetics of neat PLA and its two kinds of
blends were further studied using DSC. In order to compare all samples under the
same temperature conditions, the range of isothermal crystallization temperature for
the kinetics study was limited to 106 - 111 o
C. The exotherms for the melt
crystallization of all samples were shown in Figure 2.7. The exothermic peak of neat
PLA became flat and shifted to longer time with increasing crystallization temperature,
the same pattern was found for the PLA/POM blends. This result implies that neat
PLA and PLA/POM blends (POM1, POM2 and POM5) at higher crystallization
temperature need longer time to complete crystallization. The pattern of
crystallization of neat PLA could not be found in the PLA/talc blends. This
phenomenon corresponds to a compromise between nucleation and growth of crystals:
crystal nucleation is favored at low temperature when molecular mobility is low,
nevertheless crystal growth is favored at high temperature when viscosity is low.
31
32
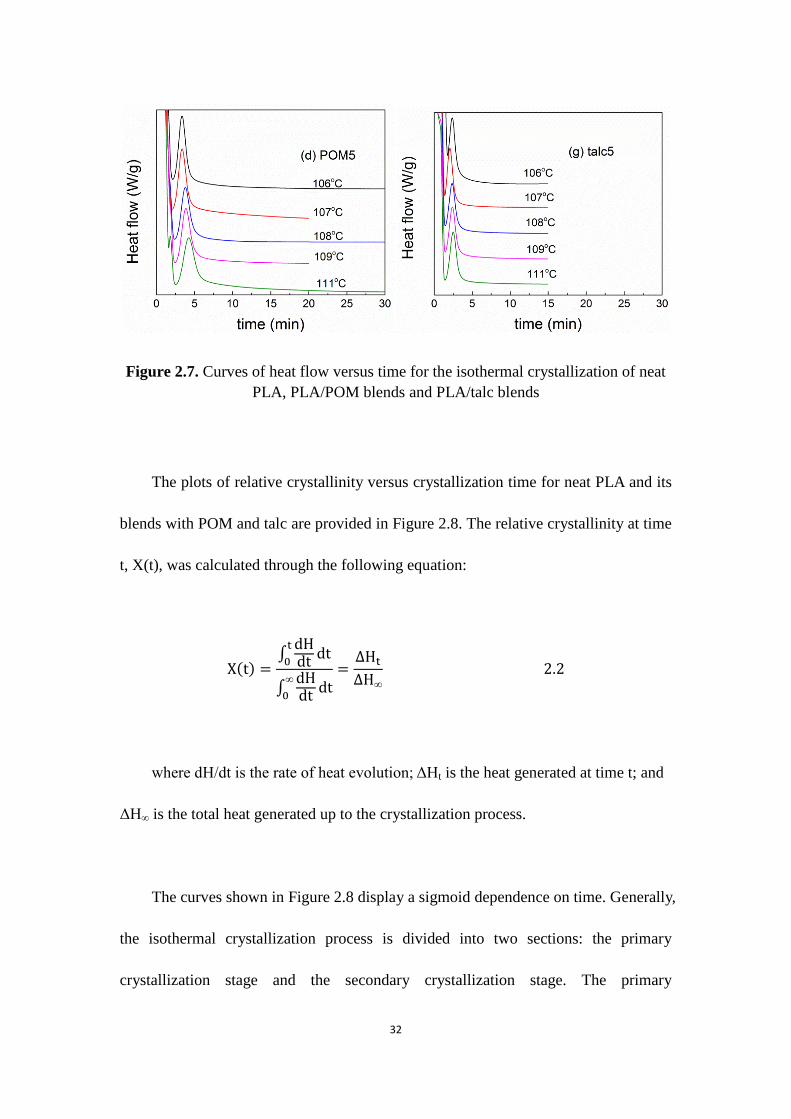
Figure 2.7. Curves of heat flow versus time for the isothermal crystallization of neat
PLA, PLA/POM blends and PLA/talc blends
The plots of relative crystallinity versus crystallization time for neat PLA and its
blends with POM and talc are provided in Figure 2.8. The relative crystallinity at time
t, X(t), was calculated through the following equation:
where dH/dt is the rate of heat evolution; ΔHt is the heat generated at time t; and
ΔH is the total heat generated up to the crystallization process.
The curves shown in Figure 2.8 display a sigmoid dependence on time. Generally,
the isothermal crystallization process is divided into two sections: the primary
crystallization stage and the secondary crystallization stage. The primary
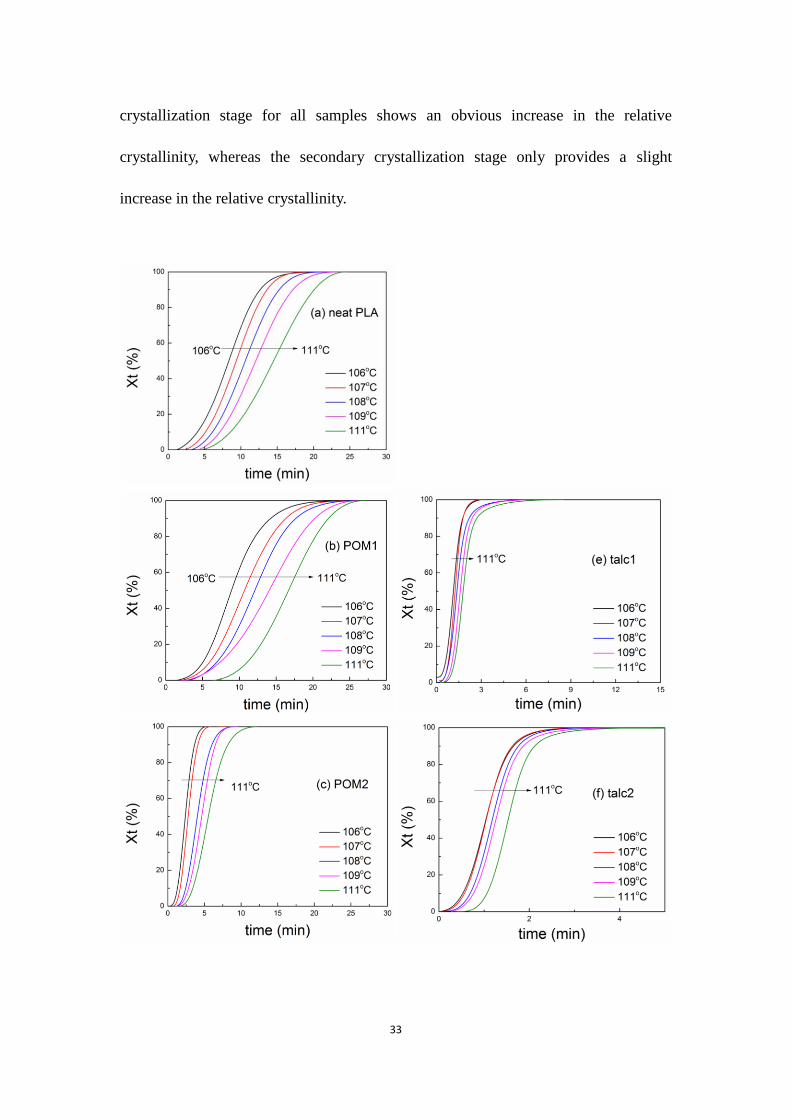
33
crystallization stage for all samples shows an obvious increase in the relative
crystallinity, whereas the secondary crystallization stage only provides a slight
increase in the relative crystallinity.
34
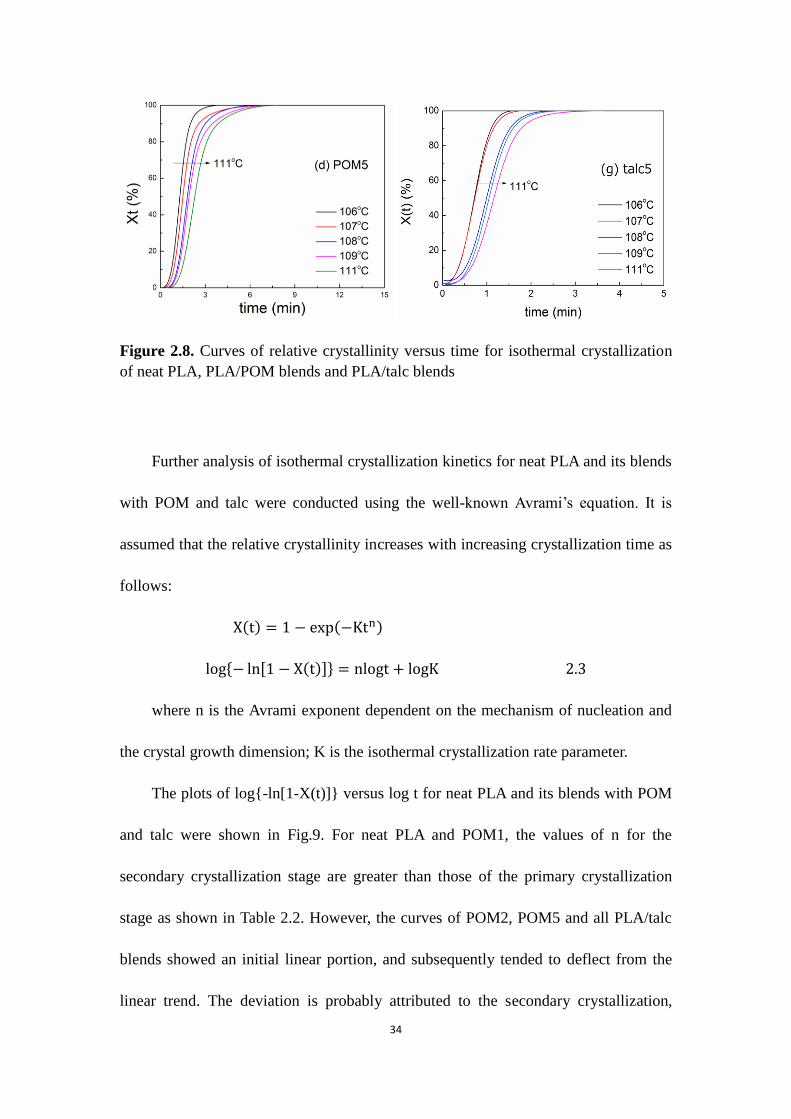
Figure 2.8. Curves of relative crystallinity versus time for isothermal crystallization
of neat PLA, PLA/POM blends and PLA/talc blends
Further analysis of isothermal crystallization kinetics for neat PLA and its blends
with POM and talc were conducted using the well-known Avrami’s equation. It is
assumed that the relative crystallinity increases with increasing crystallization time as
follows:
where n is the Avrami exponent dependent on the mechanism of nucleation and
the crystal growth dimension; K is the isothermal crystallization rate parameter.
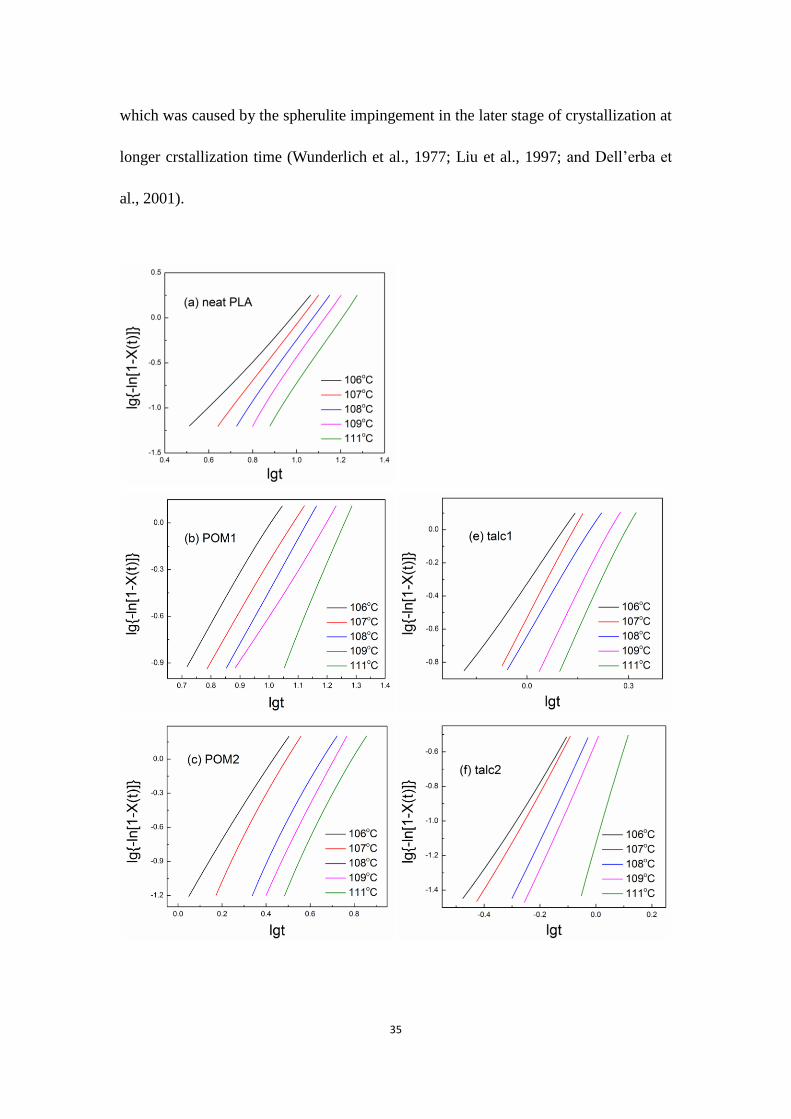
The plots of log{-ln[1-X(t)]} versus log t for neat PLA and its blends with POM
and talc were shown in Fig.9. For neat PLA and POM1, the values of n for the
secondary crystallization stage are greater than those of the primary crystallization
stage as shown in Table 2.2. However, the curves of POM2, POM5 and all PLA/talc
blends showed an initial linear portion, and subsequently tended to deflect from the
linear trend. The deviation is probably attributed to the secondary crystallization,
35
which was caused by the spherulite impingement in the later stage of crystallization at
longer crstallization time (Wunderlich et al., 1977; Liu et al., 1997; and Dell’erba et
al., 2001).
36
Figure 2.9. Curves of log{-ln[1-X(t)]} versus log t for isothermal crystallization of
neat PLA, PLA/POM blends and PLA/talc blends
Table 2.4. Isothermal crystallization kinetics parameters for neat PLA and its two
blends of POM and talc on the Avrami equation
Sample TC (oC) n K (min
-n)×10
-3 t1/2 (min) Τ1/2 (min
-1)
Neat PLA
106 2.66 2.5003 8.2862 0.1207
107 3.148 0.607 9.3603 0.1068
108 3.37 0.24044 10.633 0.094
109 3.514 0.1089 12.091 0.0827
111 3.568 0.04989 14.491 0.06901
POM1
106 3.1684 0.5238 9.6658 0.1034
107 3.1256 0.4012 10.859 0.0921
108 3.3645 0.1684 11.866 0.0843
109 3.0013 0.1581 16.347 0.0612
111 3.8783 0.0115 17.076 0.0586
37
Table 2.4. continued
POM2
106 3.0773 46.806 2.4009 0.4165
107 3.5606 17.713 2.8007 0.3571
108 3.5736 4.5973 4.0697 0.2452
109 3.7687 2.138 4.6369 0.2157
111 3.7082 1.1749 5.5875 0.179
POM5
106 3.2986 289.068 1.3036 0.7671
107 3.4439 166.725 1.5125 0.6612
108 3.7475 74.302 1.8146 0.5511
109 3.7218 59.429 1.9348 0.5168
111 3.7513 29.923 2.3111 0.4327
talc1
106 2.9483 477.64 1.1346 0.8813
107 3.8724 294.103 1.2478 0.8014
108 3.4374 229.774. 1.3788 0.7253
109 3.8769 103.276 1.6341 0.612
111 3.9216 56.208 1.8976 0.527
talc2
106 2.5317 578.762 1.0738 0.9312
107 2.8669 549.794 1.0842 0.9224
108 3.4295 384.769 1.1872 0.8423
109 3.6295 286.946 1.2751 0.7843
111 3.9889 74.08 1.7517 0.5709
talc5
106 2.647 1.7378 0.71563 1.39738
107 2.51 1.574 0.73035 1.3692
108 2.716 0.692 1.00067 0.99933
109 2.934 0.5649 1.06974 0.93481
111 2.85 0.4207 1.1844 0.84431
38
From the slope and intercept of the initial linear portion in Figure 2.9, the values
of n and K were determined and listed in Table 2.4. The Avrami exponent n varied
from 2 to 4, and this reflected the mechanism of nucleation and the crystal growth.
The average value of n was around 3.2, 3.3, 3.5, 3.6, 3.6, 3.3 and 2.7 for neat PLA,
POM1, POM2, POM5, talc1, talc2 and talc5, respectively. For neat PLA without
heterogeneous nucleus, the crystallization followed homogeneous nucleation and
spherulitic three-dimension growth from instantaneous nuclei. For PLA/POM blends
and PLA/talc blends, the nucleation type is mostly heterogeneous nucleation and the
spherulitic growth is three-dimensional growth from instantaneous nuclei (Sperling et
al., 2006). The values of the crystallization rate parameter K for all samples
increased with decreasing crystallization temperature Tc, which displayed a very
different temperature dependency.
39
0 1 2 3 4 50
2
4
6
8
10
12
t 1/2
(min
)
Weight percent (%)
talc
POM
Figure 2.10. Curve of the half-time of crystallization versus different weight fractions
of POM and talc respectively in the PLA/POM blends and PLA/talc blends
Another important parameter is the half-time of crystallization (t1/2), which is
introduced to directly compare the crystallization rate. t1/2 is defined as the time from
the onset of the crystallization until 50% completion and can be determined from the
kinetics parameters.
The dependency of t1/2 on the weight percent at 108 oC is shown in Figure 2.10.
As seen in both POM and talc blends, the half-time of crystallization decreased with
increasing the weight percent of the additives. Except for POM1 which shows a
greater value of t1/2 than that of neat PLA, dramatic decreases of t1/2 were observed
with the presence of POM (2 and 5 wt %) and talc (1, 2 and 5 wt %) when compared
40
to neat PLA, indicating the addition of POM and talc significantly enhanced the
crystallization rate of PLA. Moreover, talc exhibited a higher effect than POM on
improving the crystallization rate of neat PLA.
106 107 108 109 110 1110
3
6
9
12
15
t 1/2 (
min
)
Crystallization temperature (oC)
POM1
PLA
POM2
POM5talc1talc2talc5
Figure 2.11. Curve of the half-time of crystallization versus different crystallization
temperatures of neat PLA and its two blends with POM and talc
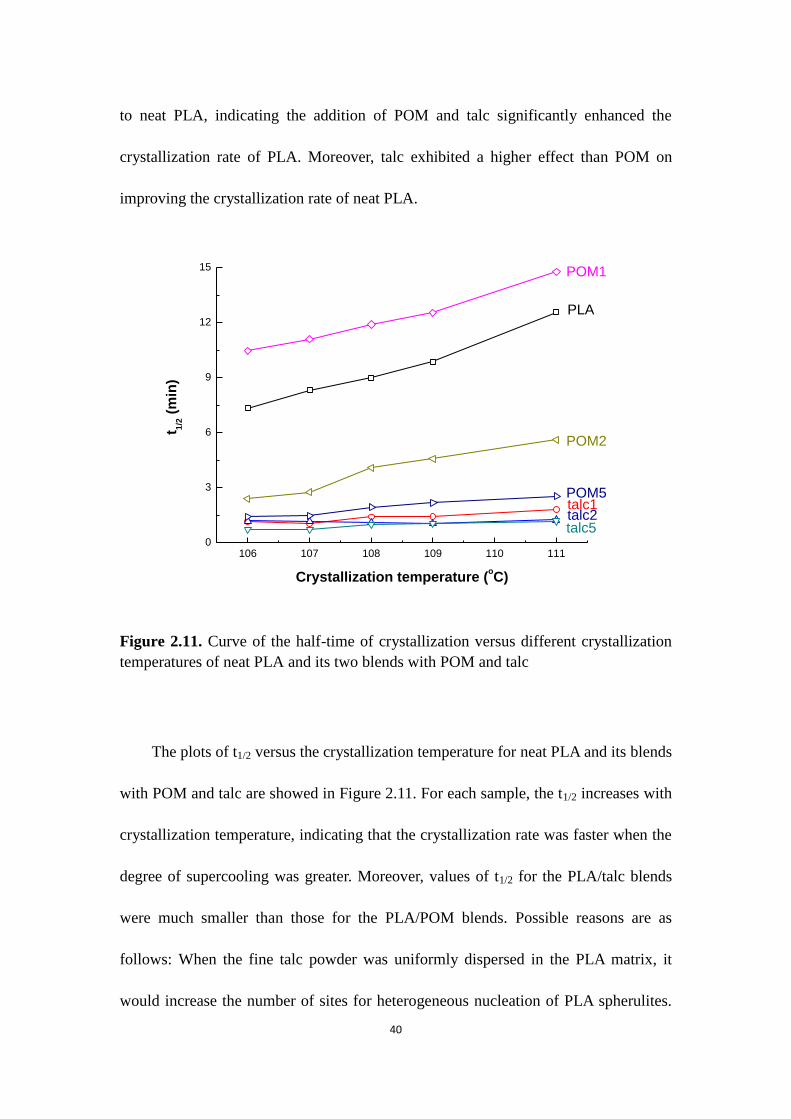
The plots of t1/2 versus the crystallization temperature for neat PLA and its blends
with POM and talc are showed in Figure 2.11. For each sample, the t1/2 increases with
crystallization temperature, indicating that the crystallization rate was faster when the
degree of supercooling was greater. Moreover, values of t1/2 for the PLA/talc blends
were much smaller than those for the PLA/POM blends. Possible reasons are as
follows: When the fine talc powder was uniformly dispersed in the PLA matrix, it
would increase the number of sites for heterogeneous nucleation of PLA spherulites.
41
Therefore, the nucleation density in PLA/talc was significantly larger than that in
PLA/POM, which made talc more effective than POM on enhancing the
crystallization rate of PLA.
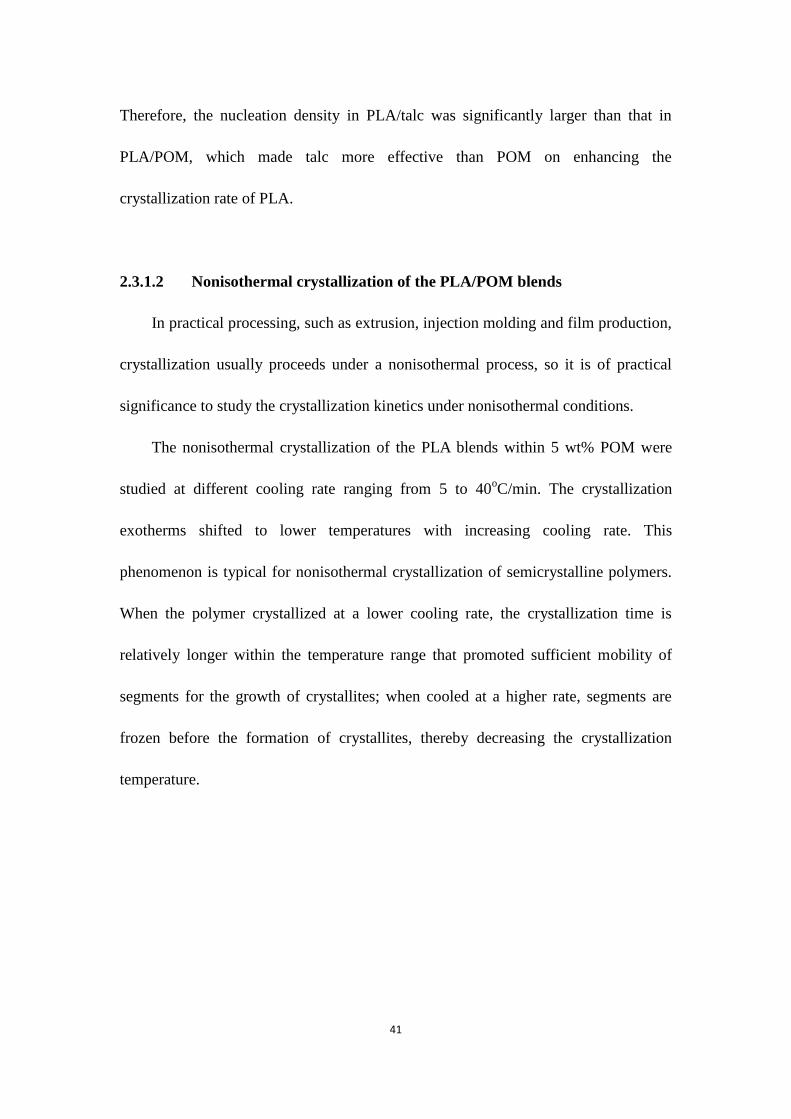
2.3.1.2 Nonisothermal crystallization of the PLA/POM blends
In practical processing, such as extrusion, injection molding and film production,
crystallization usually proceeds under a nonisothermal process, so it is of practical
significance to study the crystallization kinetics under nonisothermal conditions.
The nonisothermal crystallization of the PLA blends within 5 wt% POM were
studied at different cooling rate ranging from 5 to 40oC/min. The crystallization
exotherms shifted to lower temperatures with increasing cooling rate. This
phenomenon is typical for nonisothermal crystallization of semicrystalline polymers.
When the polymer crystallized at a lower cooling rate, the crystallization time is
relatively longer within the temperature range that promoted sufficient mobility of
segments for the growth of crystallites; when cooled at a higher rate, segments are
frozen before the formation of crystallites, thereby decreasing the crystallization
temperature.
42
40 80 120 160
Heat
flo
w (
W/g
)
temperture (oC)
5oC/min
10oC/min
20oC/min
30oC/min
40oC/min
Figure 2.12. Thermograms of melt crystallization of PLA/POM=95/5 at different
cooling rates.
43
60 75 90 105 120 1350
20
40
60
80
100
X(t
) (%
)
temperature (oC)
5oC/min
10oC/min
20oC/min
30oC/min
40oC/min
(a)
0 4 8 12 16 200
20
40
60
80
100
X(t
) (%
)
time (min)
5oC/min
10oC/min
20oC/min
30oC/min
40oC/min
(b)
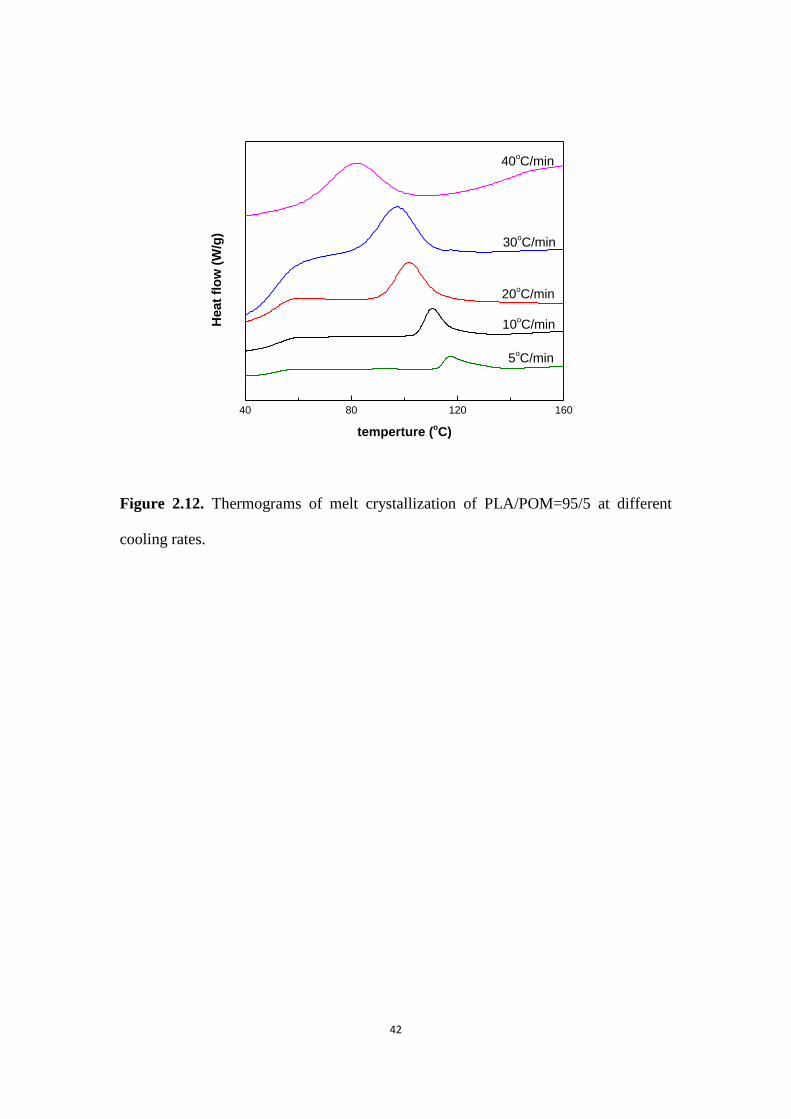
Figure 2.13. Curves of relative crystallization versus (a) crystallization temperature
and (b) time for nonisothermal crystallization of PLA/POM=95/5
The relative crystallinity X(t) developing with crystallization time as shown in
Figure 2.13(a) can be calculated from the DSC data. During the nonisothermal
crystallization process, the curves display reversed S-shape. The horizontal
temperature axis in Figure 2.13(a) can be transformed into a timescale in Figure
44
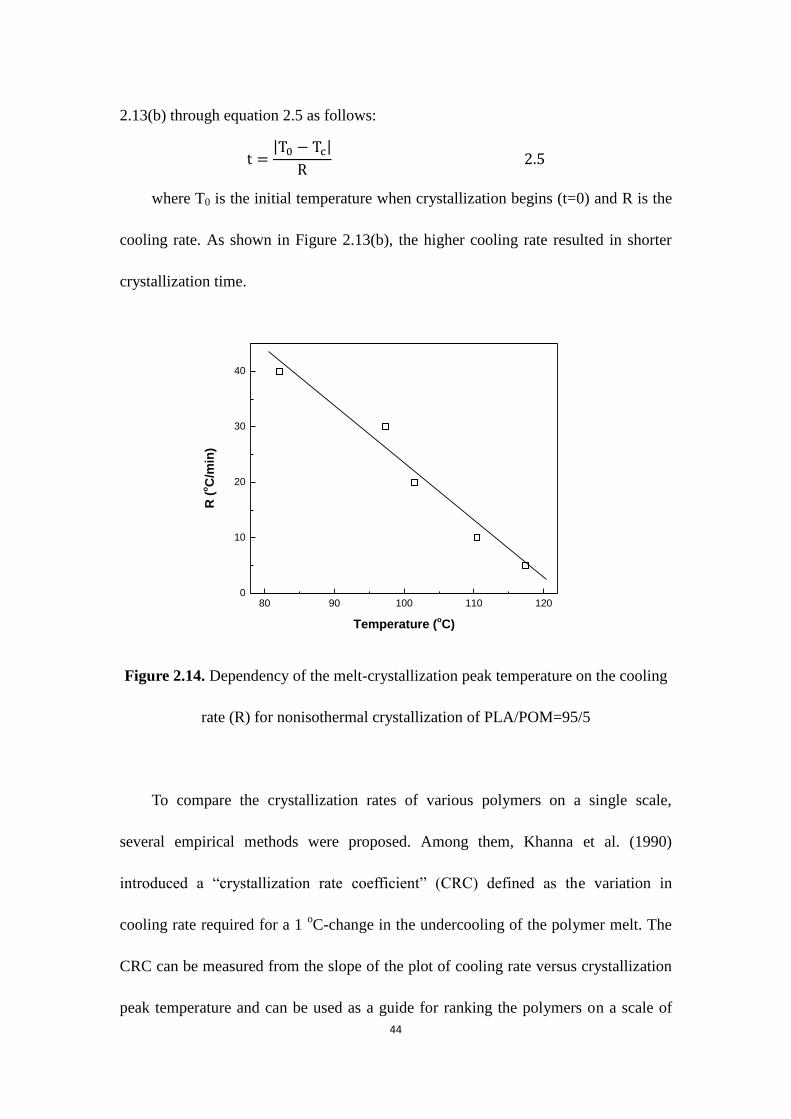
2.13(b) through equation 2.5 as follows:
where T0 is the initial temperature when crystallization begins (t=0) and R is the
cooling rate. As shown in Figure 2.13(b), the higher cooling rate resulted in shorter
crystallization time.
80 90 100 110 1200
10
20
30
40
R (
oC
/min
)
Temperature (oC)
Figure 2.14. Dependency of the melt-crystallization peak temperature on the cooling
rate (R) for nonisothermal crystallization of PLA/POM=95/5
To compare the crystallization rates of various polymers on a single scale,
several empirical methods were proposed. Among them, Khanna et al. (1990)
introduced a “crystallization rate coefficient” (CRC) defined as the variation in
cooling rate required for a 1 oC-change in the undercooling of the polymer melt. The
CRC can be measured from the slope of the plot of cooling rate versus crystallization
peak temperature and can be used as a guide for ranking the polymers on a scale of
45
crystallization rates. Higher CRC values represent faster crystallization systems.
Based on Khanna’s method, the cooling rate R is plotted against T in Figure 2.14.
The CRC value of POM5 measured from the slope of the line is 62.76 h-1
, and the
CRC value reported for neat PLA is 6.79 h-1
(Liu et al., 2005). Comparing the CRC
values of POM5 and neat PLA, we can conclude that the CRC value of POM5 is
much greater than neat PLA, which means the incorporation of POM enhance the
crystallization of PLA and is beneficial for injection-molded fabrication resulting
from the reduction in cycle time.
2.3.3 Crystallization morphology and crystalline growth of neat PLA and PLA
blends
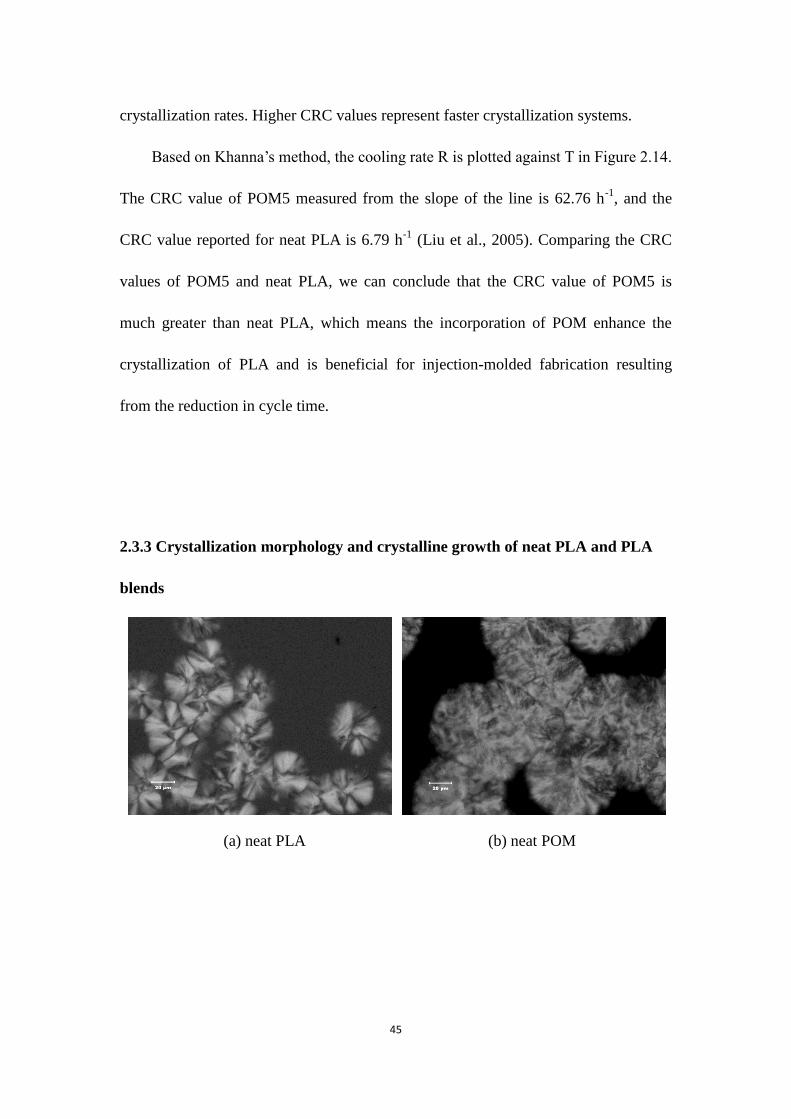
(a) neat PLA (b) neat POM
46
(c) POM1 (d) talc1
(e) POM2 (f) talc2
(g) POM5 (h) talc5
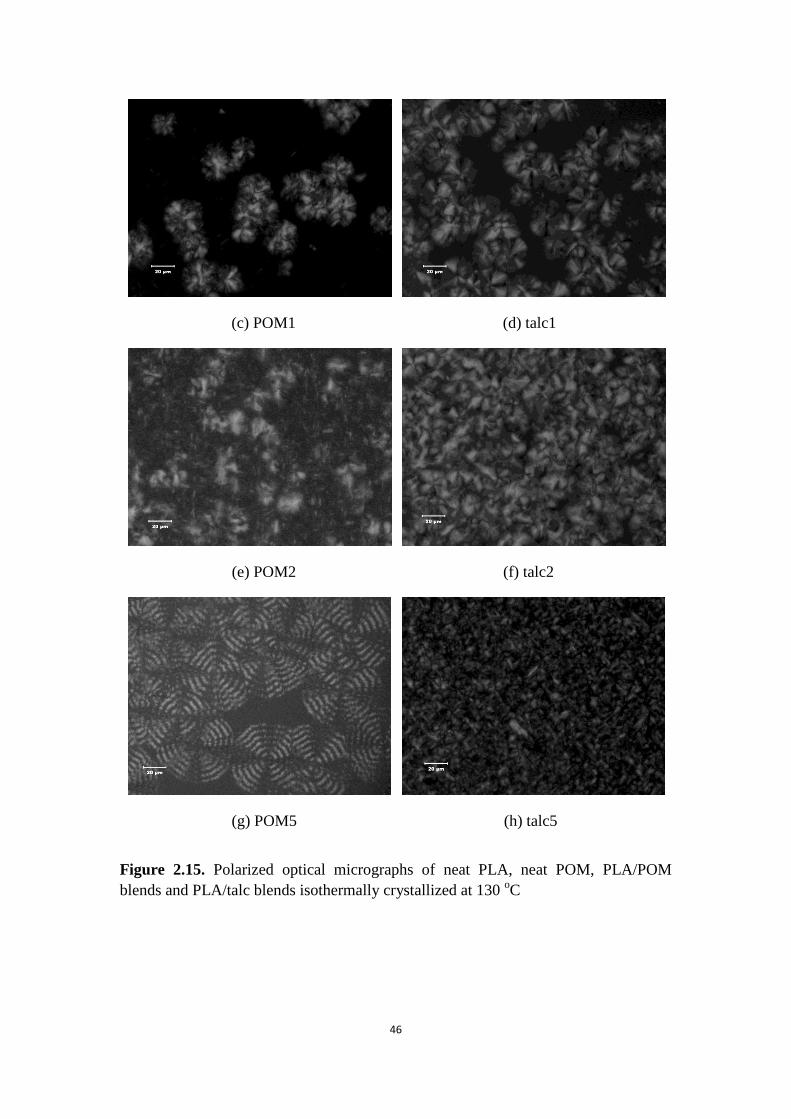
Figure 2.15. Polarized optical micrographs of neat PLA, neat POM, PLA/POM
blends and PLA/talc blends isothermally crystallized at 130 oC
47
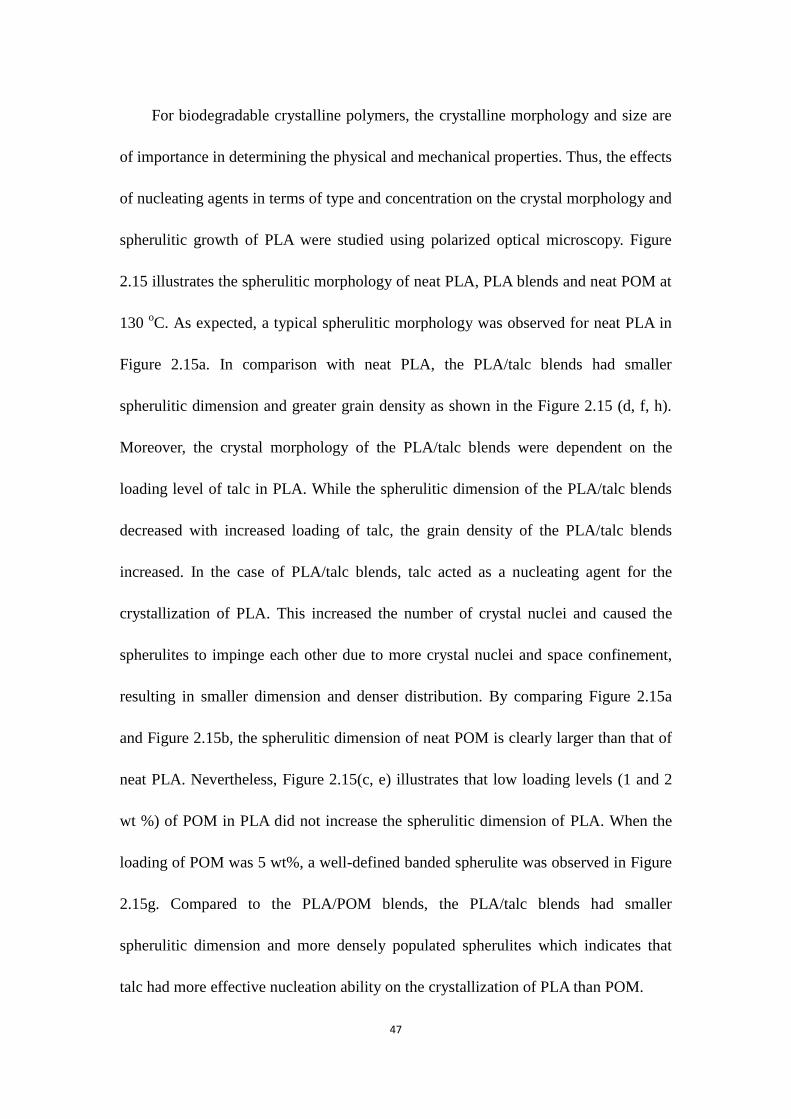
For biodegradable crystalline polymers, the crystalline morphology and size are
of importance in determining the physical and mechanical properties. Thus, the effects
of nucleating agents in terms of type and concentration on the crystal morphology and
spherulitic growth of PLA were studied using polarized optical microscopy. Figure
2.15 illustrates the spherulitic morphology of neat PLA, PLA blends and neat POM at
130 oC. As expected, a typical spherulitic morphology was observed for neat PLA in
Figure 2.15a. In comparison with neat PLA, the PLA/talc blends had smaller
spherulitic dimension and greater grain density as shown in the Figure 2.15 (d, f, h).
Moreover, the crystal morphology of the PLA/talc blends were dependent on the
loading level of talc in PLA. While the spherulitic dimension of the PLA/talc blends
decreased with increased loading of talc, the grain density of the PLA/talc blends
increased. In the case of PLA/talc blends, talc acted as a nucleating agent for the
crystallization of PLA. This increased the number of crystal nuclei and caused the
spherulites to impinge each other due to more crystal nuclei and space confinement,
resulting in smaller dimension and denser distribution. By comparing Figure 2.15a
and Figure 2.15b, the spherulitic dimension of neat POM is clearly larger than that of
neat PLA. Nevertheless, Figure 2.15(c, e) illustrates that low loading levels (1 and 2
wt %) of POM in PLA did not increase the spherulitic dimension of PLA. When the
loading of POM was 5 wt%, a well-defined banded spherulite was observed in Figure
2.15g. Compared to the PLA/POM blends, the PLA/talc blends had smaller
spherulitic dimension and more densely populated spherulites which indicates that
talc had more effective nucleation ability on the crystallization of PLA than POM.
48
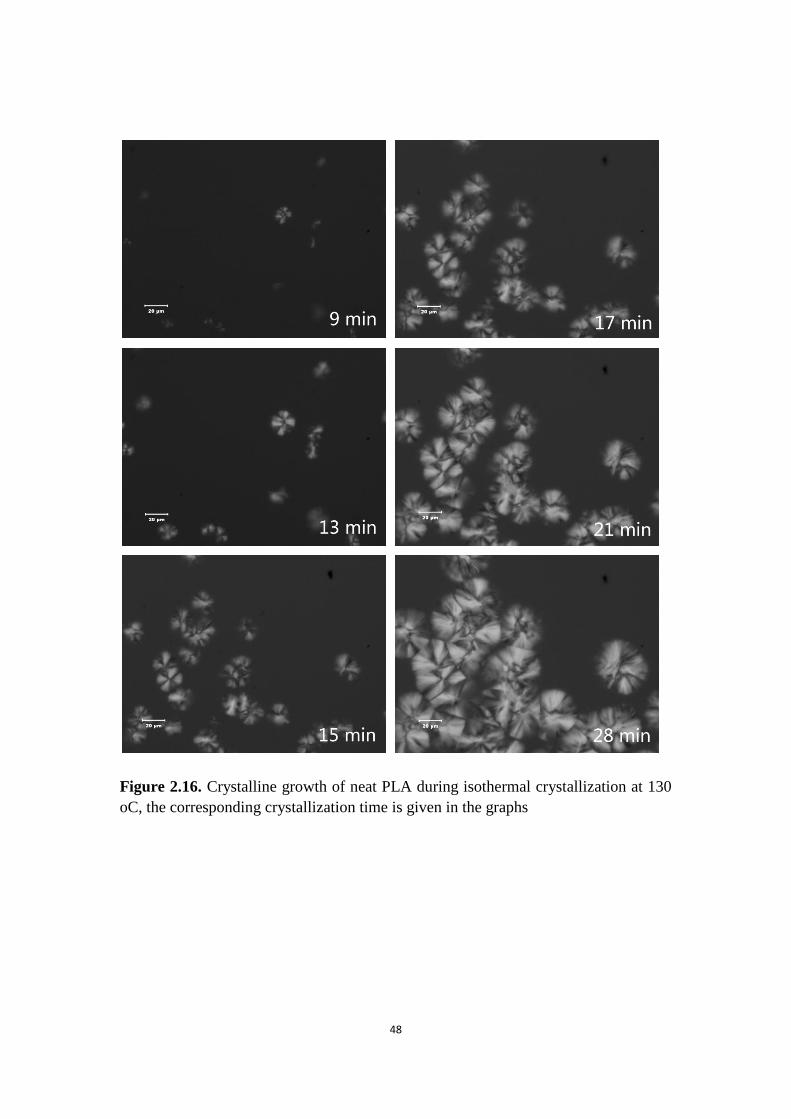
Figure 2.16. Crystalline growth of neat PLA during isothermal crystallization at 130
oC, the corresponding crystallization time is given in the graphs
49
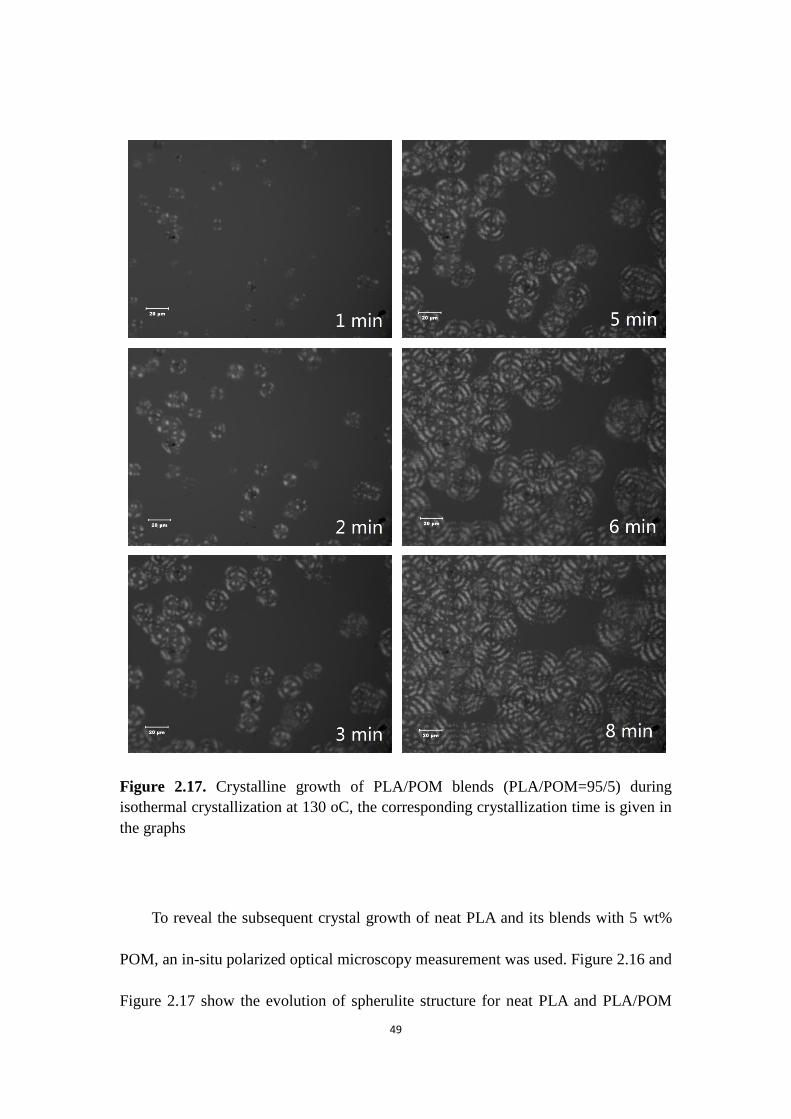
Figure 2.17. Crystalline growth of PLA/POM blends (PLA/POM=95/5) during
isothermal crystallization at 130 oC, the corresponding crystallization time is given in
the graphs
To reveal the subsequent crystal growth of neat PLA and its blends with 5 wt%
POM, an in-situ polarized optical microscopy measurement was used. Figure 2.16 and
Figure 2.17 show the evolution of spherulite structure for neat PLA and PLA/POM
50
blends, respectively, during isothermal crystallization at 130 oC. As shown in Figure
2.16, clear birefringence was not detected at the initial stage of crystallization (before
9 min) of neat PLA. Small Maltese cross spherulites were observed as crystallization
time reached 13 min, while the spherulite distribution was sparse. With further
increasing crystallization time, more spherulites were observed and the radius of the
spherulite became larger and impinged on each other. Compared to the crystal growth
process of neat PLA, POM5 had a faster crystallization rate since the birefringence
arose at 1 min during isothermal crystallization at 130 oC, as illustrated in Figure 2.17.
In 8 min, the well-defined banded spherulite was completely formed, the number of
the spherulites and the radius of the spherulite increased with increasing
crystallization time. It is clear from Figure 2.16 and Figure 2.17 that the 5 wt% POM
significantly increased the crystallization rate of PLA and greatly changed the
crystallization morphology of PLA from a typical spherulite with periodic extinction
to a well-defined banded spherulite.
51
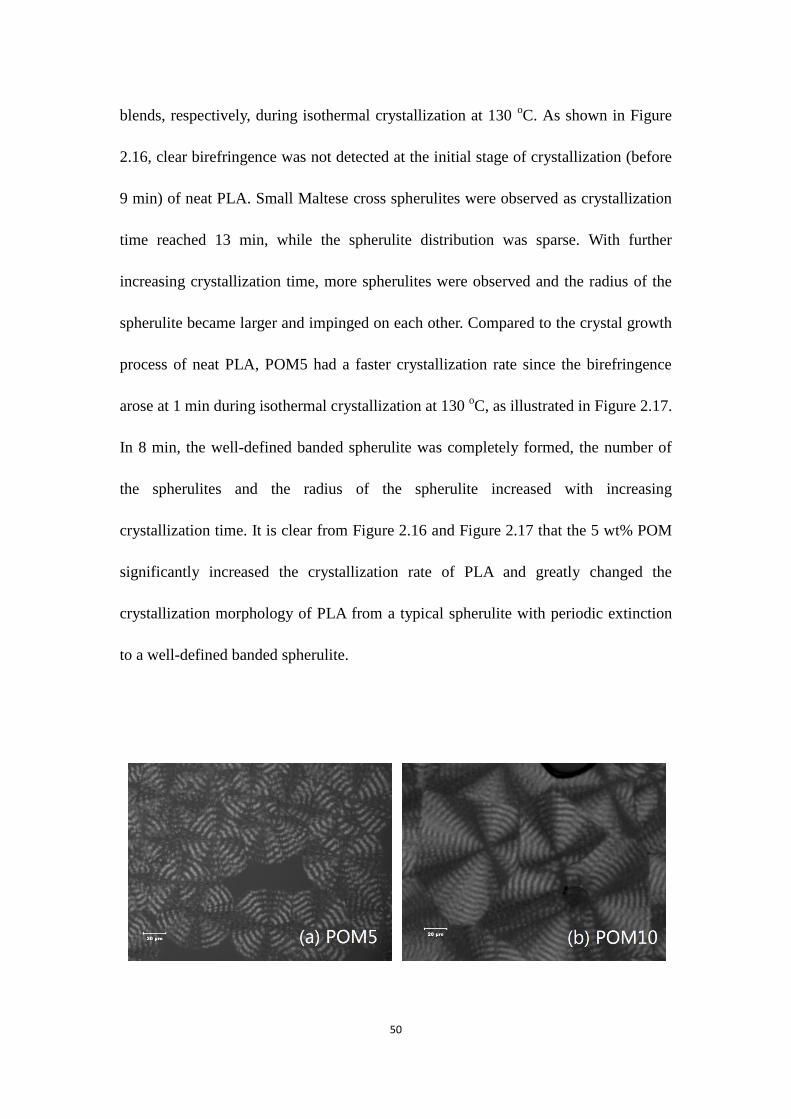
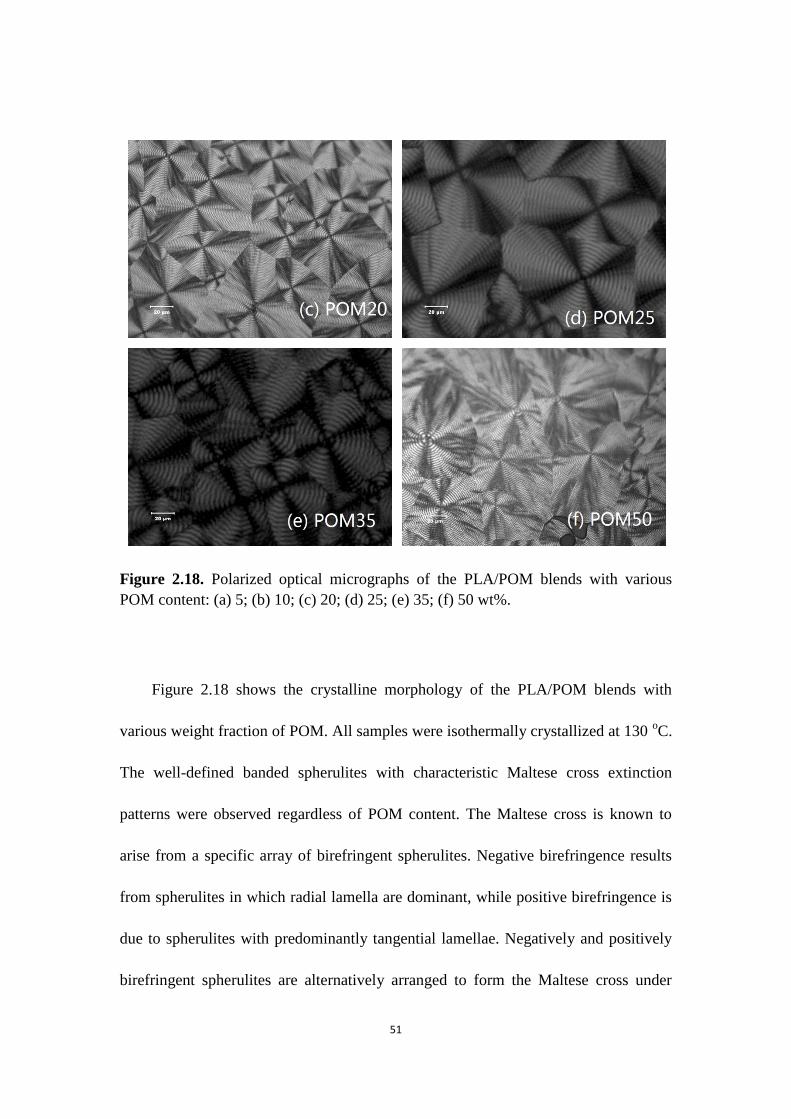
Figure 2.18. Polarized optical micrographs of the PLA/POM blends with various
POM content: (a) 5; (b) 10; (c) 20; (d) 25; (e) 35; (f) 50 wt%.
Figure 2.18 shows the crystalline morphology of the PLA/POM blends with
various weight fraction of POM. All samples were isothermally crystallized at 130 oC.
The well-defined banded spherulites with characteristic Maltese cross extinction
patterns were observed regardless of POM content. The Maltese cross is known to
arise from a specific array of birefringent spherulites. Negative birefringence results
from spherulites in which radial lamella are dominant, while positive birefringence is
due to spherulites with predominantly tangential lamellae. Negatively and positively
birefringent spherulites are alternatively arranged to form the Maltese cross under
52
crossed polarizers. It is generally believed that the banded spherulites result from the
periodically lamellar twisting along the direction of radial growth, although this
twisting is not usually uniform but changes of orientation take place discontinuously
at periodic intervals (Chao et al., 2008). When such spherulites are viewed under
crossed polarizers, the cross-section of the indicatrix perpendicular to the direction of
propagation of the light through the spherulites periodically becomes circular and the
polarization is unmodified as the light traverses the spherulites, so that dark circles
appear at regular intervals in the addition to the Maltese cross to form the
well-defined banded spherulits of PLA/POM blends.
2.3.4 Optical transparency of neat PLA and its blends
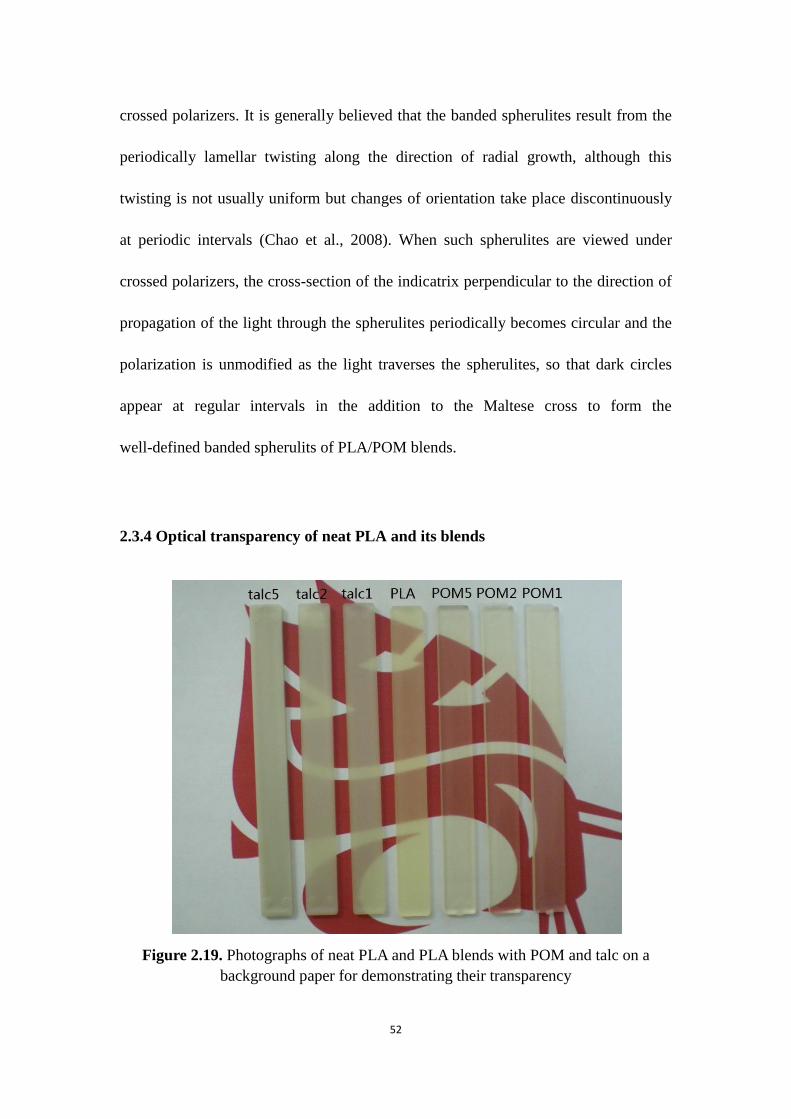
Figure 2.19. Photographs of neat PLA and PLA blends with POM and talc on a
background paper for demonstrating their transparency
53
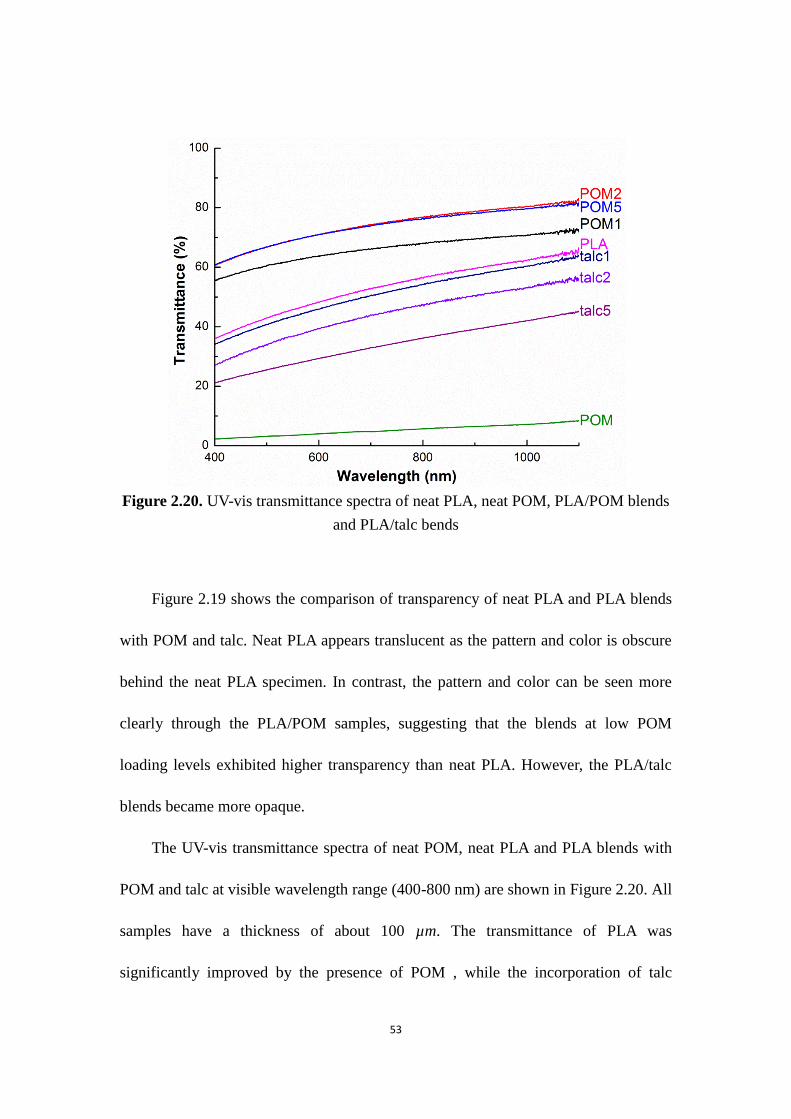
Figure 2.20. UV-vis transmittance spectra of neat PLA, neat POM, PLA/POM blends
and PLA/talc bends
Figure 2.19 shows the comparison of transparency of neat PLA and PLA blends
with POM and talc. Neat PLA appears translucent as the pattern and color is obscure
behind the neat PLA specimen. In contrast, the pattern and color can be seen more
clearly through the PLA/POM samples, suggesting that the blends at low POM
loading levels exhibited higher transparency than neat PLA. However, the PLA/talc
blends became more opaque.
The UV-vis transmittance spectra of neat POM, neat PLA and PLA blends with
POM and talc at visible wavelength range (400-800 nm) are shown in Figure 2.20. All
samples have a thickness of about 100 µm. The transmittance of PLA was
significantly improved by the presence of POM , while the incorporation of talc
54
decreased the transmittance of PLA. Moreover, neat POM exhibited a very low
transmittance (no greater than 10 %).
The high transparency of the PLA/POM may be attributed to the very similar
refractive indices of PLA (1.482-1.492) (Rafael et al., 2010) and POM (1.476-1.492)
(O’shea et al., 1992). Because the light scattering will not occur at the interface
between the matrix and the filler if the refractive indices of the two components are
identical, then transparent blends can result (Kutz et al., 2011). The transmittance of
the blend is an effective way to judge the miscibility: immiscible blends are usually
cloudy or opalescent because of the different refractive indices of the components.
The fact that the incorporation of POM did not decrease, instead, increased the
transmittance of PLA, indicating PLA/POM blends are miscible or semi-miscible.
The transmittance of the PLA/talc blends was lower than that of neat PLA and
decreased with the increase in talc loading because of the heterogeneous nature of the
blends. Usually, for a transparent polymer, modification of the matrix by dispersing an
inorganic component into the polymer results in a significant loss of transparency due
to scattering from large particles or agglomerates (Dusek et al., 2010). Another
possible reason for the reduction of the transmittance is the increase of crystallinity of
PLA by the presence of talc, since the crystals in the blends scatter light (Philip et al.,
2002).
55
2.3.5 Crystal structure of PLA blends
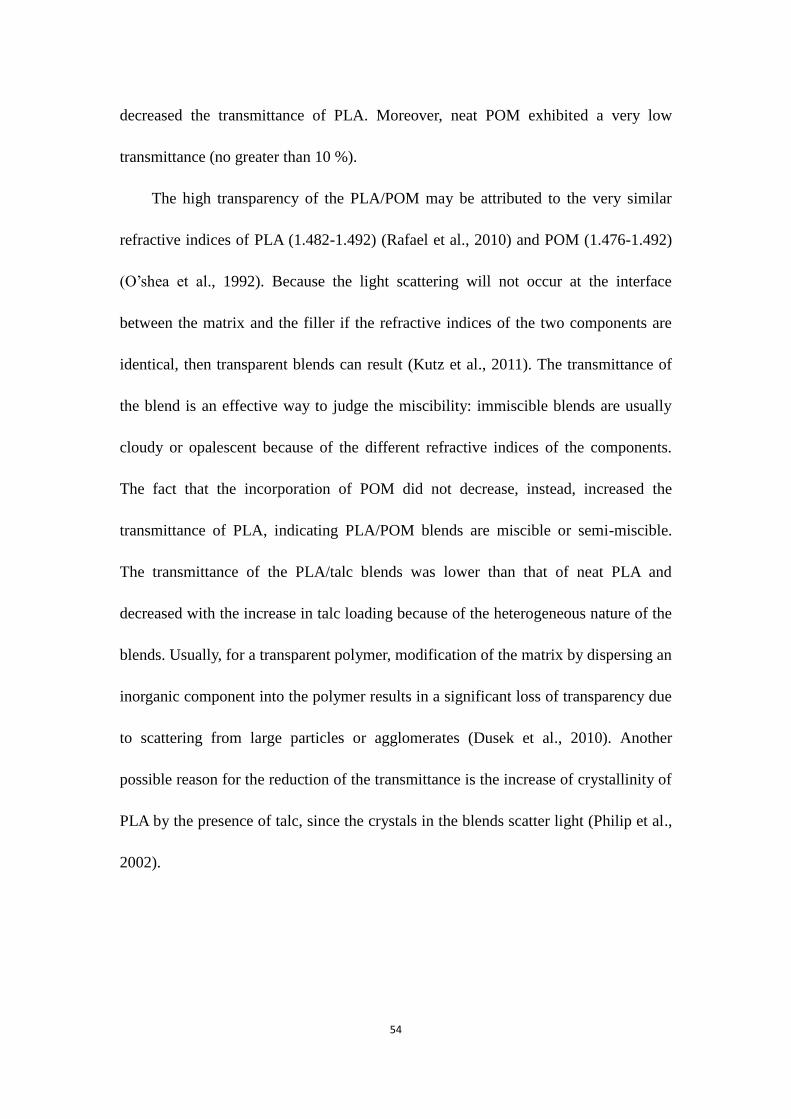
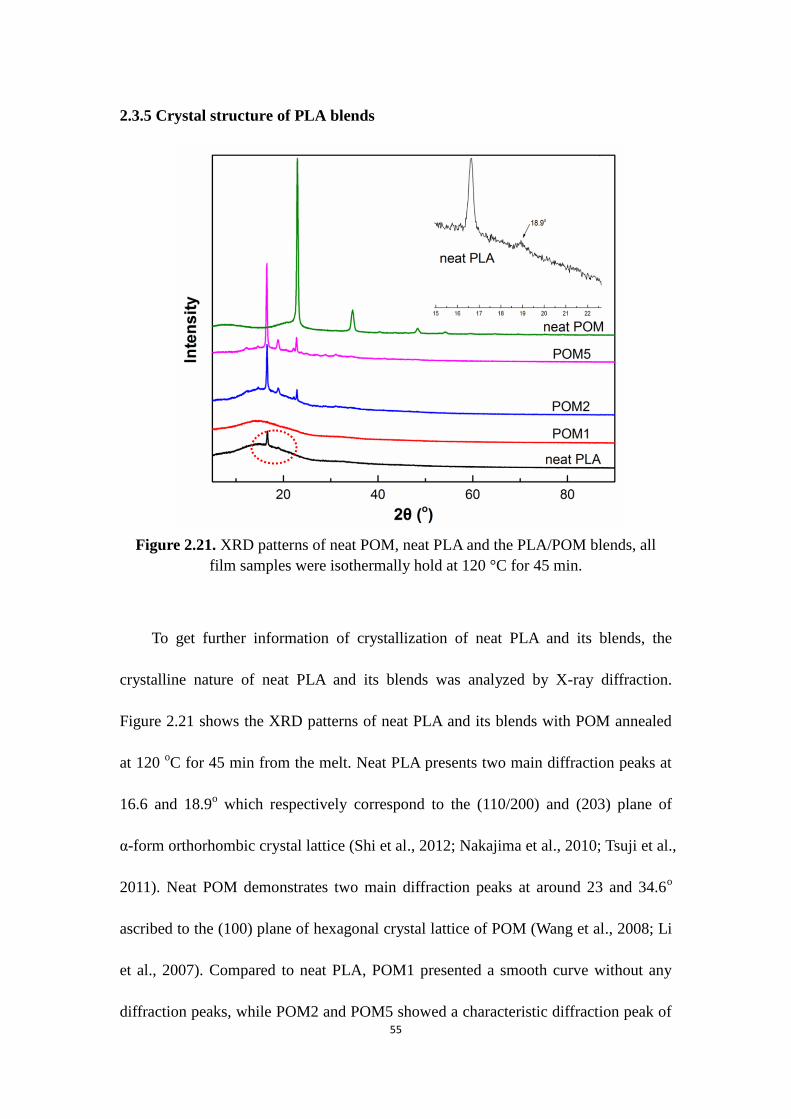
Figure 2.21. XRD patterns of neat POM, neat PLA and the PLA/POM blends, all
film samples were isothermally hold at 120 °C for 45 min.
To get further information of crystallization of neat PLA and its blends, the
crystalline nature of neat PLA and its blends was analyzed by X-ray diffraction.
Figure 2.21 shows the XRD patterns of neat PLA and its blends with POM annealed
at 120 oC for 45 min from the melt. Neat PLA presents two main diffraction peaks at
16.6 and 18.9o which respectively correspond to the (110/200) and (203) plane of
α-form orthorhombic crystal lattice (Shi et al., 2012; Nakajima et al., 2010; Tsuji et al.,
2011). Neat POM demonstrates two main diffraction peaks at around 23 and 34.6o
ascribed to the (100) plane of hexagonal crystal lattice of POM (Wang et al., 2008; Li
et al., 2007). Compared to neat PLA, POM1 presented a smooth curve without any
diffraction peaks, while POM2 and POM5 showed a characteristic diffraction peak of

56
POM at around 22.8o in addition to those featured diffraction peaks of PLA at 16.6
and 18.9o. Therefore, the presence of POM didn’t change the crystal structure of PLA
because the characteristic peaks of PLA and POM respectively maintained in
PLA/POM blends without forming any new peak. Moreover the peak intensities of
the PLA/POM blends increased with increase of POM content, indicating that the
presence of POM increased the crystallinity of PLA except when the loading level of
POM was 1 wt% or lower, as low content of POM (less than 1 wt)% impeded the
crystallization of PLA. The result of XRD corresponded to the DSC results of
crystallization and crystalline morphology, and suggests that the proper content of
POM in PLA can enhance the crystallization of POM.
It is of significance to study the influence of different fillers on the crystal
structure of PLA. Figure 2.22 illustrates the XRD patterns of neat PLA and its blends
with POM and talc quenched from the melt. Neat PLA and POM1 exhibited smooth
curves with a bump around 16o. POM2 and POM5 presented a weak characteristic
diffraction peak of POM at 22.8 due to the (100) plane of hexagonal crystals. The
PLA/talc blends exhibited three strong diffraction peaks at around 9.5, 18.9 and 28.6o
corresponding to the (002), (020) and (006) panes of talc (Kano et al., 1998; Ferrage
et al., 2002). The PLA/talc blends have sharper peaks and higher values of intensity
when compared with the PLA/POM blends. The result suggests that talc is more
effective than POM on enhancing the crystallization of PLA, which is consistent with
the conclusion of the crystallization kinetics measured by DSC.
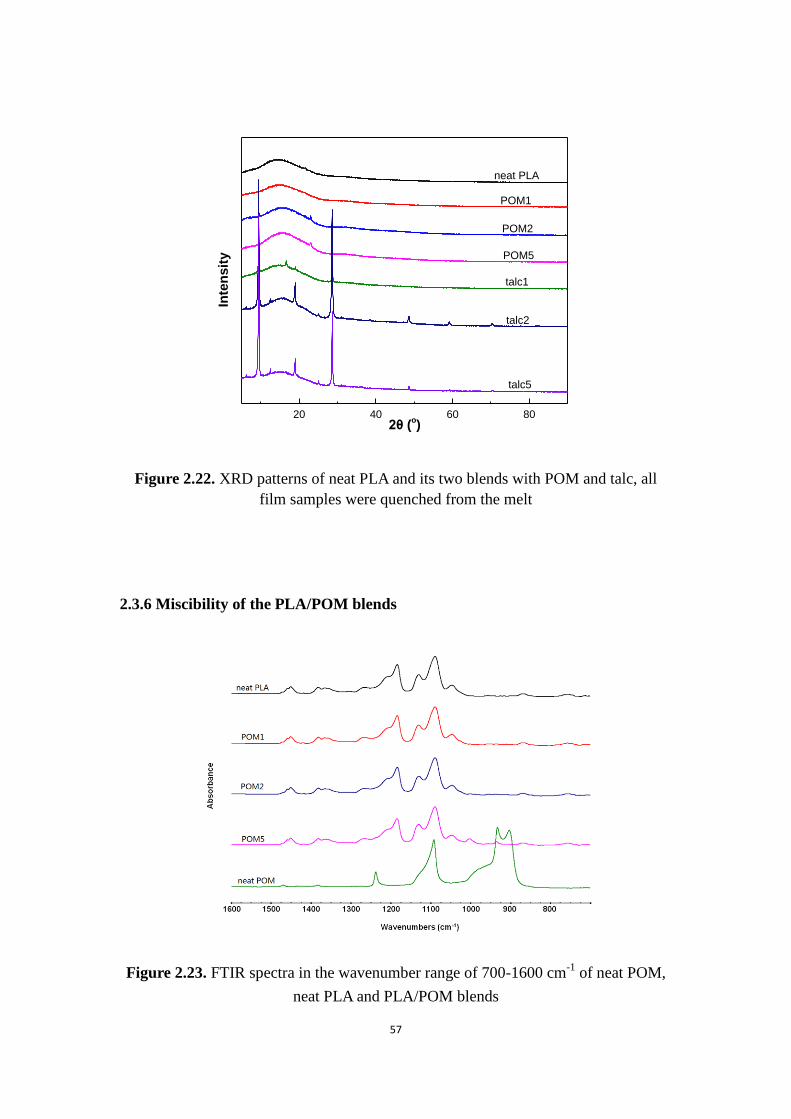
57
20 40 60 80
Inte
nsit
y
2θ (o)
neat PLA
POM1
POM2
POM5
talc1
talc2
talc5
Figure 2.22. XRD patterns of neat PLA and its two blends with POM and talc, all
film samples were quenched from the melt
2.3.6 Miscibility of the PLA/POM blends
Figure 2.23. FTIR spectra in the wavenumber range of 700-1600 cm-1
of neat POM,
neat PLA and PLA/POM blends
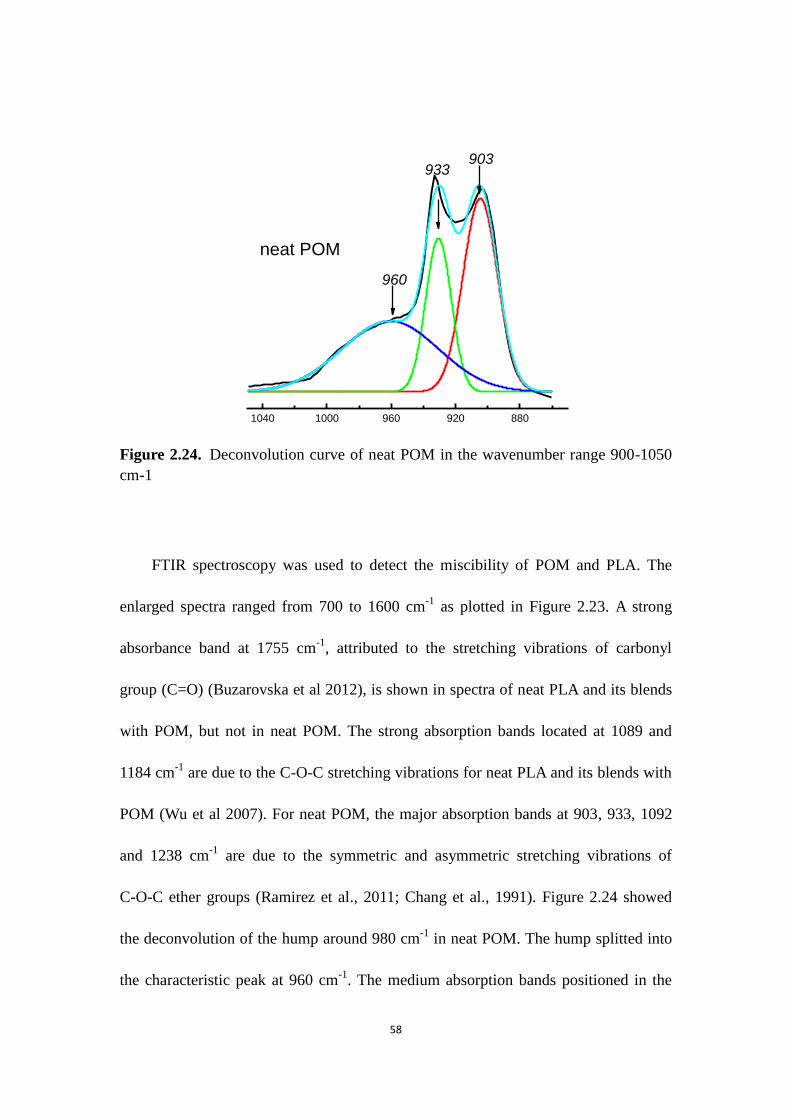
58
Figure 2.24. Deconvolution curve of neat POM in the wavenumber range 900-1050
cm-1
FTIR spectroscopy was used to detect the miscibility of POM and PLA. The
enlarged spectra ranged from 700 to 1600 cm-1
as plotted in Figure 2.23. A strong
absorbance band at 1755 cm-1
, attributed to the stretching vibrations of carbonyl
group (C=O) (Buzarovska et al 2012), is shown in spectra of neat PLA and its blends
with POM, but not in neat POM. The strong absorption bands located at 1089 and
1184 cm-1
are due to the C-O-C stretching vibrations for neat PLA and its blends with
POM (Wu et al 2007). For neat POM, the major absorption bands at 903, 933, 1092
and 1238 cm-1
are due to the symmetric and asymmetric stretching vibrations of
C-O-C ether groups (Ramirez et al., 2011; Chang et al., 1991). Figure 2.24 showed
the deconvolution of the hump around 980 cm-1
in neat POM. The hump splitted into
the characteristic peak at 960 cm-1
. The medium absorption bands positioned in the
1040 1000 960 920 880
903933
960
neat POM
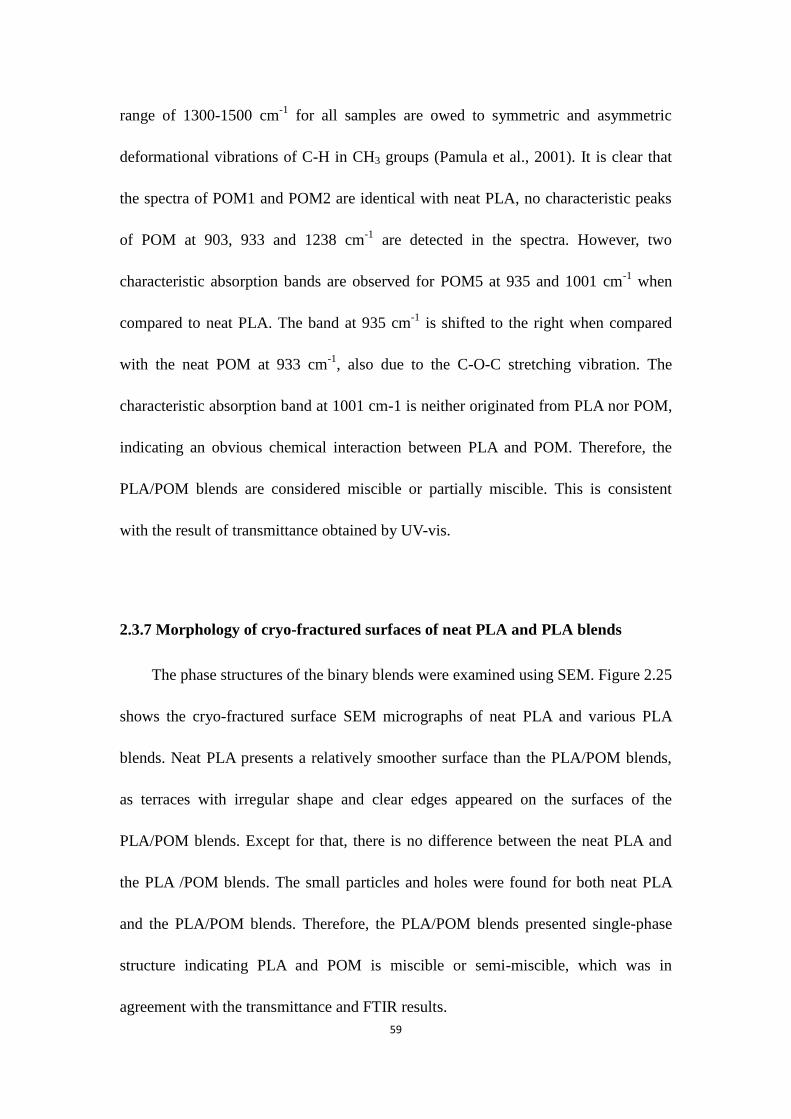
59
range of 1300-1500 cm-1
for all samples are owed to symmetric and asymmetric
deformational vibrations of C-H in CH3 groups (Pamula et al., 2001). It is clear that
the spectra of POM1 and POM2 are identical with neat PLA, no characteristic peaks
of POM at 903, 933 and 1238 cm-1
are detected in the spectra. However, two
characteristic absorption bands are observed for POM5 at 935 and 1001 cm-1
when
compared to neat PLA. The band at 935 cm-1
is shifted to the right when compared
with the neat POM at 933 cm-1
, also due to the C-O-C stretching vibration. The
characteristic absorption band at 1001 cm-1 is neither originated from PLA nor POM,
indicating an obvious chemical interaction between PLA and POM. Therefore, the
PLA/POM blends are considered miscible or partially miscible. This is consistent
with the result of transmittance obtained by UV-vis.
2.3.7 Morphology of cryo-fractured surfaces of neat PLA and PLA blends
The phase structures of the binary blends were examined using SEM. Figure 2.25
shows the cryo-fractured surface SEM micrographs of neat PLA and various PLA
blends. Neat PLA presents a relatively smoother surface than the PLA/POM blends,
as terraces with irregular shape and clear edges appeared on the surfaces of the
PLA/POM blends. Except for that, there is no difference between the neat PLA and
the PLA /POM blends. The small particles and holes were found for both neat PLA
and the PLA/POM blends. Therefore, the PLA/POM blends presented single-phase
structure indicating PLA and POM is miscible or semi-miscible, which was in
agreement with the transmittance and FTIR results.
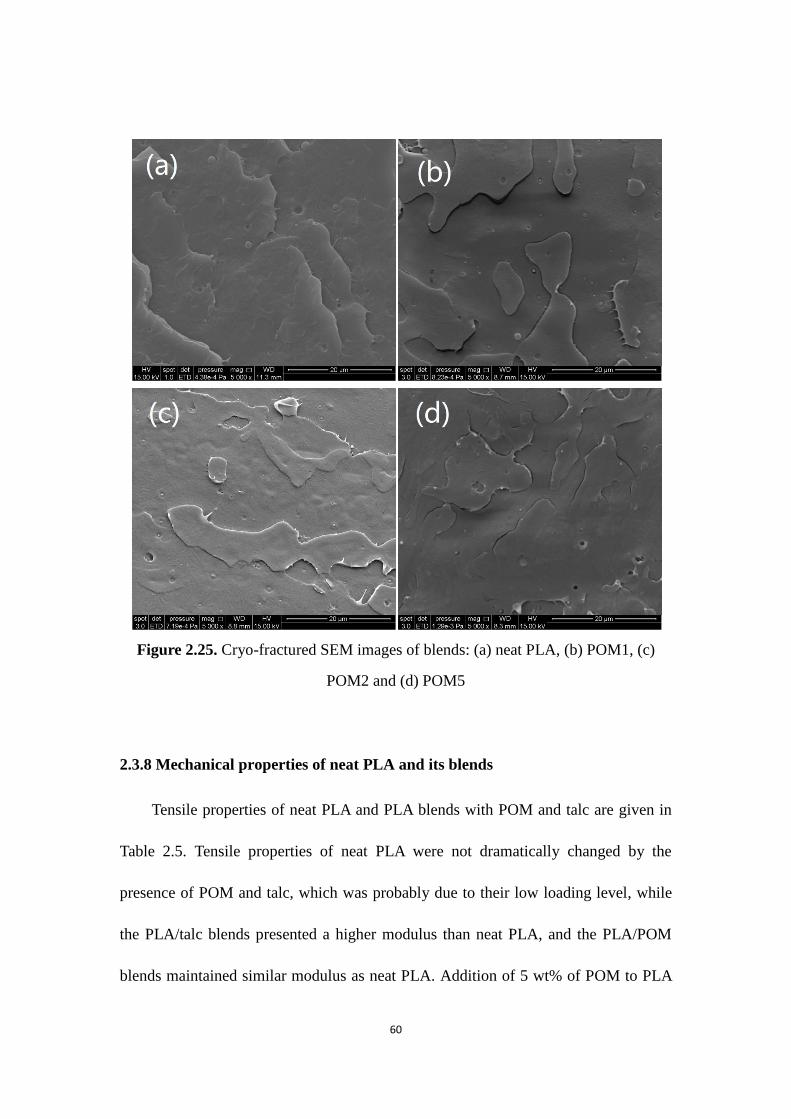
60
Figure 2.25. Cryo-fractured SEM images of blends: (a) neat PLA, (b) POM1, (c)
POM2 and (d) POM5
2.3.8 Mechanical properties of neat PLA and its blends
Tensile properties of neat PLA and PLA blends with POM and talc are given in
Table 2.5. Tensile properties of neat PLA were not dramatically changed by the
presence of POM and talc, which was probably due to their low loading level, while
the PLA/talc blends presented a higher modulus than neat PLA, and the PLA/POM
blends maintained similar modulus as neat PLA. Addition of 5 wt% of POM to PLA
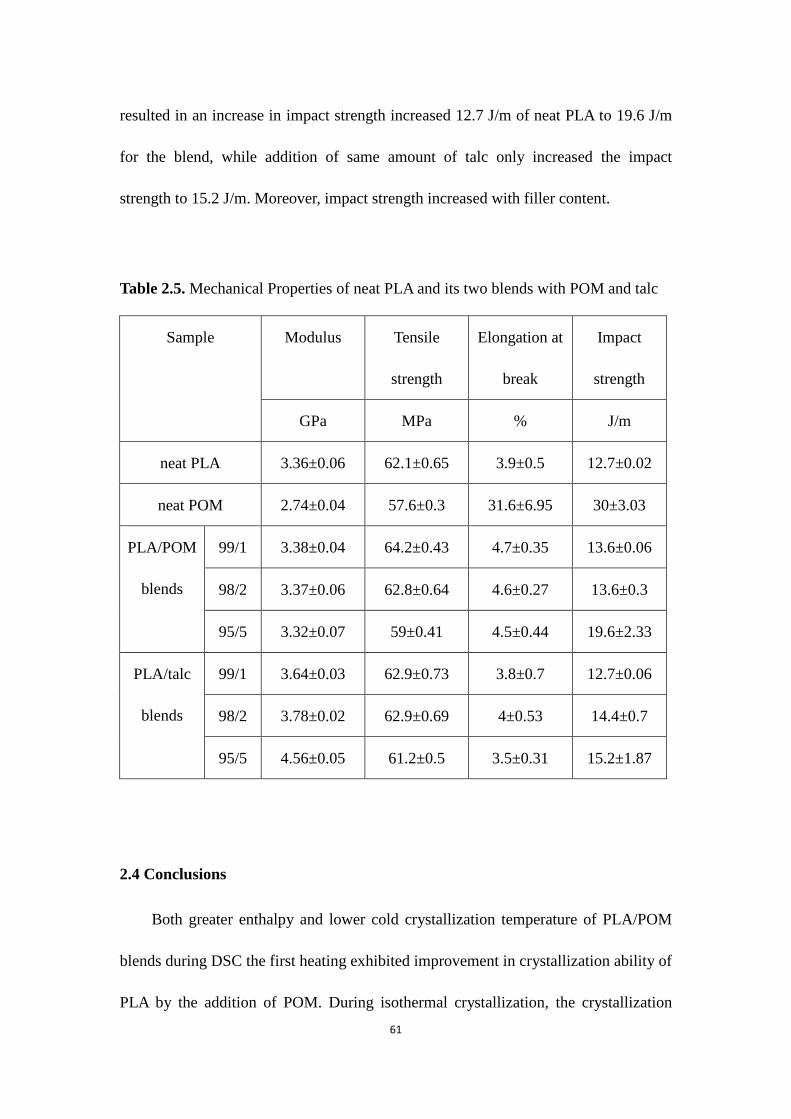
61
resulted in an increase in impact strength increased 12.7 J/m of neat PLA to 19.6 J/m
for the blend, while addition of same amount of talc only increased the impact
strength to 15.2 J/m. Moreover, impact strength increased with filler content.
Table 2.5. Mechanical Properties of neat PLA and its two blends with POM and talc
Sample Modulus Tensile
strength
Elongation at
break
Impact
strength
GPa MPa % J/m
neat PLA 3.36±0.06 62.1±0.65 3.9±0.5 12.7±0.02
neat POM 2.74±0.04 57.6±0.3 31.6±6.95 30±3.03
PLA/POM
blends
99/1 3.38±0.04 64.2±0.43 4.7±0.35 13.6±0.06
98/2 3.37±0.06 62.8±0.64 4.6±0.27 13.6±0.3
95/5 3.32±0.07 59±0.41 4.5±0.44 19.6±2.33
PLA/talc
blends
99/1 3.64±0.03 62.9±0.73 3.8±0.7 12.7±0.06
98/2 3.78±0.02 62.9±0.69 4±0.53 14.4±0.7
95/5 4.56±0.05 61.2±0.5 3.5±0.31 15.2±1.87
2.4 Conclusions
Both greater enthalpy and lower cold crystallization temperature of PLA/POM
blends during DSC the first heating exhibited improvement in crystallization ability of
PLA by the addition of POM. During isothermal crystallization, the crystallization
62
rate of PLA was improved by the presence of POM and talc. Moreover, talc is more
effective than POM in improving the crystallization rate of PLA. Well-defined banded
spherulites were observed for PLA/POM blends when the POM content was greater
than 5 wt%. PLA/POM blends exhibited higher transparency than both PLA and
PLA/talc blends indicating PLA/POM blends might be partially miscible. XRD
results displayed that PLA/POM blends reserved the characteristic peaks of PLA and
POM without forming any new peak, exhibiting the crystal structure of PLA was not
changed by the presence of POM. The distinct characteristic peaks at 1001 cm-1
of
PLA/POM blends in FTIR spectra indicated obvious chemical interactions between
PLA and POM, exhibiting PLA/POM blends were partially miscible consistent with
the transparency results. PLA/POM blends presented smooth and homogenous
surfaces. Besides modulus of PLA were increased by the presence of both POM and
talc.
63
Reference
Kawamoto, N.; Sakai, A.; Horikohi, T., “Nucleating agent for poly(L-lactic acid)-An
optimization of chemical structure of hydrazide compound for advanced nucleation
ability.” Journal of Applied Polymer Science, (2007) 103 (1): 198-203.
Defosse, M., Modern Plastics, January 1, 2005.
Kawamoto, N.; Tobita, E.; Goman, P., Polyolefins 2003; Society of Plastics Engineers:
Houston, TX, 2003.
Funamizu, T.; Goman, P.; Kawamoto, N.’ Polyolefins 2005; Society of Plastics
Engineers: Houston, TX, 2005.
Nakajima, H.; Takahashi, M.; Kimura Y., “Induced Crystallization of PLLA in the
Presence of 1,3,5-Benzenetricarboxylamide Derivatives as Nucleators: Preparation of
Haze-Free Crystalline PLLA Materials.” Macromol. Mater. Eng., (2010) 295:
460-468.
Maiti, P.; Nam, P. H.; Okamoto, M., “Crystallization on Intercalation, Morphology,
and Mechanical Properties of Polypropylene/Clay Nanocomposites.” Macromolecules,
(2002) 35: 2042-2049.
Gagnon, K. D.; Lenz, R. W.; Farris, R. J.; Fuller, R. C., “Crystallization behavior and
its influence on the mechanical properties of a thermoplastic elastomer produced by
Pseudomonas oleovorans.” Macromolecules (1992) 25: 3723-3728.
Tang, Z.; Zhang, C.; Liu, X., “The Crystallization Behavior and mechanical Properties
of Polylactic Acid in the Presence of Crystal Nucleating Agent.” Journal of Applied
Polymer Science, (2011).
Shi, Q. F.; Mou, H. Y.; Li, Q. Y., “Influence of Heat Treatment on the Heat Distortion
Temperature of Poly(lactic acid)/Bamboo Fiber/Talc Hybrid Biocomposites.” Journal
of Applied Polymer Science, (2012) 123: 2828-2836.
Garlotta, D., “A Literature Review of Poly(Lactic Acid).” Journal of Polymers and the
Environment, (2001) 9: 63-84.
Barrau, S.; Vanmansart, C.; Moreau, M., “Crystalliztion Behavior of Carbon
Nanotube-Polylactide Nanocomposites.” Macromolecules, (2011) 44: 6496-6502.
Wunderlich, B., Macromolecular Physics; Academic Press: New York, 1977; Vol. 2.
Liu, T.; Mo, Z.; Wang, S., “Nonisothermal melt and cold crystallization kinetics of
64
poly(aryl ether ether ketone ketone).” Polymer Engineering & Science, (1997) 37 (3):
568-575
Dell’Erba, R.; Groeninckx, G.; Maglio, G., “Immiscible polymer blends of
semicrystalline biocompatible components: thermal properties and phase morphology
analysis of PLLA/PCL blends.” Polymer, (2001) 42: 7831-7840
Khanna, Y., “A barometer of crystallization rates of polymeric materials.” Polymer
Engineering & Science, (1990) 30 (24): 1615-1619.
Liu, T.; Lin, W.; Yang, M., “Miscibility, thermal characterization and crystallization of
poly(L-lactide) and poly(tetramethylene adipate-co-terephthalate) blend membranes.”
Polymer, (2005) 46: 12586-12594.
Rafael, A., Poly(lactic acid): synthesis, structure, properties, processing, and
Application; Loong-Tak, Lim; Wiley, 2010: 508
O’shea, S.; Swettenhan, K.; Revell, P. “A sipme optical method for the differentiation
of two types of polymeric wear debris in tissue samples.” Journal of Material Science:
Materials in Medicine (1992) 3 (6): 391-396.
Kutz, M., Applied Plastics Engineering Handbook: Processing and Materials. Elsevier.
2011: 463
Dusek, K., Polymer Characterization: Rheology, Laser Interferometry, Electrooptics.
Springer. 2010: 280
Philip, M., Technology of Engineering Materials. Elsevier. 2002: 471
Buzarovska, A.; Grozdanov, A., “Biodegradable Poly(L-lactic acid)/TiO2
Nanocomposites: Thermal Properties and Degradation.” Journal of Applied Polymer
Science, (2012) 123: 2187-2193.
Wu, D.; Wu, L.; Wu, L., “Nonisothermal Cold crystallization Behavior and Kinetics
of Polylactide/Clay Nanocomposites.” Journal of Polymer Science: Part B: Physics,
(2007) 45: 1100-1113.
Ramirez, N. V.; Sanchez-Soto, M.; Illescas, S., “Enhancement of POM
Thermooxidation Resistance Through POSS Nanoparticles.” Polymer Composites,
2011: 1584-1592.
Chang, F.; Yang, M.; Wu, J., “Blends of Polycarbonate and Polyacetal.” Polymer,
(1991) 32 (8): 1394-1400.
65
Pamula, E.; Blazewicz, M.; Paluszkiewicz, C.; Dobrzynski, P., “FTIR study of
degradation products of aliphatic polyesters-carbon fibers composites.” Journal of
Molecular Structure, (2001) 596: 69-75.
Tsuji, H.; Tashiro, K.; Bouapao, L., “Synchronous and separate homo-crystallization
of enantiomeric poly(L-lactic acid)/poly(D-lactic acid) blends.” (2011) 53: 747-754.
Wang, J.; Hu, K. H.; Xu Y. F., “Structural, Thermal, and Tribological Properties of
Intercalated Polyoxymethylene/Molybdenum Disulfied Nanocomposites.” Journal of
Applied Polymer Science, (2008) 110: 91-96.
Li, K.; Xiang, D.; Lei, X., “Green and Self-Lubricating Polyoxymethylene
Composites Filled with Low-Density Polyethylene and Rice Husk Flour.” Journal of
Applied Polymer Science, (2008) 108: 2778-2786.
Kano, J.; Saito, F., “Correlation of Powder characteristics of talc during Planetary Ball
Milling with the impact energy of the balls stimulated by the Particle Element
Method.” Powder Technology, (1998) 98: 166-170.
Ferrage, E.; Martin, F., “Talc as nucleating agent of polypropylene morphology
induced by lamellar particles addition and interface mineral-matrix modelization.”
Journal of Materials Science, (2002) 37: 1561-1573.
66
Chapter 3 Properties and structure of PLA/POM blends
with excellent heat resistance
Abstract
The thermodynamic properties and phase morphology were examined using
dynamic mechanical analysis (DMA), differential scanning calorimetry (DSC) and the
scanning electron microscopy (SEM). Heat deflection temperature (HDT) of
poly(lactic acid) (PLA) was improved by incorporating polyoxymethylene (POM), a
highly crystalline polymer with excellent heat resistance. The HDT of neat PLA was
increased nearly 2-fold from 65.5 oC to 133
oC by adding 50 wt% POM. Fourier
transform infrared spectroscopy (FTIR) and the Fox equation was used to identify the
miscibility of the PLA/POM blends and found that the PLA/POM blends are partially
miscible. The toughening effect of two type of elastomers based on the PLA/POM
blend (50/50), viz, thermoplastic polyurethane (TPU) and poly(ethylene-glycidyl
methacrylate) (EGMA) were investigated in detail in this study. The experimental
results suggested that TPU was more effective in toughening the PLA/POM blend
than EGMA.
Keyword: heat deflection temperature, miscibility, toughening, mechanical properties
67
3.1 Introduction
Poly(lactic acid) is a biodegradable polymer derived from renewable resources.
The biodegradability and biocompatibility envisions PLA as a promising alternative to
traditional petroleum-based polymers. Despites many advantages of PLA such as high
tensile strength and modulus, the inherent brittleness (poor impact strength and
elongation at break) and the low HDT extremely limit the application of PLA as
engineering plastics. Several papers have reported that the blends of PLA with
poly(ε-caprolactone) (PCL), poly(butylene adipate-co-terephthalate) (PBAT),
poly(butylenes succinate) (PBS) and poly(hydroxyl butyrate) (PHB) improve the
toughness and elongation of PLA (Nanda et al., 2011; Broz et al., 2003; Semba et al.,
2006; and Zhang et al., 2009). The impact strength is improved to a degree but is still
not enough for PLA to be used as engineering plastics.
HDT of PLA is very low and is known to be around Tg (60 oC), because the
crystallinity is very low under practical molding conditions due to the low
crystallization rate of PLA at a high cooling rate (Baiardo et al., 2003; Tsuji et al.,
1995; Jiang et al., 2007; and Liu et al., 2011). Currently, two primary methods are
used to improve the HDT of PLA. The first method is to obtain a stereocomplex by
adding PDLA homopolymer into PLLA (Brizzolara et al., 1996). The stereocomplex
is 1:1 complex of PDLA and PLLA. The improvement of HDT is ascribed to the
higher crystallinity of the stereocomplex than those of PLLA and PDLA. However,
the stereocomplex requires long cycle time to form, and PDLA is not commercially
68
available at a viable cost. The second method is to increase the crystallinity by adding
a nucleating agent into PLA. The addition of an appropriate nucleating agent to the
semicrystalline polymer increases the crystallization rate and maintains even increases
the mechanical properties as well (Angela et al., 2008). In this research, POM is
chosen to blend with PLA to increase the HDT of PLA. There have been no studies
which blend PLA with POM and study the effects of POM on HDT yet. The primary
reason for choosing POM is that POM presents very high HDT at about 160 oC at
0.46 MPa. In addition, the melting temperature of POM (175 oC) is close to that of
PLA, which makes it easier to blends PLA with POM through melting extrusion.

69
3.2 Experimental
3.2.1 Materials
All the materials used in this study are listed in Table 3.1
Table 3.1. Characteristics of materials in this study
Materials
(abbreviation)
Grade
(supplier)
Specifications
Poly(lactic acid)
(PLA)
PLA 2002D
(NatureWorks)
MI(201 oC, 2.16kg) =
5~7g/10min
Specific Gravity = 1.24
Polyoxymethylene
(POM)
RTP 800
(RTP Co.)
Specific Gravity = 1.41
Thermoplastic
Polyurethane
(TPU)
Elastollan C95A10
(BASF Co.)
Specific Gravity = 1.21
Poly(ethylene-glycidyl
methacrylate)
(EGMA)
IGETABONDTM
(Sumitomo Chemical Co.)
MI (190 oC, 2.16kg) = 12
g/10 min
Specific Gravity = 0.94
All materials in this study were used as received without further purification.
3.2.2 Preparation of the PLA/POM blends
Prior to extrusion, all pellets were dried at least 1 day at 85 oC in a convection
oven to remove moisture in the samples. PLA and the fillers were premixed manually
through tumbling in a sealed plastic bag. A co-rotating twin-screw extruder (Leistritz
ZSE-18) equipped with a volumetric feeder and a pelletizer was used to prepare the
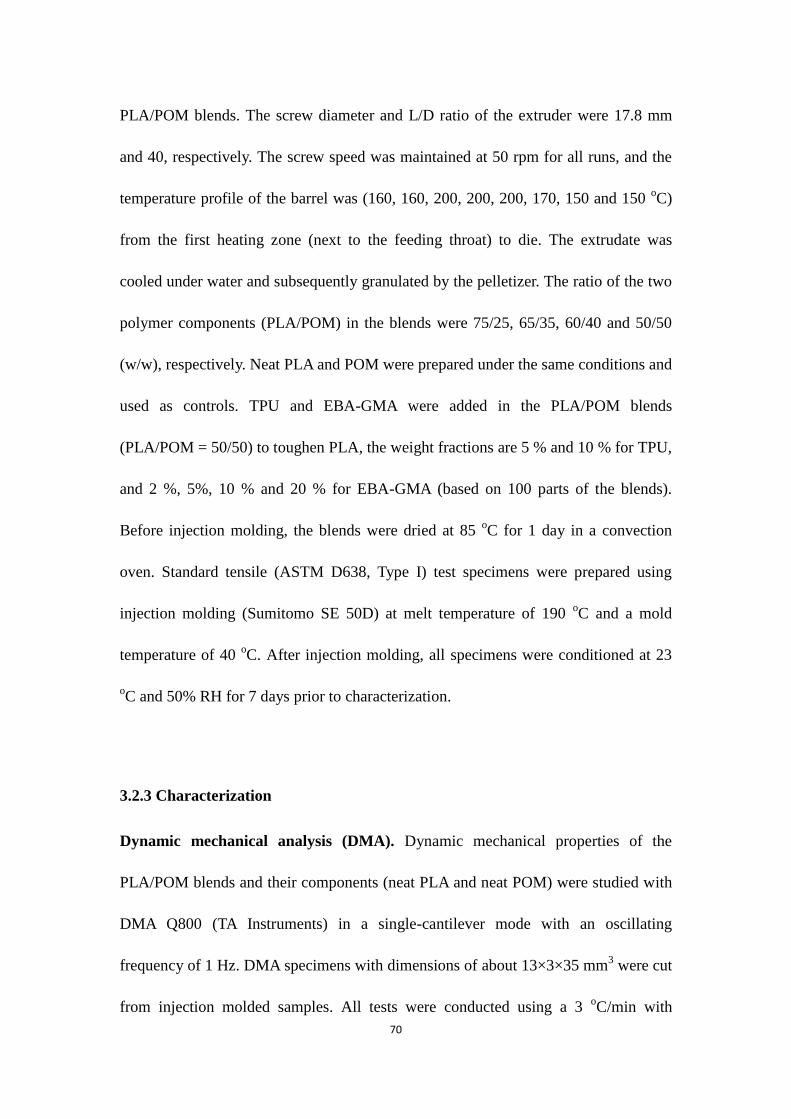
70
PLA/POM blends. The screw diameter and L/D ratio of the extruder were 17.8 mm
and 40, respectively. The screw speed was maintained at 50 rpm for all runs, and the
temperature profile of the barrel was (160, 160, 200, 200, 200, 170, 150 and 150 oC)
from the first heating zone (next to the feeding throat) to die. The extrudate was
cooled under water and subsequently granulated by the pelletizer. The ratio of the two
polymer components (PLA/POM) in the blends were 75/25, 65/35, 60/40 and 50/50
(w/w), respectively. Neat PLA and POM were prepared under the same conditions and
used as controls. TPU and EBA-GMA were added in the PLA/POM blends
(PLA/POM = 50/50) to toughen PLA, the weight fractions are 5 % and 10 % for TPU,
and 2 %, 5%, 10 % and 20 % for EBA-GMA (based on 100 parts of the blends).
Before injection molding, the blends were dried at 85 oC for 1 day in a convection
oven. Standard tensile (ASTM D638, Type I) test specimens were prepared using
injection molding (Sumitomo SE 50D) at melt temperature of 190 oC and a mold
temperature of 40 oC. After injection molding, all specimens were conditioned at 23
oC and 50% RH for 7 days prior to characterization.
3.2.3 Characterization
Dynamic mechanical analysis (DMA). Dynamic mechanical properties of the
PLA/POM blends and their components (neat PLA and neat POM) were studied with
DMA Q800 (TA Instruments) in a single-cantilever mode with an oscillating
frequency of 1 Hz. DMA specimens with dimensions of about 13×3×35 mm3 were cut
from injection molded samples. All tests were conducted using a 3 oC/min with
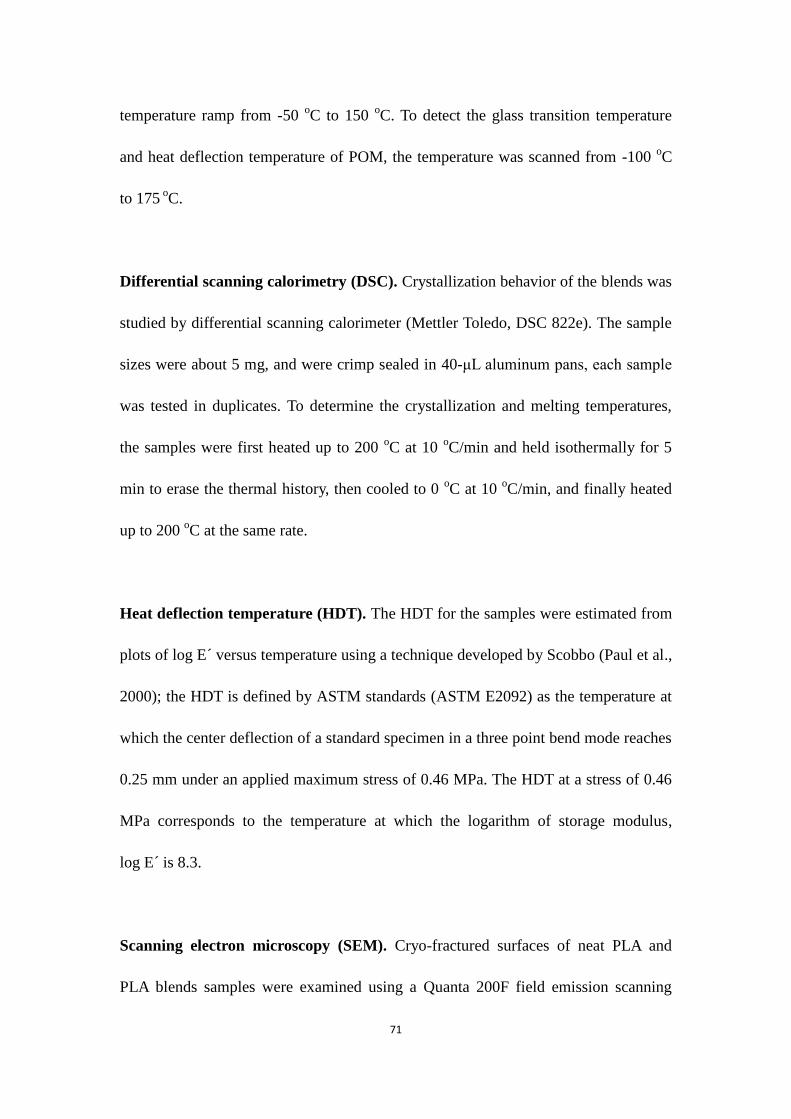
71
temperature ramp from -50 oC to 150
oC. To detect the glass transition temperature
and heat deflection temperature of POM, the temperature was scanned from -100 oC
to 175 oC.
Differential scanning calorimetry (DSC). Crystallization behavior of the blends was
studied by differential scanning calorimeter (Mettler Toledo, DSC 822e). The sample
sizes were about 5 mg, and were crimp sealed in 40-μL aluminum pans, each sample
was tested in duplicates. To determine the crystallization and melting temperatures,
the samples were first heated up to 200 oC at 10
oC/min and held isothermally for 5
min to erase the thermal history, then cooled to 0 oC at 10
oC/min, and finally heated
up to 200 oC at the same rate.
Heat deflection temperature (HDT). The HDT for the samples were estimated from
plots of log E ́versus temperature using a technique developed by Scobbo (Paul et al.,
2000); the HDT is defined by ASTM standards (ASTM E2092) as the temperature at
which the center deflection of a standard specimen in a three point bend mode reaches
0.25 mm under an applied maximum stress of 0.46 MPa. The HDT at a stress of 0.46
MPa corresponds to the temperature at which the logarithm of storage modulus,
log E ́is 8.3.
Scanning electron microscopy (SEM). Cryo-fractured surfaces of neat PLA and
PLA blends samples were examined using a Quanta 200F field emission scanning
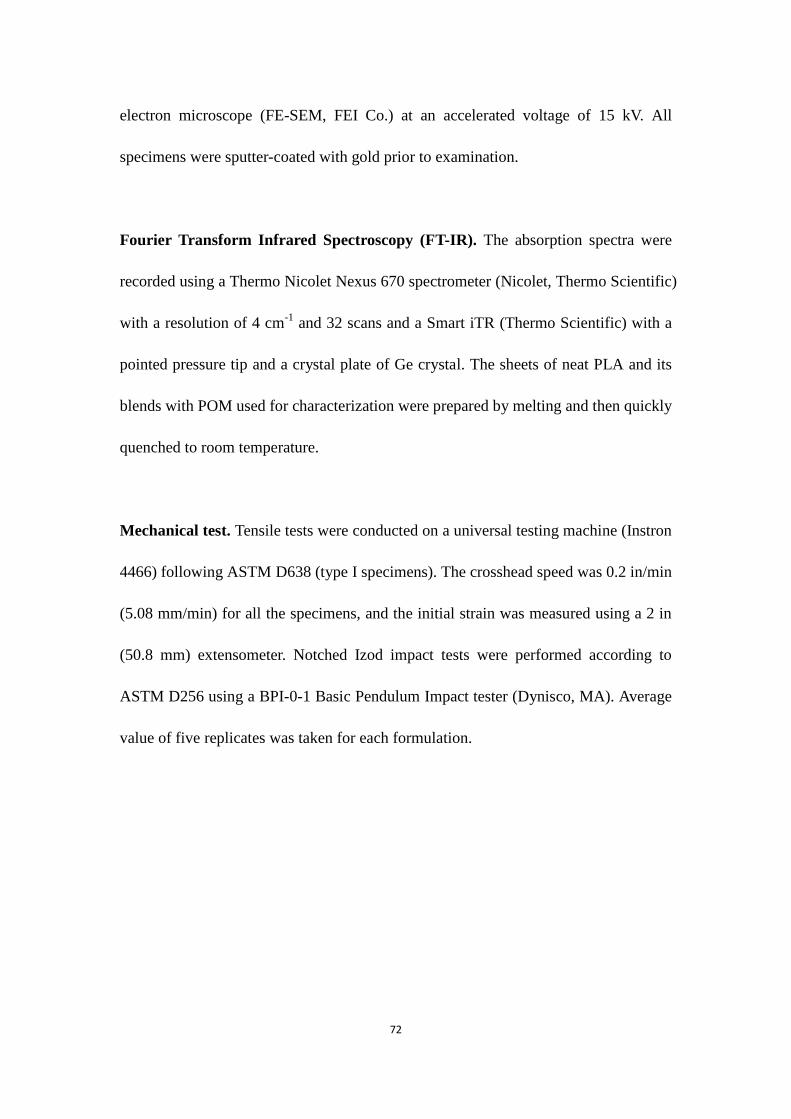
72
electron microscope (FE-SEM, FEI Co.) at an accelerated voltage of 15 kV. All
specimens were sputter-coated with gold prior to examination.
Fourier Transform Infrared Spectroscopy (FT-IR). The absorption spectra were
recorded using a Thermo Nicolet Nexus 670 spectrometer (Nicolet, Thermo Scientific)
with a resolution of 4 cm-1
and 32 scans and a Smart iTR (Thermo Scientific) with a
pointed pressure tip and a crystal plate of Ge crystal. The sheets of neat PLA and its
blends with POM used for characterization were prepared by melting and then quickly
quenched to room temperature.
Mechanical test. Tensile tests were conducted on a universal testing machine (Instron
4466) following ASTM D638 (type I specimens). The crosshead speed was 0.2 in/min
(5.08 mm/min) for all the specimens, and the initial strain was measured using a 2 in
(50.8 mm) extensometer. Notched Izod impact tests were performed according to
ASTM D256 using a BPI-0-1 Basic Pendulum Impact tester (Dynisco, MA). Average
value of five replicates was taken for each formulation.

73
3.3 Results and discussion
3.3.1 Thermodynamic properties of the PLA/POM blends
-50 0 50 100 150
0
1000
2000
3000
4000
Sto
rag
e M
od
ulu
s (
MP
a)
Temperature (oC)
PLA
POM25
POM35
POM40
POM50
POM
(a)
-50 0 50 100 150
0
100
200
300
400
500
600
700
Lo
ss M
od
ulu
s (
MP
a)
Temperature (oC)
PLA
POM25
POM35
POM40
POM50
POM
(b)
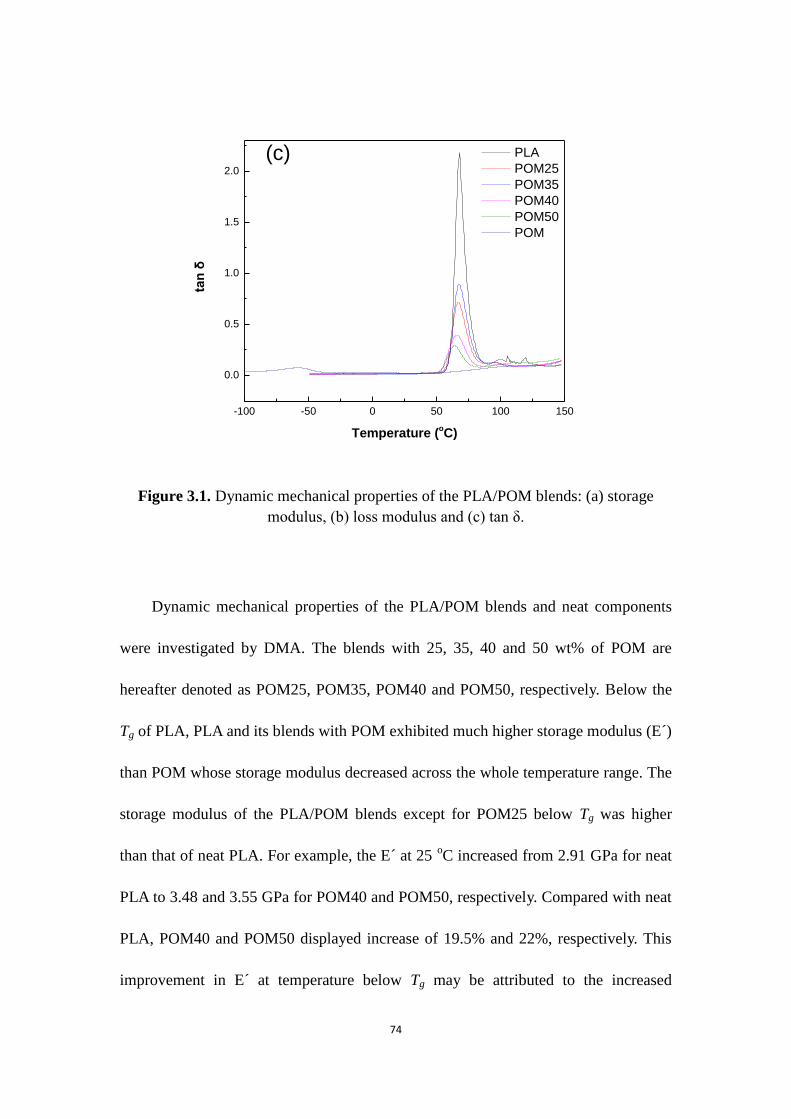
74
PLA
POM25
POM35
POM40
POM50
POM
-100 -50 0 50 100 150
0.0
0.5
1.0
1.5
2.0
tan
δ
Temperature (oC)
(c)
Figure 3.1. Dynamic mechanical properties of the PLA/POM blends: (a) storage
modulus, (b) loss modulus and (c) tan δ.
Dynamic mechanical properties of the PLA/POM blends and neat components
were investigated by DMA. The blends with 25, 35, 40 and 50 wt% of POM are
hereafter denoted as POM25, POM35, POM40 and POM50, respectively. Below the
Tg of PLA, PLA and its blends with POM exhibited much higher storage modulus (E )́
than POM whose storage modulus decreased across the whole temperature range. The
storage modulus of the PLA/POM blends except for POM25 below Tg was higher
than that of neat PLA. For example, the E ́at 25 oC increased from 2.91 GPa for neat
PLA to 3.48 and 3.55 GPa for POM40 and POM50, respectively. Compared with neat
PLA, POM40 and POM50 displayed increase of 19.5% and 22%, respectively. This
improvement in E ́ at temperature below Tg may be attributed to the increased
75
crystallinity of PLA blends by the presence of POM, indicating that POM can enhance
the stiffness of PLA. At the glass transition, E’ of PLA and the PLA/POM blends
precipitated sharply around 60 oC. The loss moduli of neat PLA and the PLA/POM
blends increase around 60 oC, as shown in Figure 3.1(b), and this is in agreement with
the storage modulus data. An increase of E ́was noted around 110 oC for neat PLA
and the PLA/POM blends, which was due to the PLA cold crystallization. The
increase in E ́ induced by the cold crystallization is more distinct and occurs at
relatively low temperature in the PLA/POM blends because the presence of POM
increase the crystallization rate of PLA.
Figure 3.1(c) shows the loss factors (tan δ) of the PLA/POM blends and the pure
components as a function of temperature, where the ratio of loss modulus to storage
modulus gives the tangent of the phase angle delta, a measure of energy dissipation.
The tan δ peak position corresponding to the Tg and the peak height values are
presented in Table 3.2. Tg of the blends gradually decreased as the POM content in the
blends increased, ranging from Tg = 68 oC of neat PLA to Tg = 63.5
oC for PLA in
POM50. This result suggests POM was partially dissolved in the PLA phase, leading
to the depression of Tg. The Fox equation can be used to estimate the partial
miscibility (Fox et al., 1956).
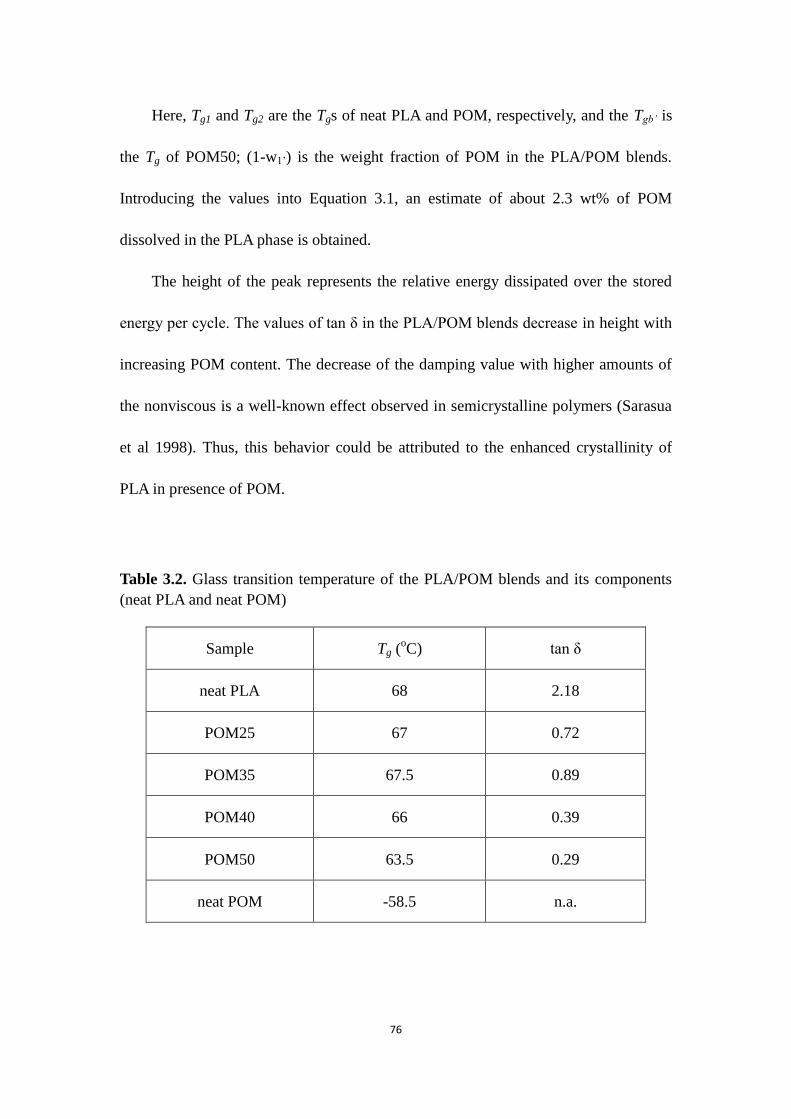
76
Here, Tg1 and Tg2 are the Tgs of neat PLA and POM, respectively, and the Tgb’ is
the Tg of POM50; (1-w1’) is the weight fraction of POM in the PLA/POM blends.
Introducing the values into Equation 3.1, an estimate of about 2.3 wt% of POM
dissolved in the PLA phase is obtained.
The height of the peak represents the relative energy dissipated over the stored
energy per cycle. The values of tan δ in the PLA/POM blends decrease in height with
increasing POM content. The decrease of the damping value with higher amounts of
the nonviscous is a well-known effect observed in semicrystalline polymers (Sarasua
et al 1998). Thus, this behavior could be attributed to the enhanced crystallinity of
PLA in presence of POM.
Table 3.2. Glass transition temperature of the PLA/POM blends and its components
(neat PLA and neat POM)
Sample Tg (oC) tan δ
neat PLA 68 2.18
POM25 67 0.72
POM35 67.5 0.89
POM40 66 0.39
POM50 63.5 0.29
neat POM -58.5 n.a.

77
0 50 100 150
He
at
flo
w (
W/g
)
Temperature (oC)
neat PLA
POM25
POM35
POM40
POM50
^exo
Figure 3.2. First cooling DSC curves of the PLA/POM blends
Table 3.3. DSC parameters of cooling and crystallinity for the PLA/POM blends
Sample Tm,c (oC) c (%)
neat PLA n.a. n.a.
POM25 133.5 11.7
POM35 130.8 8.6
POM40 136 17.1
POM50 140 28
78
As shown in chapter 2, the crystallization rate of neat PLA is very slow and the
half-time of crystallization is in the range of 7.3 – 12.6 min. POM is an effective
nucleating agent in the process of PLA crystallization, the half-time of crystallization
during isothermal crystallization at 111 oC was decreased nearly 5-fold by adding 5%
POM. In this chapter, the effect of high POM content on the crystallization behavior
of PLA was studied through DSC. Figure 3.2 shows the first cooling curves of the
PLA/POM blends. The crystallinity ( c) was calculated according to the following
equation:
Where ΔHm is the enthalpy of melting crystallization during cooling scan; ΔHm is the
enthalpy assuming 100% crystalline PLA (93.7 J/g), and Wf is the weight fraction of
PLA component in the blends. The DSC parameters are listed in Table 3.3.
As expected, POM greatly enhances the crystallization of PLA since obvious
exotherms were observed during cooling process, while no exotherm was detected for
neat PLA. Table 3.3 shows that the crystallinity increases with POM content, for
example, the crystallinity of POM25 increased nearly 3-fold from 11.7% to 28% of
POM50. The noticeable increase of cystallinity suggests that the high POM content
steeply improves the crystallization ability of PLA.
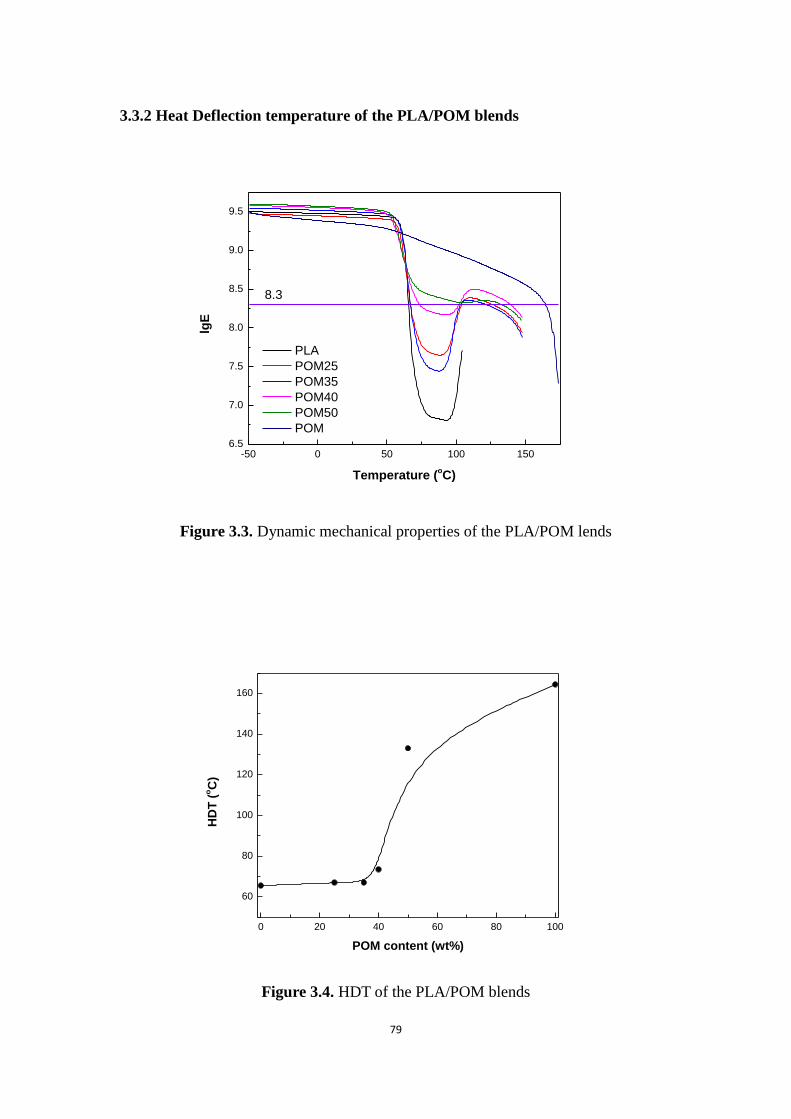
79
3.3.2 Heat Deflection temperature of the PLA/POM blends
PLA
POM25
POM35
POM40
POM50
POM
-50 0 50 100 1506.5
7.0
7.5
8.0
8.5
9.0
9.5
lgE
Temperature (oC)
8.3
Figure 3.3. Dynamic mechanical properties of the PLA/POM lends
0 20 40 60 80 100
60
80
100
120
140
160
HD
T (
oC
)
POM content (wt%)
Figure 3.4. HDT of the PLA/POM blends

80
Table 3.4. HDT of PLA, POM and their blends
Sample HDT (oC) at 8.3
neat PLA 65.5
POM25 67
POM35 67
POM40 73.5
POM50 133
neat POM 164.4
The dynamic mechanical properties of samples were studied to indicate the
influence of POM on heat deflection temperature (HDT) in the PLA blends, since
HDT represents the ability of polymeric material to withstand loads at elevated
temperature. The HDT values of polymer also could be estimated by DMA results
(Paul et al 2000). The HDT of the PLA/POM blends at a stress of 0.46 MPa
corresponds to the temperature when the logarithm of storage modulus (Pa; log E’) is
8.3 and is plotted in Figure 3.3. The trend of HDT versus POM content was showed in
Figure 3.4. As expected, the HDT of PLA/POM blends increases with POM content
and is greater than that of neat PLA. The HDT was barely raised by adding 25 and 35
wt% POM and started to noticeably increase when the addition of POM larger than 40
wt%. The HDT values of the PLA/POM blends are listed in Table 3.4. The HDT of
neat PLA and POM are 65.5 and 164.4 oC, respectively which corresponds to the
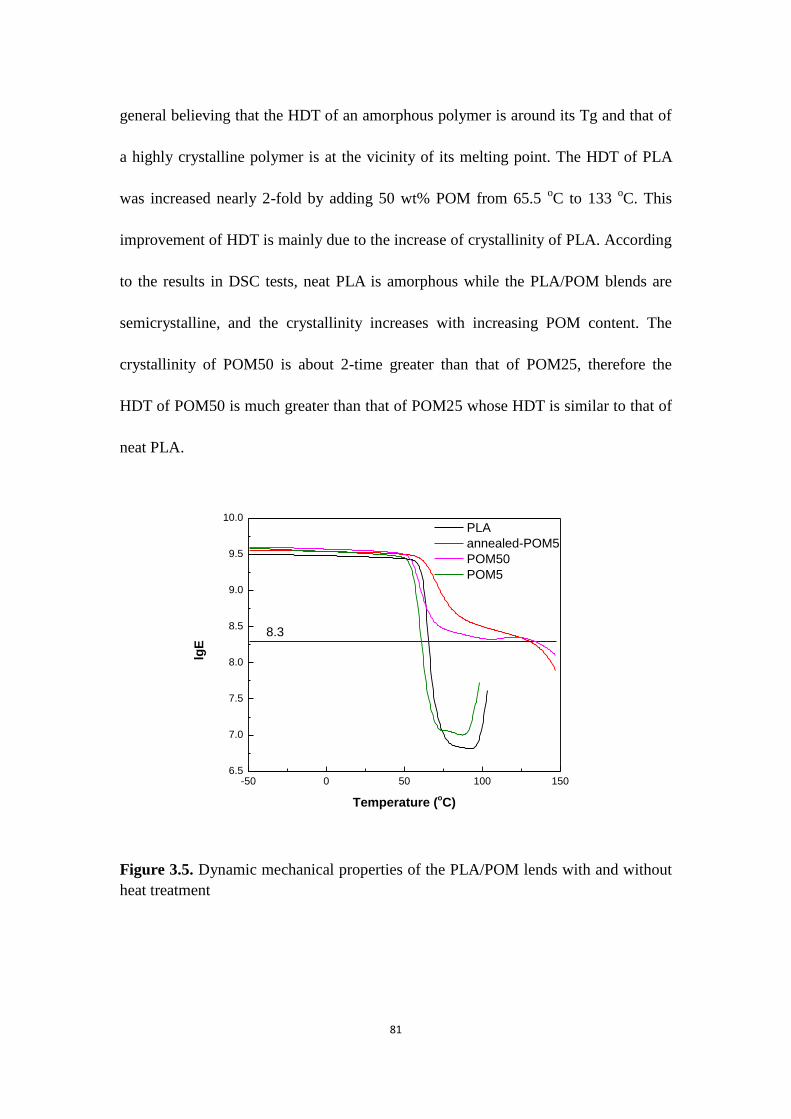
81
general believing that the HDT of an amorphous polymer is around its Tg and that of
a highly crystalline polymer is at the vicinity of its melting point. The HDT of PLA
was increased nearly 2-fold by adding 50 wt% POM from 65.5 oC to 133
oC. This
improvement of HDT is mainly due to the increase of crystallinity of PLA. According
to the results in DSC tests, neat PLA is amorphous while the PLA/POM blends are
semicrystalline, and the crystallinity increases with increasing POM content. The
crystallinity of POM50 is about 2-time greater than that of POM25, therefore the
HDT of POM50 is much greater than that of POM25 whose HDT is similar to that of
neat PLA.
PLA
annealed-POM5
POM50
POM5
-50 0 50 100 1506.5
7.0
7.5
8.0
8.5
9.0
9.5
10.0
lgE
Temperature (oC)
8.3
Figure 3.5. Dynamic mechanical properties of the PLA/POM lends with and without
heat treatment
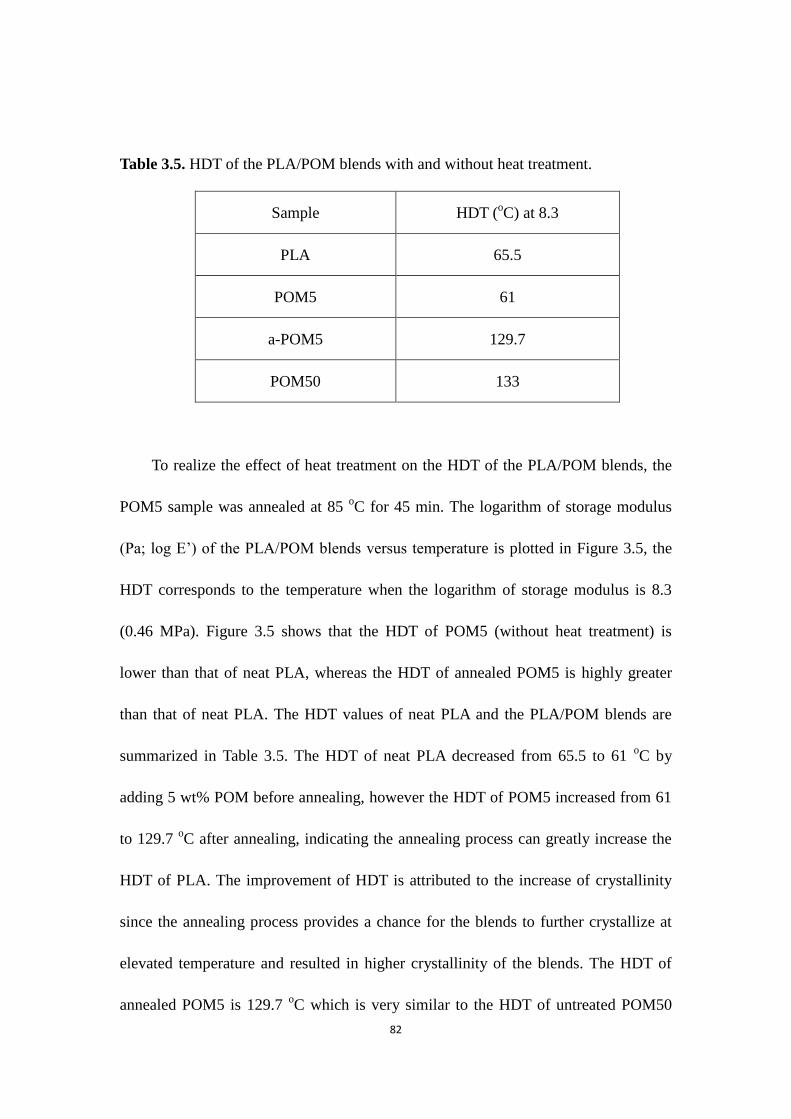
82
Table 3.5. HDT of the PLA/POM blends with and without heat treatment.
Sample HDT (oC) at 8.3
PLA 65.5
POM5 61
a-POM5 129.7
POM50 133
To realize the effect of heat treatment on the HDT of the PLA/POM blends, the
POM5 sample was annealed at 85 oC for 45 min. The logarithm of storage modulus
(Pa; log E’) of the PLA/POM blends versus temperature is plotted in Figure 3.5, the
HDT corresponds to the temperature when the logarithm of storage modulus is 8.3
(0.46 MPa). Figure 3.5 shows that the HDT of POM5 (without heat treatment) is
lower than that of neat PLA, whereas the HDT of annealed POM5 is highly greater
than that of neat PLA. The HDT values of neat PLA and the PLA/POM blends are
summarized in Table 3.5. The HDT of neat PLA decreased from 65.5 to 61 oC by
adding 5 wt% POM before annealing, however the HDT of POM5 increased from 61
to 129.7 oC after annealing, indicating the annealing process can greatly increase the
HDT of PLA. The improvement of HDT is attributed to the increase of crystallinity
since the annealing process provides a chance for the blends to further crystallize at
elevated temperature and resulted in higher crystallinity of the blends. The HDT of
annealed POM5 is 129.7 oC which is very similar to the HDT of untreated POM50
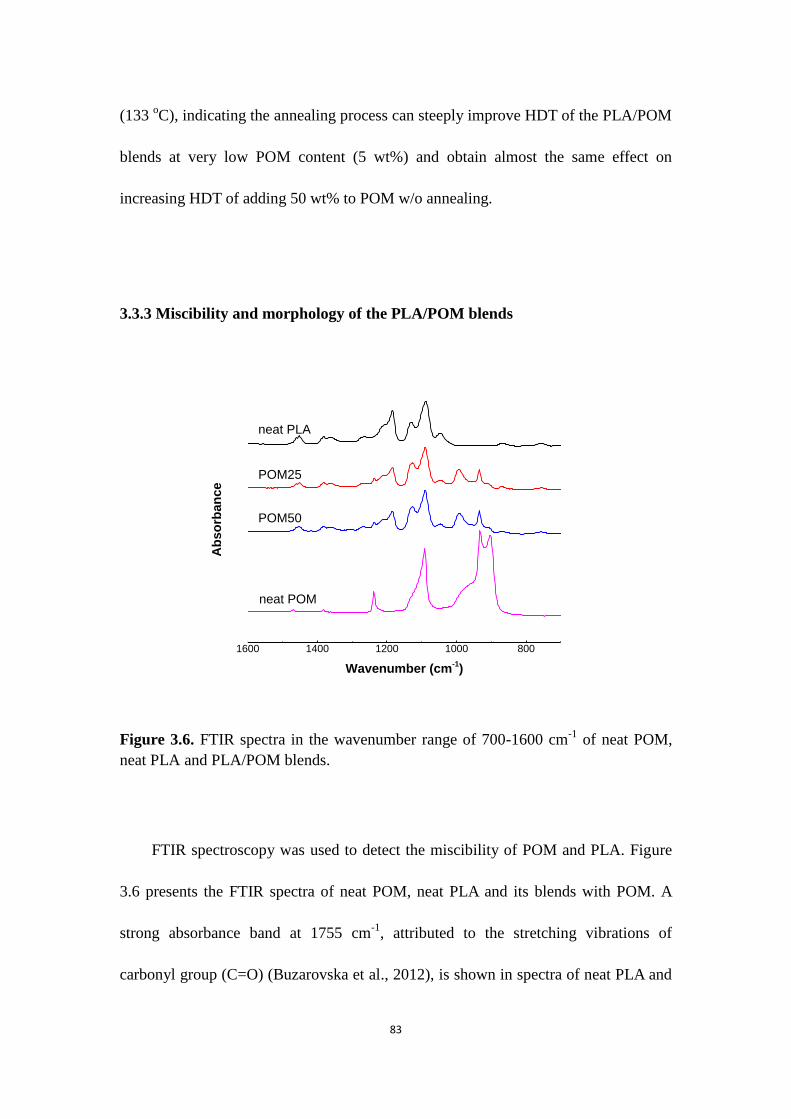
83
(133 oC), indicating the annealing process can steeply improve HDT of the PLA/POM
blends at very low POM content (5 wt%) and obtain almost the same effect on
increasing HDT of adding 50 wt% to POM w/o annealing.
3.3.3 Miscibility and morphology of the PLA/POM blends
1600 1400 1200 1000 800
Ab
so
rban
ce
Wavenumber (cm-1)
neat PLA
POM25
POM50
neat POM
Figure 3.6. FTIR spectra in the wavenumber range of 700-1600 cm-1
of neat POM,
neat PLA and PLA/POM blends.
FTIR spectroscopy was used to detect the miscibility of POM and PLA. Figure
3.6 presents the FTIR spectra of neat POM, neat PLA and its blends with POM. A
strong absorbance band at 1755 cm-1
, attributed to the stretching vibrations of
carbonyl group (C=O) (Buzarovska et al., 2012), is shown in spectra of neat PLA and
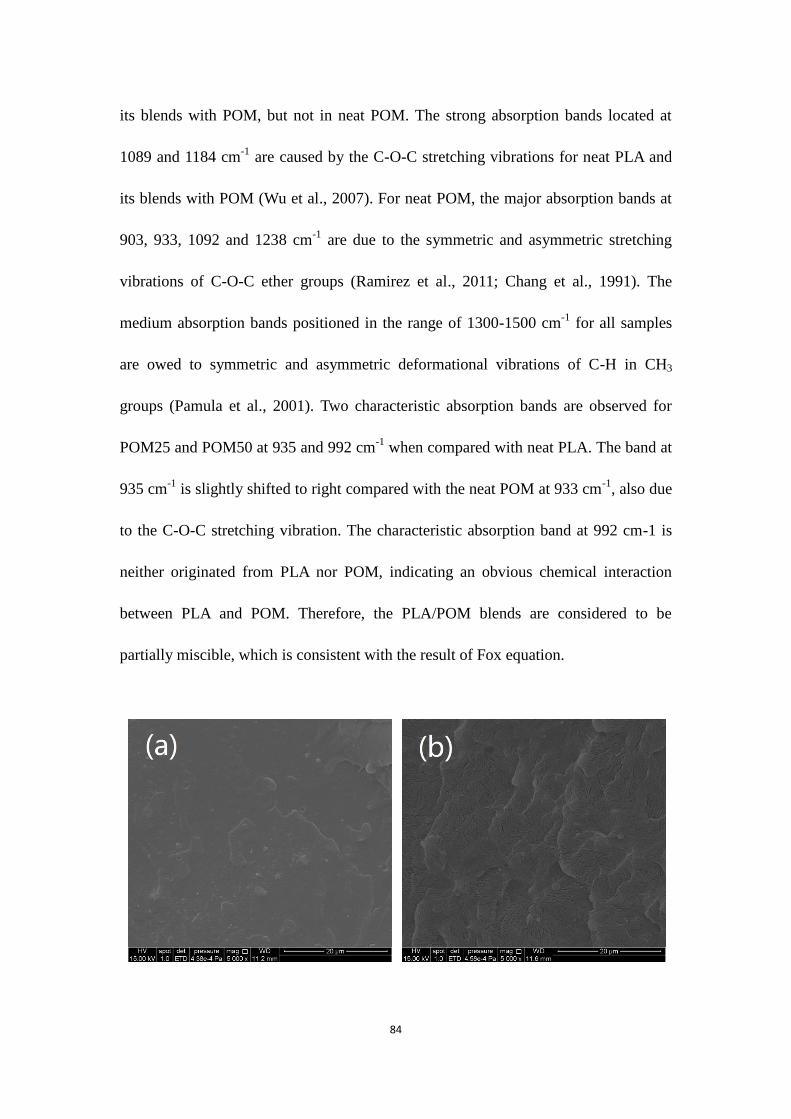
84
its blends with POM, but not in neat POM. The strong absorption bands located at
1089 and 1184 cm-1
are caused by the C-O-C stretching vibrations for neat PLA and
its blends with POM (Wu et al., 2007). For neat POM, the major absorption bands at
903, 933, 1092 and 1238 cm-1
are due to the symmetric and asymmetric stretching
vibrations of C-O-C ether groups (Ramirez et al., 2011; Chang et al., 1991). The
medium absorption bands positioned in the range of 1300-1500 cm-1
for all samples
are owed to symmetric and asymmetric deformational vibrations of C-H in CH3
groups (Pamula et al., 2001). Two characteristic absorption bands are observed for
POM25 and POM50 at 935 and 992 cm-1
when compared with neat PLA. The band at
935 cm-1
is slightly shifted to right compared with the neat POM at 933 cm-1
, also due
to the C-O-C stretching vibration. The characteristic absorption band at 992 cm-1 is
neither originated from PLA nor POM, indicating an obvious chemical interaction
between PLA and POM. Therefore, the PLA/POM blends are considered to be
partially miscible, which is consistent with the result of Fox equation.
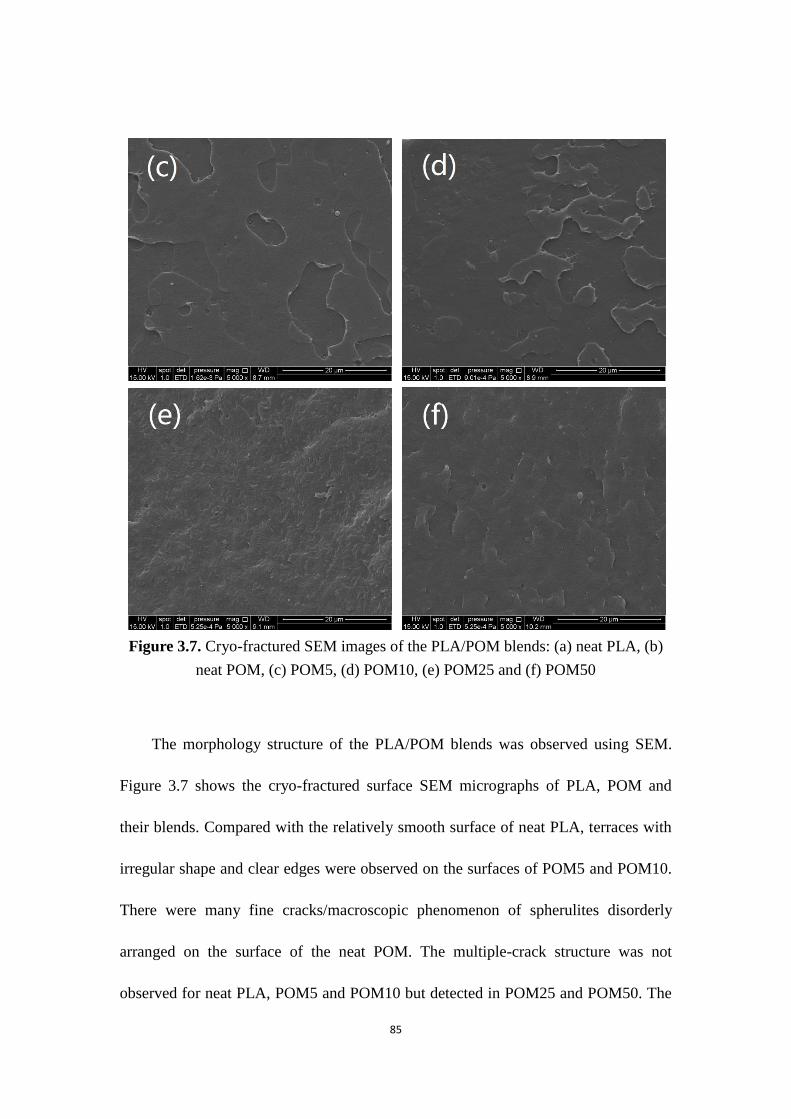
85
Figure 3.7. Cryo-fractured SEM images of the PLA/POM blends: (a) neat PLA, (b)
neat POM, (c) POM5, (d) POM10, (e) POM25 and (f) POM50
The morphology structure of the PLA/POM blends was observed using SEM.
Figure 3.7 shows the cryo-fractured surface SEM micrographs of PLA, POM and
their blends. Compared with the relatively smooth surface of neat PLA, terraces with
irregular shape and clear edges were observed on the surfaces of POM5 and POM10.
There were many fine cracks/macroscopic phenomenon of spherulites disorderly
arranged on the surface of the neat POM. The multiple-crack structure was not
observed for neat PLA, POM5 and POM10 but detected in POM25 and POM50. The
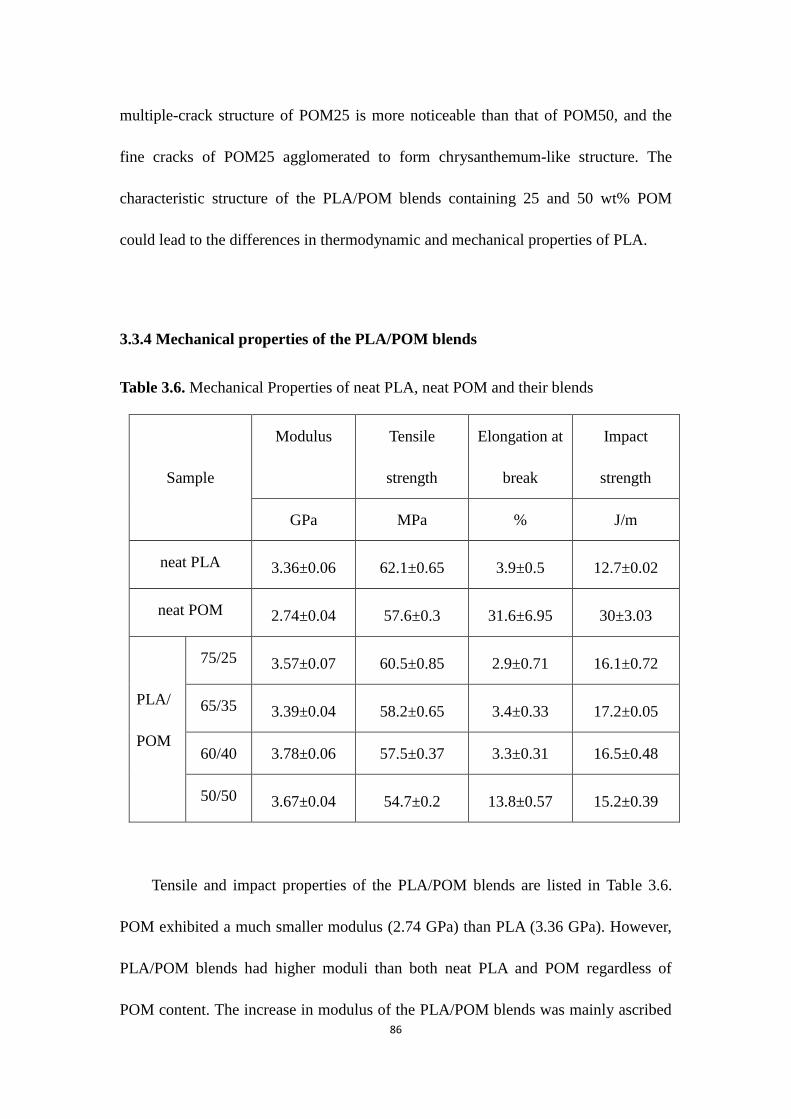
86
multiple-crack structure of POM25 is more noticeable than that of POM50, and the
fine cracks of POM25 agglomerated to form chrysanthemum-like structure. The
characteristic structure of the PLA/POM blends containing 25 and 50 wt% POM
could lead to the differences in thermodynamic and mechanical properties of PLA.
3.3.4 Mechanical properties of the PLA/POM blends
Table 3.6. Mechanical Properties of neat PLA, neat POM and their blends
Sample
Modulus Tensile
strength
Elongation at
break
Impact
strength
GPa MPa % J/m
neat PLA 3.36±0.06 62.1±0.65 3.9±0.5 12.7±0.02
neat POM 2.74±0.04 57.6±0.3 31.6±6.95 30±3.03
PLA/
POM
75/25 3.57±0.07 60.5±0.85 2.9±0.71 16.1±0.72
65/35 3.39±0.04 58.2±0.65 3.4±0.33 17.2±0.05
60/40 3.78±0.06 57.5±0.37 3.3±0.31 16.5±0.48
50/50 3.67±0.04 54.7±0.2 13.8±0.57 15.2±0.39
Tensile and impact properties of the PLA/POM blends are listed in Table 3.6.
POM exhibited a much smaller modulus (2.74 GPa) than PLA (3.36 GPa). However,
PLA/POM blends had higher moduli than both neat PLA and POM regardless of
POM content. The increase in modulus of the PLA/POM blends was mainly ascribed
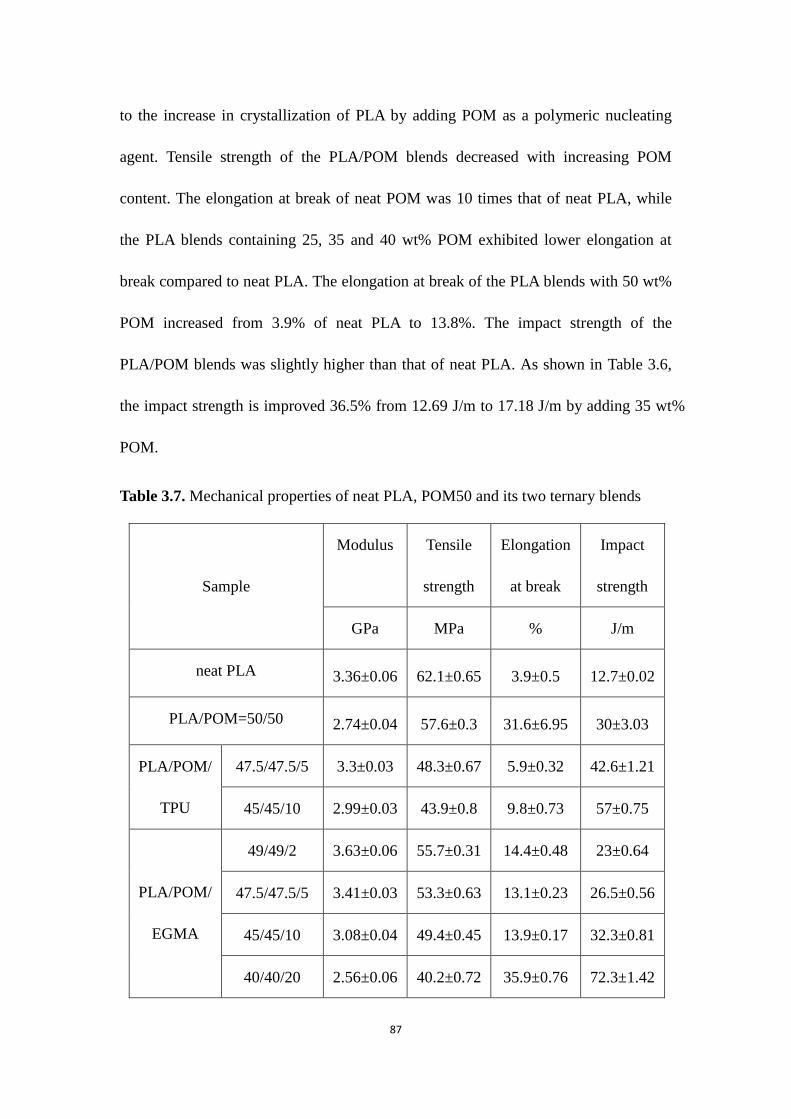
87
to the increase in crystallization of PLA by adding POM as a polymeric nucleating
agent. Tensile strength of the PLA/POM blends decreased with increasing POM
content. The elongation at break of neat POM was 10 times that of neat PLA, while
the PLA blends containing 25, 35 and 40 wt% POM exhibited lower elongation at
break compared to neat PLA. The elongation at break of the PLA blends with 50 wt%
POM increased from 3.9% of neat PLA to 13.8%. The impact strength of the
PLA/POM blends was slightly higher than that of neat PLA. As shown in Table 3.6,
the impact strength is improved 36.5% from 12.69 J/m to 17.18 J/m by adding 35 wt%
POM.
Table 3.7. Mechanical properties of neat PLA, POM50 and its two ternary blends
Sample
Modulus Tensile
strength
Elongation
at break
Impact
strength
GPa MPa % J/m
neat PLA 3.36±0.06 62.1±0.65 3.9±0.5 12.7±0.02
PLA/POM=50/50 2.74±0.04 57.6±0.3 31.6±6.95 30±3.03
PLA/POM/
TPU
47.5/47.5/5 3.3±0.03 48.3±0.67 5.9±0.32 42.6±1.21
45/45/10 2.99±0.03 43.9±0.8 9.8±0.73 57±0.75
PLA/POM/
EGMA
49/49/2 3.63±0.06 55.7±0.31 14.4±0.48 23±0.64
47.5/47.5/5 3.41±0.03 53.3±0.63 13.1±0.23 26.5±0.56
45/45/10 3.08±0.04 49.4±0.45 13.9±0.17 32.3±0.81
40/40/20 2.56±0.06 40.2±0.72 35.9±0.76 72.3±1.42
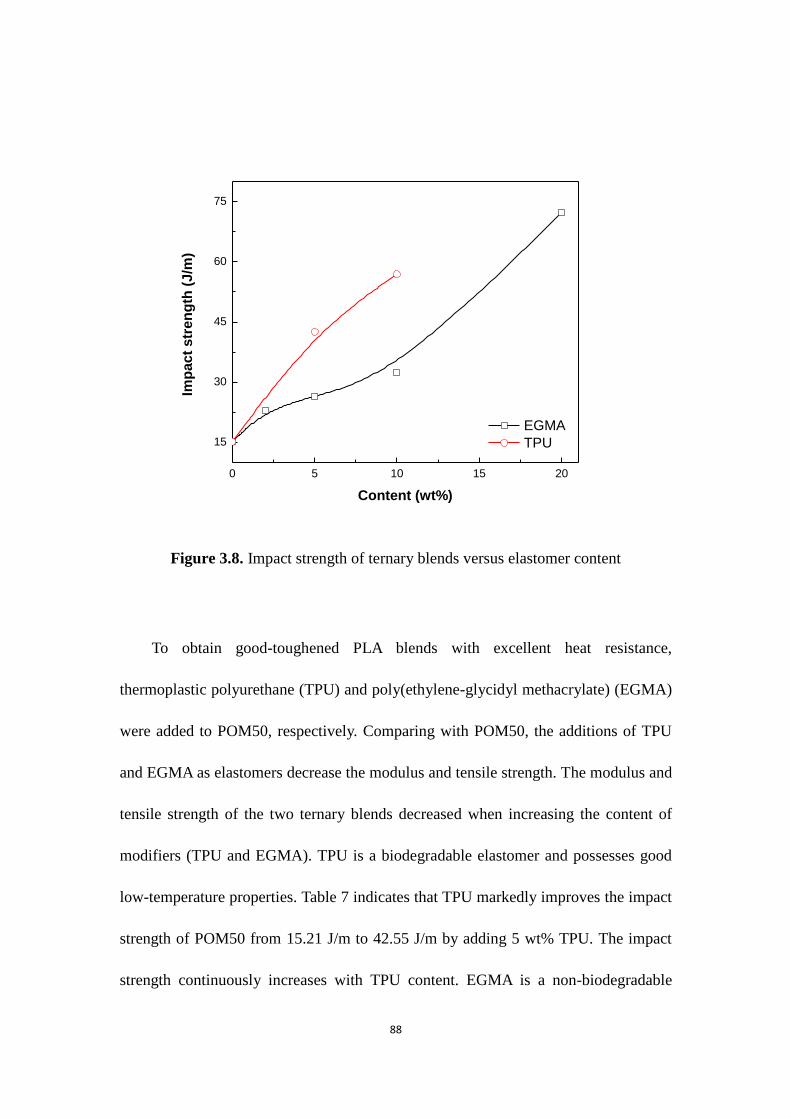
88
0 5 10 15 20
15
30
45
60
75
Imp
act
str
en
gth
(J/m
)
Content (wt%)
EGMA
TPU
Figure 3.8. Impact strength of ternary blends versus elastomer content
To obtain good-toughened PLA blends with excellent heat resistance,
thermoplastic polyurethane (TPU) and poly(ethylene-glycidyl methacrylate) (EGMA)
were added to POM50, respectively. Comparing with POM50, the additions of TPU
and EGMA as elastomers decrease the modulus and tensile strength. The modulus and
tensile strength of the two ternary blends decreased when increasing the content of
modifiers (TPU and EGMA). TPU is a biodegradable elastomer and possesses good
low-temperature properties. Table 7 indicates that TPU markedly improves the impact
strength of POM50 from 15.21 J/m to 42.55 J/m by adding 5 wt% TPU. The impact
strength continuously increases with TPU content. EGMA is a non-biodegradable
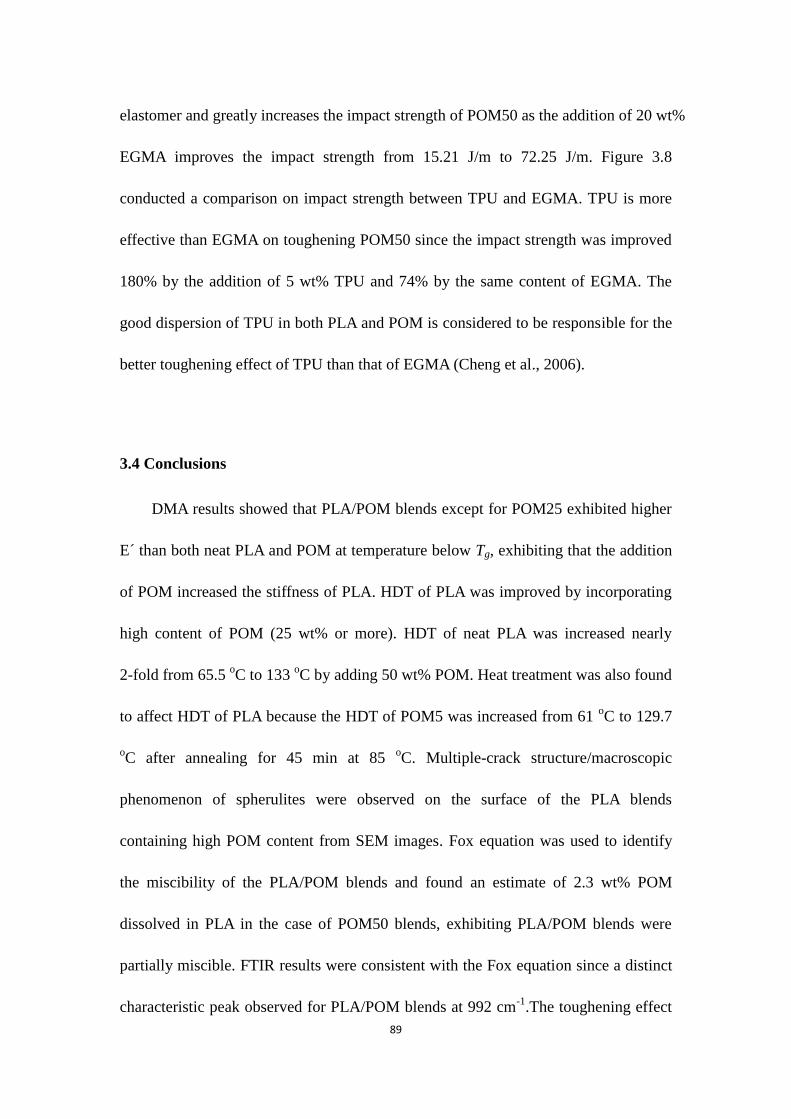
89
elastomer and greatly increases the impact strength of POM50 as the addition of 20 wt%
EGMA improves the impact strength from 15.21 J/m to 72.25 J/m. Figure 3.8
conducted a comparison on impact strength between TPU and EGMA. TPU is more
effective than EGMA on toughening POM50 since the impact strength was improved
180% by the addition of 5 wt% TPU and 74% by the same content of EGMA. The
good dispersion of TPU in both PLA and POM is considered to be responsible for the
better toughening effect of TPU than that of EGMA (Cheng et al., 2006).
3.4 Conclusions
DMA results showed that PLA/POM blends except for POM25 exhibited higher
E ́than both neat PLA and POM at temperature below Tg, exhibiting that the addition
of POM increased the stiffness of PLA. HDT of PLA was improved by incorporating
high content of POM (25 wt% or more). HDT of neat PLA was increased nearly
2-fold from 65.5 oC to 133
oC by adding 50 wt% POM. Heat treatment was also found
to affect HDT of PLA because the HDT of POM5 was increased from 61 oC to 129.7
oC after annealing for 45 min at 85
oC. Multiple-crack structure/macroscopic
phenomenon of spherulites were observed on the surface of the PLA blends
containing high POM content from SEM images. Fox equation was used to identify
the miscibility of the PLA/POM blends and found an estimate of 2.3 wt% POM
dissolved in PLA in the case of POM50 blends, exhibiting PLA/POM blends were
partially miscible. FTIR results were consistent with the Fox equation since a distinct
characteristic peak observed for PLA/POM blends at 992 cm-1
.The toughening effect
90
of two type of elastomers i.e. TPU and EGMA based on the PLA/POM blend (50/50)
was investigated through tensile testing. The experimental results suggested that TPU
was more effectively on toughening the PLA/POM blend than EGMA.
91
Reference
Baiardo, M.; Frisoni, G., “Thermal and mechanical properties of plasticized
poly(L-lactic acid).” Journal of Applied Polymer Science, (2003) 90 (7): 1731-1738.
Tsuji, H.; Ikada, Y., “Properties and morphologies of poly(L-lactide): 1. Annealing
condition effects on properties and morphologies of poly(L-lactide).” Polymer, (1995)
36 (14): 2709-2716.
Jiang, L.; Zhang, J., “Comparison of polylactide/nano-sized calcium carbonate and
polylactide/montmorillonite composites: Reinforcing effects and toughening
mechanisms.” Polymer, (2007) 48: 7632-7644.
Liu, H.; Zhang, J., “Interaction of Microstructure and Interfacial Adhesion on Impact
Performance of Polylactide (PLA) Ternary Blends.”Macromolecules, (2011) 44:
1513-1522.
Brizzolara, D.; Cantow, H., “Mechanism of the Stereocomplex Formation between
Enantiomeric Poly(lactide)s.” Macromolecules, (1996) 29: 191-197.
Angela, M.; Harris, E., “Improving mechanical performance of injection molded PLA
by controlling crystallinity.” Journal of Applied Polymer Science, (2008) 107 (4):
2246-2255.
Nanda, M.; Misra, M., “The Effects of Process Engineering on the Performance of
PLA and PHBV Blends.” Macromolecular Materials and Engineering, 2011 (296) 8:
719-728.
Broz, M.; VanderHart, D., “Structure and mechanical properties of poly(D,L-lactic
acid)/poly(ε-caprolactone) blends.” Biomaterials, (2003) 24 (23): 4181-4190.
Semba, T.; Kitagawa, K., “The effect of crosslinking on the mechanical properties of
polylactic acid/ polycaprolactone blends.” Journal of Applied Polymer Science, (2006)
101 (3): 1816-1825.
Zhang, N.; Wang, Q., “Preparation and properties of biodegradable poly(lactic
acid)/poly(butylene adipate- co -terephthalate) blend with glycidyl methacrylate as
reactive processing agent.” Journal of Materials Science, (2009) 44 (1): 250-256.
Paul, DR.; Bucknall, CB., Polymer blends. New York: Wiley; 2000.
Fox, T.G., Bull. Am. Phys. Soc., (1956) 1 (123).
92
Sarasua, J.R.; Pouyet, J., “Dynamic Mechanical Behavior and Interphase Adhesion of
thermoplastic (PEEK, PES) Short Fiber Composites.” Journal of Thermoplastic
Composite Materials, (1998) 11 (1): 2-21.
93
Chapter 4 Conclusions
In this research, PLA/POM blends were successfully prepared through melt
extrusion in this research. PLA and its blends with POM and talc were investigated by
DSC, POM and XRD in detail for a comparative study of the effects of different
fillers on the crystallization behavior and kinetics, and crystalline morphology.
Greater enthalpy and lower cold crystallization temperature of PLA/POM blends from
the DSC first heating scan exhibited improvement in crystallization ability of PLA by
adding POM. Furthermore, two cold crystallization peaks were observed for the
PLA/POM blends. During isothermal crystallization, t1/2 decreased with increasing
loadings of fillers, and increased with increasing crystallization temperature for both
PLA/POM and PLA/talc blends. Moreover, t1/2 of talc was much smaller than that of
PLA and PLA/POM blends, exhibiting talc is more effective on improving the
crystallization rate of PLA. CRC of POM5 from nonisothermal crystallization was
62.76 h-1
, which was greater than neat POM of 6.79 h-1
, suggesting significant
enhancement in the crystallization rate. Polarized optical micrographs were taken to
observe the crystalline morphology of PLA blends, well-defined banded spherulites
were obtained only for PLA/POM blends. Transparency of PLA/POM blends was
better than both PLA and PLA/talc blends, indicating PLA/POM blends were partially
miscible, which was in agreement with FTIR results. XRD results displayed crystal
structure of PLA was changed by the presence of POM due to the characteristic

94
diffraction peak of POM2 and POM5 at 22.8o. Mechanical properties of neat PLA
were not dramatically changed by the presence of POM and talc, which was probably
due to their low loading levels.
Thermodynamic properties and phase morphology of PLA/POM blends were
examined using DMA and SEM. DMA results indicated that PLA/POM blends except
for POM25 exhibited higher E’ than both neat PLA and POM at temperature below Tg,
indicating the addition of POM increased the stiffness of PLA. Introducing Tgs
derived from tan δ curve into the Fox equation, an estimate of about 2.3 wt% of POM
dissolved in PLA phase of POM50 was obtained. Therefore, PLA/POM blends were
considered to be partially miscible. FTIR was used to identify the miscibility of
PLA/POM blends as well; the result was consistent with that of the Fox equation.
HDT of PLA was increased by incorporating high content of POM (25 wt% or more).
HDT of neat PLA was increased nearly 2-fold from 65.5 oC to 133
oC by adding 50 wt%
POM. The improvement in HDT was attributed to the increased crystallinity of PLA
by adding POM. Heat treatment was also found to affect HDT of PLA because the
HDT of POM5 was increased from 61 oC to 129.7
oC after annealing for 45 min at 85
oC. From SEM images, multiple-crack structure was observed on the surface of the
PLA blends containing high POM content. Mechanical properties were examined to
further understand the performance of PLA/POM blends. The PLA/POM blends
exhibited higher modulus than neat PLA and POM, while tensile strength and impact
strength were not greatly increased by adding POM. The toughening effects of two
95
types of elastomers i.e. TPU and EGMA based on the PLA/POM blend (50/50) were
investigated, and the experimental results suggested that TPU had better effects on
toughening the PLA/POM blend than EGMA.