study on the crystallization of poly(alkylene
TRANSCRIPT

1
A Diacuteaz L Franco J Puiggaliacute
Departament dEnginyeria Quiacutemica Universitat Politegravecnica de
Catalunya Av Diagonal 647 Barcelona E-08028 SPAIN
Correspondence to J Puiggaliacute (E-mail JordiPuiggaliupces)
STUDY ON THE CRYSTALLIZATION OF POLY(ALKYLENE
DICARBOXYLATE)S DERIVED FROM 19-NONANEDIOL
AND MIXTURES WITH DIFFERENT RATIOS OF AZELAIC
ACID AND PIMELIC ACID UNITS
brought to you by COREView metadata citation and similar papers at coreacuk
provided by UPCommons Portal del coneixement obert de la UPC
2
ABSTRACT
Polyalkylene dicarboxylates derived from 19-nonanediol and mixtures with different
ratios of pimelic acid and azelaic acid were synthesized by thermal polycondensation
All samples had a high degree of crystallinity although it was found to decrease with the
comonomer content
Crystallization kinetics of the two homopolymers and the copolymer with the eutectic
composition was studied by calorimetric and optical microscopy techniques Similar
Avrami parameters were determined for the three samples and a spherulitic growth with
heterogeneous nucleation was deduced Spherulites showed negative birefringence and
a fibrillar or ringed texture depending on the sample Furthermore clear differences
were found in the primary nucleation density the spherulitic growth rate and even in the
secondary nucleation constant deduced from the Lauritzen-Hoffman treatment
The three studied samples had a similar arrangement of molecular chains and
consequently their WAXD patterns showed the same strong reflections related to the
molecular packing SAXS data revealed that a lamellar insertion mechanism was
characteristic for non-isothermal crystallization from the melt In addition significant
differences were found between the crystal lamellar thicknesses of the homopolymer
and copolymer samples Diffraction and spectroscopic data suggested that the lamellar
crystals of the eutectic copolymer were mainly constituted by azelate units whereas the
pimelate units were preferentially located in the amorphous regions including the
interlamellar amorphous layer associated with the chain folds
Keywords Polyester copolymers azelaic acid pimelic acid thermal properties
spherulitic growth rate secondary nucleation synchrotron radiation
3
INTRODUCTION
Great efforts are being focused into the development of biodegradable polymers from
renewable resources to avoid problems associated with more conventional
petrochemical feedstocks such as decreasing availability increasing price and indeed
environmental pollution caused by plastic waste Vegetable oils are a promising
alternative since coming from abundant and economical biological sources can lead to
biodegradable materials Specifically potential applications and uses of polyols and
polyurethanes derived from plant oils are well known [1-4]
Polyesters also constitute a family of degradable polymers of great and increasing
interest since they can cover a wide range of applications as specialities mainly in the
biomedical field and commodities [5-11] Poly(alkylene dicarboxylate)s a specific
group within polyesters are gaining increasing attention because the marketing of
polybutylene succinate which is supplied by Showa High Polymers as BionolleTM
and
is characterized by a relatively low production cost easy processability and good
thermal and mechanical properties [1214] Several works in the literature deal with the
structure and crystallization process of poly(alkylene dicarboxylate)s [15-25] It was
demonstrated that their molecular conformation and packing arrangement depend on the
length of the polyalkylene segment and the parity of chemical units involved (ie odd or
even number of main chain atoms) However studies have mainly been focused on
even-even compounds and little attention has been devoted to the odd-odd series
probably because of their expected low thermal properties This problem can be
overcome by using monomers with a high content of methylene groups as the melting
point of polyesters generally increases when the ratio between ester and methylene
groups in the main chain decreases [26]
4
Commodity oils like sunflower can provide high purity fatty acids (eg oleic acid)
which can be used for chemical synthesis of dicarboxylic acid and diol monomers of
poly(alkylene dicarboxylate)s Thus azelaic acid and 19-nonanediol can be obtained by
ozonolysis cleavage of the alkene double bond of oleic acid and subsequent oxidation
and reduction [3]
The main goal of this work is the basic characterization and study of the crystallization
process of odd-odd polyesters derived from natural resources specifically from 19-
nonanediol pimelic and azelaic acids Special attention is paid to copolymers obtained
from mixtures of both dicarboxylic acids since melting points crystallinities and basic
morphologies can vary according to their ratio Note that azelate and pimelate moeities
have a highly similar chemical structure and consequently an identical molecular
conformation is expected In this way comonomer units could be compatible in such a
way that they are able to share a crystalline lattice [27] This could occur in the
isomorphic co-crystallization where only one crystalline phase containing both
crystalline units is developed and in the isodimorphic crystallization when at least one
of the two crystalline phases incorporates the corresponding minor component in its
crystalline lattice Several works have recently addressed the isomorphic crystallization
of copoly(alkylene dicarboxylate)s which were mainly constituted by even units such
as poly(butylene succinate-co-ethylene succinate) [28] poly(butylene succinate-co-
propylene succinate) [29] poly(hexamethylene succinate-co-hexamethylene adipate)
[30] poly(hexamethylene sebacate-co-hexamethylene adipate) [3132]
poly(hexamethylene sebacate-co-hexamethylene suberate) [33] and poly(hexamethylene
suberate-co-hexamethylene adipate) [33] Results pointed out that isomorphism was
feasible and that a smaller difference between the chemical structure of comonomer
5
units led to less free energy to incorporate foreign units and to a higher extent of
comonomer unit inclusion in the host crystalline lattice [33]
EXPERIMENTAL SECTION
Materials
All reagents and solvents were purchased from Sigma-Aldrich and used without further
purification
Poly(nonamethylene pimelate) (PES 97) poly(nonamethylene azelate) (PES 99) and
poly(nonamethylene azelate-co-pimelate) (COPES 979-x) were synthesized by thermal
polycondensation of the appropriate mixture of dicarboxylic units with an excess of 19-
nonanediol (221 molar ratio) (Figure 1) Abbreviations denote PES for polyester
COPES for copolyester the first digit for the number of carbon atoms of the diol unit
the second digit for the number of carbon atoms of the dicarboxylic unit (or 79 for the
copolymer) and x for the molar ratio between pimelate and azelate units in the reaction
mixture Titanium tetrabutoxyde was used as a catalyst and the reaction was first
performed in a nitrogen atmosphere at 150 ordmC for 6 h and then in vacuum at 180 ordmC for
18 h Polymers were purified by precipitation with ethanol of chloroform solutions (10
wt-)
Measurements
Molecular weights were estimated by GPC using a liquid chromatograph (Shimadzu
model LC-8A) equipped with an Empower computer program (Waters) and a refractive
index detector A PL HFIP gel guard precolumn and PL HFIP gel column (Agilent
Technologies Deutschland GmbH) were employed The polymer was dissolved and
eluted in 111333-hexafluoroisopropanol at a flow rate of 05 mLmin (injected
6
volume 100 L sample concentration 15 mgmL) The number and weight average
molecular weights were calculated using polymethyl methacrylate standards
1H- and
13C-NMR spectra were acquired with a Bruker AMX-300 spectrometer
operating at 3001 MHz and 757 MHz respectively Chemical shifts were calibrated
using tetramethylsilane as an internal standard Deuterated chloroform was used as the
solvent
Infrared absorption spectra were recorded with a Fourier Transform FTIR 4100 Jasco
spectrometer in the 4000-600 cm-1
range A Specac model MKII Golden Gate
attenuated total reflection (ATR) with a heated Diamond ATR Top-Plate was used
Calorimetric data were obtained by differential scanning calorimetry with a TA
Instruments Q100 series equipped with a refrigerated cooling system (RCS) operating
from -90 ordmC to 550 ordmC Experiments were conducted under a flow of dry nitrogen with a
sample weight of approximately 10 mg while calibration was performed with indium
Heating and cooling runs were performed at rates of 20 ordmCmin and 10 ordmCmin
respectively
Spherulites of polyesters were grown from homogeneous melt-crystallized thin films
placed between two cover glasses These films were obtained by evaporation of a dilute
solution of the polymer in chloroform Samples were crystallized isothermally at
different temperatures below the melting point using a Linkam temperature control
system configured by a THMS 600 heating and freezing stage connected to an LNP 94
liquid nitrogen cooling system Films with thickness lower than 10 m were obtained
by this experimental procedure Optical photographs were taken using a Zeiss AxioCam
MRC5 digital camera mounted on a Zeiss Axioskop 40 Pol light polarizing microscope
A first-order red tint plate was used to determine the sign of spherulite birefringence
under crossed polarizers
7
Simultaneous time-resolved SAXSWAXD experiments were taken at the NCD
beamline (BL11) of the Alba synchrotron radiation light facility of Cerdanyola del
Valles (Catalunya) The beam was monochromatized to a wavelength of 0098 nm and
the samples were confined between Kapton films SAXS and WAXD profiles were
acquired simultaneously during heatingcooling experiments in time frames of 12 s
Samples were held above fusion for 3 min to erase thermal history before performing
the subsequent cooling run All heating and cooling runs were performed at a rate of 3
ordmCmin Two linear position-sensitive detectors were used [34] the SAXS detector was
calibrated with different orders of diffraction from silver behenate whereas the WAXD
detector was calibrated with diffractions of a standard of an alumina (Al2O3) sample
The diffraction profiles were normalized to the beam intensity and corrected
considering the empty sample background WAXD peaks were deconvoluted with the
PeakFit v4 program by Jandel Scientific Software The correlation function and
corresponding parameters were calculated with the CORFUNC program [35] for Fibre
Diffraction Non-Crystalline Diffraction provided by the Collaborative Computational
Project 13
RESULTS AND DISCUSSION
Synthesis of PES 97 PES 99 and COPES 979-x samples
The results summarized in Table 1 indicate that samples could be synthesized with a
polydispersity index (PDI) and a molecular weight typical of polycondesation reactions
involving two monomers with different functionality (ie diol and dicarboxylic units)
Thus PDI and Mn ranged from 233 to 270 and from 7900 to 13300 gmol
respectively A clear trend for the dependence of molecular weigth with composition
was not observed although lower molecular sizes were achieved when pimelic acid
content in the reaction mixture was higher In any case molecular weights were
8
sufficient to ensure film- and fiber-forming properties Polymerization yields
determined after reprecipitation of samples varied in a narrow range (65-78 ) no
relationship between yield and monomer feed ratio indicative of a preferred reactivity
was observed
Infrared spectra of all samples synthesized revealed the characteristic absorption bands
for methylene (2931-2925 and 2852-2851 cm-1
) C=O (1731-1729 cm-1
) and C-O
(asymmetric and symmetric stretchings at 1242-1223 and 1171-1167 cm-1
respectively) Figure S1a in Supporting information (SI) shows a representative
spectrum obtained for PES 99 homopolymer whereas a detailed summary of absorption
bands is given in Table S1 in SI (discussed below)
1H NMR spectra were highly similar for all samples showing characteristic signals at
404 (O-CH2) 227 (C(O)-CH2) 160 (O-CH2CH2 + C(O)-CH2CH2) and 130 ppm as
can be seen in Figure S2b in SI for PES 99 The relative intensity of the last signal was
the only difference between the spectra as logically deduced from the different number
of methylene protons of azelate and pimelate units that contributed to the indicated
signal
13C-NMR spectra were more powerful since the vicinal carbons of the dicarboxylate
units appeared well differentiated (ie 3429 and 3410 ppm for azelate and pimelate
units respectively) Figure S2 in SI shows a representative 13
C NMR spectrum with the
assignment of the observed signals The variation in intensity associated with the two
kinds of C(O)-CH2 carbon atoms with copolymer composition is also pointed out The
areas of these two signals were used to determine the pimelate molar fraction
fP = A3410 (A3429 + A3410) (1)
Table 1 shows that the experimental composition of all copolymers is in full agreement
with the feed monomer ratio
9
Unfortunately both 1H and
13C NMR spectra were insensitive to triad effects and
consequently no information concerning sequence distribution could be derived
Specifically the O-CH2 protons were not split in the 1H NMR spectra and became
insensitive to the two different dicarboxylic units to which the diol could be linked A
triplet was always clearly detected since very few differences were expected due to the
large number of aliphatic methylene groups of both azelaic and pimelic units On the
contrary splitting has been reported when dicarboxylic units of clearly different nature
(ie aliphatic or aromatic) were used [36]
Infrared spectroscopic data of amorphous and crystalline PES 97 PES 99 and
COPES 979-05 samples
FTIR is highly sensitive to molecular conformation and packing density hence its
usefulness in polymer crystallization studies Characteristic bands can be correlated to
the crystalline and amorphous phases of the bulk and typically remain distinguishable
over the course of crystallization
FTIR spectra corresponding to semicrystalline and amorphous samples were obtained
from the as-synthesized samples at room temperature and at 90 ordmC (ie about 30 ordmC
above the melting temperature of each polymer) respectively Figure 2 compares the
characteristic spectra of PES 97 PES 99 and COPES 979-05 amorphous and
semicrystalline samples whereas the main absorption bands are summarized in Table
S1 in SI
Spectra of amorphous samples were practically identical due to the similar chemical
repeat units and also to the similar molecular interactions that should be established in
the melt state Only minor differences were detected in the broad band near 1090-1070
cm-1
since it was split in the pimelate rich samples (see asterisk in Figure 2)
10
Transmission bands generally became broader in the spectra of amorphous samples and
could therefore be distinguished from those associated with crystalline domains which
appeared at the same wavenumber This is the case for example of the asymmetric
stretching bands of the C-O group of PES 97 which is observed for both crystalline
and amorphous phases at 1242 cm-1
On the contrary a significant wavenumber
difference was found for PES 99 (ie 1240 and 1223 cm-1
) In the amorphous state this
stretching mode appeared at the same wavenumber for both homopolymers whereas a
large difference was found in the crystalline state due to a different molecular
environment of the ester groups Bands at 1345-1315 1028-1017 954-958 and 921-918
cm-1
were also noticeable since appeared in the semicrystalline samples only
The spectrum of the semicrystalline COPES 979-05 sample is highly interesting since
some bands were split and appeared at the typical wavenumbers of the corresponding
homopolymers Thus the asymmetric stretching of the C-O group gave rise to two
narrow bands at 1242 and 1224 cm-1
indicating that two kinds of ester groups exist in
the copolymer as a result of different interactions with neighboring chains Specifically
some ester groups had the same arrangement as the PES 97 crystalline structure
whereas other groups were arranged according to the PES 99 structure Furthermore it
is qualitatively observed that the intensity of the 1224 cm-1
band is clearly greater and
consequently the PES 99 arrangement seems to be predominant The difference on
intensities cannot be justified by distinct relative absorption coefficients since both
bands appeared with similar intensity in the spectra (not shown) of an equimolar
mixture of the two homopolymers
Similar considerations can be made about the copolymer bands at 1344 and 1312 cm-1
which are attributed to deformational CH2 vibrations of polyesters [37] and are related
to those observed at 1345 cm-1
and 1315 cm-1
in PES 97 and PES 99 homopolymer
11
spectra respectively Again the higher intensity was found for the band associated with
the PES 99 structure Finally some bands like that at 1024 cm-1
and even that at 956
cm-1
appeared in the copolymer at an intermediate wavenumber with respect to the
homopolymers (ie 1028 and 954 and 1017 and 958 cm-1
for PES 97 and PES 99
respectively)
Calorimetric data of PES 97 PES 99 and COPES 979-x samples
Thermal properties of the synthesized sample were determined by the four run protocol
depicted in Figure 3 for a representative copolymer Melt and hot crystallization data
together with glass transition temperatures are summarized in Table Srdquo in SI for all
samples Several points merit further discussion
a) All samples were semicrystalline and showed a single melting peak independent of
the crystallization procedure (ie from solution or from the melt) No multiple melting
peaks were observed and consequently no evidence of distinct crystal populations with
different lamellar thicknesses was found
b) Samples were able to crystallize from the melt state at the maximum rate allowed by
the equipment Thus no cold crystallization peaks were detected in the heating run of
quenched samples whereas melting peaks were clearly observed (eg Figure 3d) In
addition these peaks had practically the same enthalpy as those measured at a slow
cooling rate for hot crystallized samples (Figure 3b) and even for solution crystallized
samples (Figure 3a)
c) The melting temperature of each homopolymer decreased with the comonomer
content The eutectic composition and minimum temperature corresponded to the
COPES 979-50 sample (Figure 4) In addition PES 99 had a higher melting
temperature than PES 97 as can be presumed from its higher methylene content [26]
12
d) Melting enthalpies of all samples were always high Thus azelate and pimelate
units were easily incorporated into the PES 97 and PES 99 crystalline structures
respectively Despite the small variation a slight decrease was observed in the melting
enthalpy of each homopolymer when comonomer units were incorporated as shown in
Figure 4 for samples crystallized from the melt The minimum enthalpy was achieved
with the COPES 979-50 sample and the variation was higher when PES 99 was
impurified due to its higher enthalpy compared with PES 97
e) Solution crystallized samples always had a higher melting enthalpy than melt
crystallized samples However a similar dependence of enthalpy upon composition was
observed
f) Non-isothermal crystallization from the melt state required a rather similar degree
of supercooling (eg between 13 and 18 ordmC at a cooling rate of 10 ordmCmin) for all
samples Thus the peak crystallization temperature of PES 97 was lower than that of
PES 99 and logically higher than that of copolymers
g) Glass transition temperatures ranged in a narrow interval (-45 ordmC to -60 ordmC) for all
samples the lower values corresponding to COPES 979-x copolymers despite having a
higher molecular weight than PES 97 homopolymer
DSC isothermal crystallization study of PES 97 PES 99 and COPES 979-05
samples
Figure 5a shows the DSC exotherms of the COPES 979-05 sample during
crystallization experiments from the melt state at selected temperatures Peaks logically
shifted to higher times and became broader with increasing the crystallization
temperature The time evolution of the relative degree of crystallinity (t) was
determined through the ratio area of the exotherm up to time t divided by the total
exotherm area ie
13
(t) = t
tdtdtdH
0)(
0)(
tdtdtdH (2)
where dHdt is the heat flow rate and t0 the induction time A characteristic sigmoidal
dependence on time was always found as plotted in Figure 5a (inset)
Kinetic crystallization data were analyzed assuming the well-known Avrami equation
[3839] for primary crystallization
1 - (t) = exp[-Z (t-t0)n] (3)
where Z is the temperature-dependent rate constant and n the Avrami exponent whose
value varies with the crystallization mechanism A normalized rate constant k = Z1n
is
usually evaluated for comparison since its dimension (time-1
) is independent of the
value of the Avrami exponent
Table 2 summarizes the main kinetic parameters of the primary crystallization process
of the homopolymers and COPES 979-05 copolyester as deduced from the plots of
log-ln[1-(t)] against log (t - t0) (Figure 7b for COPES 979-05) The values of the
Avrami exponent for the hot isothermal crystallizations lie in a narrow range from 225
to 294 258 being the average value This suggests a predetermined (heterogeneous)
nucleation with spherical growth that occurred under geometric constraints since the
theoretical value should be equal to 3 Sporadic (heterogeneous) and homogeneous
nucleation can be clearly discarded as a higher exponent close to 4 should be derived
The values of the corresponding reciprocal crystallization half-times (112) calculated
as the inverse of the difference between the time at which crystallization begins and the
time at which 50 of crystallization is completed are also summarized in Table 2 This
parameter is a direct measure of the crystallization process and could therefore be used
to check the accuracy of the Avrami analysis by comparison with the theoretical kinetic
value (ie 112 = (Z ln 2)1n
) as reported in Table 2 A similar dependence of 112 and
the kinetic rate constant on the crystallization temperature for the three polymers can
14
also be inferred from Figure 5c This Figure also shows that PES 99 crystallized faster
than PES 97 despite having a greater molecular weight and that the lowest overall
crystallization rate corresponded to the copolyester as could be logically expected It
should be pointed out that the three samples required similar supercooling to start
crystallization since the melting points of PES 99 and the copolyester samples were the
highest and the lowest respectively
Isothermal crystallizations of the polymers gave rise to samples characterized by a
single melting peak which clearly shifted to higher temperatures with increasing
crystallization temperature (eg Figure 6a for the COPES 979-05 sample) These
results clearly reflect the lamellar thickening effect and make it possible to deduce the
equilibrium melting temperatures (ie those corresponding to an ideal infinite crystal)
by the Hoffman-Weeks approach (Figure 6b) [40] Theoretical equilibrium melting
temperatures of 792 and 748 ordmC were determined for the PES 99 and PES 97
homopolymers respectively Copolymerization decreased these temperatures according
to the comonomer content Thus the minimum value corresponded to the COPES 979-
05 sample (ie 728 ordmC)
Optical microscopy crystallization study of PES 97 PES 99 and COPES 979-05
samples
All polyester samples crystallized from the melt into spherulites with negative
birefringence but different textures (Figures 7a-7c) Ringed spherulites were mainly
observed with PES 99 over the whole range of tested crystallization temperature
whereas fibrillar textures were always observed for PES 97 For the sake of
completeness Figure 7d also shows the crystallization of a 50 molar mixture of the
two homopolymers which clearly differentiated from the COPES 979-05 spherulites
depicted in Figure 7b It should be pointed out that both kinds of spherulites (fibrillar
15
and ringed) were observed in the homopolymer mixture as expected for an independent
crystallization of each polymer On the contrary only fibrillar spherulites were observed
for the copolymer sample suggesting that cocrystallization took place as also deduced
from the calorimetric data It is also worth noting that this copolymer like PES 97
required a high degree of supercooling to crystallize
Crystallization from the melt of both homopolymers and the representative COPES
979-05 copolymer was studied by optical microscopy in the range where spherulites
with adequate dimensions formed and which varied from 62 ordmC to 47 ordmC depending on
the sample A larger dimension was obtained at temperatures sufficiently high to have a
low nucleation rate compared with the crystal growth rate This size decreased with the
crystallization temperature the minimum temperature considered for each polymer
being that corresponding to a final spherulite radius close to 10 m
Spherulite radii grew linearly with time up to impingement within the studied
temperature intervals (eg Figure 8a for the copolymer) and allowed the calculation of
the corresponding growth rates G displayed in Figure 8b The maximum G values
measured were clearly different the highest corresponding to PES 99 (ie 35 mmin)
and the lowest corresponding to the copolymer (ie 6 mmin) as could be presumed
Growth data were then analyzed in terms of crystallization regimes by the mathematical
expressions derived from the crystal growth and nucleation model proposed by
Lauritzen and Hoffman [41] It is nevertheless true that the physical meaning of this
model may be questioned on account of the new theories based on experimental
evidences and different theoretical calculations [4243]
The radial growth rate (G) of polymer spherulites was thereby calculated by the
Hoffman and Lauritzen equation [41]
G = G0 exp[-U(R(Tc- T))] exp[-Kg( Tc (T) f)] (4)
16
where G0 is a constant preexponential factor U represents the activation energy
characteristic of the transport of crystallizing segments across the liquid-crystal
interface T is a hypothetical temperature below which such motion ceases Tc is the
crystallization temperature R is the gas constant Kg is the secondary nucleation
parameter T is the degree of supercooling measured as Tm0-Tc and f is a correction
factor accounting for the variation in the bulk melting enthalpy per unit volume with
temperature (f = 2 Tc (Tm0 + Tc))
The sets of parameters most commonly used for U and T are those reported by
Williams-Landel-Ferry [44] (WLF) (U
= 4120 calmol and T = Tg - 516 K) and
Suzuki and Kovacs [45] (U
= 1500 calmol and T = Tg - 30 K) The plot of ln G +
UR(Tc-T) versus 1( Tc (T) f) for the PES 97 PES 99 and COPES 979-05
samples fitted well with a linear regression representative of a single crystallization
regime (Figure 9) when the second parameter set was employed The worst regression
coefficient was r2 09934 and the secondary nucleation parameters derived from the
slopes of the linear plots of PES 97 PES 99 and COPES 979-05 crystallization data
929 104 130 10
5 and 215 10
5 K
2 respectively The highest secondary nucleation
constant corresponded to the copolymer indicating greater difficulty of the lamellar
surface in inducing crystallization of incoming polymer chains Note also that the
crystal growth rate of COPES 979-05 became strongly dependent on the
crystallization temperature as shown in the G versus temperature plot (Figure 9b)
Nucleation constants were similar for the two homopolymers although a slightly lower
value was deduced for PES 97
In addition to the crystal growth rate the overall crystallization of a sample depends on
primary nucleation which may correspond to heterogeneous nuclei or homogeneous
nuclei Primary nucleation is often a rather complex process as it depends on the
17
crystallization temperature density of heterogeneities and presenceabsence of
nucleating agents The number of nuclei slightly increased during crystallization
suggesting a thermal nucleation where all nuclei became progressively active for a
given crystallization temperature A slight degree of heterogeneity in the spherulite size
was therefore observed at the end of the crystallization process Figure 9c shows that the
nucleation density increased with decreasing the crystallization temperature for the three
samples studied and approached a single exponential dependence which resulted in
more active nuclei (ie more favorable thermodynamic conditions for nucleus
generation) with progressively decreasing the temperature The lowest density
corresponding to the copolymer as could be presumed from its lower overall
crystallization rate determined from calorimetric data Note also that the copolymer and
the PES 99 samples had similar molecular weigths (Table 1) and therefore differences
on the crystal growth rate and primary nucleation density cannot be attributed to
molecular weigth changes Only PE 97 had a slightly lower molecular weight that
could justify an increase of both magnitudes Therefore the lower values with respect to
PE99 cannot be a consequence of he lower molecular size of PE 97
Study on the non-isothermal crystallization of PES 97 PES 99 and COPES 979-
05 samples by time-resolved SAXSWAXD experiments
Figure 10 contains time-resolved SAXS and WAXD profiles taken during non-
isothermal hot crystallization at a cooling rate of 3 ordmCmin for a representative polymer
(PES 97 homopolymer) In all cases the SAXS long period peak and crystal
diffractions appear simultaneously as expected for a crystallization process controlled
by nucleation and crystal growth
The SAXS long period peak is clearly seen at a value of the scattering vector q = 2sin
in the 028-039 nm-1
range after subtraction of the empty sample background
18
observed near the beam stop This peak which can be attributed to the lamellar structure
of the spherulites appeared at slightly different q values depending on the polymer
sample and shifted to higher q values (ie lower spacings) during crystallization
showing a more pronounced change in the initial stages
WAXD profiles showed an amorphous halo (q = 203 nm-1
) whose intensity decreased
with crystallization and on which Bragg reflections formed The most intense appeared
at 0414-0413 nm (q = 1518-1521 nm-1
) and 0370 nm (q = 1698 nm-1
) and should
correspond to the (110) (020) reflections of the typical structure of a polyalkylene
dicarboxylate [21-24] The intensity of the indicated reflections increased sharply at the
beginning of crystallization and slowly after a short time interval This second step
corresponds to a secondary crystallization which could also be envisaged from the
asymmetric shape of the DSC crystallization peaks (Figure 5b) WAXD profiles of the
two homopolymers and the COPES 979-05 copolymer are compared in Figure 13a
Note that the spacings observed for both homopolymers are practically identical and
consequently the similar packing arrangement should enable co-crystallization
The degree of crystallinity of the three samples could be estimated from the
corresponding room temperature profiles by considering the intensity of the amorphous
background (IB) and overall intensity (IT)
XcWAX
= (IT-IB ) IT (5)
WAXD measurements indicated that relative crystallinities ranged between 068 and
048 The highest and lowest values corresponded to PES 99 and the copolymer
respectively in agreement with DSC calorimetric data and the random disposition of
dicarboxylic units It should also be pointed out that PES 97 had practically the same
crystalline than PES 99 (ie 068 respect to 067) as can be qualitatively deduced from
the similar amorphous halo observed in the WAXD profile (Figure 11a)
19
SAXS profiles taken at the end of crystallization revealed clear differences between the
lamellar thicknesses of the three samples (Figure 11b) the highest and lowest
corresponding to COPES 997-05 and PES 97 respectively SAXS data were analyzed
in more detail during crystallization considering the normalized one-dimensional
correlation function [46] (r) which corresponds to the Fourier transform of the
Lorentz-corrected SAXS profile
(r) =
0
2 )cos()( dqqrqIq
0
2 )( dqqIq (6)
SAXS data were collected within a limited angular range only That is why
extrapolations to low and high q values were performed using Vonkrsquos model [47]
and
Porodrsquos law respectively
Figure 12a illustrates the correlation functions calculated for the three samples from
SAXS profiles taken at the end of crystallization In general their analysis allowed the
determination of morphologic parameters like (1) long period L (ie r value of the
first maximum of the correlation function) (2) amorphous layer thickness la (ie r
value for the intersection of the linear regression in the autocorrelation triangle with the
ordinate equal to the first minimum of the correlation function) and (3) crystalline
lamellar thickness lc (calculated as Lla)
The Lvalues were in all cases close to the long periods determined from twice the
value of the first minimum of the correlation function Thusthe most probable distance
between the centers of gravity of two adjacent crystals appeared to be equal to twice the
most probable distance between the centers of gravity of a crystal and its adjacent
amorphous layer This suggests a narrow distribution of the layer widths of the major
component which in this case corresponds to the crystal phase
20
Data obtained during the non-isothermal hot crystallization revealed a significant
decrease of L long spacings at the beginning of the process (ie during primary
crystallization) although a continuous decrease could still be observed during the
secondary crystallization (Figure 12b) These last changes were mainly due to the
decrease in the crystalline lamellar thickness which suggests the occurrence of a
lamellar insertion mechanism throughout the crystallization process of the three samples
(ie formation of thinner lamellar crystals between loosely stacked primary lamellae)
Note that the amorphous layer thickness remained practically constant during
crystallization
Figure 12b clearly shows that PES 99 had the highest and lowest lc and la values
respectively (ie 117 and 425 nm) Hence the highest crystallinity within the lamellar
stacks XcSAXS
(calculated as lc L) was determined for PES 99 (ie 074) Crystallinity
was clearly lower for PES 97 (ie 060) showing a similar trend to that observed from
WAXD crystallinities Both homopolymers have a similar lamellar thickness but clear
differences exist between the crystalline lamellar (ie from 117 to 936 nm) and
amorphous layer (ie from 425 to 624 nm) thicknesses It seems therefore that
irregular molecular folds on the lamellar surface should involve larger segments when
the polymer is constituted by the slightly more rigid pimelate units
The greatest amorphous layer thickness (ie 717 nm) was observed for the copolymer
indicating that chain defects caused by the presence of comonomer units could be
placed in the amorphous interlamellar regions XcSAXS
was minimum for the copolymer
(ie 059) although this crystallinity was very similar to that calculated for PES 97
due to the lower crystalline lamellar thickness of the homopolymer having pimelate
units
21
Results point out that crystallization of COPES 979-05 should start by the
arrangement of azelate rich moieties according to the favoured crystallization of PES
99 respect to PES 97 a feature clearly supported by primary nucleation crystal growth
rate and overall crystallization rate data Pimelate units seem to be mainly incorporated
as defects into the interlamellar amorphous region giving rise to the observed increase
in the corresponding spacing In fact and as explained above FTIR spectra revealed
also that crystalline bands associated with PES 99 were predominant in the copolymer
sample
Combined SAXS and WAXD data were used to verify the assignment of la and lc
thicknesses which could not be distinguished from the analysis of the correlation
function [48-51] Thus the ratio between XcWAXD
and XcSAXS
is an estimate of the
volume-filling fraction of the lamellar stacks XS which should be lower than 1 for a
correct assignment For example ratios of 089 096 and 082 were determined for PES
99 PES 97 and COPES 979-05 respectively at the end of crystallization
CONCLUSIONS
Thermal polycondensation using titanium tetrabutoxyde as a catalyst was successfully
used to obtain copolyesters constituted by 19-nonanediol and different ratios of azelaic
and pimelic acid units Final copolymer compositions were always in good agreement
with the feed molar ratio and the attained molecular weights were typical of
polycondensation reactions involving monomers with different functionality
The copolymer with the intermediate composition (ie COPES 979-05) had lowest
melting temperature and melting enthalpy However the crystallinity of this sample was
still high It seemed possible to incorporate comonomer units into the crystalline
structure of each homopolymer
22
Homopolymers and copolymers crystallized according to a spherulitic growth and a
heterogeneous primary nucleation Significant differences were found between the
spherulitic textures (ie fibrilar or ringed) and even on the crystallization kinetics of
PES 97 and PES 99 homopolymers Specifically non-isothermal crystallization from
the melt was less favourable for the PES 97 sample and consequently the COPES
979-05 copolymer started to crystallize by the arrangement of azelate moieties
X-ray diffraction data indicated that crystallization always occurred according to a
lamellar insertion mechanism Significant differences were observed between crystal
lamellar and amorphous layer thicknesses of homopolymers and the copolymer with
intermediate composition Optical microscopy DSC SAXS and FTIR data suggested
that this copolymer crystallized giving rise to lamellar cores with a predominant PES
99 structure and that pimelate units were mainly located on the amorphous
interlamellar regions
Acknowledgements Authors are in debt to supports from MINECO and FEDER
(MAT2012-36205) and the Generalitat de Catalunya (2009SGR1208) Diffraction
experiments were performed at NCD beamline at ALBA Synchrotron with the
collaboration of ALBA staff
23
REFERENCES
[1] Lligadas G Ronda JC Galiagrave M Caacutediz V (2007) Poly(ether urethane) Networks
from Renewable Resources as Candidate Biomaterials Synthesis and
Characterization Biomacromolecules 8686-692
[2] Petrovic ZS (2008) Polyurethanes from Vegetable Oils Polym Rev 48109-155
[3] Hojabri L Kong X Narine SS (2010) Functional Thermoplastics from Linear
Diols and Diisocyanates Produced Entirely from Renewable Lipid Sources
Biomacromolecules 11 911-918
[4] Lligadas G Ronda JC Galiagrave M Caacutediz V (2010) Plant Oils as Platform
Chemicals for Polyurethane Synthesis Current State-of-the-Art
Biomacromolecules 112825-2835
[5] Doi Y Steinbuumlchel A (2002) Polyesters II ndash properties and chemical synthesis
New York Wiley-VCH
[6] Huang SJ (1985) Encyclopedia of polymer science and engineering vol 2 New
York Wiley-Interscience pp 20
[7] Vert M Li S M Spenlehauer G Guerin P (1992) Bioresorbability and
biocompatibility of aliphatic polyesters J Mater Sci Mater Med 3432-446
[8] Edlund E Albertsson AC (1999) Novel Drug Delivery Microspheres from
Poly(15-dioxepan-2-one-co-L-lactide) J Polym Sci Part A Polym Chem
371877-1884
[9] Kulkarni RK Moore EG Hegyeli AF Leonard F (1971) Biodegradable
poly(lactic acid) polymers J Biomed Mater Res 5169-181
[10] Kricheldorf HR Kreiser-Saunders I Juumlrgens C Wolter D (1996) Polylactides -
Synthesis Characterization and Medical Application Macromol Symp 10385-
102
[11] Thombre AG Cardinal JR (1990) Enciclopedia of Pharmaceutical Technology
2 New York Marcel Dekker pp 61
[12] Fujimaki T (1998) Processability and properties of aliphatic polyesters
lsquoBIONOLLErsquo synthesized by polycondensation reaction Polym Degrad Stab
59209-214
[13] Shih Y-F Wu T-M (2009) Enzymatic degradation kinetics of poly(butylene
succinate)nanocomposites J Polym Res 16109-115
24
[14] Lai SM Huang CK Shen HF (2005) Preparation and Properties of
Biodegradable Poly(butylene succinate)Starch Blends J Appl Polym Sci
97257-264
[15] Fuller CS (1939) X-ray investigation of the decamethylene series of polyesters
J Am Chem Soc 612575-2580
[16] Kanamoto T Tanaka K (1971) Growth and morphology of single crystals of
linear aliphatic polyesters J Polym Sci Part A-2 92043-2060
[17] Ueda AS Chatani Y Tadokoro H (1971) Structural Studies of Polyesters IV
Molecular and Crystal Structures of Poly(ethylene succinate) and Poly(ethylene
oxalate) Polym J 2387-397
[18] Aylwin PA Boyd RH (1984) Aliphatic polyesters as models for relaxation
processes in crystalline polymers 1 Characterization Polymer 25323-329
[19] Liau WB Boyd RH (1990) Structure and packing in crystalline aliphatic
polyesters Macromolecules 231531-1539
[20] Brandrup J Immergut H (1989) Polymer Handbook New York Wiley
[21] Almontassir A Gestiacute S Franco L Puiggaliacute J (2004) Molecular Packing of
Polyesters Derived from 14-Butanediol and Even Aliphatic Dicarboxylic Acids
Macromolecules 375300-5309
[22] Gestiacute S Almontassir A Casas MT Puiggaliacute J (2004) Molecular packing and
crystalline morphologies of biodegradable poly(alkylene dicarboxylate)s derived
from 16-hexanediol Polymer 458845-8861
[23] Gestiacute S Almontassir A Casas MT Puiggaliacute J (2006) Crystalline Structure of
Poly(hexamethylene adipate) Study on the Morphology and the Enzymatic
Degradation of Single Crystals Biomacromolecules 7799-808
[24] Gestiacute S Casas MT Puiggaliacute J (2007) Crystalline structure of
poly(hexamethylene succinate) and single crystal degradation studies Polymer
485088-5097
[25] Lu J-S Chen M Lu S-F Chen C-H (2011) Nonisothermal crystallization
kinetics of novel biodegradable poly(butylene succinate-co-2-methyl-13-
propylene succinate)s J Polym Res 181527-1537
[26] Champetier G Monnerie L (1969) Introduction agrave la chimie macromoleacuteculaire
Paris Masson et Cie
[27] Allegra G Bassi IW(1969) Isomorphism in synthetic macromolecular systems
Adv Polym Sci 6549-574
25
[28] Mochizuki M Mukai K Yamada K Ichise N Murase S Iwaya Y (1997)
Structural Effects upon Enzymatic Hydrolysis of Poly(butylene succinate-co-
ethylene succinate)s Macromolecules 307403-7407
[29] George Z Papageorgiou Bikiaris Dimitrios N (2007) Synthesis
Cocrystallization and Enzymatic Degradation of Novel Poly(butylene-co-
propylene succinate) Copolymers Biomacromolecules 82437-2449
[30] Li X Hong Z Sun J Geng Y Huang Y An H et al (2009) Identifying the
Phase Behavior of Biodegradable Poly(hexamethylene succinate-co-
hexamethylene adipate) Copolymers with FTIR J Phys Chem 1132695-2704
[31] Li X Sun J Huang Y Geng Y Wang X Ma Z et al (2008) Inducing New
Crystal Structures through Random Copolymerization of Biodegradable
Aliphatic Polyester Macromolecules 413162-3168
[32] Liang Z Pan P Zhu B Dong T Hua L Inoue Y (2010) Crystalline Phase of
Isomorphic Poly(hexamethylene sebacate-co-hexamethylene adipate)
Copolyester Effects of Comonomer Composition and Crystallization
Temperature Macromolecules 432925-2932
[33] Liang Z Pan P Zhu B Inoue Y (2011) Isomorphic crystallization of aliphatic
copolyesters derived from 16-hexanediol Effect of the chemical structure of
comonomer units on the extent of cocrystallization Polymer 522667-2676
[34] Rueda DR Garciacutea-Gutieacuterrez MC Nogales A Capitaacuten MJ Ezquerra TA
Labrador A Fraga E Beltraacuten D Juanhuix J Herranz JF Bordas J (2006)
Versatile wide angle diffraction setup for simultaneous wide and small angle x-
ray scattering measurements with synchrotron radiation Rev Sci Instrum 77
Art No 033904
[35] Rajkumar G AL-Khayat HA Eakins F Knupp C Squire JM (2007) The
CCP13 FibreFix program suite semi-automated analysis of diffraction patterns
from non-crystalline materials J Appl Crystallogr 40 178ndash184
[36] Herrera R Franco L Rodriacuteguez-Galaacuten A Puiggaliacute J (2002) Characterization
and degradation behavior of poly(butylene adipate-co-terephthalate)s J Polym
Sci Part A Polym Chem 40 4141-4157
[37] Pamula E Blazewicz M Paluszkiewicz P Dobrzynski (2001) FTIR study of
degradation products of aliphatic polyestersndashcarbon fibres composites J Mol
Struct 596 69-75
[38] Avrami M (1939) Kinetics of Phase Change I General Theory J Chem Phys
71103-1120
[39] Avrami M (1940) Kinetics of Phase Change II Transformation‐Time
Relations for Random Distribution of Nuclei J Chem Phys 8212-224
26
[40] Hoffman JD Weeks JJ (1962) Rate of Spherulitic Crystallization with Chain
Folds in Polychlorotrifluoroethylene J Chem Phys 371723-1741
[41] Lauritzen JI Hoffman JD (1973) Extension of theory of growth of chain‐folded
polymer crystals to large undercooling J Appl Phys 444340-4352
[42] Strobl G (2000) From the melt via mesomorphic and granular crystalline layers
to lamellar crystallites A major route followed in polymer crystallization Eur
Phys J E 3165-183
[43] Muthukumar M (2000) Commentary on theories of polymer crystallization
Eur Phys J 3199-202
[44] Williams ML Landel RF Ferry JD (1955) The Temperature Dependence of
Relaxation Mechanisms in Amorphous Polymers and Other Glass-forming
Liquids J Am Chem Soc 773701-3707
[45] Suzuki T Kovacs A (1970) Temperature dependence of spherulitic growth rate
of isotactic polystyrene J Polym J 182-100
[46] Vonk CG Kortleve G (1967) X-ray small-angle scattering of bulk
polyethylene Kolloid Z Z Polym 22019-24
[47] Vonk CG (1975) A general computer program for the processing of small-
angle X-ray scattering data J Appl Cryst 8340-341
[48] Hsiao BS Gardner KH Wu DQ Chu B (1993) Time-resolved X-ray study of
poly(aryl ether ether ketone) crystallization and melting behaviour 1
Crystallization Polymer 343986-3995
[49] Ikada Y Jamshida K Tsuji H Hyoan SH (1987) Maltopentaose- and
maltoheptaose-carrying styrene macromers and their homopolymers
Macromolecules 20906-908
[50] Kruger KN Zachmann HG (1993) Investigation of the melting behavior of
poly(aryl ether ketones) by simultaneous measurements of SAXS and WAXS
employing synchrotron radiation Macromolecules 26 5202-5208
[51] Hsiao BS Wang Z Yeh F Yan G Sheth KC (1999) Time-resolved X-ray
studies of structure development in poly(butylene terephthalate) during
isothermal crystallization Polymer 403515-3523
27
FIGURE CAPTIONS
Figure 1 Synthesis of copoly(alkylene dicarboxylate)s from 19-nonanediol and
pimelic and azelaic acids
Figure 2 Transmitance FTIR spectra (1400-800 cm-1
) of amorphous (red profiles) and
semicrystalline (blue profiles) PES 97 (a) PES 979-050 (b) and PES 99 (c) samples
Boxes highlight characteristic crystalline bands in the spectrum of the copolymer that
can be related to each homopolymer (see arrows) Asterisk points to the splitting of the
1090-1070 cm-1
amorphous band for the PES 97 sample
Figure 3 DSC traces obtained with the COPES 979-050 copolymer during the
heating run (20 ordmCmin) of the as-synthesized sample (a) the cooling run (10 ordmCmin)
after keeping the sample in the melt state for three minutes (b) the heating run (20
ordmCmin) of the hot crystallized sample (c) and the heating run (20 ordmCmin) of a sample
previously cooled at the maximum rate allowed by the equipment from the melt state
(d) The inset shows a magnification where the glass transition is clearly observed
Figure 4 Variation of the melting temperature and enthalpy of poly(nonamethylene
azelate-co-pimelate)s with the molar percentage of azelate units Enthalpies are given as
kJmol considering the molecular weight of the repeat unit determined according to the
copolymer composition
Figure 5 a) Exothermic DSC peaks corresponding to the hot isothermal crystallizations
of COPES 979-050 at temperatures between 54 and 51 ordmC Inset shows the
development of relative crystallinity over time for the indicated isothermal
crystallizations b) Avrami plots corresponding to the isothermal crystallization of
28
COPES 979-050 c) Overall crystallization rates (full symbols and solid lines) and the
reciprocal of the crystallization half-times (empty symbols and dashed lines) determined
at different temperatures for PES 99 () PES 97 (∆) and COPES 979-050 ()
samples
Figure 6 a) DSC heating runs (20 ordmCmin) of COPES 979-050 samples isothermally
crystallized at temperatures ranging from 54 to 51 ordmC b) Hoffman-Weeks plot of
temperatures corresponding to endothermic melting peaks versus crystallization
temperature for several COPES 979-x samples For the sake of clarity experimental
data of some intermediate compositions are described by dashed lines Equilibrium
melting temperatures are explicitly indicated at the corresponding intersection points
Figure 7 Polarized optical micrographs of spherulites of PES 97 (a) COPES 979-
050 (b) and PES 99 (c) crystallized at temperatures of 53 ordmC 51 ordmC and 59 ordmC
respectively For the sake of completeness spherulites of a 50 molar mixture of PES
97 and PES 99 homopolymers and crystallized at 56 ordmC are shown in (d)
Figure 8 a) Plots of COPES 979-050 spherulite radii versus crystallization time for
isothermal hot crystallizations performed at temperatures between 506 and 53 ordmC b)
Temperature dependence of the crystal growth rate for PES 99 PES 97 and COPES
979-050 samples c) Change in the nucleation density of PES 99 PES 97 and
COPES 979-050 samples with isothermal crystallization temperature
Figure 9 Plot of ln G + U
R(Tc-T) versus 1 Tc (T) f to determine the Kg
nucleation parameter of PES 99 PES 97 and COPES 979-050 samples
Figure 10 Time-resolved SAXS (a) and WAXD (b) three-dimensional profiles of PES
97 during non-isothermal hot crystallization at 3 ordmCmin
29
Figure 11 WAXD (a) and SAXS (b) profiles of PES 99 PES 97 and COPES 979-
050 samples taken at room temperature The amorphous halo obtained by
deconvolution is explicitly shown for the copolymer sample
Figure 12 Correlation functions (a) for non-isothermal hot crystallization of PES 99
PES 97 and COPES 979-050 samples b) Temperature evolution of Ldiams lc () and
la () during non-isothermal hot crystallization performed at 3 ordmCmin with PES 99
(dashed lines) PES 97 (solid lines) and COPES 979-050 (dotted lines) samples
30
Table 1 Synthesis data of studied polyesters
Polymer Yield
()
fPa
Mnb
(gmol)
Mwb
(gmol)
PDIbc
PES 97 73 1 7900 19600 247
COPES 979-085 67 086 9400 21900 233
COPES 979-070 76 071 9800 23000 236
COPES 979-050 78 053 13500 32300 240
COPES 979-030 78 032 11700 29900 257
COPES 979-015 65 017 12700 31800 250
PES 99 73 0 13300 35900 270
aPimelate molar fraction determined from
13C NMR spectra
bFrom GPC
cPolydispersity index
31
Table 2 Main crystallization kinetic parameters determined by DSC for the two
homopolymers and the copolymer with the highest comonomer content
Sample T (ordmC) Z 106
(s-n
)
n K 103
(s-1
) 1 τ12 10
3
(s-1
)
(Zln2)1n
103
(s
-1)
PES 97
52 849 239 754 887 879
53 034 266 371 430 426
54 026 247 219 256 255
55 0063 248 127 148 148
56 221 10-03
263 051 058 058
57 855 10-05
288 032 035 035
COPES 979-050
51 815 226 558 659 656
52 299 225 353 415 415
525 013 251 179 209 208
53 0025 251 094 110 109
54 178 10-04
278 031 036 036
PES 99
56 1848 260 1523 1793 175
57 028 294 589 682 667
58 0077 281 292 331 332
59 280 10-03
279 086 097 099
32
FIGURE 1
Diacuteaz et al
33
FIGURE 2
Diacuteaz et al
Tra
ns
mit
tan
ce
(
)
Wavenumber (cm-1
)
838cm-1
a)
Tra
ns
mit
tan
ce
(
)
Wavenumber (cm-1
)
b)
Tra
ns
mit
tan
ce
(
)
Wavenumber (cm-1
)
c)
1242 cm-1
34
FIGURE 3
Diacuteaz et al
0 10 20 30 40 50 60 70 80
015
025
035
045
-80 -60 -40 -20
-501 ordmC
611 ordmC
1122 Jg
605 ordmC
969 Jg
959 Jg
460 ordmC
958 Jg
a)
b)
c)
d)
Temperature (ordmC)
En
do
35
FIGURE 4
Diacuteaz et al
60
62
64
66
68
0 20 40 60 80 100
Azelate Units ()
Melt
ing
Tem
pera
ture (
ordmC)
28
30
32
34
Melt
ing
En
tha
lpy
(k
Jm
ol)
(ordmC
)
(kJ
mo
l)
36
FIGURE 5
Diacuteaz et al
0 20 40 60 80 100 120 140
En
do
ther
m
Time (min)
51 ordmC
52 ordmC
525 ordmC
53 ordmC
54 ordmC
0
20
40
60
80
100
0 20 40 60 80 100
Cry
sta
llin
ity
(
)Time (min)
53 ordmC54 ordmC
51 ordmC52 ordmC
525 ordmC
-1
-08
-06
-04
-02
0
02
04
18 28 38
log
-ln
[1-χ
(t)]
log (t-t0) (s)
51 ordmC
52 ordmC
525 ordmC 53 ordmC
54 ordmC
0
5
10
15
20
0
5
10
15
20
50 52 54 56 58 60
1t
12
1
03
(s-1
)
k
10
3(s
-1)
Temperature (ordmC)
PE979-05
PE97
PE99
b)
c)
a)
COPES 979-05
PES 97
PES 99
37
FIGURE 6
Diacuteaz et al
45
50
55
60
65
70
75
80
85
45 50 55 60 65 70 75 80 85
Temperature (ordmC)
Tem
per
atu
re (
ordmC)
PE 99
PE 979-05PE 97
PE 979-015PE 979-085
Temperature (ordmC)
En
doth
erm
50 55 60 65 70 75
a) COPES 979-05
510 ordmC
520 ordmC
525 ordmC
530 ordmC
540 ordmC
792 ordmC
779 ordmC
750 ordmC
748 ordmC
728 ordmC
b)
(ordmC
)
PE 979-
015
PE 979-
085
COPES 979-085
COPES 979-015
PES 99
COPES 979-05
PES 97
38
FIGURE 7
Diacuteaz et al
50 m
PES 97 a)
50 m
PES 99 c)
50 m
COPES 979-05 b)
50 m
d) PES 97 + PES 99
39
0
20
40
60
80
100
120
140
47 52 57 62
Nu
clei
im
m2
Temperature (ordmC)
PES 97
PES 99
COPES 979-050
0
5
10
15
20
25
30
35
0 20 40 60 80
Time (min)
Sp
heru
lite
Rad
ius
( m
)
T = 53 ordmC
T = 52 ordmC
T = 515 ordmC
T = 51 ordmC
T = 506 ordmC
0
5
10
15
20
25
30
35
40
45 50 55 60
Gro
wth
Rate
(micro
mm
in)
Temperature (ordmC)
PES 99
PES 97
COPES 979-050
(microm
)
a)
b)
c)
FIGURE 8
Diacuteaz et al
40
FIGURE 9
Diacuteaz et al
PES 99
PES 97
COPES 979-050
41
FIGURE 10
Diacuteaz et al
FIGURE 12
Diacuteaz et al
42
0 02 04 06 08
I q
2(a
u)
q (nm-1)
PES 99
PES 97
COPES 979-05
0
200
400
600
800
108 128 148 168 188
I (a
u
)
q (nm-1)
PES 99
PES 97
COPES 979-05
a)
b)
0370 nm
0372 nm
0373 nm
0414-0413 nm
FIGURE 11
Diacuteaz et al
43
FIGURE 12
Diacuteaz et al
0
5
10
15
20
25
22283440465258
Temperature (ordmC)
Sp
acin
g (
nm
)
b) a)
PES 97
COPES 979-050
PES 99
Lγ
Lγ
Lγ

3
INTRODUCTION
Great efforts are being focused into the development of biodegradable polymers from
renewable resources to avoid problems associated with more conventional
petrochemical feedstocks such as decreasing availability increasing price and indeed
environmental pollution caused by plastic waste Vegetable oils are a promising
alternative since coming from abundant and economical biological sources can lead to
biodegradable materials Specifically potential applications and uses of polyols and
polyurethanes derived from plant oils are well known [1-4]
Polyesters also constitute a family of degradable polymers of great and increasing
interest since they can cover a wide range of applications as specialities mainly in the
biomedical field and commodities [5-11] Poly(alkylene dicarboxylate)s a specific
group within polyesters are gaining increasing attention because the marketing of
polybutylene succinate which is supplied by Showa High Polymers as BionolleTM
and
is characterized by a relatively low production cost easy processability and good
thermal and mechanical properties [1214] Several works in the literature deal with the
structure and crystallization process of poly(alkylene dicarboxylate)s [15-25] It was
demonstrated that their molecular conformation and packing arrangement depend on the
length of the polyalkylene segment and the parity of chemical units involved (ie odd or
even number of main chain atoms) However studies have mainly been focused on
even-even compounds and little attention has been devoted to the odd-odd series
probably because of their expected low thermal properties This problem can be
overcome by using monomers with a high content of methylene groups as the melting
point of polyesters generally increases when the ratio between ester and methylene
groups in the main chain decreases [26]
4
Commodity oils like sunflower can provide high purity fatty acids (eg oleic acid)
which can be used for chemical synthesis of dicarboxylic acid and diol monomers of
poly(alkylene dicarboxylate)s Thus azelaic acid and 19-nonanediol can be obtained by
ozonolysis cleavage of the alkene double bond of oleic acid and subsequent oxidation
and reduction [3]
The main goal of this work is the basic characterization and study of the crystallization
process of odd-odd polyesters derived from natural resources specifically from 19-
nonanediol pimelic and azelaic acids Special attention is paid to copolymers obtained
from mixtures of both dicarboxylic acids since melting points crystallinities and basic
morphologies can vary according to their ratio Note that azelate and pimelate moeities
have a highly similar chemical structure and consequently an identical molecular
conformation is expected In this way comonomer units could be compatible in such a
way that they are able to share a crystalline lattice [27] This could occur in the
isomorphic co-crystallization where only one crystalline phase containing both
crystalline units is developed and in the isodimorphic crystallization when at least one
of the two crystalline phases incorporates the corresponding minor component in its
crystalline lattice Several works have recently addressed the isomorphic crystallization
of copoly(alkylene dicarboxylate)s which were mainly constituted by even units such
as poly(butylene succinate-co-ethylene succinate) [28] poly(butylene succinate-co-
propylene succinate) [29] poly(hexamethylene succinate-co-hexamethylene adipate)
[30] poly(hexamethylene sebacate-co-hexamethylene adipate) [3132]
poly(hexamethylene sebacate-co-hexamethylene suberate) [33] and poly(hexamethylene
suberate-co-hexamethylene adipate) [33] Results pointed out that isomorphism was
feasible and that a smaller difference between the chemical structure of comonomer
5
units led to less free energy to incorporate foreign units and to a higher extent of
comonomer unit inclusion in the host crystalline lattice [33]
EXPERIMENTAL SECTION
Materials
All reagents and solvents were purchased from Sigma-Aldrich and used without further
purification
Poly(nonamethylene pimelate) (PES 97) poly(nonamethylene azelate) (PES 99) and
poly(nonamethylene azelate-co-pimelate) (COPES 979-x) were synthesized by thermal
polycondensation of the appropriate mixture of dicarboxylic units with an excess of 19-
nonanediol (221 molar ratio) (Figure 1) Abbreviations denote PES for polyester
COPES for copolyester the first digit for the number of carbon atoms of the diol unit
the second digit for the number of carbon atoms of the dicarboxylic unit (or 79 for the
copolymer) and x for the molar ratio between pimelate and azelate units in the reaction
mixture Titanium tetrabutoxyde was used as a catalyst and the reaction was first
performed in a nitrogen atmosphere at 150 ordmC for 6 h and then in vacuum at 180 ordmC for
18 h Polymers were purified by precipitation with ethanol of chloroform solutions (10
wt-)
Measurements
Molecular weights were estimated by GPC using a liquid chromatograph (Shimadzu
model LC-8A) equipped with an Empower computer program (Waters) and a refractive
index detector A PL HFIP gel guard precolumn and PL HFIP gel column (Agilent
Technologies Deutschland GmbH) were employed The polymer was dissolved and
eluted in 111333-hexafluoroisopropanol at a flow rate of 05 mLmin (injected
6
volume 100 L sample concentration 15 mgmL) The number and weight average
molecular weights were calculated using polymethyl methacrylate standards
1H- and
13C-NMR spectra were acquired with a Bruker AMX-300 spectrometer
operating at 3001 MHz and 757 MHz respectively Chemical shifts were calibrated
using tetramethylsilane as an internal standard Deuterated chloroform was used as the
solvent
Infrared absorption spectra were recorded with a Fourier Transform FTIR 4100 Jasco
spectrometer in the 4000-600 cm-1
range A Specac model MKII Golden Gate
attenuated total reflection (ATR) with a heated Diamond ATR Top-Plate was used
Calorimetric data were obtained by differential scanning calorimetry with a TA
Instruments Q100 series equipped with a refrigerated cooling system (RCS) operating
from -90 ordmC to 550 ordmC Experiments were conducted under a flow of dry nitrogen with a
sample weight of approximately 10 mg while calibration was performed with indium
Heating and cooling runs were performed at rates of 20 ordmCmin and 10 ordmCmin
respectively
Spherulites of polyesters were grown from homogeneous melt-crystallized thin films
placed between two cover glasses These films were obtained by evaporation of a dilute
solution of the polymer in chloroform Samples were crystallized isothermally at
different temperatures below the melting point using a Linkam temperature control
system configured by a THMS 600 heating and freezing stage connected to an LNP 94
liquid nitrogen cooling system Films with thickness lower than 10 m were obtained
by this experimental procedure Optical photographs were taken using a Zeiss AxioCam
MRC5 digital camera mounted on a Zeiss Axioskop 40 Pol light polarizing microscope
A first-order red tint plate was used to determine the sign of spherulite birefringence
under crossed polarizers
7
Simultaneous time-resolved SAXSWAXD experiments were taken at the NCD
beamline (BL11) of the Alba synchrotron radiation light facility of Cerdanyola del
Valles (Catalunya) The beam was monochromatized to a wavelength of 0098 nm and
the samples were confined between Kapton films SAXS and WAXD profiles were
acquired simultaneously during heatingcooling experiments in time frames of 12 s
Samples were held above fusion for 3 min to erase thermal history before performing
the subsequent cooling run All heating and cooling runs were performed at a rate of 3
ordmCmin Two linear position-sensitive detectors were used [34] the SAXS detector was
calibrated with different orders of diffraction from silver behenate whereas the WAXD
detector was calibrated with diffractions of a standard of an alumina (Al2O3) sample
The diffraction profiles were normalized to the beam intensity and corrected
considering the empty sample background WAXD peaks were deconvoluted with the
PeakFit v4 program by Jandel Scientific Software The correlation function and
corresponding parameters were calculated with the CORFUNC program [35] for Fibre
Diffraction Non-Crystalline Diffraction provided by the Collaborative Computational
Project 13
RESULTS AND DISCUSSION
Synthesis of PES 97 PES 99 and COPES 979-x samples
The results summarized in Table 1 indicate that samples could be synthesized with a
polydispersity index (PDI) and a molecular weight typical of polycondesation reactions
involving two monomers with different functionality (ie diol and dicarboxylic units)
Thus PDI and Mn ranged from 233 to 270 and from 7900 to 13300 gmol
respectively A clear trend for the dependence of molecular weigth with composition
was not observed although lower molecular sizes were achieved when pimelic acid
content in the reaction mixture was higher In any case molecular weights were
8
sufficient to ensure film- and fiber-forming properties Polymerization yields
determined after reprecipitation of samples varied in a narrow range (65-78 ) no
relationship between yield and monomer feed ratio indicative of a preferred reactivity
was observed
Infrared spectra of all samples synthesized revealed the characteristic absorption bands
for methylene (2931-2925 and 2852-2851 cm-1
) C=O (1731-1729 cm-1
) and C-O
(asymmetric and symmetric stretchings at 1242-1223 and 1171-1167 cm-1
respectively) Figure S1a in Supporting information (SI) shows a representative
spectrum obtained for PES 99 homopolymer whereas a detailed summary of absorption
bands is given in Table S1 in SI (discussed below)
1H NMR spectra were highly similar for all samples showing characteristic signals at
404 (O-CH2) 227 (C(O)-CH2) 160 (O-CH2CH2 + C(O)-CH2CH2) and 130 ppm as
can be seen in Figure S2b in SI for PES 99 The relative intensity of the last signal was
the only difference between the spectra as logically deduced from the different number
of methylene protons of azelate and pimelate units that contributed to the indicated
signal
13C-NMR spectra were more powerful since the vicinal carbons of the dicarboxylate
units appeared well differentiated (ie 3429 and 3410 ppm for azelate and pimelate
units respectively) Figure S2 in SI shows a representative 13
C NMR spectrum with the
assignment of the observed signals The variation in intensity associated with the two
kinds of C(O)-CH2 carbon atoms with copolymer composition is also pointed out The
areas of these two signals were used to determine the pimelate molar fraction
fP = A3410 (A3429 + A3410) (1)
Table 1 shows that the experimental composition of all copolymers is in full agreement
with the feed monomer ratio
9
Unfortunately both 1H and
13C NMR spectra were insensitive to triad effects and
consequently no information concerning sequence distribution could be derived
Specifically the O-CH2 protons were not split in the 1H NMR spectra and became
insensitive to the two different dicarboxylic units to which the diol could be linked A
triplet was always clearly detected since very few differences were expected due to the
large number of aliphatic methylene groups of both azelaic and pimelic units On the
contrary splitting has been reported when dicarboxylic units of clearly different nature
(ie aliphatic or aromatic) were used [36]
Infrared spectroscopic data of amorphous and crystalline PES 97 PES 99 and
COPES 979-05 samples
FTIR is highly sensitive to molecular conformation and packing density hence its
usefulness in polymer crystallization studies Characteristic bands can be correlated to
the crystalline and amorphous phases of the bulk and typically remain distinguishable
over the course of crystallization
FTIR spectra corresponding to semicrystalline and amorphous samples were obtained
from the as-synthesized samples at room temperature and at 90 ordmC (ie about 30 ordmC
above the melting temperature of each polymer) respectively Figure 2 compares the
characteristic spectra of PES 97 PES 99 and COPES 979-05 amorphous and
semicrystalline samples whereas the main absorption bands are summarized in Table
S1 in SI
Spectra of amorphous samples were practically identical due to the similar chemical
repeat units and also to the similar molecular interactions that should be established in
the melt state Only minor differences were detected in the broad band near 1090-1070
cm-1
since it was split in the pimelate rich samples (see asterisk in Figure 2)
10
Transmission bands generally became broader in the spectra of amorphous samples and
could therefore be distinguished from those associated with crystalline domains which
appeared at the same wavenumber This is the case for example of the asymmetric
stretching bands of the C-O group of PES 97 which is observed for both crystalline
and amorphous phases at 1242 cm-1
On the contrary a significant wavenumber
difference was found for PES 99 (ie 1240 and 1223 cm-1
) In the amorphous state this
stretching mode appeared at the same wavenumber for both homopolymers whereas a
large difference was found in the crystalline state due to a different molecular
environment of the ester groups Bands at 1345-1315 1028-1017 954-958 and 921-918
cm-1
were also noticeable since appeared in the semicrystalline samples only
The spectrum of the semicrystalline COPES 979-05 sample is highly interesting since
some bands were split and appeared at the typical wavenumbers of the corresponding
homopolymers Thus the asymmetric stretching of the C-O group gave rise to two
narrow bands at 1242 and 1224 cm-1
indicating that two kinds of ester groups exist in
the copolymer as a result of different interactions with neighboring chains Specifically
some ester groups had the same arrangement as the PES 97 crystalline structure
whereas other groups were arranged according to the PES 99 structure Furthermore it
is qualitatively observed that the intensity of the 1224 cm-1
band is clearly greater and
consequently the PES 99 arrangement seems to be predominant The difference on
intensities cannot be justified by distinct relative absorption coefficients since both
bands appeared with similar intensity in the spectra (not shown) of an equimolar
mixture of the two homopolymers
Similar considerations can be made about the copolymer bands at 1344 and 1312 cm-1
which are attributed to deformational CH2 vibrations of polyesters [37] and are related
to those observed at 1345 cm-1
and 1315 cm-1
in PES 97 and PES 99 homopolymer
11
spectra respectively Again the higher intensity was found for the band associated with
the PES 99 structure Finally some bands like that at 1024 cm-1
and even that at 956
cm-1
appeared in the copolymer at an intermediate wavenumber with respect to the
homopolymers (ie 1028 and 954 and 1017 and 958 cm-1
for PES 97 and PES 99
respectively)
Calorimetric data of PES 97 PES 99 and COPES 979-x samples
Thermal properties of the synthesized sample were determined by the four run protocol
depicted in Figure 3 for a representative copolymer Melt and hot crystallization data
together with glass transition temperatures are summarized in Table Srdquo in SI for all
samples Several points merit further discussion
a) All samples were semicrystalline and showed a single melting peak independent of
the crystallization procedure (ie from solution or from the melt) No multiple melting
peaks were observed and consequently no evidence of distinct crystal populations with
different lamellar thicknesses was found
b) Samples were able to crystallize from the melt state at the maximum rate allowed by
the equipment Thus no cold crystallization peaks were detected in the heating run of
quenched samples whereas melting peaks were clearly observed (eg Figure 3d) In
addition these peaks had practically the same enthalpy as those measured at a slow
cooling rate for hot crystallized samples (Figure 3b) and even for solution crystallized
samples (Figure 3a)
c) The melting temperature of each homopolymer decreased with the comonomer
content The eutectic composition and minimum temperature corresponded to the
COPES 979-50 sample (Figure 4) In addition PES 99 had a higher melting
temperature than PES 97 as can be presumed from its higher methylene content [26]
12
d) Melting enthalpies of all samples were always high Thus azelate and pimelate
units were easily incorporated into the PES 97 and PES 99 crystalline structures
respectively Despite the small variation a slight decrease was observed in the melting
enthalpy of each homopolymer when comonomer units were incorporated as shown in
Figure 4 for samples crystallized from the melt The minimum enthalpy was achieved
with the COPES 979-50 sample and the variation was higher when PES 99 was
impurified due to its higher enthalpy compared with PES 97
e) Solution crystallized samples always had a higher melting enthalpy than melt
crystallized samples However a similar dependence of enthalpy upon composition was
observed
f) Non-isothermal crystallization from the melt state required a rather similar degree
of supercooling (eg between 13 and 18 ordmC at a cooling rate of 10 ordmCmin) for all
samples Thus the peak crystallization temperature of PES 97 was lower than that of
PES 99 and logically higher than that of copolymers
g) Glass transition temperatures ranged in a narrow interval (-45 ordmC to -60 ordmC) for all
samples the lower values corresponding to COPES 979-x copolymers despite having a
higher molecular weight than PES 97 homopolymer
DSC isothermal crystallization study of PES 97 PES 99 and COPES 979-05
samples
Figure 5a shows the DSC exotherms of the COPES 979-05 sample during
crystallization experiments from the melt state at selected temperatures Peaks logically
shifted to higher times and became broader with increasing the crystallization
temperature The time evolution of the relative degree of crystallinity (t) was
determined through the ratio area of the exotherm up to time t divided by the total
exotherm area ie
13
(t) = t
tdtdtdH
0)(
0)(
tdtdtdH (2)
where dHdt is the heat flow rate and t0 the induction time A characteristic sigmoidal
dependence on time was always found as plotted in Figure 5a (inset)
Kinetic crystallization data were analyzed assuming the well-known Avrami equation
[3839] for primary crystallization
1 - (t) = exp[-Z (t-t0)n] (3)
where Z is the temperature-dependent rate constant and n the Avrami exponent whose
value varies with the crystallization mechanism A normalized rate constant k = Z1n
is
usually evaluated for comparison since its dimension (time-1
) is independent of the
value of the Avrami exponent
Table 2 summarizes the main kinetic parameters of the primary crystallization process
of the homopolymers and COPES 979-05 copolyester as deduced from the plots of
log-ln[1-(t)] against log (t - t0) (Figure 7b for COPES 979-05) The values of the
Avrami exponent for the hot isothermal crystallizations lie in a narrow range from 225
to 294 258 being the average value This suggests a predetermined (heterogeneous)
nucleation with spherical growth that occurred under geometric constraints since the
theoretical value should be equal to 3 Sporadic (heterogeneous) and homogeneous
nucleation can be clearly discarded as a higher exponent close to 4 should be derived
The values of the corresponding reciprocal crystallization half-times (112) calculated
as the inverse of the difference between the time at which crystallization begins and the
time at which 50 of crystallization is completed are also summarized in Table 2 This
parameter is a direct measure of the crystallization process and could therefore be used
to check the accuracy of the Avrami analysis by comparison with the theoretical kinetic
value (ie 112 = (Z ln 2)1n
) as reported in Table 2 A similar dependence of 112 and
the kinetic rate constant on the crystallization temperature for the three polymers can
14
also be inferred from Figure 5c This Figure also shows that PES 99 crystallized faster
than PES 97 despite having a greater molecular weight and that the lowest overall
crystallization rate corresponded to the copolyester as could be logically expected It
should be pointed out that the three samples required similar supercooling to start
crystallization since the melting points of PES 99 and the copolyester samples were the
highest and the lowest respectively
Isothermal crystallizations of the polymers gave rise to samples characterized by a
single melting peak which clearly shifted to higher temperatures with increasing
crystallization temperature (eg Figure 6a for the COPES 979-05 sample) These
results clearly reflect the lamellar thickening effect and make it possible to deduce the
equilibrium melting temperatures (ie those corresponding to an ideal infinite crystal)
by the Hoffman-Weeks approach (Figure 6b) [40] Theoretical equilibrium melting
temperatures of 792 and 748 ordmC were determined for the PES 99 and PES 97
homopolymers respectively Copolymerization decreased these temperatures according
to the comonomer content Thus the minimum value corresponded to the COPES 979-
05 sample (ie 728 ordmC)
Optical microscopy crystallization study of PES 97 PES 99 and COPES 979-05
samples
All polyester samples crystallized from the melt into spherulites with negative
birefringence but different textures (Figures 7a-7c) Ringed spherulites were mainly
observed with PES 99 over the whole range of tested crystallization temperature
whereas fibrillar textures were always observed for PES 97 For the sake of
completeness Figure 7d also shows the crystallization of a 50 molar mixture of the
two homopolymers which clearly differentiated from the COPES 979-05 spherulites
depicted in Figure 7b It should be pointed out that both kinds of spherulites (fibrillar
15
and ringed) were observed in the homopolymer mixture as expected for an independent
crystallization of each polymer On the contrary only fibrillar spherulites were observed
for the copolymer sample suggesting that cocrystallization took place as also deduced
from the calorimetric data It is also worth noting that this copolymer like PES 97
required a high degree of supercooling to crystallize
Crystallization from the melt of both homopolymers and the representative COPES
979-05 copolymer was studied by optical microscopy in the range where spherulites
with adequate dimensions formed and which varied from 62 ordmC to 47 ordmC depending on
the sample A larger dimension was obtained at temperatures sufficiently high to have a
low nucleation rate compared with the crystal growth rate This size decreased with the
crystallization temperature the minimum temperature considered for each polymer
being that corresponding to a final spherulite radius close to 10 m
Spherulite radii grew linearly with time up to impingement within the studied
temperature intervals (eg Figure 8a for the copolymer) and allowed the calculation of
the corresponding growth rates G displayed in Figure 8b The maximum G values
measured were clearly different the highest corresponding to PES 99 (ie 35 mmin)
and the lowest corresponding to the copolymer (ie 6 mmin) as could be presumed
Growth data were then analyzed in terms of crystallization regimes by the mathematical
expressions derived from the crystal growth and nucleation model proposed by
Lauritzen and Hoffman [41] It is nevertheless true that the physical meaning of this
model may be questioned on account of the new theories based on experimental
evidences and different theoretical calculations [4243]
The radial growth rate (G) of polymer spherulites was thereby calculated by the
Hoffman and Lauritzen equation [41]
G = G0 exp[-U(R(Tc- T))] exp[-Kg( Tc (T) f)] (4)
16
where G0 is a constant preexponential factor U represents the activation energy
characteristic of the transport of crystallizing segments across the liquid-crystal
interface T is a hypothetical temperature below which such motion ceases Tc is the
crystallization temperature R is the gas constant Kg is the secondary nucleation
parameter T is the degree of supercooling measured as Tm0-Tc and f is a correction
factor accounting for the variation in the bulk melting enthalpy per unit volume with
temperature (f = 2 Tc (Tm0 + Tc))
The sets of parameters most commonly used for U and T are those reported by
Williams-Landel-Ferry [44] (WLF) (U
= 4120 calmol and T = Tg - 516 K) and
Suzuki and Kovacs [45] (U
= 1500 calmol and T = Tg - 30 K) The plot of ln G +
UR(Tc-T) versus 1( Tc (T) f) for the PES 97 PES 99 and COPES 979-05
samples fitted well with a linear regression representative of a single crystallization
regime (Figure 9) when the second parameter set was employed The worst regression
coefficient was r2 09934 and the secondary nucleation parameters derived from the
slopes of the linear plots of PES 97 PES 99 and COPES 979-05 crystallization data
929 104 130 10
5 and 215 10
5 K
2 respectively The highest secondary nucleation
constant corresponded to the copolymer indicating greater difficulty of the lamellar
surface in inducing crystallization of incoming polymer chains Note also that the
crystal growth rate of COPES 979-05 became strongly dependent on the
crystallization temperature as shown in the G versus temperature plot (Figure 9b)
Nucleation constants were similar for the two homopolymers although a slightly lower
value was deduced for PES 97
In addition to the crystal growth rate the overall crystallization of a sample depends on
primary nucleation which may correspond to heterogeneous nuclei or homogeneous
nuclei Primary nucleation is often a rather complex process as it depends on the
17
crystallization temperature density of heterogeneities and presenceabsence of
nucleating agents The number of nuclei slightly increased during crystallization
suggesting a thermal nucleation where all nuclei became progressively active for a
given crystallization temperature A slight degree of heterogeneity in the spherulite size
was therefore observed at the end of the crystallization process Figure 9c shows that the
nucleation density increased with decreasing the crystallization temperature for the three
samples studied and approached a single exponential dependence which resulted in
more active nuclei (ie more favorable thermodynamic conditions for nucleus
generation) with progressively decreasing the temperature The lowest density
corresponding to the copolymer as could be presumed from its lower overall
crystallization rate determined from calorimetric data Note also that the copolymer and
the PES 99 samples had similar molecular weigths (Table 1) and therefore differences
on the crystal growth rate and primary nucleation density cannot be attributed to
molecular weigth changes Only PE 97 had a slightly lower molecular weight that
could justify an increase of both magnitudes Therefore the lower values with respect to
PE99 cannot be a consequence of he lower molecular size of PE 97
Study on the non-isothermal crystallization of PES 97 PES 99 and COPES 979-
05 samples by time-resolved SAXSWAXD experiments
Figure 10 contains time-resolved SAXS and WAXD profiles taken during non-
isothermal hot crystallization at a cooling rate of 3 ordmCmin for a representative polymer
(PES 97 homopolymer) In all cases the SAXS long period peak and crystal
diffractions appear simultaneously as expected for a crystallization process controlled
by nucleation and crystal growth
The SAXS long period peak is clearly seen at a value of the scattering vector q = 2sin
in the 028-039 nm-1
range after subtraction of the empty sample background
18
observed near the beam stop This peak which can be attributed to the lamellar structure
of the spherulites appeared at slightly different q values depending on the polymer
sample and shifted to higher q values (ie lower spacings) during crystallization
showing a more pronounced change in the initial stages
WAXD profiles showed an amorphous halo (q = 203 nm-1
) whose intensity decreased
with crystallization and on which Bragg reflections formed The most intense appeared
at 0414-0413 nm (q = 1518-1521 nm-1
) and 0370 nm (q = 1698 nm-1
) and should
correspond to the (110) (020) reflections of the typical structure of a polyalkylene
dicarboxylate [21-24] The intensity of the indicated reflections increased sharply at the
beginning of crystallization and slowly after a short time interval This second step
corresponds to a secondary crystallization which could also be envisaged from the
asymmetric shape of the DSC crystallization peaks (Figure 5b) WAXD profiles of the
two homopolymers and the COPES 979-05 copolymer are compared in Figure 13a
Note that the spacings observed for both homopolymers are practically identical and
consequently the similar packing arrangement should enable co-crystallization
The degree of crystallinity of the three samples could be estimated from the
corresponding room temperature profiles by considering the intensity of the amorphous
background (IB) and overall intensity (IT)
XcWAX
= (IT-IB ) IT (5)
WAXD measurements indicated that relative crystallinities ranged between 068 and
048 The highest and lowest values corresponded to PES 99 and the copolymer
respectively in agreement with DSC calorimetric data and the random disposition of
dicarboxylic units It should also be pointed out that PES 97 had practically the same
crystalline than PES 99 (ie 068 respect to 067) as can be qualitatively deduced from
the similar amorphous halo observed in the WAXD profile (Figure 11a)
19
SAXS profiles taken at the end of crystallization revealed clear differences between the
lamellar thicknesses of the three samples (Figure 11b) the highest and lowest
corresponding to COPES 997-05 and PES 97 respectively SAXS data were analyzed
in more detail during crystallization considering the normalized one-dimensional
correlation function [46] (r) which corresponds to the Fourier transform of the
Lorentz-corrected SAXS profile
(r) =
0
2 )cos()( dqqrqIq
0
2 )( dqqIq (6)
SAXS data were collected within a limited angular range only That is why
extrapolations to low and high q values were performed using Vonkrsquos model [47]
and
Porodrsquos law respectively
Figure 12a illustrates the correlation functions calculated for the three samples from
SAXS profiles taken at the end of crystallization In general their analysis allowed the
determination of morphologic parameters like (1) long period L (ie r value of the
first maximum of the correlation function) (2) amorphous layer thickness la (ie r
value for the intersection of the linear regression in the autocorrelation triangle with the
ordinate equal to the first minimum of the correlation function) and (3) crystalline
lamellar thickness lc (calculated as Lla)
The Lvalues were in all cases close to the long periods determined from twice the
value of the first minimum of the correlation function Thusthe most probable distance
between the centers of gravity of two adjacent crystals appeared to be equal to twice the
most probable distance between the centers of gravity of a crystal and its adjacent
amorphous layer This suggests a narrow distribution of the layer widths of the major
component which in this case corresponds to the crystal phase
20
Data obtained during the non-isothermal hot crystallization revealed a significant
decrease of L long spacings at the beginning of the process (ie during primary
crystallization) although a continuous decrease could still be observed during the
secondary crystallization (Figure 12b) These last changes were mainly due to the
decrease in the crystalline lamellar thickness which suggests the occurrence of a
lamellar insertion mechanism throughout the crystallization process of the three samples
(ie formation of thinner lamellar crystals between loosely stacked primary lamellae)
Note that the amorphous layer thickness remained practically constant during
crystallization
Figure 12b clearly shows that PES 99 had the highest and lowest lc and la values
respectively (ie 117 and 425 nm) Hence the highest crystallinity within the lamellar
stacks XcSAXS
(calculated as lc L) was determined for PES 99 (ie 074) Crystallinity
was clearly lower for PES 97 (ie 060) showing a similar trend to that observed from
WAXD crystallinities Both homopolymers have a similar lamellar thickness but clear
differences exist between the crystalline lamellar (ie from 117 to 936 nm) and
amorphous layer (ie from 425 to 624 nm) thicknesses It seems therefore that
irregular molecular folds on the lamellar surface should involve larger segments when
the polymer is constituted by the slightly more rigid pimelate units
The greatest amorphous layer thickness (ie 717 nm) was observed for the copolymer
indicating that chain defects caused by the presence of comonomer units could be
placed in the amorphous interlamellar regions XcSAXS
was minimum for the copolymer
(ie 059) although this crystallinity was very similar to that calculated for PES 97
due to the lower crystalline lamellar thickness of the homopolymer having pimelate
units
21
Results point out that crystallization of COPES 979-05 should start by the
arrangement of azelate rich moieties according to the favoured crystallization of PES
99 respect to PES 97 a feature clearly supported by primary nucleation crystal growth
rate and overall crystallization rate data Pimelate units seem to be mainly incorporated
as defects into the interlamellar amorphous region giving rise to the observed increase
in the corresponding spacing In fact and as explained above FTIR spectra revealed
also that crystalline bands associated with PES 99 were predominant in the copolymer
sample
Combined SAXS and WAXD data were used to verify the assignment of la and lc
thicknesses which could not be distinguished from the analysis of the correlation
function [48-51] Thus the ratio between XcWAXD
and XcSAXS
is an estimate of the
volume-filling fraction of the lamellar stacks XS which should be lower than 1 for a
correct assignment For example ratios of 089 096 and 082 were determined for PES
99 PES 97 and COPES 979-05 respectively at the end of crystallization
CONCLUSIONS
Thermal polycondensation using titanium tetrabutoxyde as a catalyst was successfully
used to obtain copolyesters constituted by 19-nonanediol and different ratios of azelaic
and pimelic acid units Final copolymer compositions were always in good agreement
with the feed molar ratio and the attained molecular weights were typical of
polycondensation reactions involving monomers with different functionality
The copolymer with the intermediate composition (ie COPES 979-05) had lowest
melting temperature and melting enthalpy However the crystallinity of this sample was
still high It seemed possible to incorporate comonomer units into the crystalline
structure of each homopolymer
22
Homopolymers and copolymers crystallized according to a spherulitic growth and a
heterogeneous primary nucleation Significant differences were found between the
spherulitic textures (ie fibrilar or ringed) and even on the crystallization kinetics of
PES 97 and PES 99 homopolymers Specifically non-isothermal crystallization from
the melt was less favourable for the PES 97 sample and consequently the COPES
979-05 copolymer started to crystallize by the arrangement of azelate moieties
X-ray diffraction data indicated that crystallization always occurred according to a
lamellar insertion mechanism Significant differences were observed between crystal
lamellar and amorphous layer thicknesses of homopolymers and the copolymer with
intermediate composition Optical microscopy DSC SAXS and FTIR data suggested
that this copolymer crystallized giving rise to lamellar cores with a predominant PES
99 structure and that pimelate units were mainly located on the amorphous
interlamellar regions
Acknowledgements Authors are in debt to supports from MINECO and FEDER
(MAT2012-36205) and the Generalitat de Catalunya (2009SGR1208) Diffraction
experiments were performed at NCD beamline at ALBA Synchrotron with the
collaboration of ALBA staff
23
REFERENCES
[1] Lligadas G Ronda JC Galiagrave M Caacutediz V (2007) Poly(ether urethane) Networks
from Renewable Resources as Candidate Biomaterials Synthesis and
Characterization Biomacromolecules 8686-692
[2] Petrovic ZS (2008) Polyurethanes from Vegetable Oils Polym Rev 48109-155
[3] Hojabri L Kong X Narine SS (2010) Functional Thermoplastics from Linear
Diols and Diisocyanates Produced Entirely from Renewable Lipid Sources
Biomacromolecules 11 911-918
[4] Lligadas G Ronda JC Galiagrave M Caacutediz V (2010) Plant Oils as Platform
Chemicals for Polyurethane Synthesis Current State-of-the-Art
Biomacromolecules 112825-2835
[5] Doi Y Steinbuumlchel A (2002) Polyesters II ndash properties and chemical synthesis
New York Wiley-VCH
[6] Huang SJ (1985) Encyclopedia of polymer science and engineering vol 2 New
York Wiley-Interscience pp 20
[7] Vert M Li S M Spenlehauer G Guerin P (1992) Bioresorbability and
biocompatibility of aliphatic polyesters J Mater Sci Mater Med 3432-446
[8] Edlund E Albertsson AC (1999) Novel Drug Delivery Microspheres from
Poly(15-dioxepan-2-one-co-L-lactide) J Polym Sci Part A Polym Chem
371877-1884
[9] Kulkarni RK Moore EG Hegyeli AF Leonard F (1971) Biodegradable
poly(lactic acid) polymers J Biomed Mater Res 5169-181
[10] Kricheldorf HR Kreiser-Saunders I Juumlrgens C Wolter D (1996) Polylactides -
Synthesis Characterization and Medical Application Macromol Symp 10385-
102
[11] Thombre AG Cardinal JR (1990) Enciclopedia of Pharmaceutical Technology
2 New York Marcel Dekker pp 61
[12] Fujimaki T (1998) Processability and properties of aliphatic polyesters
lsquoBIONOLLErsquo synthesized by polycondensation reaction Polym Degrad Stab
59209-214
[13] Shih Y-F Wu T-M (2009) Enzymatic degradation kinetics of poly(butylene
succinate)nanocomposites J Polym Res 16109-115
24
[14] Lai SM Huang CK Shen HF (2005) Preparation and Properties of
Biodegradable Poly(butylene succinate)Starch Blends J Appl Polym Sci
97257-264
[15] Fuller CS (1939) X-ray investigation of the decamethylene series of polyesters
J Am Chem Soc 612575-2580
[16] Kanamoto T Tanaka K (1971) Growth and morphology of single crystals of
linear aliphatic polyesters J Polym Sci Part A-2 92043-2060
[17] Ueda AS Chatani Y Tadokoro H (1971) Structural Studies of Polyesters IV
Molecular and Crystal Structures of Poly(ethylene succinate) and Poly(ethylene
oxalate) Polym J 2387-397
[18] Aylwin PA Boyd RH (1984) Aliphatic polyesters as models for relaxation
processes in crystalline polymers 1 Characterization Polymer 25323-329
[19] Liau WB Boyd RH (1990) Structure and packing in crystalline aliphatic
polyesters Macromolecules 231531-1539
[20] Brandrup J Immergut H (1989) Polymer Handbook New York Wiley
[21] Almontassir A Gestiacute S Franco L Puiggaliacute J (2004) Molecular Packing of
Polyesters Derived from 14-Butanediol and Even Aliphatic Dicarboxylic Acids
Macromolecules 375300-5309
[22] Gestiacute S Almontassir A Casas MT Puiggaliacute J (2004) Molecular packing and
crystalline morphologies of biodegradable poly(alkylene dicarboxylate)s derived
from 16-hexanediol Polymer 458845-8861
[23] Gestiacute S Almontassir A Casas MT Puiggaliacute J (2006) Crystalline Structure of
Poly(hexamethylene adipate) Study on the Morphology and the Enzymatic
Degradation of Single Crystals Biomacromolecules 7799-808
[24] Gestiacute S Casas MT Puiggaliacute J (2007) Crystalline structure of
poly(hexamethylene succinate) and single crystal degradation studies Polymer
485088-5097
[25] Lu J-S Chen M Lu S-F Chen C-H (2011) Nonisothermal crystallization
kinetics of novel biodegradable poly(butylene succinate-co-2-methyl-13-
propylene succinate)s J Polym Res 181527-1537
[26] Champetier G Monnerie L (1969) Introduction agrave la chimie macromoleacuteculaire
Paris Masson et Cie
[27] Allegra G Bassi IW(1969) Isomorphism in synthetic macromolecular systems
Adv Polym Sci 6549-574
25
[28] Mochizuki M Mukai K Yamada K Ichise N Murase S Iwaya Y (1997)
Structural Effects upon Enzymatic Hydrolysis of Poly(butylene succinate-co-
ethylene succinate)s Macromolecules 307403-7407
[29] George Z Papageorgiou Bikiaris Dimitrios N (2007) Synthesis
Cocrystallization and Enzymatic Degradation of Novel Poly(butylene-co-
propylene succinate) Copolymers Biomacromolecules 82437-2449
[30] Li X Hong Z Sun J Geng Y Huang Y An H et al (2009) Identifying the
Phase Behavior of Biodegradable Poly(hexamethylene succinate-co-
hexamethylene adipate) Copolymers with FTIR J Phys Chem 1132695-2704
[31] Li X Sun J Huang Y Geng Y Wang X Ma Z et al (2008) Inducing New
Crystal Structures through Random Copolymerization of Biodegradable
Aliphatic Polyester Macromolecules 413162-3168
[32] Liang Z Pan P Zhu B Dong T Hua L Inoue Y (2010) Crystalline Phase of
Isomorphic Poly(hexamethylene sebacate-co-hexamethylene adipate)
Copolyester Effects of Comonomer Composition and Crystallization
Temperature Macromolecules 432925-2932
[33] Liang Z Pan P Zhu B Inoue Y (2011) Isomorphic crystallization of aliphatic
copolyesters derived from 16-hexanediol Effect of the chemical structure of
comonomer units on the extent of cocrystallization Polymer 522667-2676
[34] Rueda DR Garciacutea-Gutieacuterrez MC Nogales A Capitaacuten MJ Ezquerra TA
Labrador A Fraga E Beltraacuten D Juanhuix J Herranz JF Bordas J (2006)
Versatile wide angle diffraction setup for simultaneous wide and small angle x-
ray scattering measurements with synchrotron radiation Rev Sci Instrum 77
Art No 033904
[35] Rajkumar G AL-Khayat HA Eakins F Knupp C Squire JM (2007) The
CCP13 FibreFix program suite semi-automated analysis of diffraction patterns
from non-crystalline materials J Appl Crystallogr 40 178ndash184
[36] Herrera R Franco L Rodriacuteguez-Galaacuten A Puiggaliacute J (2002) Characterization
and degradation behavior of poly(butylene adipate-co-terephthalate)s J Polym
Sci Part A Polym Chem 40 4141-4157
[37] Pamula E Blazewicz M Paluszkiewicz P Dobrzynski (2001) FTIR study of
degradation products of aliphatic polyestersndashcarbon fibres composites J Mol
Struct 596 69-75
[38] Avrami M (1939) Kinetics of Phase Change I General Theory J Chem Phys
71103-1120
[39] Avrami M (1940) Kinetics of Phase Change II Transformation‐Time
Relations for Random Distribution of Nuclei J Chem Phys 8212-224
26
[40] Hoffman JD Weeks JJ (1962) Rate of Spherulitic Crystallization with Chain
Folds in Polychlorotrifluoroethylene J Chem Phys 371723-1741
[41] Lauritzen JI Hoffman JD (1973) Extension of theory of growth of chain‐folded
polymer crystals to large undercooling J Appl Phys 444340-4352
[42] Strobl G (2000) From the melt via mesomorphic and granular crystalline layers
to lamellar crystallites A major route followed in polymer crystallization Eur
Phys J E 3165-183
[43] Muthukumar M (2000) Commentary on theories of polymer crystallization
Eur Phys J 3199-202
[44] Williams ML Landel RF Ferry JD (1955) The Temperature Dependence of
Relaxation Mechanisms in Amorphous Polymers and Other Glass-forming
Liquids J Am Chem Soc 773701-3707
[45] Suzuki T Kovacs A (1970) Temperature dependence of spherulitic growth rate
of isotactic polystyrene J Polym J 182-100
[46] Vonk CG Kortleve G (1967) X-ray small-angle scattering of bulk
polyethylene Kolloid Z Z Polym 22019-24
[47] Vonk CG (1975) A general computer program for the processing of small-
angle X-ray scattering data J Appl Cryst 8340-341
[48] Hsiao BS Gardner KH Wu DQ Chu B (1993) Time-resolved X-ray study of
poly(aryl ether ether ketone) crystallization and melting behaviour 1
Crystallization Polymer 343986-3995
[49] Ikada Y Jamshida K Tsuji H Hyoan SH (1987) Maltopentaose- and
maltoheptaose-carrying styrene macromers and their homopolymers
Macromolecules 20906-908
[50] Kruger KN Zachmann HG (1993) Investigation of the melting behavior of
poly(aryl ether ketones) by simultaneous measurements of SAXS and WAXS
employing synchrotron radiation Macromolecules 26 5202-5208
[51] Hsiao BS Wang Z Yeh F Yan G Sheth KC (1999) Time-resolved X-ray
studies of structure development in poly(butylene terephthalate) during
isothermal crystallization Polymer 403515-3523
27
FIGURE CAPTIONS
Figure 1 Synthesis of copoly(alkylene dicarboxylate)s from 19-nonanediol and
pimelic and azelaic acids
Figure 2 Transmitance FTIR spectra (1400-800 cm-1
) of amorphous (red profiles) and
semicrystalline (blue profiles) PES 97 (a) PES 979-050 (b) and PES 99 (c) samples
Boxes highlight characteristic crystalline bands in the spectrum of the copolymer that
can be related to each homopolymer (see arrows) Asterisk points to the splitting of the
1090-1070 cm-1
amorphous band for the PES 97 sample
Figure 3 DSC traces obtained with the COPES 979-050 copolymer during the
heating run (20 ordmCmin) of the as-synthesized sample (a) the cooling run (10 ordmCmin)
after keeping the sample in the melt state for three minutes (b) the heating run (20
ordmCmin) of the hot crystallized sample (c) and the heating run (20 ordmCmin) of a sample
previously cooled at the maximum rate allowed by the equipment from the melt state
(d) The inset shows a magnification where the glass transition is clearly observed
Figure 4 Variation of the melting temperature and enthalpy of poly(nonamethylene
azelate-co-pimelate)s with the molar percentage of azelate units Enthalpies are given as
kJmol considering the molecular weight of the repeat unit determined according to the
copolymer composition
Figure 5 a) Exothermic DSC peaks corresponding to the hot isothermal crystallizations
of COPES 979-050 at temperatures between 54 and 51 ordmC Inset shows the
development of relative crystallinity over time for the indicated isothermal
crystallizations b) Avrami plots corresponding to the isothermal crystallization of
28
COPES 979-050 c) Overall crystallization rates (full symbols and solid lines) and the
reciprocal of the crystallization half-times (empty symbols and dashed lines) determined
at different temperatures for PES 99 () PES 97 (∆) and COPES 979-050 ()
samples
Figure 6 a) DSC heating runs (20 ordmCmin) of COPES 979-050 samples isothermally
crystallized at temperatures ranging from 54 to 51 ordmC b) Hoffman-Weeks plot of
temperatures corresponding to endothermic melting peaks versus crystallization
temperature for several COPES 979-x samples For the sake of clarity experimental
data of some intermediate compositions are described by dashed lines Equilibrium
melting temperatures are explicitly indicated at the corresponding intersection points
Figure 7 Polarized optical micrographs of spherulites of PES 97 (a) COPES 979-
050 (b) and PES 99 (c) crystallized at temperatures of 53 ordmC 51 ordmC and 59 ordmC
respectively For the sake of completeness spherulites of a 50 molar mixture of PES
97 and PES 99 homopolymers and crystallized at 56 ordmC are shown in (d)
Figure 8 a) Plots of COPES 979-050 spherulite radii versus crystallization time for
isothermal hot crystallizations performed at temperatures between 506 and 53 ordmC b)
Temperature dependence of the crystal growth rate for PES 99 PES 97 and COPES
979-050 samples c) Change in the nucleation density of PES 99 PES 97 and
COPES 979-050 samples with isothermal crystallization temperature
Figure 9 Plot of ln G + U
R(Tc-T) versus 1 Tc (T) f to determine the Kg
nucleation parameter of PES 99 PES 97 and COPES 979-050 samples
Figure 10 Time-resolved SAXS (a) and WAXD (b) three-dimensional profiles of PES
97 during non-isothermal hot crystallization at 3 ordmCmin
29
Figure 11 WAXD (a) and SAXS (b) profiles of PES 99 PES 97 and COPES 979-
050 samples taken at room temperature The amorphous halo obtained by
deconvolution is explicitly shown for the copolymer sample
Figure 12 Correlation functions (a) for non-isothermal hot crystallization of PES 99
PES 97 and COPES 979-050 samples b) Temperature evolution of Ldiams lc () and
la () during non-isothermal hot crystallization performed at 3 ordmCmin with PES 99
(dashed lines) PES 97 (solid lines) and COPES 979-050 (dotted lines) samples
30
Table 1 Synthesis data of studied polyesters
Polymer Yield
()
fPa
Mnb
(gmol)
Mwb
(gmol)
PDIbc
PES 97 73 1 7900 19600 247
COPES 979-085 67 086 9400 21900 233
COPES 979-070 76 071 9800 23000 236
COPES 979-050 78 053 13500 32300 240
COPES 979-030 78 032 11700 29900 257
COPES 979-015 65 017 12700 31800 250
PES 99 73 0 13300 35900 270
aPimelate molar fraction determined from
13C NMR spectra
bFrom GPC
cPolydispersity index
31
Table 2 Main crystallization kinetic parameters determined by DSC for the two
homopolymers and the copolymer with the highest comonomer content
Sample T (ordmC) Z 106
(s-n
)
n K 103
(s-1
) 1 τ12 10
3
(s-1
)
(Zln2)1n
103
(s
-1)
PES 97
52 849 239 754 887 879
53 034 266 371 430 426
54 026 247 219 256 255
55 0063 248 127 148 148
56 221 10-03
263 051 058 058
57 855 10-05
288 032 035 035
COPES 979-050
51 815 226 558 659 656
52 299 225 353 415 415
525 013 251 179 209 208
53 0025 251 094 110 109
54 178 10-04
278 031 036 036
PES 99
56 1848 260 1523 1793 175
57 028 294 589 682 667
58 0077 281 292 331 332
59 280 10-03
279 086 097 099
32
FIGURE 1
Diacuteaz et al
33
FIGURE 2
Diacuteaz et al
Tra
ns
mit
tan
ce
(
)
Wavenumber (cm-1
)
838cm-1
a)
Tra
ns
mit
tan
ce
(
)
Wavenumber (cm-1
)
b)
Tra
ns
mit
tan
ce
(
)
Wavenumber (cm-1
)
c)
1242 cm-1
34
FIGURE 3
Diacuteaz et al
0 10 20 30 40 50 60 70 80
015
025
035
045
-80 -60 -40 -20
-501 ordmC
611 ordmC
1122 Jg
605 ordmC
969 Jg
959 Jg
460 ordmC
958 Jg
a)
b)
c)
d)
Temperature (ordmC)
En
do
35
FIGURE 4
Diacuteaz et al
60
62
64
66
68
0 20 40 60 80 100
Azelate Units ()
Melt
ing
Tem
pera
ture (
ordmC)
28
30
32
34
Melt
ing
En
tha
lpy
(k
Jm
ol)
(ordmC
)
(kJ
mo
l)
36
FIGURE 5
Diacuteaz et al
0 20 40 60 80 100 120 140
En
do
ther
m
Time (min)
51 ordmC
52 ordmC
525 ordmC
53 ordmC
54 ordmC
0
20
40
60
80
100
0 20 40 60 80 100
Cry
sta
llin
ity
(
)Time (min)
53 ordmC54 ordmC
51 ordmC52 ordmC
525 ordmC
-1
-08
-06
-04
-02
0
02
04
18 28 38
log
-ln
[1-χ
(t)]
log (t-t0) (s)
51 ordmC
52 ordmC
525 ordmC 53 ordmC
54 ordmC
0
5
10
15
20
0
5
10
15
20
50 52 54 56 58 60
1t
12
1
03
(s-1
)
k
10
3(s
-1)
Temperature (ordmC)
PE979-05
PE97
PE99
b)
c)
a)
COPES 979-05
PES 97
PES 99
37
FIGURE 6
Diacuteaz et al
45
50
55
60
65
70
75
80
85
45 50 55 60 65 70 75 80 85
Temperature (ordmC)
Tem
per
atu
re (
ordmC)
PE 99
PE 979-05PE 97
PE 979-015PE 979-085
Temperature (ordmC)
En
doth
erm
50 55 60 65 70 75
a) COPES 979-05
510 ordmC
520 ordmC
525 ordmC
530 ordmC
540 ordmC
792 ordmC
779 ordmC
750 ordmC
748 ordmC
728 ordmC
b)
(ordmC
)
PE 979-
015
PE 979-
085
COPES 979-085
COPES 979-015
PES 99
COPES 979-05
PES 97
38
FIGURE 7
Diacuteaz et al
50 m
PES 97 a)
50 m
PES 99 c)
50 m
COPES 979-05 b)
50 m
d) PES 97 + PES 99
39
0
20
40
60
80
100
120
140
47 52 57 62
Nu
clei
im
m2
Temperature (ordmC)
PES 97
PES 99
COPES 979-050
0
5
10
15
20
25
30
35
0 20 40 60 80
Time (min)
Sp
heru
lite
Rad
ius
( m
)
T = 53 ordmC
T = 52 ordmC
T = 515 ordmC
T = 51 ordmC
T = 506 ordmC
0
5
10
15
20
25
30
35
40
45 50 55 60
Gro
wth
Rate
(micro
mm
in)
Temperature (ordmC)
PES 99
PES 97
COPES 979-050
(microm
)
a)
b)
c)
FIGURE 8
Diacuteaz et al
40
FIGURE 9
Diacuteaz et al
PES 99
PES 97
COPES 979-050
41
FIGURE 10
Diacuteaz et al
FIGURE 12
Diacuteaz et al
42
0 02 04 06 08
I q
2(a
u)
q (nm-1)
PES 99
PES 97
COPES 979-05
0
200
400
600
800
108 128 148 168 188
I (a
u
)
q (nm-1)
PES 99
PES 97
COPES 979-05
a)
b)
0370 nm
0372 nm
0373 nm
0414-0413 nm
FIGURE 11
Diacuteaz et al
43
FIGURE 12
Diacuteaz et al
0
5
10
15
20
25
22283440465258
Temperature (ordmC)
Sp
acin
g (
nm
)
b) a)
PES 97
COPES 979-050
PES 99
Lγ
Lγ
Lγ

5
units led to less free energy to incorporate foreign units and to a higher extent of
comonomer unit inclusion in the host crystalline lattice [33]
EXPERIMENTAL SECTION
Materials
All reagents and solvents were purchased from Sigma-Aldrich and used without further
purification
Poly(nonamethylene pimelate) (PES 97) poly(nonamethylene azelate) (PES 99) and
poly(nonamethylene azelate-co-pimelate) (COPES 979-x) were synthesized by thermal
polycondensation of the appropriate mixture of dicarboxylic units with an excess of 19-
nonanediol (221 molar ratio) (Figure 1) Abbreviations denote PES for polyester
COPES for copolyester the first digit for the number of carbon atoms of the diol unit
the second digit for the number of carbon atoms of the dicarboxylic unit (or 79 for the
copolymer) and x for the molar ratio between pimelate and azelate units in the reaction
mixture Titanium tetrabutoxyde was used as a catalyst and the reaction was first
performed in a nitrogen atmosphere at 150 ordmC for 6 h and then in vacuum at 180 ordmC for
18 h Polymers were purified by precipitation with ethanol of chloroform solutions (10
wt-)
Measurements
Molecular weights were estimated by GPC using a liquid chromatograph (Shimadzu
model LC-8A) equipped with an Empower computer program (Waters) and a refractive
index detector A PL HFIP gel guard precolumn and PL HFIP gel column (Agilent
Technologies Deutschland GmbH) were employed The polymer was dissolved and
eluted in 111333-hexafluoroisopropanol at a flow rate of 05 mLmin (injected
6
volume 100 L sample concentration 15 mgmL) The number and weight average
molecular weights were calculated using polymethyl methacrylate standards
1H- and
13C-NMR spectra were acquired with a Bruker AMX-300 spectrometer
operating at 3001 MHz and 757 MHz respectively Chemical shifts were calibrated
using tetramethylsilane as an internal standard Deuterated chloroform was used as the
solvent
Infrared absorption spectra were recorded with a Fourier Transform FTIR 4100 Jasco
spectrometer in the 4000-600 cm-1
range A Specac model MKII Golden Gate
attenuated total reflection (ATR) with a heated Diamond ATR Top-Plate was used
Calorimetric data were obtained by differential scanning calorimetry with a TA
Instruments Q100 series equipped with a refrigerated cooling system (RCS) operating
from -90 ordmC to 550 ordmC Experiments were conducted under a flow of dry nitrogen with a
sample weight of approximately 10 mg while calibration was performed with indium
Heating and cooling runs were performed at rates of 20 ordmCmin and 10 ordmCmin
respectively
Spherulites of polyesters were grown from homogeneous melt-crystallized thin films
placed between two cover glasses These films were obtained by evaporation of a dilute
solution of the polymer in chloroform Samples were crystallized isothermally at
different temperatures below the melting point using a Linkam temperature control
system configured by a THMS 600 heating and freezing stage connected to an LNP 94
liquid nitrogen cooling system Films with thickness lower than 10 m were obtained
by this experimental procedure Optical photographs were taken using a Zeiss AxioCam
MRC5 digital camera mounted on a Zeiss Axioskop 40 Pol light polarizing microscope
A first-order red tint plate was used to determine the sign of spherulite birefringence
under crossed polarizers
7
Simultaneous time-resolved SAXSWAXD experiments were taken at the NCD
beamline (BL11) of the Alba synchrotron radiation light facility of Cerdanyola del
Valles (Catalunya) The beam was monochromatized to a wavelength of 0098 nm and
the samples were confined between Kapton films SAXS and WAXD profiles were
acquired simultaneously during heatingcooling experiments in time frames of 12 s
Samples were held above fusion for 3 min to erase thermal history before performing
the subsequent cooling run All heating and cooling runs were performed at a rate of 3
ordmCmin Two linear position-sensitive detectors were used [34] the SAXS detector was
calibrated with different orders of diffraction from silver behenate whereas the WAXD
detector was calibrated with diffractions of a standard of an alumina (Al2O3) sample
The diffraction profiles were normalized to the beam intensity and corrected
considering the empty sample background WAXD peaks were deconvoluted with the
PeakFit v4 program by Jandel Scientific Software The correlation function and
corresponding parameters were calculated with the CORFUNC program [35] for Fibre
Diffraction Non-Crystalline Diffraction provided by the Collaborative Computational
Project 13
RESULTS AND DISCUSSION
Synthesis of PES 97 PES 99 and COPES 979-x samples
The results summarized in Table 1 indicate that samples could be synthesized with a
polydispersity index (PDI) and a molecular weight typical of polycondesation reactions
involving two monomers with different functionality (ie diol and dicarboxylic units)
Thus PDI and Mn ranged from 233 to 270 and from 7900 to 13300 gmol
respectively A clear trend for the dependence of molecular weigth with composition
was not observed although lower molecular sizes were achieved when pimelic acid
content in the reaction mixture was higher In any case molecular weights were
8
sufficient to ensure film- and fiber-forming properties Polymerization yields
determined after reprecipitation of samples varied in a narrow range (65-78 ) no
relationship between yield and monomer feed ratio indicative of a preferred reactivity
was observed
Infrared spectra of all samples synthesized revealed the characteristic absorption bands
for methylene (2931-2925 and 2852-2851 cm-1
) C=O (1731-1729 cm-1
) and C-O
(asymmetric and symmetric stretchings at 1242-1223 and 1171-1167 cm-1
respectively) Figure S1a in Supporting information (SI) shows a representative
spectrum obtained for PES 99 homopolymer whereas a detailed summary of absorption
bands is given in Table S1 in SI (discussed below)
1H NMR spectra were highly similar for all samples showing characteristic signals at
404 (O-CH2) 227 (C(O)-CH2) 160 (O-CH2CH2 + C(O)-CH2CH2) and 130 ppm as
can be seen in Figure S2b in SI for PES 99 The relative intensity of the last signal was
the only difference between the spectra as logically deduced from the different number
of methylene protons of azelate and pimelate units that contributed to the indicated
signal
13C-NMR spectra were more powerful since the vicinal carbons of the dicarboxylate
units appeared well differentiated (ie 3429 and 3410 ppm for azelate and pimelate
units respectively) Figure S2 in SI shows a representative 13
C NMR spectrum with the
assignment of the observed signals The variation in intensity associated with the two
kinds of C(O)-CH2 carbon atoms with copolymer composition is also pointed out The
areas of these two signals were used to determine the pimelate molar fraction
fP = A3410 (A3429 + A3410) (1)
Table 1 shows that the experimental composition of all copolymers is in full agreement
with the feed monomer ratio
9
Unfortunately both 1H and
13C NMR spectra were insensitive to triad effects and
consequently no information concerning sequence distribution could be derived
Specifically the O-CH2 protons were not split in the 1H NMR spectra and became
insensitive to the two different dicarboxylic units to which the diol could be linked A
triplet was always clearly detected since very few differences were expected due to the
large number of aliphatic methylene groups of both azelaic and pimelic units On the
contrary splitting has been reported when dicarboxylic units of clearly different nature
(ie aliphatic or aromatic) were used [36]
Infrared spectroscopic data of amorphous and crystalline PES 97 PES 99 and
COPES 979-05 samples
FTIR is highly sensitive to molecular conformation and packing density hence its
usefulness in polymer crystallization studies Characteristic bands can be correlated to
the crystalline and amorphous phases of the bulk and typically remain distinguishable
over the course of crystallization
FTIR spectra corresponding to semicrystalline and amorphous samples were obtained
from the as-synthesized samples at room temperature and at 90 ordmC (ie about 30 ordmC
above the melting temperature of each polymer) respectively Figure 2 compares the
characteristic spectra of PES 97 PES 99 and COPES 979-05 amorphous and
semicrystalline samples whereas the main absorption bands are summarized in Table
S1 in SI
Spectra of amorphous samples were practically identical due to the similar chemical
repeat units and also to the similar molecular interactions that should be established in
the melt state Only minor differences were detected in the broad band near 1090-1070
cm-1
since it was split in the pimelate rich samples (see asterisk in Figure 2)
10
Transmission bands generally became broader in the spectra of amorphous samples and
could therefore be distinguished from those associated with crystalline domains which
appeared at the same wavenumber This is the case for example of the asymmetric
stretching bands of the C-O group of PES 97 which is observed for both crystalline
and amorphous phases at 1242 cm-1
On the contrary a significant wavenumber
difference was found for PES 99 (ie 1240 and 1223 cm-1
) In the amorphous state this
stretching mode appeared at the same wavenumber for both homopolymers whereas a
large difference was found in the crystalline state due to a different molecular
environment of the ester groups Bands at 1345-1315 1028-1017 954-958 and 921-918
cm-1
were also noticeable since appeared in the semicrystalline samples only
The spectrum of the semicrystalline COPES 979-05 sample is highly interesting since
some bands were split and appeared at the typical wavenumbers of the corresponding
homopolymers Thus the asymmetric stretching of the C-O group gave rise to two
narrow bands at 1242 and 1224 cm-1
indicating that two kinds of ester groups exist in
the copolymer as a result of different interactions with neighboring chains Specifically
some ester groups had the same arrangement as the PES 97 crystalline structure
whereas other groups were arranged according to the PES 99 structure Furthermore it
is qualitatively observed that the intensity of the 1224 cm-1
band is clearly greater and
consequently the PES 99 arrangement seems to be predominant The difference on
intensities cannot be justified by distinct relative absorption coefficients since both
bands appeared with similar intensity in the spectra (not shown) of an equimolar
mixture of the two homopolymers
Similar considerations can be made about the copolymer bands at 1344 and 1312 cm-1
which are attributed to deformational CH2 vibrations of polyesters [37] and are related
to those observed at 1345 cm-1
and 1315 cm-1
in PES 97 and PES 99 homopolymer
11
spectra respectively Again the higher intensity was found for the band associated with
the PES 99 structure Finally some bands like that at 1024 cm-1
and even that at 956
cm-1
appeared in the copolymer at an intermediate wavenumber with respect to the
homopolymers (ie 1028 and 954 and 1017 and 958 cm-1
for PES 97 and PES 99
respectively)
Calorimetric data of PES 97 PES 99 and COPES 979-x samples
Thermal properties of the synthesized sample were determined by the four run protocol
depicted in Figure 3 for a representative copolymer Melt and hot crystallization data
together with glass transition temperatures are summarized in Table Srdquo in SI for all
samples Several points merit further discussion
a) All samples were semicrystalline and showed a single melting peak independent of
the crystallization procedure (ie from solution or from the melt) No multiple melting
peaks were observed and consequently no evidence of distinct crystal populations with
different lamellar thicknesses was found
b) Samples were able to crystallize from the melt state at the maximum rate allowed by
the equipment Thus no cold crystallization peaks were detected in the heating run of
quenched samples whereas melting peaks were clearly observed (eg Figure 3d) In
addition these peaks had practically the same enthalpy as those measured at a slow
cooling rate for hot crystallized samples (Figure 3b) and even for solution crystallized
samples (Figure 3a)
c) The melting temperature of each homopolymer decreased with the comonomer
content The eutectic composition and minimum temperature corresponded to the
COPES 979-50 sample (Figure 4) In addition PES 99 had a higher melting
temperature than PES 97 as can be presumed from its higher methylene content [26]
12
d) Melting enthalpies of all samples were always high Thus azelate and pimelate
units were easily incorporated into the PES 97 and PES 99 crystalline structures
respectively Despite the small variation a slight decrease was observed in the melting
enthalpy of each homopolymer when comonomer units were incorporated as shown in
Figure 4 for samples crystallized from the melt The minimum enthalpy was achieved
with the COPES 979-50 sample and the variation was higher when PES 99 was
impurified due to its higher enthalpy compared with PES 97
e) Solution crystallized samples always had a higher melting enthalpy than melt
crystallized samples However a similar dependence of enthalpy upon composition was
observed
f) Non-isothermal crystallization from the melt state required a rather similar degree
of supercooling (eg between 13 and 18 ordmC at a cooling rate of 10 ordmCmin) for all
samples Thus the peak crystallization temperature of PES 97 was lower than that of
PES 99 and logically higher than that of copolymers
g) Glass transition temperatures ranged in a narrow interval (-45 ordmC to -60 ordmC) for all
samples the lower values corresponding to COPES 979-x copolymers despite having a
higher molecular weight than PES 97 homopolymer
DSC isothermal crystallization study of PES 97 PES 99 and COPES 979-05
samples
Figure 5a shows the DSC exotherms of the COPES 979-05 sample during
crystallization experiments from the melt state at selected temperatures Peaks logically
shifted to higher times and became broader with increasing the crystallization
temperature The time evolution of the relative degree of crystallinity (t) was
determined through the ratio area of the exotherm up to time t divided by the total
exotherm area ie
13
(t) = t
tdtdtdH
0)(
0)(
tdtdtdH (2)
where dHdt is the heat flow rate and t0 the induction time A characteristic sigmoidal
dependence on time was always found as plotted in Figure 5a (inset)
Kinetic crystallization data were analyzed assuming the well-known Avrami equation
[3839] for primary crystallization
1 - (t) = exp[-Z (t-t0)n] (3)
where Z is the temperature-dependent rate constant and n the Avrami exponent whose
value varies with the crystallization mechanism A normalized rate constant k = Z1n
is
usually evaluated for comparison since its dimension (time-1
) is independent of the
value of the Avrami exponent
Table 2 summarizes the main kinetic parameters of the primary crystallization process
of the homopolymers and COPES 979-05 copolyester as deduced from the plots of
log-ln[1-(t)] against log (t - t0) (Figure 7b for COPES 979-05) The values of the
Avrami exponent for the hot isothermal crystallizations lie in a narrow range from 225
to 294 258 being the average value This suggests a predetermined (heterogeneous)
nucleation with spherical growth that occurred under geometric constraints since the
theoretical value should be equal to 3 Sporadic (heterogeneous) and homogeneous
nucleation can be clearly discarded as a higher exponent close to 4 should be derived
The values of the corresponding reciprocal crystallization half-times (112) calculated
as the inverse of the difference between the time at which crystallization begins and the
time at which 50 of crystallization is completed are also summarized in Table 2 This
parameter is a direct measure of the crystallization process and could therefore be used
to check the accuracy of the Avrami analysis by comparison with the theoretical kinetic
value (ie 112 = (Z ln 2)1n
) as reported in Table 2 A similar dependence of 112 and
the kinetic rate constant on the crystallization temperature for the three polymers can
14
also be inferred from Figure 5c This Figure also shows that PES 99 crystallized faster
than PES 97 despite having a greater molecular weight and that the lowest overall
crystallization rate corresponded to the copolyester as could be logically expected It
should be pointed out that the three samples required similar supercooling to start
crystallization since the melting points of PES 99 and the copolyester samples were the
highest and the lowest respectively
Isothermal crystallizations of the polymers gave rise to samples characterized by a
single melting peak which clearly shifted to higher temperatures with increasing
crystallization temperature (eg Figure 6a for the COPES 979-05 sample) These
results clearly reflect the lamellar thickening effect and make it possible to deduce the
equilibrium melting temperatures (ie those corresponding to an ideal infinite crystal)
by the Hoffman-Weeks approach (Figure 6b) [40] Theoretical equilibrium melting
temperatures of 792 and 748 ordmC were determined for the PES 99 and PES 97
homopolymers respectively Copolymerization decreased these temperatures according
to the comonomer content Thus the minimum value corresponded to the COPES 979-
05 sample (ie 728 ordmC)
Optical microscopy crystallization study of PES 97 PES 99 and COPES 979-05
samples
All polyester samples crystallized from the melt into spherulites with negative
birefringence but different textures (Figures 7a-7c) Ringed spherulites were mainly
observed with PES 99 over the whole range of tested crystallization temperature
whereas fibrillar textures were always observed for PES 97 For the sake of
completeness Figure 7d also shows the crystallization of a 50 molar mixture of the
two homopolymers which clearly differentiated from the COPES 979-05 spherulites
depicted in Figure 7b It should be pointed out that both kinds of spherulites (fibrillar
15
and ringed) were observed in the homopolymer mixture as expected for an independent
crystallization of each polymer On the contrary only fibrillar spherulites were observed
for the copolymer sample suggesting that cocrystallization took place as also deduced
from the calorimetric data It is also worth noting that this copolymer like PES 97
required a high degree of supercooling to crystallize
Crystallization from the melt of both homopolymers and the representative COPES
979-05 copolymer was studied by optical microscopy in the range where spherulites
with adequate dimensions formed and which varied from 62 ordmC to 47 ordmC depending on
the sample A larger dimension was obtained at temperatures sufficiently high to have a
low nucleation rate compared with the crystal growth rate This size decreased with the
crystallization temperature the minimum temperature considered for each polymer
being that corresponding to a final spherulite radius close to 10 m
Spherulite radii grew linearly with time up to impingement within the studied
temperature intervals (eg Figure 8a for the copolymer) and allowed the calculation of
the corresponding growth rates G displayed in Figure 8b The maximum G values
measured were clearly different the highest corresponding to PES 99 (ie 35 mmin)
and the lowest corresponding to the copolymer (ie 6 mmin) as could be presumed
Growth data were then analyzed in terms of crystallization regimes by the mathematical
expressions derived from the crystal growth and nucleation model proposed by
Lauritzen and Hoffman [41] It is nevertheless true that the physical meaning of this
model may be questioned on account of the new theories based on experimental
evidences and different theoretical calculations [4243]
The radial growth rate (G) of polymer spherulites was thereby calculated by the
Hoffman and Lauritzen equation [41]
G = G0 exp[-U(R(Tc- T))] exp[-Kg( Tc (T) f)] (4)
16
where G0 is a constant preexponential factor U represents the activation energy
characteristic of the transport of crystallizing segments across the liquid-crystal
interface T is a hypothetical temperature below which such motion ceases Tc is the
crystallization temperature R is the gas constant Kg is the secondary nucleation
parameter T is the degree of supercooling measured as Tm0-Tc and f is a correction
factor accounting for the variation in the bulk melting enthalpy per unit volume with
temperature (f = 2 Tc (Tm0 + Tc))
The sets of parameters most commonly used for U and T are those reported by
Williams-Landel-Ferry [44] (WLF) (U
= 4120 calmol and T = Tg - 516 K) and
Suzuki and Kovacs [45] (U
= 1500 calmol and T = Tg - 30 K) The plot of ln G +
UR(Tc-T) versus 1( Tc (T) f) for the PES 97 PES 99 and COPES 979-05
samples fitted well with a linear regression representative of a single crystallization
regime (Figure 9) when the second parameter set was employed The worst regression
coefficient was r2 09934 and the secondary nucleation parameters derived from the
slopes of the linear plots of PES 97 PES 99 and COPES 979-05 crystallization data
929 104 130 10
5 and 215 10
5 K
2 respectively The highest secondary nucleation
constant corresponded to the copolymer indicating greater difficulty of the lamellar
surface in inducing crystallization of incoming polymer chains Note also that the
crystal growth rate of COPES 979-05 became strongly dependent on the
crystallization temperature as shown in the G versus temperature plot (Figure 9b)
Nucleation constants were similar for the two homopolymers although a slightly lower
value was deduced for PES 97
In addition to the crystal growth rate the overall crystallization of a sample depends on
primary nucleation which may correspond to heterogeneous nuclei or homogeneous
nuclei Primary nucleation is often a rather complex process as it depends on the
17
crystallization temperature density of heterogeneities and presenceabsence of
nucleating agents The number of nuclei slightly increased during crystallization
suggesting a thermal nucleation where all nuclei became progressively active for a
given crystallization temperature A slight degree of heterogeneity in the spherulite size
was therefore observed at the end of the crystallization process Figure 9c shows that the
nucleation density increased with decreasing the crystallization temperature for the three
samples studied and approached a single exponential dependence which resulted in
more active nuclei (ie more favorable thermodynamic conditions for nucleus
generation) with progressively decreasing the temperature The lowest density
corresponding to the copolymer as could be presumed from its lower overall
crystallization rate determined from calorimetric data Note also that the copolymer and
the PES 99 samples had similar molecular weigths (Table 1) and therefore differences
on the crystal growth rate and primary nucleation density cannot be attributed to
molecular weigth changes Only PE 97 had a slightly lower molecular weight that
could justify an increase of both magnitudes Therefore the lower values with respect to
PE99 cannot be a consequence of he lower molecular size of PE 97
Study on the non-isothermal crystallization of PES 97 PES 99 and COPES 979-
05 samples by time-resolved SAXSWAXD experiments
Figure 10 contains time-resolved SAXS and WAXD profiles taken during non-
isothermal hot crystallization at a cooling rate of 3 ordmCmin for a representative polymer
(PES 97 homopolymer) In all cases the SAXS long period peak and crystal
diffractions appear simultaneously as expected for a crystallization process controlled
by nucleation and crystal growth
The SAXS long period peak is clearly seen at a value of the scattering vector q = 2sin
in the 028-039 nm-1
range after subtraction of the empty sample background
18
observed near the beam stop This peak which can be attributed to the lamellar structure
of the spherulites appeared at slightly different q values depending on the polymer
sample and shifted to higher q values (ie lower spacings) during crystallization
showing a more pronounced change in the initial stages
WAXD profiles showed an amorphous halo (q = 203 nm-1
) whose intensity decreased
with crystallization and on which Bragg reflections formed The most intense appeared
at 0414-0413 nm (q = 1518-1521 nm-1
) and 0370 nm (q = 1698 nm-1
) and should
correspond to the (110) (020) reflections of the typical structure of a polyalkylene
dicarboxylate [21-24] The intensity of the indicated reflections increased sharply at the
beginning of crystallization and slowly after a short time interval This second step
corresponds to a secondary crystallization which could also be envisaged from the
asymmetric shape of the DSC crystallization peaks (Figure 5b) WAXD profiles of the
two homopolymers and the COPES 979-05 copolymer are compared in Figure 13a
Note that the spacings observed for both homopolymers are practically identical and
consequently the similar packing arrangement should enable co-crystallization
The degree of crystallinity of the three samples could be estimated from the
corresponding room temperature profiles by considering the intensity of the amorphous
background (IB) and overall intensity (IT)
XcWAX
= (IT-IB ) IT (5)
WAXD measurements indicated that relative crystallinities ranged between 068 and
048 The highest and lowest values corresponded to PES 99 and the copolymer
respectively in agreement with DSC calorimetric data and the random disposition of
dicarboxylic units It should also be pointed out that PES 97 had practically the same
crystalline than PES 99 (ie 068 respect to 067) as can be qualitatively deduced from
the similar amorphous halo observed in the WAXD profile (Figure 11a)
19
SAXS profiles taken at the end of crystallization revealed clear differences between the
lamellar thicknesses of the three samples (Figure 11b) the highest and lowest
corresponding to COPES 997-05 and PES 97 respectively SAXS data were analyzed
in more detail during crystallization considering the normalized one-dimensional
correlation function [46] (r) which corresponds to the Fourier transform of the
Lorentz-corrected SAXS profile
(r) =
0
2 )cos()( dqqrqIq
0
2 )( dqqIq (6)
SAXS data were collected within a limited angular range only That is why
extrapolations to low and high q values were performed using Vonkrsquos model [47]
and
Porodrsquos law respectively
Figure 12a illustrates the correlation functions calculated for the three samples from
SAXS profiles taken at the end of crystallization In general their analysis allowed the
determination of morphologic parameters like (1) long period L (ie r value of the
first maximum of the correlation function) (2) amorphous layer thickness la (ie r
value for the intersection of the linear regression in the autocorrelation triangle with the
ordinate equal to the first minimum of the correlation function) and (3) crystalline
lamellar thickness lc (calculated as Lla)
The Lvalues were in all cases close to the long periods determined from twice the
value of the first minimum of the correlation function Thusthe most probable distance
between the centers of gravity of two adjacent crystals appeared to be equal to twice the
most probable distance between the centers of gravity of a crystal and its adjacent
amorphous layer This suggests a narrow distribution of the layer widths of the major
component which in this case corresponds to the crystal phase
20
Data obtained during the non-isothermal hot crystallization revealed a significant
decrease of L long spacings at the beginning of the process (ie during primary
crystallization) although a continuous decrease could still be observed during the
secondary crystallization (Figure 12b) These last changes were mainly due to the
decrease in the crystalline lamellar thickness which suggests the occurrence of a
lamellar insertion mechanism throughout the crystallization process of the three samples
(ie formation of thinner lamellar crystals between loosely stacked primary lamellae)
Note that the amorphous layer thickness remained practically constant during
crystallization
Figure 12b clearly shows that PES 99 had the highest and lowest lc and la values
respectively (ie 117 and 425 nm) Hence the highest crystallinity within the lamellar
stacks XcSAXS
(calculated as lc L) was determined for PES 99 (ie 074) Crystallinity
was clearly lower for PES 97 (ie 060) showing a similar trend to that observed from
WAXD crystallinities Both homopolymers have a similar lamellar thickness but clear
differences exist between the crystalline lamellar (ie from 117 to 936 nm) and
amorphous layer (ie from 425 to 624 nm) thicknesses It seems therefore that
irregular molecular folds on the lamellar surface should involve larger segments when
the polymer is constituted by the slightly more rigid pimelate units
The greatest amorphous layer thickness (ie 717 nm) was observed for the copolymer
indicating that chain defects caused by the presence of comonomer units could be
placed in the amorphous interlamellar regions XcSAXS
was minimum for the copolymer
(ie 059) although this crystallinity was very similar to that calculated for PES 97
due to the lower crystalline lamellar thickness of the homopolymer having pimelate
units
21
Results point out that crystallization of COPES 979-05 should start by the
arrangement of azelate rich moieties according to the favoured crystallization of PES
99 respect to PES 97 a feature clearly supported by primary nucleation crystal growth
rate and overall crystallization rate data Pimelate units seem to be mainly incorporated
as defects into the interlamellar amorphous region giving rise to the observed increase
in the corresponding spacing In fact and as explained above FTIR spectra revealed
also that crystalline bands associated with PES 99 were predominant in the copolymer
sample
Combined SAXS and WAXD data were used to verify the assignment of la and lc
thicknesses which could not be distinguished from the analysis of the correlation
function [48-51] Thus the ratio between XcWAXD
and XcSAXS
is an estimate of the
volume-filling fraction of the lamellar stacks XS which should be lower than 1 for a
correct assignment For example ratios of 089 096 and 082 were determined for PES
99 PES 97 and COPES 979-05 respectively at the end of crystallization
CONCLUSIONS
Thermal polycondensation using titanium tetrabutoxyde as a catalyst was successfully
used to obtain copolyesters constituted by 19-nonanediol and different ratios of azelaic
and pimelic acid units Final copolymer compositions were always in good agreement
with the feed molar ratio and the attained molecular weights were typical of
polycondensation reactions involving monomers with different functionality
The copolymer with the intermediate composition (ie COPES 979-05) had lowest
melting temperature and melting enthalpy However the crystallinity of this sample was
still high It seemed possible to incorporate comonomer units into the crystalline
structure of each homopolymer
22
Homopolymers and copolymers crystallized according to a spherulitic growth and a
heterogeneous primary nucleation Significant differences were found between the
spherulitic textures (ie fibrilar or ringed) and even on the crystallization kinetics of
PES 97 and PES 99 homopolymers Specifically non-isothermal crystallization from
the melt was less favourable for the PES 97 sample and consequently the COPES
979-05 copolymer started to crystallize by the arrangement of azelate moieties
X-ray diffraction data indicated that crystallization always occurred according to a
lamellar insertion mechanism Significant differences were observed between crystal
lamellar and amorphous layer thicknesses of homopolymers and the copolymer with
intermediate composition Optical microscopy DSC SAXS and FTIR data suggested
that this copolymer crystallized giving rise to lamellar cores with a predominant PES
99 structure and that pimelate units were mainly located on the amorphous
interlamellar regions
Acknowledgements Authors are in debt to supports from MINECO and FEDER
(MAT2012-36205) and the Generalitat de Catalunya (2009SGR1208) Diffraction
experiments were performed at NCD beamline at ALBA Synchrotron with the
collaboration of ALBA staff
23
REFERENCES
[1] Lligadas G Ronda JC Galiagrave M Caacutediz V (2007) Poly(ether urethane) Networks
from Renewable Resources as Candidate Biomaterials Synthesis and
Characterization Biomacromolecules 8686-692
[2] Petrovic ZS (2008) Polyurethanes from Vegetable Oils Polym Rev 48109-155
[3] Hojabri L Kong X Narine SS (2010) Functional Thermoplastics from Linear
Diols and Diisocyanates Produced Entirely from Renewable Lipid Sources
Biomacromolecules 11 911-918
[4] Lligadas G Ronda JC Galiagrave M Caacutediz V (2010) Plant Oils as Platform
Chemicals for Polyurethane Synthesis Current State-of-the-Art
Biomacromolecules 112825-2835
[5] Doi Y Steinbuumlchel A (2002) Polyesters II ndash properties and chemical synthesis
New York Wiley-VCH
[6] Huang SJ (1985) Encyclopedia of polymer science and engineering vol 2 New
York Wiley-Interscience pp 20
[7] Vert M Li S M Spenlehauer G Guerin P (1992) Bioresorbability and
biocompatibility of aliphatic polyesters J Mater Sci Mater Med 3432-446
[8] Edlund E Albertsson AC (1999) Novel Drug Delivery Microspheres from
Poly(15-dioxepan-2-one-co-L-lactide) J Polym Sci Part A Polym Chem
371877-1884
[9] Kulkarni RK Moore EG Hegyeli AF Leonard F (1971) Biodegradable
poly(lactic acid) polymers J Biomed Mater Res 5169-181
[10] Kricheldorf HR Kreiser-Saunders I Juumlrgens C Wolter D (1996) Polylactides -
Synthesis Characterization and Medical Application Macromol Symp 10385-
102
[11] Thombre AG Cardinal JR (1990) Enciclopedia of Pharmaceutical Technology
2 New York Marcel Dekker pp 61
[12] Fujimaki T (1998) Processability and properties of aliphatic polyesters
lsquoBIONOLLErsquo synthesized by polycondensation reaction Polym Degrad Stab
59209-214
[13] Shih Y-F Wu T-M (2009) Enzymatic degradation kinetics of poly(butylene
succinate)nanocomposites J Polym Res 16109-115
24
[14] Lai SM Huang CK Shen HF (2005) Preparation and Properties of
Biodegradable Poly(butylene succinate)Starch Blends J Appl Polym Sci
97257-264
[15] Fuller CS (1939) X-ray investigation of the decamethylene series of polyesters
J Am Chem Soc 612575-2580
[16] Kanamoto T Tanaka K (1971) Growth and morphology of single crystals of
linear aliphatic polyesters J Polym Sci Part A-2 92043-2060
[17] Ueda AS Chatani Y Tadokoro H (1971) Structural Studies of Polyesters IV
Molecular and Crystal Structures of Poly(ethylene succinate) and Poly(ethylene
oxalate) Polym J 2387-397
[18] Aylwin PA Boyd RH (1984) Aliphatic polyesters as models for relaxation
processes in crystalline polymers 1 Characterization Polymer 25323-329
[19] Liau WB Boyd RH (1990) Structure and packing in crystalline aliphatic
polyesters Macromolecules 231531-1539
[20] Brandrup J Immergut H (1989) Polymer Handbook New York Wiley
[21] Almontassir A Gestiacute S Franco L Puiggaliacute J (2004) Molecular Packing of
Polyesters Derived from 14-Butanediol and Even Aliphatic Dicarboxylic Acids
Macromolecules 375300-5309
[22] Gestiacute S Almontassir A Casas MT Puiggaliacute J (2004) Molecular packing and
crystalline morphologies of biodegradable poly(alkylene dicarboxylate)s derived
from 16-hexanediol Polymer 458845-8861
[23] Gestiacute S Almontassir A Casas MT Puiggaliacute J (2006) Crystalline Structure of
Poly(hexamethylene adipate) Study on the Morphology and the Enzymatic
Degradation of Single Crystals Biomacromolecules 7799-808
[24] Gestiacute S Casas MT Puiggaliacute J (2007) Crystalline structure of
poly(hexamethylene succinate) and single crystal degradation studies Polymer
485088-5097
[25] Lu J-S Chen M Lu S-F Chen C-H (2011) Nonisothermal crystallization
kinetics of novel biodegradable poly(butylene succinate-co-2-methyl-13-
propylene succinate)s J Polym Res 181527-1537
[26] Champetier G Monnerie L (1969) Introduction agrave la chimie macromoleacuteculaire
Paris Masson et Cie
[27] Allegra G Bassi IW(1969) Isomorphism in synthetic macromolecular systems
Adv Polym Sci 6549-574
25
[28] Mochizuki M Mukai K Yamada K Ichise N Murase S Iwaya Y (1997)
Structural Effects upon Enzymatic Hydrolysis of Poly(butylene succinate-co-
ethylene succinate)s Macromolecules 307403-7407
[29] George Z Papageorgiou Bikiaris Dimitrios N (2007) Synthesis
Cocrystallization and Enzymatic Degradation of Novel Poly(butylene-co-
propylene succinate) Copolymers Biomacromolecules 82437-2449
[30] Li X Hong Z Sun J Geng Y Huang Y An H et al (2009) Identifying the
Phase Behavior of Biodegradable Poly(hexamethylene succinate-co-
hexamethylene adipate) Copolymers with FTIR J Phys Chem 1132695-2704
[31] Li X Sun J Huang Y Geng Y Wang X Ma Z et al (2008) Inducing New
Crystal Structures through Random Copolymerization of Biodegradable
Aliphatic Polyester Macromolecules 413162-3168
[32] Liang Z Pan P Zhu B Dong T Hua L Inoue Y (2010) Crystalline Phase of
Isomorphic Poly(hexamethylene sebacate-co-hexamethylene adipate)
Copolyester Effects of Comonomer Composition and Crystallization
Temperature Macromolecules 432925-2932
[33] Liang Z Pan P Zhu B Inoue Y (2011) Isomorphic crystallization of aliphatic
copolyesters derived from 16-hexanediol Effect of the chemical structure of
comonomer units on the extent of cocrystallization Polymer 522667-2676
[34] Rueda DR Garciacutea-Gutieacuterrez MC Nogales A Capitaacuten MJ Ezquerra TA
Labrador A Fraga E Beltraacuten D Juanhuix J Herranz JF Bordas J (2006)
Versatile wide angle diffraction setup for simultaneous wide and small angle x-
ray scattering measurements with synchrotron radiation Rev Sci Instrum 77
Art No 033904
[35] Rajkumar G AL-Khayat HA Eakins F Knupp C Squire JM (2007) The
CCP13 FibreFix program suite semi-automated analysis of diffraction patterns
from non-crystalline materials J Appl Crystallogr 40 178ndash184
[36] Herrera R Franco L Rodriacuteguez-Galaacuten A Puiggaliacute J (2002) Characterization
and degradation behavior of poly(butylene adipate-co-terephthalate)s J Polym
Sci Part A Polym Chem 40 4141-4157
[37] Pamula E Blazewicz M Paluszkiewicz P Dobrzynski (2001) FTIR study of
degradation products of aliphatic polyestersndashcarbon fibres composites J Mol
Struct 596 69-75
[38] Avrami M (1939) Kinetics of Phase Change I General Theory J Chem Phys
71103-1120
[39] Avrami M (1940) Kinetics of Phase Change II Transformation‐Time
Relations for Random Distribution of Nuclei J Chem Phys 8212-224
26
[40] Hoffman JD Weeks JJ (1962) Rate of Spherulitic Crystallization with Chain
Folds in Polychlorotrifluoroethylene J Chem Phys 371723-1741
[41] Lauritzen JI Hoffman JD (1973) Extension of theory of growth of chain‐folded
polymer crystals to large undercooling J Appl Phys 444340-4352
[42] Strobl G (2000) From the melt via mesomorphic and granular crystalline layers
to lamellar crystallites A major route followed in polymer crystallization Eur
Phys J E 3165-183
[43] Muthukumar M (2000) Commentary on theories of polymer crystallization
Eur Phys J 3199-202
[44] Williams ML Landel RF Ferry JD (1955) The Temperature Dependence of
Relaxation Mechanisms in Amorphous Polymers and Other Glass-forming
Liquids J Am Chem Soc 773701-3707
[45] Suzuki T Kovacs A (1970) Temperature dependence of spherulitic growth rate
of isotactic polystyrene J Polym J 182-100
[46] Vonk CG Kortleve G (1967) X-ray small-angle scattering of bulk
polyethylene Kolloid Z Z Polym 22019-24
[47] Vonk CG (1975) A general computer program for the processing of small-
angle X-ray scattering data J Appl Cryst 8340-341
[48] Hsiao BS Gardner KH Wu DQ Chu B (1993) Time-resolved X-ray study of
poly(aryl ether ether ketone) crystallization and melting behaviour 1
Crystallization Polymer 343986-3995
[49] Ikada Y Jamshida K Tsuji H Hyoan SH (1987) Maltopentaose- and
maltoheptaose-carrying styrene macromers and their homopolymers
Macromolecules 20906-908
[50] Kruger KN Zachmann HG (1993) Investigation of the melting behavior of
poly(aryl ether ketones) by simultaneous measurements of SAXS and WAXS
employing synchrotron radiation Macromolecules 26 5202-5208
[51] Hsiao BS Wang Z Yeh F Yan G Sheth KC (1999) Time-resolved X-ray
studies of structure development in poly(butylene terephthalate) during
isothermal crystallization Polymer 403515-3523
27
FIGURE CAPTIONS
Figure 1 Synthesis of copoly(alkylene dicarboxylate)s from 19-nonanediol and
pimelic and azelaic acids
Figure 2 Transmitance FTIR spectra (1400-800 cm-1
) of amorphous (red profiles) and
semicrystalline (blue profiles) PES 97 (a) PES 979-050 (b) and PES 99 (c) samples
Boxes highlight characteristic crystalline bands in the spectrum of the copolymer that
can be related to each homopolymer (see arrows) Asterisk points to the splitting of the
1090-1070 cm-1
amorphous band for the PES 97 sample
Figure 3 DSC traces obtained with the COPES 979-050 copolymer during the
heating run (20 ordmCmin) of the as-synthesized sample (a) the cooling run (10 ordmCmin)
after keeping the sample in the melt state for three minutes (b) the heating run (20
ordmCmin) of the hot crystallized sample (c) and the heating run (20 ordmCmin) of a sample
previously cooled at the maximum rate allowed by the equipment from the melt state
(d) The inset shows a magnification where the glass transition is clearly observed
Figure 4 Variation of the melting temperature and enthalpy of poly(nonamethylene
azelate-co-pimelate)s with the molar percentage of azelate units Enthalpies are given as
kJmol considering the molecular weight of the repeat unit determined according to the
copolymer composition
Figure 5 a) Exothermic DSC peaks corresponding to the hot isothermal crystallizations
of COPES 979-050 at temperatures between 54 and 51 ordmC Inset shows the
development of relative crystallinity over time for the indicated isothermal
crystallizations b) Avrami plots corresponding to the isothermal crystallization of
28
COPES 979-050 c) Overall crystallization rates (full symbols and solid lines) and the
reciprocal of the crystallization half-times (empty symbols and dashed lines) determined
at different temperatures for PES 99 () PES 97 (∆) and COPES 979-050 ()
samples
Figure 6 a) DSC heating runs (20 ordmCmin) of COPES 979-050 samples isothermally
crystallized at temperatures ranging from 54 to 51 ordmC b) Hoffman-Weeks plot of
temperatures corresponding to endothermic melting peaks versus crystallization
temperature for several COPES 979-x samples For the sake of clarity experimental
data of some intermediate compositions are described by dashed lines Equilibrium
melting temperatures are explicitly indicated at the corresponding intersection points
Figure 7 Polarized optical micrographs of spherulites of PES 97 (a) COPES 979-
050 (b) and PES 99 (c) crystallized at temperatures of 53 ordmC 51 ordmC and 59 ordmC
respectively For the sake of completeness spherulites of a 50 molar mixture of PES
97 and PES 99 homopolymers and crystallized at 56 ordmC are shown in (d)
Figure 8 a) Plots of COPES 979-050 spherulite radii versus crystallization time for
isothermal hot crystallizations performed at temperatures between 506 and 53 ordmC b)
Temperature dependence of the crystal growth rate for PES 99 PES 97 and COPES
979-050 samples c) Change in the nucleation density of PES 99 PES 97 and
COPES 979-050 samples with isothermal crystallization temperature
Figure 9 Plot of ln G + U
R(Tc-T) versus 1 Tc (T) f to determine the Kg
nucleation parameter of PES 99 PES 97 and COPES 979-050 samples
Figure 10 Time-resolved SAXS (a) and WAXD (b) three-dimensional profiles of PES
97 during non-isothermal hot crystallization at 3 ordmCmin
29
Figure 11 WAXD (a) and SAXS (b) profiles of PES 99 PES 97 and COPES 979-
050 samples taken at room temperature The amorphous halo obtained by
deconvolution is explicitly shown for the copolymer sample
Figure 12 Correlation functions (a) for non-isothermal hot crystallization of PES 99
PES 97 and COPES 979-050 samples b) Temperature evolution of Ldiams lc () and
la () during non-isothermal hot crystallization performed at 3 ordmCmin with PES 99
(dashed lines) PES 97 (solid lines) and COPES 979-050 (dotted lines) samples
30
Table 1 Synthesis data of studied polyesters
Polymer Yield
()
fPa
Mnb
(gmol)
Mwb
(gmol)
PDIbc
PES 97 73 1 7900 19600 247
COPES 979-085 67 086 9400 21900 233
COPES 979-070 76 071 9800 23000 236
COPES 979-050 78 053 13500 32300 240
COPES 979-030 78 032 11700 29900 257
COPES 979-015 65 017 12700 31800 250
PES 99 73 0 13300 35900 270
aPimelate molar fraction determined from
13C NMR spectra
bFrom GPC
cPolydispersity index
31
Table 2 Main crystallization kinetic parameters determined by DSC for the two
homopolymers and the copolymer with the highest comonomer content
Sample T (ordmC) Z 106
(s-n
)
n K 103
(s-1
) 1 τ12 10
3
(s-1
)
(Zln2)1n
103
(s
-1)
PES 97
52 849 239 754 887 879
53 034 266 371 430 426
54 026 247 219 256 255
55 0063 248 127 148 148
56 221 10-03
263 051 058 058
57 855 10-05
288 032 035 035
COPES 979-050
51 815 226 558 659 656
52 299 225 353 415 415
525 013 251 179 209 208
53 0025 251 094 110 109
54 178 10-04
278 031 036 036
PES 99
56 1848 260 1523 1793 175
57 028 294 589 682 667
58 0077 281 292 331 332
59 280 10-03
279 086 097 099
32
FIGURE 1
Diacuteaz et al
33
FIGURE 2
Diacuteaz et al
Tra
ns
mit
tan
ce
(
)
Wavenumber (cm-1
)
838cm-1
a)
Tra
ns
mit
tan
ce
(
)
Wavenumber (cm-1
)
b)
Tra
ns
mit
tan
ce
(
)
Wavenumber (cm-1
)
c)
1242 cm-1
34
FIGURE 3
Diacuteaz et al
0 10 20 30 40 50 60 70 80
015
025
035
045
-80 -60 -40 -20
-501 ordmC
611 ordmC
1122 Jg
605 ordmC
969 Jg
959 Jg
460 ordmC
958 Jg
a)
b)
c)
d)
Temperature (ordmC)
En
do
35
FIGURE 4
Diacuteaz et al
60
62
64
66
68
0 20 40 60 80 100
Azelate Units ()
Melt
ing
Tem
pera
ture (
ordmC)
28
30
32
34
Melt
ing
En
tha
lpy
(k
Jm
ol)
(ordmC
)
(kJ
mo
l)
36
FIGURE 5
Diacuteaz et al
0 20 40 60 80 100 120 140
En
do
ther
m
Time (min)
51 ordmC
52 ordmC
525 ordmC
53 ordmC
54 ordmC
0
20
40
60
80
100
0 20 40 60 80 100
Cry
sta
llin
ity
(
)Time (min)
53 ordmC54 ordmC
51 ordmC52 ordmC
525 ordmC
-1
-08
-06
-04
-02
0
02
04
18 28 38
log
-ln
[1-χ
(t)]
log (t-t0) (s)
51 ordmC
52 ordmC
525 ordmC 53 ordmC
54 ordmC
0
5
10
15
20
0
5
10
15
20
50 52 54 56 58 60
1t
12
1
03
(s-1
)
k
10
3(s
-1)
Temperature (ordmC)
PE979-05
PE97
PE99
b)
c)
a)
COPES 979-05
PES 97
PES 99
37
FIGURE 6
Diacuteaz et al
45
50
55
60
65
70
75
80
85
45 50 55 60 65 70 75 80 85
Temperature (ordmC)
Tem
per
atu
re (
ordmC)
PE 99
PE 979-05PE 97
PE 979-015PE 979-085
Temperature (ordmC)
En
doth
erm
50 55 60 65 70 75
a) COPES 979-05
510 ordmC
520 ordmC
525 ordmC
530 ordmC
540 ordmC
792 ordmC
779 ordmC
750 ordmC
748 ordmC
728 ordmC
b)
(ordmC
)
PE 979-
015
PE 979-
085
COPES 979-085
COPES 979-015
PES 99
COPES 979-05
PES 97
38
FIGURE 7
Diacuteaz et al
50 m
PES 97 a)
50 m
PES 99 c)
50 m
COPES 979-05 b)
50 m
d) PES 97 + PES 99
39
0
20
40
60
80
100
120
140
47 52 57 62
Nu
clei
im
m2
Temperature (ordmC)
PES 97
PES 99
COPES 979-050
0
5
10
15
20
25
30
35
0 20 40 60 80
Time (min)
Sp
heru
lite
Rad
ius
( m
)
T = 53 ordmC
T = 52 ordmC
T = 515 ordmC
T = 51 ordmC
T = 506 ordmC
0
5
10
15
20
25
30
35
40
45 50 55 60
Gro
wth
Rate
(micro
mm
in)
Temperature (ordmC)
PES 99
PES 97
COPES 979-050
(microm
)
a)
b)
c)
FIGURE 8
Diacuteaz et al
40
FIGURE 9
Diacuteaz et al
PES 99
PES 97
COPES 979-050
41
FIGURE 10
Diacuteaz et al
FIGURE 12
Diacuteaz et al
42
0 02 04 06 08
I q
2(a
u)
q (nm-1)
PES 99
PES 97
COPES 979-05
0
200
400
600
800
108 128 148 168 188
I (a
u
)
q (nm-1)
PES 99
PES 97
COPES 979-05
a)
b)
0370 nm
0372 nm
0373 nm
0414-0413 nm
FIGURE 11
Diacuteaz et al
43
FIGURE 12
Diacuteaz et al
0
5
10
15
20
25
22283440465258
Temperature (ordmC)
Sp
acin
g (
nm
)
b) a)
PES 97
COPES 979-050
PES 99
Lγ
Lγ
Lγ
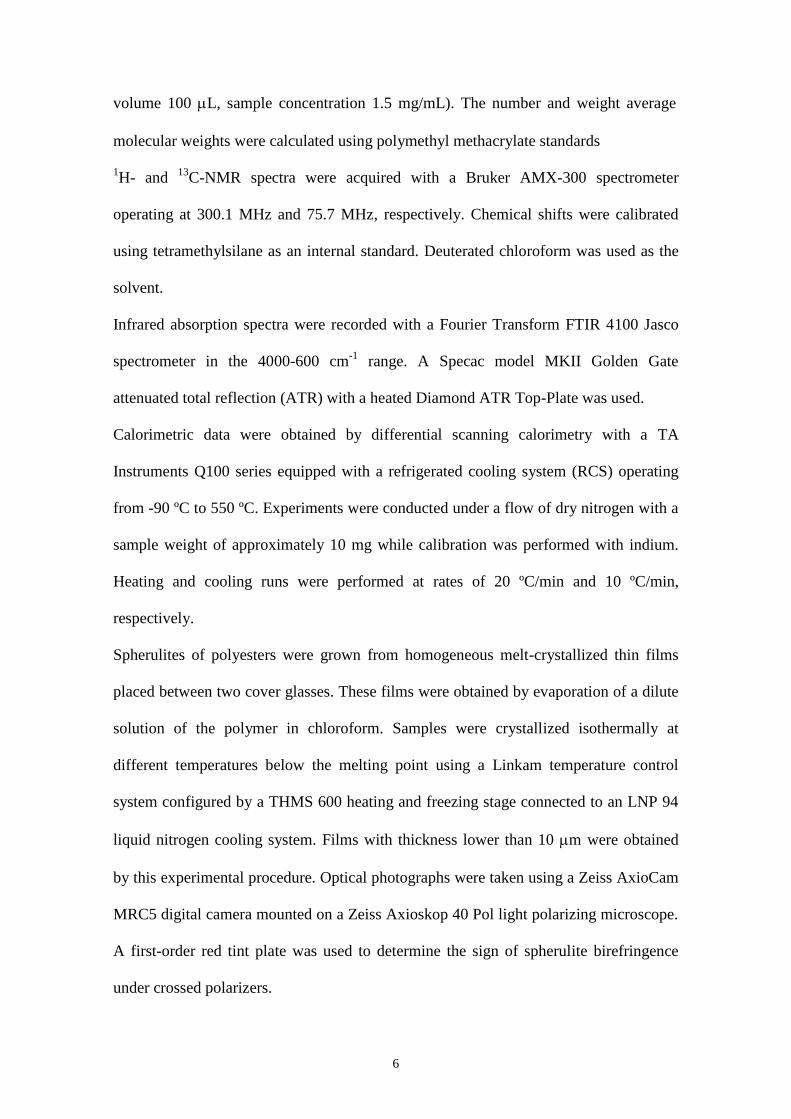

10
Transmission bands generally became broader in the spectra of amorphous samples and
could therefore be distinguished from those associated with crystalline domains which
appeared at the same wavenumber This is the case for example of the asymmetric
stretching bands of the C-O group of PES 97 which is observed for both crystalline
and amorphous phases at 1242 cm-1
On the contrary a significant wavenumber
difference was found for PES 99 (ie 1240 and 1223 cm-1
) In the amorphous state this
stretching mode appeared at the same wavenumber for both homopolymers whereas a
large difference was found in the crystalline state due to a different molecular
environment of the ester groups Bands at 1345-1315 1028-1017 954-958 and 921-918
cm-1
were also noticeable since appeared in the semicrystalline samples only
The spectrum of the semicrystalline COPES 979-05 sample is highly interesting since
some bands were split and appeared at the typical wavenumbers of the corresponding
homopolymers Thus the asymmetric stretching of the C-O group gave rise to two
narrow bands at 1242 and 1224 cm-1
indicating that two kinds of ester groups exist in
the copolymer as a result of different interactions with neighboring chains Specifically
some ester groups had the same arrangement as the PES 97 crystalline structure
whereas other groups were arranged according to the PES 99 structure Furthermore it
is qualitatively observed that the intensity of the 1224 cm-1
band is clearly greater and
consequently the PES 99 arrangement seems to be predominant The difference on
intensities cannot be justified by distinct relative absorption coefficients since both
bands appeared with similar intensity in the spectra (not shown) of an equimolar
mixture of the two homopolymers
Similar considerations can be made about the copolymer bands at 1344 and 1312 cm-1
which are attributed to deformational CH2 vibrations of polyesters [37] and are related
to those observed at 1345 cm-1
and 1315 cm-1
in PES 97 and PES 99 homopolymer
11
spectra respectively Again the higher intensity was found for the band associated with
the PES 99 structure Finally some bands like that at 1024 cm-1
and even that at 956
cm-1
appeared in the copolymer at an intermediate wavenumber with respect to the
homopolymers (ie 1028 and 954 and 1017 and 958 cm-1
for PES 97 and PES 99
respectively)
Calorimetric data of PES 97 PES 99 and COPES 979-x samples
Thermal properties of the synthesized sample were determined by the four run protocol
depicted in Figure 3 for a representative copolymer Melt and hot crystallization data
together with glass transition temperatures are summarized in Table Srdquo in SI for all
samples Several points merit further discussion
a) All samples were semicrystalline and showed a single melting peak independent of
the crystallization procedure (ie from solution or from the melt) No multiple melting
peaks were observed and consequently no evidence of distinct crystal populations with
different lamellar thicknesses was found
b) Samples were able to crystallize from the melt state at the maximum rate allowed by
the equipment Thus no cold crystallization peaks were detected in the heating run of
quenched samples whereas melting peaks were clearly observed (eg Figure 3d) In
addition these peaks had practically the same enthalpy as those measured at a slow
cooling rate for hot crystallized samples (Figure 3b) and even for solution crystallized
samples (Figure 3a)
c) The melting temperature of each homopolymer decreased with the comonomer
content The eutectic composition and minimum temperature corresponded to the
COPES 979-50 sample (Figure 4) In addition PES 99 had a higher melting
temperature than PES 97 as can be presumed from its higher methylene content [26]
12
d) Melting enthalpies of all samples were always high Thus azelate and pimelate
units were easily incorporated into the PES 97 and PES 99 crystalline structures
respectively Despite the small variation a slight decrease was observed in the melting
enthalpy of each homopolymer when comonomer units were incorporated as shown in
Figure 4 for samples crystallized from the melt The minimum enthalpy was achieved
with the COPES 979-50 sample and the variation was higher when PES 99 was
impurified due to its higher enthalpy compared with PES 97
e) Solution crystallized samples always had a higher melting enthalpy than melt
crystallized samples However a similar dependence of enthalpy upon composition was
observed
f) Non-isothermal crystallization from the melt state required a rather similar degree
of supercooling (eg between 13 and 18 ordmC at a cooling rate of 10 ordmCmin) for all
samples Thus the peak crystallization temperature of PES 97 was lower than that of
PES 99 and logically higher than that of copolymers
g) Glass transition temperatures ranged in a narrow interval (-45 ordmC to -60 ordmC) for all
samples the lower values corresponding to COPES 979-x copolymers despite having a
higher molecular weight than PES 97 homopolymer
DSC isothermal crystallization study of PES 97 PES 99 and COPES 979-05
samples
Figure 5a shows the DSC exotherms of the COPES 979-05 sample during
crystallization experiments from the melt state at selected temperatures Peaks logically
shifted to higher times and became broader with increasing the crystallization
temperature The time evolution of the relative degree of crystallinity (t) was
determined through the ratio area of the exotherm up to time t divided by the total
exotherm area ie
13
(t) = t
tdtdtdH
0)(
0)(
tdtdtdH (2)
where dHdt is the heat flow rate and t0 the induction time A characteristic sigmoidal
dependence on time was always found as plotted in Figure 5a (inset)
Kinetic crystallization data were analyzed assuming the well-known Avrami equation
[3839] for primary crystallization
1 - (t) = exp[-Z (t-t0)n] (3)
where Z is the temperature-dependent rate constant and n the Avrami exponent whose
value varies with the crystallization mechanism A normalized rate constant k = Z1n
is
usually evaluated for comparison since its dimension (time-1
) is independent of the
value of the Avrami exponent
Table 2 summarizes the main kinetic parameters of the primary crystallization process
of the homopolymers and COPES 979-05 copolyester as deduced from the plots of
log-ln[1-(t)] against log (t - t0) (Figure 7b for COPES 979-05) The values of the
Avrami exponent for the hot isothermal crystallizations lie in a narrow range from 225
to 294 258 being the average value This suggests a predetermined (heterogeneous)
nucleation with spherical growth that occurred under geometric constraints since the
theoretical value should be equal to 3 Sporadic (heterogeneous) and homogeneous
nucleation can be clearly discarded as a higher exponent close to 4 should be derived
The values of the corresponding reciprocal crystallization half-times (112) calculated
as the inverse of the difference between the time at which crystallization begins and the
time at which 50 of crystallization is completed are also summarized in Table 2 This
parameter is a direct measure of the crystallization process and could therefore be used
to check the accuracy of the Avrami analysis by comparison with the theoretical kinetic
value (ie 112 = (Z ln 2)1n
) as reported in Table 2 A similar dependence of 112 and
the kinetic rate constant on the crystallization temperature for the three polymers can
14
also be inferred from Figure 5c This Figure also shows that PES 99 crystallized faster
than PES 97 despite having a greater molecular weight and that the lowest overall
crystallization rate corresponded to the copolyester as could be logically expected It
should be pointed out that the three samples required similar supercooling to start
crystallization since the melting points of PES 99 and the copolyester samples were the
highest and the lowest respectively
Isothermal crystallizations of the polymers gave rise to samples characterized by a
single melting peak which clearly shifted to higher temperatures with increasing
crystallization temperature (eg Figure 6a for the COPES 979-05 sample) These
results clearly reflect the lamellar thickening effect and make it possible to deduce the
equilibrium melting temperatures (ie those corresponding to an ideal infinite crystal)
by the Hoffman-Weeks approach (Figure 6b) [40] Theoretical equilibrium melting
temperatures of 792 and 748 ordmC were determined for the PES 99 and PES 97
homopolymers respectively Copolymerization decreased these temperatures according
to the comonomer content Thus the minimum value corresponded to the COPES 979-
05 sample (ie 728 ordmC)
Optical microscopy crystallization study of PES 97 PES 99 and COPES 979-05
samples
All polyester samples crystallized from the melt into spherulites with negative
birefringence but different textures (Figures 7a-7c) Ringed spherulites were mainly
observed with PES 99 over the whole range of tested crystallization temperature
whereas fibrillar textures were always observed for PES 97 For the sake of
completeness Figure 7d also shows the crystallization of a 50 molar mixture of the
two homopolymers which clearly differentiated from the COPES 979-05 spherulites
depicted in Figure 7b It should be pointed out that both kinds of spherulites (fibrillar
15
and ringed) were observed in the homopolymer mixture as expected for an independent
crystallization of each polymer On the contrary only fibrillar spherulites were observed
for the copolymer sample suggesting that cocrystallization took place as also deduced
from the calorimetric data It is also worth noting that this copolymer like PES 97
required a high degree of supercooling to crystallize
Crystallization from the melt of both homopolymers and the representative COPES
979-05 copolymer was studied by optical microscopy in the range where spherulites
with adequate dimensions formed and which varied from 62 ordmC to 47 ordmC depending on
the sample A larger dimension was obtained at temperatures sufficiently high to have a
low nucleation rate compared with the crystal growth rate This size decreased with the
crystallization temperature the minimum temperature considered for each polymer
being that corresponding to a final spherulite radius close to 10 m
Spherulite radii grew linearly with time up to impingement within the studied
temperature intervals (eg Figure 8a for the copolymer) and allowed the calculation of
the corresponding growth rates G displayed in Figure 8b The maximum G values
measured were clearly different the highest corresponding to PES 99 (ie 35 mmin)
and the lowest corresponding to the copolymer (ie 6 mmin) as could be presumed
Growth data were then analyzed in terms of crystallization regimes by the mathematical
expressions derived from the crystal growth and nucleation model proposed by
Lauritzen and Hoffman [41] It is nevertheless true that the physical meaning of this
model may be questioned on account of the new theories based on experimental
evidences and different theoretical calculations [4243]
The radial growth rate (G) of polymer spherulites was thereby calculated by the
Hoffman and Lauritzen equation [41]
G = G0 exp[-U(R(Tc- T))] exp[-Kg( Tc (T) f)] (4)
16
where G0 is a constant preexponential factor U represents the activation energy
characteristic of the transport of crystallizing segments across the liquid-crystal
interface T is a hypothetical temperature below which such motion ceases Tc is the
crystallization temperature R is the gas constant Kg is the secondary nucleation
parameter T is the degree of supercooling measured as Tm0-Tc and f is a correction
factor accounting for the variation in the bulk melting enthalpy per unit volume with
temperature (f = 2 Tc (Tm0 + Tc))
The sets of parameters most commonly used for U and T are those reported by
Williams-Landel-Ferry [44] (WLF) (U
= 4120 calmol and T = Tg - 516 K) and
Suzuki and Kovacs [45] (U
= 1500 calmol and T = Tg - 30 K) The plot of ln G +
UR(Tc-T) versus 1( Tc (T) f) for the PES 97 PES 99 and COPES 979-05
samples fitted well with a linear regression representative of a single crystallization
regime (Figure 9) when the second parameter set was employed The worst regression
coefficient was r2 09934 and the secondary nucleation parameters derived from the
slopes of the linear plots of PES 97 PES 99 and COPES 979-05 crystallization data
929 104 130 10
5 and 215 10
5 K
2 respectively The highest secondary nucleation
constant corresponded to the copolymer indicating greater difficulty of the lamellar
surface in inducing crystallization of incoming polymer chains Note also that the
crystal growth rate of COPES 979-05 became strongly dependent on the
crystallization temperature as shown in the G versus temperature plot (Figure 9b)
Nucleation constants were similar for the two homopolymers although a slightly lower
value was deduced for PES 97
In addition to the crystal growth rate the overall crystallization of a sample depends on
primary nucleation which may correspond to heterogeneous nuclei or homogeneous
nuclei Primary nucleation is often a rather complex process as it depends on the
17
crystallization temperature density of heterogeneities and presenceabsence of
nucleating agents The number of nuclei slightly increased during crystallization
suggesting a thermal nucleation where all nuclei became progressively active for a
given crystallization temperature A slight degree of heterogeneity in the spherulite size
was therefore observed at the end of the crystallization process Figure 9c shows that the
nucleation density increased with decreasing the crystallization temperature for the three
samples studied and approached a single exponential dependence which resulted in
more active nuclei (ie more favorable thermodynamic conditions for nucleus
generation) with progressively decreasing the temperature The lowest density
corresponding to the copolymer as could be presumed from its lower overall
crystallization rate determined from calorimetric data Note also that the copolymer and
the PES 99 samples had similar molecular weigths (Table 1) and therefore differences
on the crystal growth rate and primary nucleation density cannot be attributed to
molecular weigth changes Only PE 97 had a slightly lower molecular weight that
could justify an increase of both magnitudes Therefore the lower values with respect to
PE99 cannot be a consequence of he lower molecular size of PE 97
Study on the non-isothermal crystallization of PES 97 PES 99 and COPES 979-
05 samples by time-resolved SAXSWAXD experiments
Figure 10 contains time-resolved SAXS and WAXD profiles taken during non-
isothermal hot crystallization at a cooling rate of 3 ordmCmin for a representative polymer
(PES 97 homopolymer) In all cases the SAXS long period peak and crystal
diffractions appear simultaneously as expected for a crystallization process controlled
by nucleation and crystal growth
The SAXS long period peak is clearly seen at a value of the scattering vector q = 2sin
in the 028-039 nm-1
range after subtraction of the empty sample background
18
observed near the beam stop This peak which can be attributed to the lamellar structure
of the spherulites appeared at slightly different q values depending on the polymer
sample and shifted to higher q values (ie lower spacings) during crystallization
showing a more pronounced change in the initial stages
WAXD profiles showed an amorphous halo (q = 203 nm-1
) whose intensity decreased
with crystallization and on which Bragg reflections formed The most intense appeared
at 0414-0413 nm (q = 1518-1521 nm-1
) and 0370 nm (q = 1698 nm-1
) and should
correspond to the (110) (020) reflections of the typical structure of a polyalkylene
dicarboxylate [21-24] The intensity of the indicated reflections increased sharply at the
beginning of crystallization and slowly after a short time interval This second step
corresponds to a secondary crystallization which could also be envisaged from the
asymmetric shape of the DSC crystallization peaks (Figure 5b) WAXD profiles of the
two homopolymers and the COPES 979-05 copolymer are compared in Figure 13a
Note that the spacings observed for both homopolymers are practically identical and
consequently the similar packing arrangement should enable co-crystallization
The degree of crystallinity of the three samples could be estimated from the
corresponding room temperature profiles by considering the intensity of the amorphous
background (IB) and overall intensity (IT)
XcWAX
= (IT-IB ) IT (5)
WAXD measurements indicated that relative crystallinities ranged between 068 and
048 The highest and lowest values corresponded to PES 99 and the copolymer
respectively in agreement with DSC calorimetric data and the random disposition of
dicarboxylic units It should also be pointed out that PES 97 had practically the same
crystalline than PES 99 (ie 068 respect to 067) as can be qualitatively deduced from
the similar amorphous halo observed in the WAXD profile (Figure 11a)
19
SAXS profiles taken at the end of crystallization revealed clear differences between the
lamellar thicknesses of the three samples (Figure 11b) the highest and lowest
corresponding to COPES 997-05 and PES 97 respectively SAXS data were analyzed
in more detail during crystallization considering the normalized one-dimensional
correlation function [46] (r) which corresponds to the Fourier transform of the
Lorentz-corrected SAXS profile
(r) =
0
2 )cos()( dqqrqIq
0
2 )( dqqIq (6)
SAXS data were collected within a limited angular range only That is why
extrapolations to low and high q values were performed using Vonkrsquos model [47]
and
Porodrsquos law respectively
Figure 12a illustrates the correlation functions calculated for the three samples from
SAXS profiles taken at the end of crystallization In general their analysis allowed the
determination of morphologic parameters like (1) long period L (ie r value of the
first maximum of the correlation function) (2) amorphous layer thickness la (ie r
value for the intersection of the linear regression in the autocorrelation triangle with the
ordinate equal to the first minimum of the correlation function) and (3) crystalline
lamellar thickness lc (calculated as Lla)
The Lvalues were in all cases close to the long periods determined from twice the
value of the first minimum of the correlation function Thusthe most probable distance
between the centers of gravity of two adjacent crystals appeared to be equal to twice the
most probable distance between the centers of gravity of a crystal and its adjacent
amorphous layer This suggests a narrow distribution of the layer widths of the major
component which in this case corresponds to the crystal phase
20
Data obtained during the non-isothermal hot crystallization revealed a significant
decrease of L long spacings at the beginning of the process (ie during primary
crystallization) although a continuous decrease could still be observed during the
secondary crystallization (Figure 12b) These last changes were mainly due to the
decrease in the crystalline lamellar thickness which suggests the occurrence of a
lamellar insertion mechanism throughout the crystallization process of the three samples
(ie formation of thinner lamellar crystals between loosely stacked primary lamellae)
Note that the amorphous layer thickness remained practically constant during
crystallization
Figure 12b clearly shows that PES 99 had the highest and lowest lc and la values
respectively (ie 117 and 425 nm) Hence the highest crystallinity within the lamellar
stacks XcSAXS
(calculated as lc L) was determined for PES 99 (ie 074) Crystallinity
was clearly lower for PES 97 (ie 060) showing a similar trend to that observed from
WAXD crystallinities Both homopolymers have a similar lamellar thickness but clear
differences exist between the crystalline lamellar (ie from 117 to 936 nm) and
amorphous layer (ie from 425 to 624 nm) thicknesses It seems therefore that
irregular molecular folds on the lamellar surface should involve larger segments when
the polymer is constituted by the slightly more rigid pimelate units
The greatest amorphous layer thickness (ie 717 nm) was observed for the copolymer
indicating that chain defects caused by the presence of comonomer units could be
placed in the amorphous interlamellar regions XcSAXS
was minimum for the copolymer
(ie 059) although this crystallinity was very similar to that calculated for PES 97
due to the lower crystalline lamellar thickness of the homopolymer having pimelate
units
21
Results point out that crystallization of COPES 979-05 should start by the
arrangement of azelate rich moieties according to the favoured crystallization of PES
99 respect to PES 97 a feature clearly supported by primary nucleation crystal growth
rate and overall crystallization rate data Pimelate units seem to be mainly incorporated
as defects into the interlamellar amorphous region giving rise to the observed increase
in the corresponding spacing In fact and as explained above FTIR spectra revealed
also that crystalline bands associated with PES 99 were predominant in the copolymer
sample
Combined SAXS and WAXD data were used to verify the assignment of la and lc
thicknesses which could not be distinguished from the analysis of the correlation
function [48-51] Thus the ratio between XcWAXD
and XcSAXS
is an estimate of the
volume-filling fraction of the lamellar stacks XS which should be lower than 1 for a
correct assignment For example ratios of 089 096 and 082 were determined for PES
99 PES 97 and COPES 979-05 respectively at the end of crystallization
CONCLUSIONS
Thermal polycondensation using titanium tetrabutoxyde as a catalyst was successfully
used to obtain copolyesters constituted by 19-nonanediol and different ratios of azelaic
and pimelic acid units Final copolymer compositions were always in good agreement
with the feed molar ratio and the attained molecular weights were typical of
polycondensation reactions involving monomers with different functionality
The copolymer with the intermediate composition (ie COPES 979-05) had lowest
melting temperature and melting enthalpy However the crystallinity of this sample was
still high It seemed possible to incorporate comonomer units into the crystalline
structure of each homopolymer
22
Homopolymers and copolymers crystallized according to a spherulitic growth and a
heterogeneous primary nucleation Significant differences were found between the
spherulitic textures (ie fibrilar or ringed) and even on the crystallization kinetics of
PES 97 and PES 99 homopolymers Specifically non-isothermal crystallization from
the melt was less favourable for the PES 97 sample and consequently the COPES
979-05 copolymer started to crystallize by the arrangement of azelate moieties
X-ray diffraction data indicated that crystallization always occurred according to a
lamellar insertion mechanism Significant differences were observed between crystal
lamellar and amorphous layer thicknesses of homopolymers and the copolymer with
intermediate composition Optical microscopy DSC SAXS and FTIR data suggested
that this copolymer crystallized giving rise to lamellar cores with a predominant PES
99 structure and that pimelate units were mainly located on the amorphous
interlamellar regions
Acknowledgements Authors are in debt to supports from MINECO and FEDER
(MAT2012-36205) and the Generalitat de Catalunya (2009SGR1208) Diffraction
experiments were performed at NCD beamline at ALBA Synchrotron with the
collaboration of ALBA staff
23
REFERENCES
[1] Lligadas G Ronda JC Galiagrave M Caacutediz V (2007) Poly(ether urethane) Networks
from Renewable Resources as Candidate Biomaterials Synthesis and
Characterization Biomacromolecules 8686-692
[2] Petrovic ZS (2008) Polyurethanes from Vegetable Oils Polym Rev 48109-155
[3] Hojabri L Kong X Narine SS (2010) Functional Thermoplastics from Linear
Diols and Diisocyanates Produced Entirely from Renewable Lipid Sources
Biomacromolecules 11 911-918
[4] Lligadas G Ronda JC Galiagrave M Caacutediz V (2010) Plant Oils as Platform
Chemicals for Polyurethane Synthesis Current State-of-the-Art
Biomacromolecules 112825-2835
[5] Doi Y Steinbuumlchel A (2002) Polyesters II ndash properties and chemical synthesis
New York Wiley-VCH
[6] Huang SJ (1985) Encyclopedia of polymer science and engineering vol 2 New
York Wiley-Interscience pp 20
[7] Vert M Li S M Spenlehauer G Guerin P (1992) Bioresorbability and
biocompatibility of aliphatic polyesters J Mater Sci Mater Med 3432-446
[8] Edlund E Albertsson AC (1999) Novel Drug Delivery Microspheres from
Poly(15-dioxepan-2-one-co-L-lactide) J Polym Sci Part A Polym Chem
371877-1884
[9] Kulkarni RK Moore EG Hegyeli AF Leonard F (1971) Biodegradable
poly(lactic acid) polymers J Biomed Mater Res 5169-181
[10] Kricheldorf HR Kreiser-Saunders I Juumlrgens C Wolter D (1996) Polylactides -
Synthesis Characterization and Medical Application Macromol Symp 10385-
102
[11] Thombre AG Cardinal JR (1990) Enciclopedia of Pharmaceutical Technology
2 New York Marcel Dekker pp 61
[12] Fujimaki T (1998) Processability and properties of aliphatic polyesters
lsquoBIONOLLErsquo synthesized by polycondensation reaction Polym Degrad Stab
59209-214
[13] Shih Y-F Wu T-M (2009) Enzymatic degradation kinetics of poly(butylene
succinate)nanocomposites J Polym Res 16109-115
24
[14] Lai SM Huang CK Shen HF (2005) Preparation and Properties of
Biodegradable Poly(butylene succinate)Starch Blends J Appl Polym Sci
97257-264
[15] Fuller CS (1939) X-ray investigation of the decamethylene series of polyesters
J Am Chem Soc 612575-2580
[16] Kanamoto T Tanaka K (1971) Growth and morphology of single crystals of
linear aliphatic polyesters J Polym Sci Part A-2 92043-2060
[17] Ueda AS Chatani Y Tadokoro H (1971) Structural Studies of Polyesters IV
Molecular and Crystal Structures of Poly(ethylene succinate) and Poly(ethylene
oxalate) Polym J 2387-397
[18] Aylwin PA Boyd RH (1984) Aliphatic polyesters as models for relaxation
processes in crystalline polymers 1 Characterization Polymer 25323-329
[19] Liau WB Boyd RH (1990) Structure and packing in crystalline aliphatic
polyesters Macromolecules 231531-1539
[20] Brandrup J Immergut H (1989) Polymer Handbook New York Wiley
[21] Almontassir A Gestiacute S Franco L Puiggaliacute J (2004) Molecular Packing of
Polyesters Derived from 14-Butanediol and Even Aliphatic Dicarboxylic Acids
Macromolecules 375300-5309
[22] Gestiacute S Almontassir A Casas MT Puiggaliacute J (2004) Molecular packing and
crystalline morphologies of biodegradable poly(alkylene dicarboxylate)s derived
from 16-hexanediol Polymer 458845-8861
[23] Gestiacute S Almontassir A Casas MT Puiggaliacute J (2006) Crystalline Structure of
Poly(hexamethylene adipate) Study on the Morphology and the Enzymatic
Degradation of Single Crystals Biomacromolecules 7799-808
[24] Gestiacute S Casas MT Puiggaliacute J (2007) Crystalline structure of
poly(hexamethylene succinate) and single crystal degradation studies Polymer
485088-5097
[25] Lu J-S Chen M Lu S-F Chen C-H (2011) Nonisothermal crystallization
kinetics of novel biodegradable poly(butylene succinate-co-2-methyl-13-
propylene succinate)s J Polym Res 181527-1537
[26] Champetier G Monnerie L (1969) Introduction agrave la chimie macromoleacuteculaire
Paris Masson et Cie
[27] Allegra G Bassi IW(1969) Isomorphism in synthetic macromolecular systems
Adv Polym Sci 6549-574
25
[28] Mochizuki M Mukai K Yamada K Ichise N Murase S Iwaya Y (1997)
Structural Effects upon Enzymatic Hydrolysis of Poly(butylene succinate-co-
ethylene succinate)s Macromolecules 307403-7407
[29] George Z Papageorgiou Bikiaris Dimitrios N (2007) Synthesis
Cocrystallization and Enzymatic Degradation of Novel Poly(butylene-co-
propylene succinate) Copolymers Biomacromolecules 82437-2449
[30] Li X Hong Z Sun J Geng Y Huang Y An H et al (2009) Identifying the
Phase Behavior of Biodegradable Poly(hexamethylene succinate-co-
hexamethylene adipate) Copolymers with FTIR J Phys Chem 1132695-2704
[31] Li X Sun J Huang Y Geng Y Wang X Ma Z et al (2008) Inducing New
Crystal Structures through Random Copolymerization of Biodegradable
Aliphatic Polyester Macromolecules 413162-3168
[32] Liang Z Pan P Zhu B Dong T Hua L Inoue Y (2010) Crystalline Phase of
Isomorphic Poly(hexamethylene sebacate-co-hexamethylene adipate)
Copolyester Effects of Comonomer Composition and Crystallization
Temperature Macromolecules 432925-2932
[33] Liang Z Pan P Zhu B Inoue Y (2011) Isomorphic crystallization of aliphatic
copolyesters derived from 16-hexanediol Effect of the chemical structure of
comonomer units on the extent of cocrystallization Polymer 522667-2676
[34] Rueda DR Garciacutea-Gutieacuterrez MC Nogales A Capitaacuten MJ Ezquerra TA
Labrador A Fraga E Beltraacuten D Juanhuix J Herranz JF Bordas J (2006)
Versatile wide angle diffraction setup for simultaneous wide and small angle x-
ray scattering measurements with synchrotron radiation Rev Sci Instrum 77
Art No 033904
[35] Rajkumar G AL-Khayat HA Eakins F Knupp C Squire JM (2007) The
CCP13 FibreFix program suite semi-automated analysis of diffraction patterns
from non-crystalline materials J Appl Crystallogr 40 178ndash184
[36] Herrera R Franco L Rodriacuteguez-Galaacuten A Puiggaliacute J (2002) Characterization
and degradation behavior of poly(butylene adipate-co-terephthalate)s J Polym
Sci Part A Polym Chem 40 4141-4157
[37] Pamula E Blazewicz M Paluszkiewicz P Dobrzynski (2001) FTIR study of
degradation products of aliphatic polyestersndashcarbon fibres composites J Mol
Struct 596 69-75
[38] Avrami M (1939) Kinetics of Phase Change I General Theory J Chem Phys
71103-1120
[39] Avrami M (1940) Kinetics of Phase Change II Transformation‐Time
Relations for Random Distribution of Nuclei J Chem Phys 8212-224
26
[40] Hoffman JD Weeks JJ (1962) Rate of Spherulitic Crystallization with Chain
Folds in Polychlorotrifluoroethylene J Chem Phys 371723-1741
[41] Lauritzen JI Hoffman JD (1973) Extension of theory of growth of chain‐folded
polymer crystals to large undercooling J Appl Phys 444340-4352
[42] Strobl G (2000) From the melt via mesomorphic and granular crystalline layers
to lamellar crystallites A major route followed in polymer crystallization Eur
Phys J E 3165-183
[43] Muthukumar M (2000) Commentary on theories of polymer crystallization
Eur Phys J 3199-202
[44] Williams ML Landel RF Ferry JD (1955) The Temperature Dependence of
Relaxation Mechanisms in Amorphous Polymers and Other Glass-forming
Liquids J Am Chem Soc 773701-3707
[45] Suzuki T Kovacs A (1970) Temperature dependence of spherulitic growth rate
of isotactic polystyrene J Polym J 182-100
[46] Vonk CG Kortleve G (1967) X-ray small-angle scattering of bulk
polyethylene Kolloid Z Z Polym 22019-24
[47] Vonk CG (1975) A general computer program for the processing of small-
angle X-ray scattering data J Appl Cryst 8340-341
[48] Hsiao BS Gardner KH Wu DQ Chu B (1993) Time-resolved X-ray study of
poly(aryl ether ether ketone) crystallization and melting behaviour 1
Crystallization Polymer 343986-3995
[49] Ikada Y Jamshida K Tsuji H Hyoan SH (1987) Maltopentaose- and
maltoheptaose-carrying styrene macromers and their homopolymers
Macromolecules 20906-908
[50] Kruger KN Zachmann HG (1993) Investigation of the melting behavior of
poly(aryl ether ketones) by simultaneous measurements of SAXS and WAXS
employing synchrotron radiation Macromolecules 26 5202-5208
[51] Hsiao BS Wang Z Yeh F Yan G Sheth KC (1999) Time-resolved X-ray
studies of structure development in poly(butylene terephthalate) during
isothermal crystallization Polymer 403515-3523
27
FIGURE CAPTIONS
Figure 1 Synthesis of copoly(alkylene dicarboxylate)s from 19-nonanediol and
pimelic and azelaic acids
Figure 2 Transmitance FTIR spectra (1400-800 cm-1
) of amorphous (red profiles) and
semicrystalline (blue profiles) PES 97 (a) PES 979-050 (b) and PES 99 (c) samples
Boxes highlight characteristic crystalline bands in the spectrum of the copolymer that
can be related to each homopolymer (see arrows) Asterisk points to the splitting of the
1090-1070 cm-1
amorphous band for the PES 97 sample
Figure 3 DSC traces obtained with the COPES 979-050 copolymer during the
heating run (20 ordmCmin) of the as-synthesized sample (a) the cooling run (10 ordmCmin)
after keeping the sample in the melt state for three minutes (b) the heating run (20
ordmCmin) of the hot crystallized sample (c) and the heating run (20 ordmCmin) of a sample
previously cooled at the maximum rate allowed by the equipment from the melt state
(d) The inset shows a magnification where the glass transition is clearly observed
Figure 4 Variation of the melting temperature and enthalpy of poly(nonamethylene
azelate-co-pimelate)s with the molar percentage of azelate units Enthalpies are given as
kJmol considering the molecular weight of the repeat unit determined according to the
copolymer composition
Figure 5 a) Exothermic DSC peaks corresponding to the hot isothermal crystallizations
of COPES 979-050 at temperatures between 54 and 51 ordmC Inset shows the
development of relative crystallinity over time for the indicated isothermal
crystallizations b) Avrami plots corresponding to the isothermal crystallization of
28
COPES 979-050 c) Overall crystallization rates (full symbols and solid lines) and the
reciprocal of the crystallization half-times (empty symbols and dashed lines) determined
at different temperatures for PES 99 () PES 97 (∆) and COPES 979-050 ()
samples
Figure 6 a) DSC heating runs (20 ordmCmin) of COPES 979-050 samples isothermally
crystallized at temperatures ranging from 54 to 51 ordmC b) Hoffman-Weeks plot of
temperatures corresponding to endothermic melting peaks versus crystallization
temperature for several COPES 979-x samples For the sake of clarity experimental
data of some intermediate compositions are described by dashed lines Equilibrium
melting temperatures are explicitly indicated at the corresponding intersection points
Figure 7 Polarized optical micrographs of spherulites of PES 97 (a) COPES 979-
050 (b) and PES 99 (c) crystallized at temperatures of 53 ordmC 51 ordmC and 59 ordmC
respectively For the sake of completeness spherulites of a 50 molar mixture of PES
97 and PES 99 homopolymers and crystallized at 56 ordmC are shown in (d)
Figure 8 a) Plots of COPES 979-050 spherulite radii versus crystallization time for
isothermal hot crystallizations performed at temperatures between 506 and 53 ordmC b)
Temperature dependence of the crystal growth rate for PES 99 PES 97 and COPES
979-050 samples c) Change in the nucleation density of PES 99 PES 97 and
COPES 979-050 samples with isothermal crystallization temperature
Figure 9 Plot of ln G + U
R(Tc-T) versus 1 Tc (T) f to determine the Kg
nucleation parameter of PES 99 PES 97 and COPES 979-050 samples
Figure 10 Time-resolved SAXS (a) and WAXD (b) three-dimensional profiles of PES
97 during non-isothermal hot crystallization at 3 ordmCmin
29
Figure 11 WAXD (a) and SAXS (b) profiles of PES 99 PES 97 and COPES 979-
050 samples taken at room temperature The amorphous halo obtained by
deconvolution is explicitly shown for the copolymer sample
Figure 12 Correlation functions (a) for non-isothermal hot crystallization of PES 99
PES 97 and COPES 979-050 samples b) Temperature evolution of Ldiams lc () and
la () during non-isothermal hot crystallization performed at 3 ordmCmin with PES 99
(dashed lines) PES 97 (solid lines) and COPES 979-050 (dotted lines) samples
30
Table 1 Synthesis data of studied polyesters
Polymer Yield
()
fPa
Mnb
(gmol)
Mwb
(gmol)
PDIbc
PES 97 73 1 7900 19600 247
COPES 979-085 67 086 9400 21900 233
COPES 979-070 76 071 9800 23000 236
COPES 979-050 78 053 13500 32300 240
COPES 979-030 78 032 11700 29900 257
COPES 979-015 65 017 12700 31800 250
PES 99 73 0 13300 35900 270
aPimelate molar fraction determined from
13C NMR spectra
bFrom GPC
cPolydispersity index
31
Table 2 Main crystallization kinetic parameters determined by DSC for the two
homopolymers and the copolymer with the highest comonomer content
Sample T (ordmC) Z 106
(s-n
)
n K 103
(s-1
) 1 τ12 10
3
(s-1
)
(Zln2)1n
103
(s
-1)
PES 97
52 849 239 754 887 879
53 034 266 371 430 426
54 026 247 219 256 255
55 0063 248 127 148 148
56 221 10-03
263 051 058 058
57 855 10-05
288 032 035 035
COPES 979-050
51 815 226 558 659 656
52 299 225 353 415 415
525 013 251 179 209 208
53 0025 251 094 110 109
54 178 10-04
278 031 036 036
PES 99
56 1848 260 1523 1793 175
57 028 294 589 682 667
58 0077 281 292 331 332
59 280 10-03
279 086 097 099
32
FIGURE 1
Diacuteaz et al
33
FIGURE 2
Diacuteaz et al
Tra
ns
mit
tan
ce
(
)
Wavenumber (cm-1
)
838cm-1
a)
Tra
ns
mit
tan
ce
(
)
Wavenumber (cm-1
)
b)
Tra
ns
mit
tan
ce
(
)
Wavenumber (cm-1
)
c)
1242 cm-1
34
FIGURE 3
Diacuteaz et al
0 10 20 30 40 50 60 70 80
015
025
035
045
-80 -60 -40 -20
-501 ordmC
611 ordmC
1122 Jg
605 ordmC
969 Jg
959 Jg
460 ordmC
958 Jg
a)
b)
c)
d)
Temperature (ordmC)
En
do
35
FIGURE 4
Diacuteaz et al
60
62
64
66
68
0 20 40 60 80 100
Azelate Units ()
Melt
ing
Tem
pera
ture (
ordmC)
28
30
32
34
Melt
ing
En
tha
lpy
(k
Jm
ol)
(ordmC
)
(kJ
mo
l)
36
FIGURE 5
Diacuteaz et al
0 20 40 60 80 100 120 140
En
do
ther
m
Time (min)
51 ordmC
52 ordmC
525 ordmC
53 ordmC
54 ordmC
0
20
40
60
80
100
0 20 40 60 80 100
Cry
sta
llin
ity
(
)Time (min)
53 ordmC54 ordmC
51 ordmC52 ordmC
525 ordmC
-1
-08
-06
-04
-02
0
02
04
18 28 38
log
-ln
[1-χ
(t)]
log (t-t0) (s)
51 ordmC
52 ordmC
525 ordmC 53 ordmC
54 ordmC
0
5
10
15
20
0
5
10
15
20
50 52 54 56 58 60
1t
12
1
03
(s-1
)
k
10
3(s
-1)
Temperature (ordmC)
PE979-05
PE97
PE99
b)
c)
a)
COPES 979-05
PES 97
PES 99
37
FIGURE 6
Diacuteaz et al
45
50
55
60
65
70
75
80
85
45 50 55 60 65 70 75 80 85
Temperature (ordmC)
Tem
per
atu
re (
ordmC)
PE 99
PE 979-05PE 97
PE 979-015PE 979-085
Temperature (ordmC)
En
doth
erm
50 55 60 65 70 75
a) COPES 979-05
510 ordmC
520 ordmC
525 ordmC
530 ordmC
540 ordmC
792 ordmC
779 ordmC
750 ordmC
748 ordmC
728 ordmC
b)
(ordmC
)
PE 979-
015
PE 979-
085
COPES 979-085
COPES 979-015
PES 99
COPES 979-05
PES 97
38
FIGURE 7
Diacuteaz et al
50 m
PES 97 a)
50 m
PES 99 c)
50 m
COPES 979-05 b)
50 m
d) PES 97 + PES 99
39
0
20
40
60
80
100
120
140
47 52 57 62
Nu
clei
im
m2
Temperature (ordmC)
PES 97
PES 99
COPES 979-050
0
5
10
15
20
25
30
35
0 20 40 60 80
Time (min)
Sp
heru
lite
Rad
ius
( m
)
T = 53 ordmC
T = 52 ordmC
T = 515 ordmC
T = 51 ordmC
T = 506 ordmC
0
5
10
15
20
25
30
35
40
45 50 55 60
Gro
wth
Rate
(micro
mm
in)
Temperature (ordmC)
PES 99
PES 97
COPES 979-050
(microm
)
a)
b)
c)
FIGURE 8
Diacuteaz et al
40
FIGURE 9
Diacuteaz et al
PES 99
PES 97
COPES 979-050
41
FIGURE 10
Diacuteaz et al
FIGURE 12
Diacuteaz et al
42
0 02 04 06 08
I q
2(a
u)
q (nm-1)
PES 99
PES 97
COPES 979-05
0
200
400
600
800
108 128 148 168 188
I (a
u
)
q (nm-1)
PES 99
PES 97
COPES 979-05
a)
b)
0370 nm
0372 nm
0373 nm
0414-0413 nm
FIGURE 11
Diacuteaz et al
43
FIGURE 12
Diacuteaz et al
0
5
10
15
20
25
22283440465258
Temperature (ordmC)
Sp
acin
g (
nm
)
b) a)
PES 97
COPES 979-050
PES 99
Lγ
Lγ
Lγ
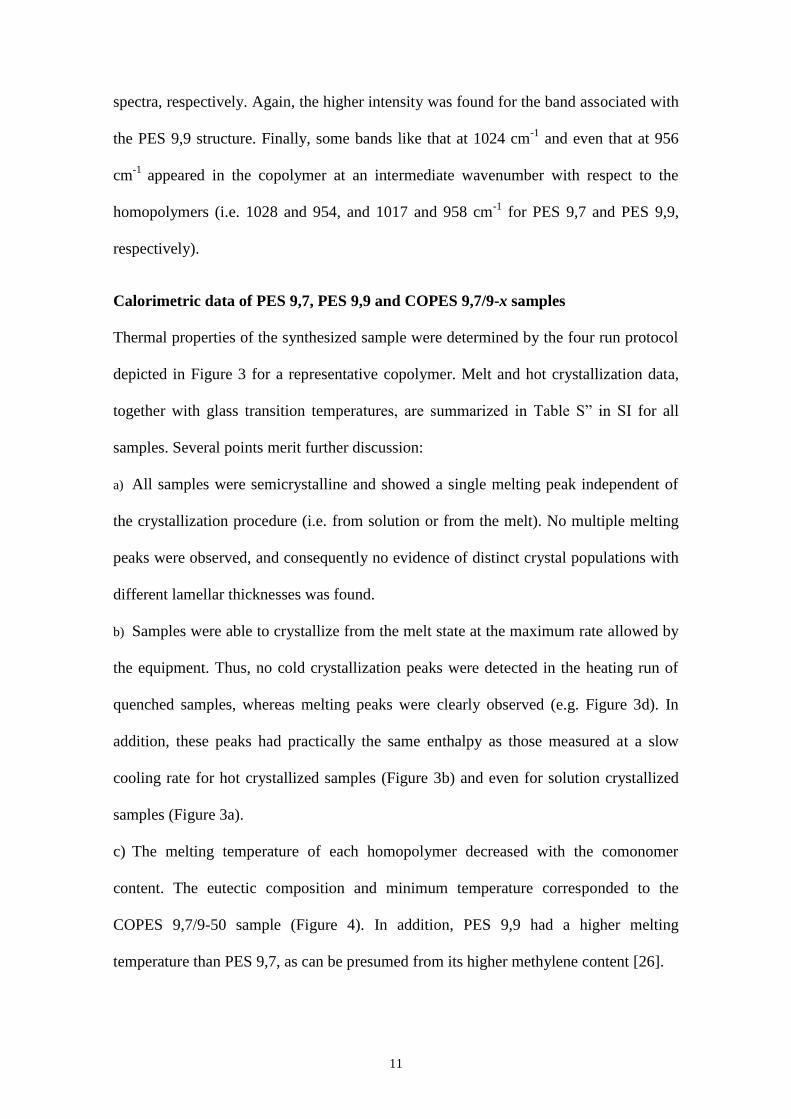
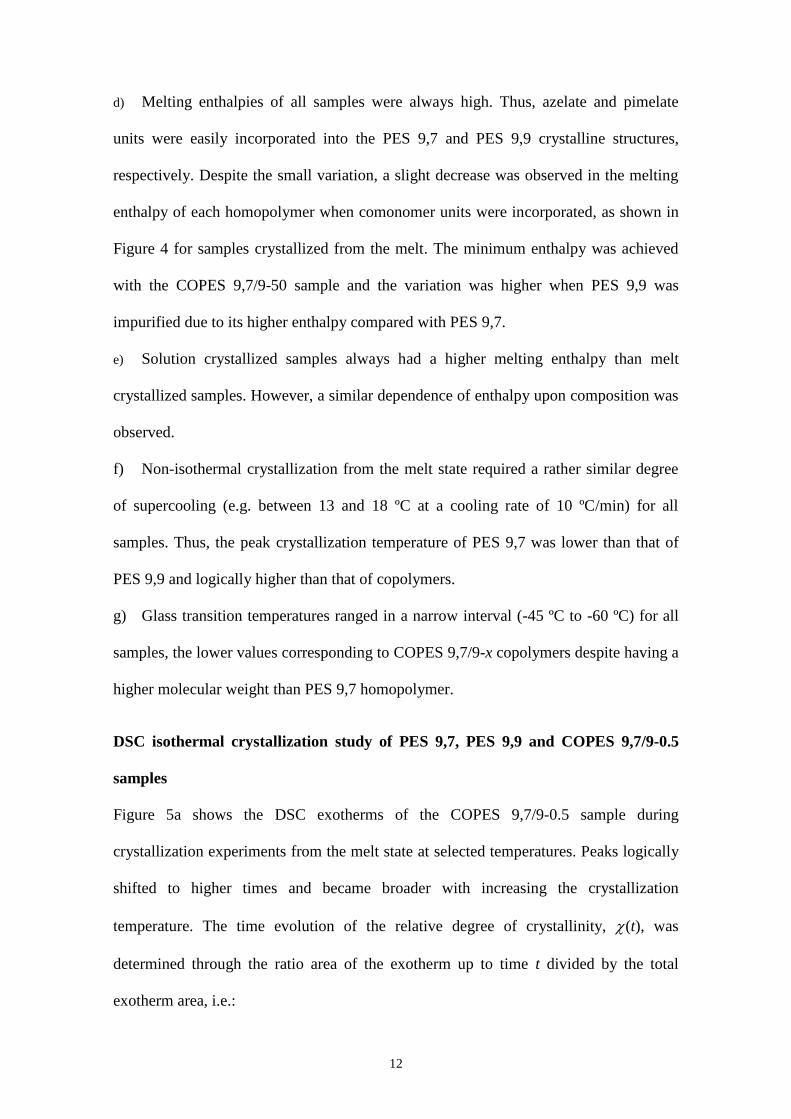
12
d) Melting enthalpies of all samples were always high Thus azelate and pimelate
units were easily incorporated into the PES 97 and PES 99 crystalline structures
respectively Despite the small variation a slight decrease was observed in the melting
enthalpy of each homopolymer when comonomer units were incorporated as shown in
Figure 4 for samples crystallized from the melt The minimum enthalpy was achieved
with the COPES 979-50 sample and the variation was higher when PES 99 was
impurified due to its higher enthalpy compared with PES 97
e) Solution crystallized samples always had a higher melting enthalpy than melt
crystallized samples However a similar dependence of enthalpy upon composition was
observed
f) Non-isothermal crystallization from the melt state required a rather similar degree
of supercooling (eg between 13 and 18 ordmC at a cooling rate of 10 ordmCmin) for all
samples Thus the peak crystallization temperature of PES 97 was lower than that of
PES 99 and logically higher than that of copolymers
g) Glass transition temperatures ranged in a narrow interval (-45 ordmC to -60 ordmC) for all
samples the lower values corresponding to COPES 979-x copolymers despite having a
higher molecular weight than PES 97 homopolymer
DSC isothermal crystallization study of PES 97 PES 99 and COPES 979-05
samples
Figure 5a shows the DSC exotherms of the COPES 979-05 sample during
crystallization experiments from the melt state at selected temperatures Peaks logically
shifted to higher times and became broader with increasing the crystallization
temperature The time evolution of the relative degree of crystallinity (t) was
determined through the ratio area of the exotherm up to time t divided by the total
exotherm area ie
13
(t) = t
tdtdtdH
0)(
0)(
tdtdtdH (2)
where dHdt is the heat flow rate and t0 the induction time A characteristic sigmoidal
dependence on time was always found as plotted in Figure 5a (inset)
Kinetic crystallization data were analyzed assuming the well-known Avrami equation
[3839] for primary crystallization
1 - (t) = exp[-Z (t-t0)n] (3)
where Z is the temperature-dependent rate constant and n the Avrami exponent whose
value varies with the crystallization mechanism A normalized rate constant k = Z1n
is
usually evaluated for comparison since its dimension (time-1
) is independent of the
value of the Avrami exponent
Table 2 summarizes the main kinetic parameters of the primary crystallization process
of the homopolymers and COPES 979-05 copolyester as deduced from the plots of
log-ln[1-(t)] against log (t - t0) (Figure 7b for COPES 979-05) The values of the
Avrami exponent for the hot isothermal crystallizations lie in a narrow range from 225
to 294 258 being the average value This suggests a predetermined (heterogeneous)
nucleation with spherical growth that occurred under geometric constraints since the
theoretical value should be equal to 3 Sporadic (heterogeneous) and homogeneous
nucleation can be clearly discarded as a higher exponent close to 4 should be derived
The values of the corresponding reciprocal crystallization half-times (112) calculated
as the inverse of the difference between the time at which crystallization begins and the
time at which 50 of crystallization is completed are also summarized in Table 2 This
parameter is a direct measure of the crystallization process and could therefore be used
to check the accuracy of the Avrami analysis by comparison with the theoretical kinetic
value (ie 112 = (Z ln 2)1n
) as reported in Table 2 A similar dependence of 112 and
the kinetic rate constant on the crystallization temperature for the three polymers can
14
also be inferred from Figure 5c This Figure also shows that PES 99 crystallized faster
than PES 97 despite having a greater molecular weight and that the lowest overall
crystallization rate corresponded to the copolyester as could be logically expected It
should be pointed out that the three samples required similar supercooling to start
crystallization since the melting points of PES 99 and the copolyester samples were the
highest and the lowest respectively
Isothermal crystallizations of the polymers gave rise to samples characterized by a
single melting peak which clearly shifted to higher temperatures with increasing
crystallization temperature (eg Figure 6a for the COPES 979-05 sample) These
results clearly reflect the lamellar thickening effect and make it possible to deduce the
equilibrium melting temperatures (ie those corresponding to an ideal infinite crystal)
by the Hoffman-Weeks approach (Figure 6b) [40] Theoretical equilibrium melting
temperatures of 792 and 748 ordmC were determined for the PES 99 and PES 97
homopolymers respectively Copolymerization decreased these temperatures according
to the comonomer content Thus the minimum value corresponded to the COPES 979-
05 sample (ie 728 ordmC)
Optical microscopy crystallization study of PES 97 PES 99 and COPES 979-05
samples
All polyester samples crystallized from the melt into spherulites with negative
birefringence but different textures (Figures 7a-7c) Ringed spherulites were mainly
observed with PES 99 over the whole range of tested crystallization temperature
whereas fibrillar textures were always observed for PES 97 For the sake of
completeness Figure 7d also shows the crystallization of a 50 molar mixture of the
two homopolymers which clearly differentiated from the COPES 979-05 spherulites
depicted in Figure 7b It should be pointed out that both kinds of spherulites (fibrillar
15
and ringed) were observed in the homopolymer mixture as expected for an independent
crystallization of each polymer On the contrary only fibrillar spherulites were observed
for the copolymer sample suggesting that cocrystallization took place as also deduced
from the calorimetric data It is also worth noting that this copolymer like PES 97
required a high degree of supercooling to crystallize
Crystallization from the melt of both homopolymers and the representative COPES
979-05 copolymer was studied by optical microscopy in the range where spherulites
with adequate dimensions formed and which varied from 62 ordmC to 47 ordmC depending on
the sample A larger dimension was obtained at temperatures sufficiently high to have a
low nucleation rate compared with the crystal growth rate This size decreased with the
crystallization temperature the minimum temperature considered for each polymer
being that corresponding to a final spherulite radius close to 10 m
Spherulite radii grew linearly with time up to impingement within the studied
temperature intervals (eg Figure 8a for the copolymer) and allowed the calculation of
the corresponding growth rates G displayed in Figure 8b The maximum G values
measured were clearly different the highest corresponding to PES 99 (ie 35 mmin)
and the lowest corresponding to the copolymer (ie 6 mmin) as could be presumed
Growth data were then analyzed in terms of crystallization regimes by the mathematical
expressions derived from the crystal growth and nucleation model proposed by
Lauritzen and Hoffman [41] It is nevertheless true that the physical meaning of this
model may be questioned on account of the new theories based on experimental
evidences and different theoretical calculations [4243]
The radial growth rate (G) of polymer spherulites was thereby calculated by the
Hoffman and Lauritzen equation [41]
G = G0 exp[-U(R(Tc- T))] exp[-Kg( Tc (T) f)] (4)
16
where G0 is a constant preexponential factor U represents the activation energy
characteristic of the transport of crystallizing segments across the liquid-crystal
interface T is a hypothetical temperature below which such motion ceases Tc is the
crystallization temperature R is the gas constant Kg is the secondary nucleation
parameter T is the degree of supercooling measured as Tm0-Tc and f is a correction
factor accounting for the variation in the bulk melting enthalpy per unit volume with
temperature (f = 2 Tc (Tm0 + Tc))
The sets of parameters most commonly used for U and T are those reported by
Williams-Landel-Ferry [44] (WLF) (U
= 4120 calmol and T = Tg - 516 K) and
Suzuki and Kovacs [45] (U
= 1500 calmol and T = Tg - 30 K) The plot of ln G +
UR(Tc-T) versus 1( Tc (T) f) for the PES 97 PES 99 and COPES 979-05
samples fitted well with a linear regression representative of a single crystallization
regime (Figure 9) when the second parameter set was employed The worst regression
coefficient was r2 09934 and the secondary nucleation parameters derived from the
slopes of the linear plots of PES 97 PES 99 and COPES 979-05 crystallization data
929 104 130 10
5 and 215 10
5 K
2 respectively The highest secondary nucleation
constant corresponded to the copolymer indicating greater difficulty of the lamellar
surface in inducing crystallization of incoming polymer chains Note also that the
crystal growth rate of COPES 979-05 became strongly dependent on the
crystallization temperature as shown in the G versus temperature plot (Figure 9b)
Nucleation constants were similar for the two homopolymers although a slightly lower
value was deduced for PES 97
In addition to the crystal growth rate the overall crystallization of a sample depends on
primary nucleation which may correspond to heterogeneous nuclei or homogeneous
nuclei Primary nucleation is often a rather complex process as it depends on the
17
crystallization temperature density of heterogeneities and presenceabsence of
nucleating agents The number of nuclei slightly increased during crystallization
suggesting a thermal nucleation where all nuclei became progressively active for a
given crystallization temperature A slight degree of heterogeneity in the spherulite size
was therefore observed at the end of the crystallization process Figure 9c shows that the
nucleation density increased with decreasing the crystallization temperature for the three
samples studied and approached a single exponential dependence which resulted in
more active nuclei (ie more favorable thermodynamic conditions for nucleus
generation) with progressively decreasing the temperature The lowest density
corresponding to the copolymer as could be presumed from its lower overall
crystallization rate determined from calorimetric data Note also that the copolymer and
the PES 99 samples had similar molecular weigths (Table 1) and therefore differences
on the crystal growth rate and primary nucleation density cannot be attributed to
molecular weigth changes Only PE 97 had a slightly lower molecular weight that
could justify an increase of both magnitudes Therefore the lower values with respect to
PE99 cannot be a consequence of he lower molecular size of PE 97
Study on the non-isothermal crystallization of PES 97 PES 99 and COPES 979-
05 samples by time-resolved SAXSWAXD experiments
Figure 10 contains time-resolved SAXS and WAXD profiles taken during non-
isothermal hot crystallization at a cooling rate of 3 ordmCmin for a representative polymer
(PES 97 homopolymer) In all cases the SAXS long period peak and crystal
diffractions appear simultaneously as expected for a crystallization process controlled
by nucleation and crystal growth
The SAXS long period peak is clearly seen at a value of the scattering vector q = 2sin
in the 028-039 nm-1
range after subtraction of the empty sample background
18
observed near the beam stop This peak which can be attributed to the lamellar structure
of the spherulites appeared at slightly different q values depending on the polymer
sample and shifted to higher q values (ie lower spacings) during crystallization
showing a more pronounced change in the initial stages
WAXD profiles showed an amorphous halo (q = 203 nm-1
) whose intensity decreased
with crystallization and on which Bragg reflections formed The most intense appeared
at 0414-0413 nm (q = 1518-1521 nm-1
) and 0370 nm (q = 1698 nm-1
) and should
correspond to the (110) (020) reflections of the typical structure of a polyalkylene
dicarboxylate [21-24] The intensity of the indicated reflections increased sharply at the
beginning of crystallization and slowly after a short time interval This second step
corresponds to a secondary crystallization which could also be envisaged from the
asymmetric shape of the DSC crystallization peaks (Figure 5b) WAXD profiles of the
two homopolymers and the COPES 979-05 copolymer are compared in Figure 13a
Note that the spacings observed for both homopolymers are practically identical and
consequently the similar packing arrangement should enable co-crystallization
The degree of crystallinity of the three samples could be estimated from the
corresponding room temperature profiles by considering the intensity of the amorphous
background (IB) and overall intensity (IT)
XcWAX
= (IT-IB ) IT (5)
WAXD measurements indicated that relative crystallinities ranged between 068 and
048 The highest and lowest values corresponded to PES 99 and the copolymer
respectively in agreement with DSC calorimetric data and the random disposition of
dicarboxylic units It should also be pointed out that PES 97 had practically the same
crystalline than PES 99 (ie 068 respect to 067) as can be qualitatively deduced from
the similar amorphous halo observed in the WAXD profile (Figure 11a)
19
SAXS profiles taken at the end of crystallization revealed clear differences between the
lamellar thicknesses of the three samples (Figure 11b) the highest and lowest
corresponding to COPES 997-05 and PES 97 respectively SAXS data were analyzed
in more detail during crystallization considering the normalized one-dimensional
correlation function [46] (r) which corresponds to the Fourier transform of the
Lorentz-corrected SAXS profile
(r) =
0
2 )cos()( dqqrqIq
0
2 )( dqqIq (6)
SAXS data were collected within a limited angular range only That is why
extrapolations to low and high q values were performed using Vonkrsquos model [47]
and
Porodrsquos law respectively
Figure 12a illustrates the correlation functions calculated for the three samples from
SAXS profiles taken at the end of crystallization In general their analysis allowed the
determination of morphologic parameters like (1) long period L (ie r value of the
first maximum of the correlation function) (2) amorphous layer thickness la (ie r
value for the intersection of the linear regression in the autocorrelation triangle with the
ordinate equal to the first minimum of the correlation function) and (3) crystalline
lamellar thickness lc (calculated as Lla)
The Lvalues were in all cases close to the long periods determined from twice the
value of the first minimum of the correlation function Thusthe most probable distance
between the centers of gravity of two adjacent crystals appeared to be equal to twice the
most probable distance between the centers of gravity of a crystal and its adjacent
amorphous layer This suggests a narrow distribution of the layer widths of the major
component which in this case corresponds to the crystal phase
20
Data obtained during the non-isothermal hot crystallization revealed a significant
decrease of L long spacings at the beginning of the process (ie during primary
crystallization) although a continuous decrease could still be observed during the
secondary crystallization (Figure 12b) These last changes were mainly due to the
decrease in the crystalline lamellar thickness which suggests the occurrence of a
lamellar insertion mechanism throughout the crystallization process of the three samples
(ie formation of thinner lamellar crystals between loosely stacked primary lamellae)
Note that the amorphous layer thickness remained practically constant during
crystallization
Figure 12b clearly shows that PES 99 had the highest and lowest lc and la values
respectively (ie 117 and 425 nm) Hence the highest crystallinity within the lamellar
stacks XcSAXS
(calculated as lc L) was determined for PES 99 (ie 074) Crystallinity
was clearly lower for PES 97 (ie 060) showing a similar trend to that observed from
WAXD crystallinities Both homopolymers have a similar lamellar thickness but clear
differences exist between the crystalline lamellar (ie from 117 to 936 nm) and
amorphous layer (ie from 425 to 624 nm) thicknesses It seems therefore that
irregular molecular folds on the lamellar surface should involve larger segments when
the polymer is constituted by the slightly more rigid pimelate units
The greatest amorphous layer thickness (ie 717 nm) was observed for the copolymer
indicating that chain defects caused by the presence of comonomer units could be
placed in the amorphous interlamellar regions XcSAXS
was minimum for the copolymer
(ie 059) although this crystallinity was very similar to that calculated for PES 97
due to the lower crystalline lamellar thickness of the homopolymer having pimelate
units
21
Results point out that crystallization of COPES 979-05 should start by the
arrangement of azelate rich moieties according to the favoured crystallization of PES
99 respect to PES 97 a feature clearly supported by primary nucleation crystal growth
rate and overall crystallization rate data Pimelate units seem to be mainly incorporated
as defects into the interlamellar amorphous region giving rise to the observed increase
in the corresponding spacing In fact and as explained above FTIR spectra revealed
also that crystalline bands associated with PES 99 were predominant in the copolymer
sample
Combined SAXS and WAXD data were used to verify the assignment of la and lc
thicknesses which could not be distinguished from the analysis of the correlation
function [48-51] Thus the ratio between XcWAXD
and XcSAXS
is an estimate of the
volume-filling fraction of the lamellar stacks XS which should be lower than 1 for a
correct assignment For example ratios of 089 096 and 082 were determined for PES
99 PES 97 and COPES 979-05 respectively at the end of crystallization
CONCLUSIONS
Thermal polycondensation using titanium tetrabutoxyde as a catalyst was successfully
used to obtain copolyesters constituted by 19-nonanediol and different ratios of azelaic
and pimelic acid units Final copolymer compositions were always in good agreement
with the feed molar ratio and the attained molecular weights were typical of
polycondensation reactions involving monomers with different functionality
The copolymer with the intermediate composition (ie COPES 979-05) had lowest
melting temperature and melting enthalpy However the crystallinity of this sample was
still high It seemed possible to incorporate comonomer units into the crystalline
structure of each homopolymer
22
Homopolymers and copolymers crystallized according to a spherulitic growth and a
heterogeneous primary nucleation Significant differences were found between the
spherulitic textures (ie fibrilar or ringed) and even on the crystallization kinetics of
PES 97 and PES 99 homopolymers Specifically non-isothermal crystallization from
the melt was less favourable for the PES 97 sample and consequently the COPES
979-05 copolymer started to crystallize by the arrangement of azelate moieties
X-ray diffraction data indicated that crystallization always occurred according to a
lamellar insertion mechanism Significant differences were observed between crystal
lamellar and amorphous layer thicknesses of homopolymers and the copolymer with
intermediate composition Optical microscopy DSC SAXS and FTIR data suggested
that this copolymer crystallized giving rise to lamellar cores with a predominant PES
99 structure and that pimelate units were mainly located on the amorphous
interlamellar regions
Acknowledgements Authors are in debt to supports from MINECO and FEDER
(MAT2012-36205) and the Generalitat de Catalunya (2009SGR1208) Diffraction
experiments were performed at NCD beamline at ALBA Synchrotron with the
collaboration of ALBA staff
23
REFERENCES
[1] Lligadas G Ronda JC Galiagrave M Caacutediz V (2007) Poly(ether urethane) Networks
from Renewable Resources as Candidate Biomaterials Synthesis and
Characterization Biomacromolecules 8686-692
[2] Petrovic ZS (2008) Polyurethanes from Vegetable Oils Polym Rev 48109-155
[3] Hojabri L Kong X Narine SS (2010) Functional Thermoplastics from Linear
Diols and Diisocyanates Produced Entirely from Renewable Lipid Sources
Biomacromolecules 11 911-918
[4] Lligadas G Ronda JC Galiagrave M Caacutediz V (2010) Plant Oils as Platform
Chemicals for Polyurethane Synthesis Current State-of-the-Art
Biomacromolecules 112825-2835
[5] Doi Y Steinbuumlchel A (2002) Polyesters II ndash properties and chemical synthesis
New York Wiley-VCH
[6] Huang SJ (1985) Encyclopedia of polymer science and engineering vol 2 New
York Wiley-Interscience pp 20
[7] Vert M Li S M Spenlehauer G Guerin P (1992) Bioresorbability and
biocompatibility of aliphatic polyesters J Mater Sci Mater Med 3432-446
[8] Edlund E Albertsson AC (1999) Novel Drug Delivery Microspheres from
Poly(15-dioxepan-2-one-co-L-lactide) J Polym Sci Part A Polym Chem
371877-1884
[9] Kulkarni RK Moore EG Hegyeli AF Leonard F (1971) Biodegradable
poly(lactic acid) polymers J Biomed Mater Res 5169-181
[10] Kricheldorf HR Kreiser-Saunders I Juumlrgens C Wolter D (1996) Polylactides -
Synthesis Characterization and Medical Application Macromol Symp 10385-
102
[11] Thombre AG Cardinal JR (1990) Enciclopedia of Pharmaceutical Technology
2 New York Marcel Dekker pp 61
[12] Fujimaki T (1998) Processability and properties of aliphatic polyesters
lsquoBIONOLLErsquo synthesized by polycondensation reaction Polym Degrad Stab
59209-214
[13] Shih Y-F Wu T-M (2009) Enzymatic degradation kinetics of poly(butylene
succinate)nanocomposites J Polym Res 16109-115
24
[14] Lai SM Huang CK Shen HF (2005) Preparation and Properties of
Biodegradable Poly(butylene succinate)Starch Blends J Appl Polym Sci
97257-264
[15] Fuller CS (1939) X-ray investigation of the decamethylene series of polyesters
J Am Chem Soc 612575-2580
[16] Kanamoto T Tanaka K (1971) Growth and morphology of single crystals of
linear aliphatic polyesters J Polym Sci Part A-2 92043-2060
[17] Ueda AS Chatani Y Tadokoro H (1971) Structural Studies of Polyesters IV
Molecular and Crystal Structures of Poly(ethylene succinate) and Poly(ethylene
oxalate) Polym J 2387-397
[18] Aylwin PA Boyd RH (1984) Aliphatic polyesters as models for relaxation
processes in crystalline polymers 1 Characterization Polymer 25323-329
[19] Liau WB Boyd RH (1990) Structure and packing in crystalline aliphatic
polyesters Macromolecules 231531-1539
[20] Brandrup J Immergut H (1989) Polymer Handbook New York Wiley
[21] Almontassir A Gestiacute S Franco L Puiggaliacute J (2004) Molecular Packing of
Polyesters Derived from 14-Butanediol and Even Aliphatic Dicarboxylic Acids
Macromolecules 375300-5309
[22] Gestiacute S Almontassir A Casas MT Puiggaliacute J (2004) Molecular packing and
crystalline morphologies of biodegradable poly(alkylene dicarboxylate)s derived
from 16-hexanediol Polymer 458845-8861
[23] Gestiacute S Almontassir A Casas MT Puiggaliacute J (2006) Crystalline Structure of
Poly(hexamethylene adipate) Study on the Morphology and the Enzymatic
Degradation of Single Crystals Biomacromolecules 7799-808
[24] Gestiacute S Casas MT Puiggaliacute J (2007) Crystalline structure of
poly(hexamethylene succinate) and single crystal degradation studies Polymer
485088-5097
[25] Lu J-S Chen M Lu S-F Chen C-H (2011) Nonisothermal crystallization
kinetics of novel biodegradable poly(butylene succinate-co-2-methyl-13-
propylene succinate)s J Polym Res 181527-1537
[26] Champetier G Monnerie L (1969) Introduction agrave la chimie macromoleacuteculaire
Paris Masson et Cie
[27] Allegra G Bassi IW(1969) Isomorphism in synthetic macromolecular systems
Adv Polym Sci 6549-574
25
[28] Mochizuki M Mukai K Yamada K Ichise N Murase S Iwaya Y (1997)
Structural Effects upon Enzymatic Hydrolysis of Poly(butylene succinate-co-
ethylene succinate)s Macromolecules 307403-7407
[29] George Z Papageorgiou Bikiaris Dimitrios N (2007) Synthesis
Cocrystallization and Enzymatic Degradation of Novel Poly(butylene-co-
propylene succinate) Copolymers Biomacromolecules 82437-2449
[30] Li X Hong Z Sun J Geng Y Huang Y An H et al (2009) Identifying the
Phase Behavior of Biodegradable Poly(hexamethylene succinate-co-
hexamethylene adipate) Copolymers with FTIR J Phys Chem 1132695-2704
[31] Li X Sun J Huang Y Geng Y Wang X Ma Z et al (2008) Inducing New
Crystal Structures through Random Copolymerization of Biodegradable
Aliphatic Polyester Macromolecules 413162-3168
[32] Liang Z Pan P Zhu B Dong T Hua L Inoue Y (2010) Crystalline Phase of
Isomorphic Poly(hexamethylene sebacate-co-hexamethylene adipate)
Copolyester Effects of Comonomer Composition and Crystallization
Temperature Macromolecules 432925-2932
[33] Liang Z Pan P Zhu B Inoue Y (2011) Isomorphic crystallization of aliphatic
copolyesters derived from 16-hexanediol Effect of the chemical structure of
comonomer units on the extent of cocrystallization Polymer 522667-2676
[34] Rueda DR Garciacutea-Gutieacuterrez MC Nogales A Capitaacuten MJ Ezquerra TA
Labrador A Fraga E Beltraacuten D Juanhuix J Herranz JF Bordas J (2006)
Versatile wide angle diffraction setup for simultaneous wide and small angle x-
ray scattering measurements with synchrotron radiation Rev Sci Instrum 77
Art No 033904
[35] Rajkumar G AL-Khayat HA Eakins F Knupp C Squire JM (2007) The
CCP13 FibreFix program suite semi-automated analysis of diffraction patterns
from non-crystalline materials J Appl Crystallogr 40 178ndash184
[36] Herrera R Franco L Rodriacuteguez-Galaacuten A Puiggaliacute J (2002) Characterization
and degradation behavior of poly(butylene adipate-co-terephthalate)s J Polym
Sci Part A Polym Chem 40 4141-4157
[37] Pamula E Blazewicz M Paluszkiewicz P Dobrzynski (2001) FTIR study of
degradation products of aliphatic polyestersndashcarbon fibres composites J Mol
Struct 596 69-75
[38] Avrami M (1939) Kinetics of Phase Change I General Theory J Chem Phys
71103-1120
[39] Avrami M (1940) Kinetics of Phase Change II Transformation‐Time
Relations for Random Distribution of Nuclei J Chem Phys 8212-224
26
[40] Hoffman JD Weeks JJ (1962) Rate of Spherulitic Crystallization with Chain
Folds in Polychlorotrifluoroethylene J Chem Phys 371723-1741
[41] Lauritzen JI Hoffman JD (1973) Extension of theory of growth of chain‐folded
polymer crystals to large undercooling J Appl Phys 444340-4352
[42] Strobl G (2000) From the melt via mesomorphic and granular crystalline layers
to lamellar crystallites A major route followed in polymer crystallization Eur
Phys J E 3165-183
[43] Muthukumar M (2000) Commentary on theories of polymer crystallization
Eur Phys J 3199-202
[44] Williams ML Landel RF Ferry JD (1955) The Temperature Dependence of
Relaxation Mechanisms in Amorphous Polymers and Other Glass-forming
Liquids J Am Chem Soc 773701-3707
[45] Suzuki T Kovacs A (1970) Temperature dependence of spherulitic growth rate
of isotactic polystyrene J Polym J 182-100
[46] Vonk CG Kortleve G (1967) X-ray small-angle scattering of bulk
polyethylene Kolloid Z Z Polym 22019-24
[47] Vonk CG (1975) A general computer program for the processing of small-
angle X-ray scattering data J Appl Cryst 8340-341
[48] Hsiao BS Gardner KH Wu DQ Chu B (1993) Time-resolved X-ray study of
poly(aryl ether ether ketone) crystallization and melting behaviour 1
Crystallization Polymer 343986-3995
[49] Ikada Y Jamshida K Tsuji H Hyoan SH (1987) Maltopentaose- and
maltoheptaose-carrying styrene macromers and their homopolymers
Macromolecules 20906-908
[50] Kruger KN Zachmann HG (1993) Investigation of the melting behavior of
poly(aryl ether ketones) by simultaneous measurements of SAXS and WAXS
employing synchrotron radiation Macromolecules 26 5202-5208
[51] Hsiao BS Wang Z Yeh F Yan G Sheth KC (1999) Time-resolved X-ray
studies of structure development in poly(butylene terephthalate) during
isothermal crystallization Polymer 403515-3523
27
FIGURE CAPTIONS
Figure 1 Synthesis of copoly(alkylene dicarboxylate)s from 19-nonanediol and
pimelic and azelaic acids
Figure 2 Transmitance FTIR spectra (1400-800 cm-1
) of amorphous (red profiles) and
semicrystalline (blue profiles) PES 97 (a) PES 979-050 (b) and PES 99 (c) samples
Boxes highlight characteristic crystalline bands in the spectrum of the copolymer that
can be related to each homopolymer (see arrows) Asterisk points to the splitting of the
1090-1070 cm-1
amorphous band for the PES 97 sample
Figure 3 DSC traces obtained with the COPES 979-050 copolymer during the
heating run (20 ordmCmin) of the as-synthesized sample (a) the cooling run (10 ordmCmin)
after keeping the sample in the melt state for three minutes (b) the heating run (20
ordmCmin) of the hot crystallized sample (c) and the heating run (20 ordmCmin) of a sample
previously cooled at the maximum rate allowed by the equipment from the melt state
(d) The inset shows a magnification where the glass transition is clearly observed
Figure 4 Variation of the melting temperature and enthalpy of poly(nonamethylene
azelate-co-pimelate)s with the molar percentage of azelate units Enthalpies are given as
kJmol considering the molecular weight of the repeat unit determined according to the
copolymer composition
Figure 5 a) Exothermic DSC peaks corresponding to the hot isothermal crystallizations
of COPES 979-050 at temperatures between 54 and 51 ordmC Inset shows the
development of relative crystallinity over time for the indicated isothermal
crystallizations b) Avrami plots corresponding to the isothermal crystallization of
28
COPES 979-050 c) Overall crystallization rates (full symbols and solid lines) and the
reciprocal of the crystallization half-times (empty symbols and dashed lines) determined
at different temperatures for PES 99 () PES 97 (∆) and COPES 979-050 ()
samples
Figure 6 a) DSC heating runs (20 ordmCmin) of COPES 979-050 samples isothermally
crystallized at temperatures ranging from 54 to 51 ordmC b) Hoffman-Weeks plot of
temperatures corresponding to endothermic melting peaks versus crystallization
temperature for several COPES 979-x samples For the sake of clarity experimental
data of some intermediate compositions are described by dashed lines Equilibrium
melting temperatures are explicitly indicated at the corresponding intersection points
Figure 7 Polarized optical micrographs of spherulites of PES 97 (a) COPES 979-
050 (b) and PES 99 (c) crystallized at temperatures of 53 ordmC 51 ordmC and 59 ordmC
respectively For the sake of completeness spherulites of a 50 molar mixture of PES
97 and PES 99 homopolymers and crystallized at 56 ordmC are shown in (d)
Figure 8 a) Plots of COPES 979-050 spherulite radii versus crystallization time for
isothermal hot crystallizations performed at temperatures between 506 and 53 ordmC b)
Temperature dependence of the crystal growth rate for PES 99 PES 97 and COPES
979-050 samples c) Change in the nucleation density of PES 99 PES 97 and
COPES 979-050 samples with isothermal crystallization temperature
Figure 9 Plot of ln G + U
R(Tc-T) versus 1 Tc (T) f to determine the Kg
nucleation parameter of PES 99 PES 97 and COPES 979-050 samples
Figure 10 Time-resolved SAXS (a) and WAXD (b) three-dimensional profiles of PES
97 during non-isothermal hot crystallization at 3 ordmCmin
29
Figure 11 WAXD (a) and SAXS (b) profiles of PES 99 PES 97 and COPES 979-
050 samples taken at room temperature The amorphous halo obtained by
deconvolution is explicitly shown for the copolymer sample
Figure 12 Correlation functions (a) for non-isothermal hot crystallization of PES 99
PES 97 and COPES 979-050 samples b) Temperature evolution of Ldiams lc () and
la () during non-isothermal hot crystallization performed at 3 ordmCmin with PES 99
(dashed lines) PES 97 (solid lines) and COPES 979-050 (dotted lines) samples
30
Table 1 Synthesis data of studied polyesters
Polymer Yield
()
fPa
Mnb
(gmol)
Mwb
(gmol)
PDIbc
PES 97 73 1 7900 19600 247
COPES 979-085 67 086 9400 21900 233
COPES 979-070 76 071 9800 23000 236
COPES 979-050 78 053 13500 32300 240
COPES 979-030 78 032 11700 29900 257
COPES 979-015 65 017 12700 31800 250
PES 99 73 0 13300 35900 270
aPimelate molar fraction determined from
13C NMR spectra
bFrom GPC
cPolydispersity index
31
Table 2 Main crystallization kinetic parameters determined by DSC for the two
homopolymers and the copolymer with the highest comonomer content
Sample T (ordmC) Z 106
(s-n
)
n K 103
(s-1
) 1 τ12 10
3
(s-1
)
(Zln2)1n
103
(s
-1)
PES 97
52 849 239 754 887 879
53 034 266 371 430 426
54 026 247 219 256 255
55 0063 248 127 148 148
56 221 10-03
263 051 058 058
57 855 10-05
288 032 035 035
COPES 979-050
51 815 226 558 659 656
52 299 225 353 415 415
525 013 251 179 209 208
53 0025 251 094 110 109
54 178 10-04
278 031 036 036
PES 99
56 1848 260 1523 1793 175
57 028 294 589 682 667
58 0077 281 292 331 332
59 280 10-03
279 086 097 099
32
FIGURE 1
Diacuteaz et al
33
FIGURE 2
Diacuteaz et al
Tra
ns
mit
tan
ce
(
)
Wavenumber (cm-1
)
838cm-1
a)
Tra
ns
mit
tan
ce
(
)
Wavenumber (cm-1
)
b)
Tra
ns
mit
tan
ce
(
)
Wavenumber (cm-1
)
c)
1242 cm-1
34
FIGURE 3
Diacuteaz et al
0 10 20 30 40 50 60 70 80
015
025
035
045
-80 -60 -40 -20
-501 ordmC
611 ordmC
1122 Jg
605 ordmC
969 Jg
959 Jg
460 ordmC
958 Jg
a)
b)
c)
d)
Temperature (ordmC)
En
do
35
FIGURE 4
Diacuteaz et al
60
62
64
66
68
0 20 40 60 80 100
Azelate Units ()
Melt
ing
Tem
pera
ture (
ordmC)
28
30
32
34
Melt
ing
En
tha
lpy
(k
Jm
ol)
(ordmC
)
(kJ
mo
l)
36
FIGURE 5
Diacuteaz et al
0 20 40 60 80 100 120 140
En
do
ther
m
Time (min)
51 ordmC
52 ordmC
525 ordmC
53 ordmC
54 ordmC
0
20
40
60
80
100
0 20 40 60 80 100
Cry
sta
llin
ity
(
)Time (min)
53 ordmC54 ordmC
51 ordmC52 ordmC
525 ordmC
-1
-08
-06
-04
-02
0
02
04
18 28 38
log
-ln
[1-χ
(t)]
log (t-t0) (s)
51 ordmC
52 ordmC
525 ordmC 53 ordmC
54 ordmC
0
5
10
15
20
0
5
10
15
20
50 52 54 56 58 60
1t
12
1
03
(s-1
)
k
10
3(s
-1)
Temperature (ordmC)
PE979-05
PE97
PE99
b)
c)
a)
COPES 979-05
PES 97
PES 99
37
FIGURE 6
Diacuteaz et al
45
50
55
60
65
70
75
80
85
45 50 55 60 65 70 75 80 85
Temperature (ordmC)
Tem
per
atu
re (
ordmC)
PE 99
PE 979-05PE 97
PE 979-015PE 979-085
Temperature (ordmC)
En
doth
erm
50 55 60 65 70 75
a) COPES 979-05
510 ordmC
520 ordmC
525 ordmC
530 ordmC
540 ordmC
792 ordmC
779 ordmC
750 ordmC
748 ordmC
728 ordmC
b)
(ordmC
)
PE 979-
015
PE 979-
085
COPES 979-085
COPES 979-015
PES 99
COPES 979-05
PES 97
38
FIGURE 7
Diacuteaz et al
50 m
PES 97 a)
50 m
PES 99 c)
50 m
COPES 979-05 b)
50 m
d) PES 97 + PES 99
39
0
20
40
60
80
100
120
140
47 52 57 62
Nu
clei
im
m2
Temperature (ordmC)
PES 97
PES 99
COPES 979-050
0
5
10
15
20
25
30
35
0 20 40 60 80
Time (min)
Sp
heru
lite
Rad
ius
( m
)
T = 53 ordmC
T = 52 ordmC
T = 515 ordmC
T = 51 ordmC
T = 506 ordmC
0
5
10
15
20
25
30
35
40
45 50 55 60
Gro
wth
Rate
(micro
mm
in)
Temperature (ordmC)
PES 99
PES 97
COPES 979-050
(microm
)
a)
b)
c)
FIGURE 8
Diacuteaz et al
40
FIGURE 9
Diacuteaz et al
PES 99
PES 97
COPES 979-050
41
FIGURE 10
Diacuteaz et al
FIGURE 12
Diacuteaz et al
42
0 02 04 06 08
I q
2(a
u)
q (nm-1)
PES 99
PES 97
COPES 979-05
0
200
400
600
800
108 128 148 168 188
I (a
u
)
q (nm-1)
PES 99
PES 97
COPES 979-05
a)
b)
0370 nm
0372 nm
0373 nm
0414-0413 nm
FIGURE 11
Diacuteaz et al
43
FIGURE 12
Diacuteaz et al
0
5
10
15
20
25
22283440465258
Temperature (ordmC)
Sp
acin
g (
nm
)
b) a)
PES 97
COPES 979-050
PES 99
Lγ
Lγ
Lγ
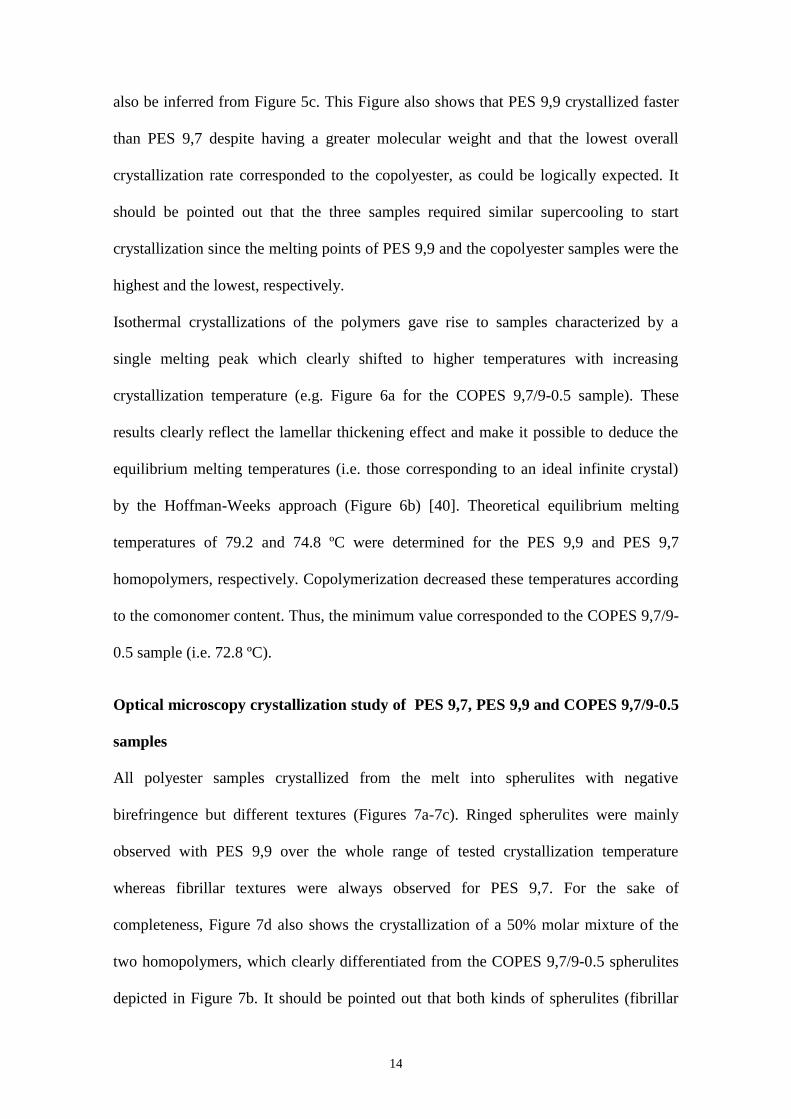

15
and ringed) were observed in the homopolymer mixture as expected for an independent
crystallization of each polymer On the contrary only fibrillar spherulites were observed
for the copolymer sample suggesting that cocrystallization took place as also deduced
from the calorimetric data It is also worth noting that this copolymer like PES 97
required a high degree of supercooling to crystallize
Crystallization from the melt of both homopolymers and the representative COPES
979-05 copolymer was studied by optical microscopy in the range where spherulites
with adequate dimensions formed and which varied from 62 ordmC to 47 ordmC depending on
the sample A larger dimension was obtained at temperatures sufficiently high to have a
low nucleation rate compared with the crystal growth rate This size decreased with the
crystallization temperature the minimum temperature considered for each polymer
being that corresponding to a final spherulite radius close to 10 m
Spherulite radii grew linearly with time up to impingement within the studied
temperature intervals (eg Figure 8a for the copolymer) and allowed the calculation of
the corresponding growth rates G displayed in Figure 8b The maximum G values
measured were clearly different the highest corresponding to PES 99 (ie 35 mmin)
and the lowest corresponding to the copolymer (ie 6 mmin) as could be presumed
Growth data were then analyzed in terms of crystallization regimes by the mathematical
expressions derived from the crystal growth and nucleation model proposed by
Lauritzen and Hoffman [41] It is nevertheless true that the physical meaning of this
model may be questioned on account of the new theories based on experimental
evidences and different theoretical calculations [4243]
The radial growth rate (G) of polymer spherulites was thereby calculated by the
Hoffman and Lauritzen equation [41]
G = G0 exp[-U(R(Tc- T))] exp[-Kg( Tc (T) f)] (4)
16
where G0 is a constant preexponential factor U represents the activation energy
characteristic of the transport of crystallizing segments across the liquid-crystal
interface T is a hypothetical temperature below which such motion ceases Tc is the
crystallization temperature R is the gas constant Kg is the secondary nucleation
parameter T is the degree of supercooling measured as Tm0-Tc and f is a correction
factor accounting for the variation in the bulk melting enthalpy per unit volume with
temperature (f = 2 Tc (Tm0 + Tc))
The sets of parameters most commonly used for U and T are those reported by
Williams-Landel-Ferry [44] (WLF) (U
= 4120 calmol and T = Tg - 516 K) and
Suzuki and Kovacs [45] (U
= 1500 calmol and T = Tg - 30 K) The plot of ln G +
UR(Tc-T) versus 1( Tc (T) f) for the PES 97 PES 99 and COPES 979-05
samples fitted well with a linear regression representative of a single crystallization
regime (Figure 9) when the second parameter set was employed The worst regression
coefficient was r2 09934 and the secondary nucleation parameters derived from the
slopes of the linear plots of PES 97 PES 99 and COPES 979-05 crystallization data
929 104 130 10
5 and 215 10
5 K
2 respectively The highest secondary nucleation
constant corresponded to the copolymer indicating greater difficulty of the lamellar
surface in inducing crystallization of incoming polymer chains Note also that the
crystal growth rate of COPES 979-05 became strongly dependent on the
crystallization temperature as shown in the G versus temperature plot (Figure 9b)
Nucleation constants were similar for the two homopolymers although a slightly lower
value was deduced for PES 97
In addition to the crystal growth rate the overall crystallization of a sample depends on
primary nucleation which may correspond to heterogeneous nuclei or homogeneous
nuclei Primary nucleation is often a rather complex process as it depends on the
17
crystallization temperature density of heterogeneities and presenceabsence of
nucleating agents The number of nuclei slightly increased during crystallization
suggesting a thermal nucleation where all nuclei became progressively active for a
given crystallization temperature A slight degree of heterogeneity in the spherulite size
was therefore observed at the end of the crystallization process Figure 9c shows that the
nucleation density increased with decreasing the crystallization temperature for the three
samples studied and approached a single exponential dependence which resulted in
more active nuclei (ie more favorable thermodynamic conditions for nucleus
generation) with progressively decreasing the temperature The lowest density
corresponding to the copolymer as could be presumed from its lower overall
crystallization rate determined from calorimetric data Note also that the copolymer and
the PES 99 samples had similar molecular weigths (Table 1) and therefore differences
on the crystal growth rate and primary nucleation density cannot be attributed to
molecular weigth changes Only PE 97 had a slightly lower molecular weight that
could justify an increase of both magnitudes Therefore the lower values with respect to
PE99 cannot be a consequence of he lower molecular size of PE 97
Study on the non-isothermal crystallization of PES 97 PES 99 and COPES 979-
05 samples by time-resolved SAXSWAXD experiments
Figure 10 contains time-resolved SAXS and WAXD profiles taken during non-
isothermal hot crystallization at a cooling rate of 3 ordmCmin for a representative polymer
(PES 97 homopolymer) In all cases the SAXS long period peak and crystal
diffractions appear simultaneously as expected for a crystallization process controlled
by nucleation and crystal growth
The SAXS long period peak is clearly seen at a value of the scattering vector q = 2sin
in the 028-039 nm-1
range after subtraction of the empty sample background
18
observed near the beam stop This peak which can be attributed to the lamellar structure
of the spherulites appeared at slightly different q values depending on the polymer
sample and shifted to higher q values (ie lower spacings) during crystallization
showing a more pronounced change in the initial stages
WAXD profiles showed an amorphous halo (q = 203 nm-1
) whose intensity decreased
with crystallization and on which Bragg reflections formed The most intense appeared
at 0414-0413 nm (q = 1518-1521 nm-1
) and 0370 nm (q = 1698 nm-1
) and should
correspond to the (110) (020) reflections of the typical structure of a polyalkylene
dicarboxylate [21-24] The intensity of the indicated reflections increased sharply at the
beginning of crystallization and slowly after a short time interval This second step
corresponds to a secondary crystallization which could also be envisaged from the
asymmetric shape of the DSC crystallization peaks (Figure 5b) WAXD profiles of the
two homopolymers and the COPES 979-05 copolymer are compared in Figure 13a
Note that the spacings observed for both homopolymers are practically identical and
consequently the similar packing arrangement should enable co-crystallization
The degree of crystallinity of the three samples could be estimated from the
corresponding room temperature profiles by considering the intensity of the amorphous
background (IB) and overall intensity (IT)
XcWAX
= (IT-IB ) IT (5)
WAXD measurements indicated that relative crystallinities ranged between 068 and
048 The highest and lowest values corresponded to PES 99 and the copolymer
respectively in agreement with DSC calorimetric data and the random disposition of
dicarboxylic units It should also be pointed out that PES 97 had practically the same
crystalline than PES 99 (ie 068 respect to 067) as can be qualitatively deduced from
the similar amorphous halo observed in the WAXD profile (Figure 11a)
19
SAXS profiles taken at the end of crystallization revealed clear differences between the
lamellar thicknesses of the three samples (Figure 11b) the highest and lowest
corresponding to COPES 997-05 and PES 97 respectively SAXS data were analyzed
in more detail during crystallization considering the normalized one-dimensional
correlation function [46] (r) which corresponds to the Fourier transform of the
Lorentz-corrected SAXS profile
(r) =
0
2 )cos()( dqqrqIq
0
2 )( dqqIq (6)
SAXS data were collected within a limited angular range only That is why
extrapolations to low and high q values were performed using Vonkrsquos model [47]
and
Porodrsquos law respectively
Figure 12a illustrates the correlation functions calculated for the three samples from
SAXS profiles taken at the end of crystallization In general their analysis allowed the
determination of morphologic parameters like (1) long period L (ie r value of the
first maximum of the correlation function) (2) amorphous layer thickness la (ie r
value for the intersection of the linear regression in the autocorrelation triangle with the
ordinate equal to the first minimum of the correlation function) and (3) crystalline
lamellar thickness lc (calculated as Lla)
The Lvalues were in all cases close to the long periods determined from twice the
value of the first minimum of the correlation function Thusthe most probable distance
between the centers of gravity of two adjacent crystals appeared to be equal to twice the
most probable distance between the centers of gravity of a crystal and its adjacent
amorphous layer This suggests a narrow distribution of the layer widths of the major
component which in this case corresponds to the crystal phase
20
Data obtained during the non-isothermal hot crystallization revealed a significant
decrease of L long spacings at the beginning of the process (ie during primary
crystallization) although a continuous decrease could still be observed during the
secondary crystallization (Figure 12b) These last changes were mainly due to the
decrease in the crystalline lamellar thickness which suggests the occurrence of a
lamellar insertion mechanism throughout the crystallization process of the three samples
(ie formation of thinner lamellar crystals between loosely stacked primary lamellae)
Note that the amorphous layer thickness remained practically constant during
crystallization
Figure 12b clearly shows that PES 99 had the highest and lowest lc and la values
respectively (ie 117 and 425 nm) Hence the highest crystallinity within the lamellar
stacks XcSAXS
(calculated as lc L) was determined for PES 99 (ie 074) Crystallinity
was clearly lower for PES 97 (ie 060) showing a similar trend to that observed from
WAXD crystallinities Both homopolymers have a similar lamellar thickness but clear
differences exist between the crystalline lamellar (ie from 117 to 936 nm) and
amorphous layer (ie from 425 to 624 nm) thicknesses It seems therefore that
irregular molecular folds on the lamellar surface should involve larger segments when
the polymer is constituted by the slightly more rigid pimelate units
The greatest amorphous layer thickness (ie 717 nm) was observed for the copolymer
indicating that chain defects caused by the presence of comonomer units could be
placed in the amorphous interlamellar regions XcSAXS
was minimum for the copolymer
(ie 059) although this crystallinity was very similar to that calculated for PES 97
due to the lower crystalline lamellar thickness of the homopolymer having pimelate
units
21
Results point out that crystallization of COPES 979-05 should start by the
arrangement of azelate rich moieties according to the favoured crystallization of PES
99 respect to PES 97 a feature clearly supported by primary nucleation crystal growth
rate and overall crystallization rate data Pimelate units seem to be mainly incorporated
as defects into the interlamellar amorphous region giving rise to the observed increase
in the corresponding spacing In fact and as explained above FTIR spectra revealed
also that crystalline bands associated with PES 99 were predominant in the copolymer
sample
Combined SAXS and WAXD data were used to verify the assignment of la and lc
thicknesses which could not be distinguished from the analysis of the correlation
function [48-51] Thus the ratio between XcWAXD
and XcSAXS
is an estimate of the
volume-filling fraction of the lamellar stacks XS which should be lower than 1 for a
correct assignment For example ratios of 089 096 and 082 were determined for PES
99 PES 97 and COPES 979-05 respectively at the end of crystallization
CONCLUSIONS
Thermal polycondensation using titanium tetrabutoxyde as a catalyst was successfully
used to obtain copolyesters constituted by 19-nonanediol and different ratios of azelaic
and pimelic acid units Final copolymer compositions were always in good agreement
with the feed molar ratio and the attained molecular weights were typical of
polycondensation reactions involving monomers with different functionality
The copolymer with the intermediate composition (ie COPES 979-05) had lowest
melting temperature and melting enthalpy However the crystallinity of this sample was
still high It seemed possible to incorporate comonomer units into the crystalline
structure of each homopolymer
22
Homopolymers and copolymers crystallized according to a spherulitic growth and a
heterogeneous primary nucleation Significant differences were found between the
spherulitic textures (ie fibrilar or ringed) and even on the crystallization kinetics of
PES 97 and PES 99 homopolymers Specifically non-isothermal crystallization from
the melt was less favourable for the PES 97 sample and consequently the COPES
979-05 copolymer started to crystallize by the arrangement of azelate moieties
X-ray diffraction data indicated that crystallization always occurred according to a
lamellar insertion mechanism Significant differences were observed between crystal
lamellar and amorphous layer thicknesses of homopolymers and the copolymer with
intermediate composition Optical microscopy DSC SAXS and FTIR data suggested
that this copolymer crystallized giving rise to lamellar cores with a predominant PES
99 structure and that pimelate units were mainly located on the amorphous
interlamellar regions
Acknowledgements Authors are in debt to supports from MINECO and FEDER
(MAT2012-36205) and the Generalitat de Catalunya (2009SGR1208) Diffraction
experiments were performed at NCD beamline at ALBA Synchrotron with the
collaboration of ALBA staff
23
REFERENCES
[1] Lligadas G Ronda JC Galiagrave M Caacutediz V (2007) Poly(ether urethane) Networks
from Renewable Resources as Candidate Biomaterials Synthesis and
Characterization Biomacromolecules 8686-692
[2] Petrovic ZS (2008) Polyurethanes from Vegetable Oils Polym Rev 48109-155
[3] Hojabri L Kong X Narine SS (2010) Functional Thermoplastics from Linear
Diols and Diisocyanates Produced Entirely from Renewable Lipid Sources
Biomacromolecules 11 911-918
[4] Lligadas G Ronda JC Galiagrave M Caacutediz V (2010) Plant Oils as Platform
Chemicals for Polyurethane Synthesis Current State-of-the-Art
Biomacromolecules 112825-2835
[5] Doi Y Steinbuumlchel A (2002) Polyesters II ndash properties and chemical synthesis
New York Wiley-VCH
[6] Huang SJ (1985) Encyclopedia of polymer science and engineering vol 2 New
York Wiley-Interscience pp 20
[7] Vert M Li S M Spenlehauer G Guerin P (1992) Bioresorbability and
biocompatibility of aliphatic polyesters J Mater Sci Mater Med 3432-446
[8] Edlund E Albertsson AC (1999) Novel Drug Delivery Microspheres from
Poly(15-dioxepan-2-one-co-L-lactide) J Polym Sci Part A Polym Chem
371877-1884
[9] Kulkarni RK Moore EG Hegyeli AF Leonard F (1971) Biodegradable
poly(lactic acid) polymers J Biomed Mater Res 5169-181
[10] Kricheldorf HR Kreiser-Saunders I Juumlrgens C Wolter D (1996) Polylactides -
Synthesis Characterization and Medical Application Macromol Symp 10385-
102
[11] Thombre AG Cardinal JR (1990) Enciclopedia of Pharmaceutical Technology
2 New York Marcel Dekker pp 61
[12] Fujimaki T (1998) Processability and properties of aliphatic polyesters
lsquoBIONOLLErsquo synthesized by polycondensation reaction Polym Degrad Stab
59209-214
[13] Shih Y-F Wu T-M (2009) Enzymatic degradation kinetics of poly(butylene
succinate)nanocomposites J Polym Res 16109-115
24
[14] Lai SM Huang CK Shen HF (2005) Preparation and Properties of
Biodegradable Poly(butylene succinate)Starch Blends J Appl Polym Sci
97257-264
[15] Fuller CS (1939) X-ray investigation of the decamethylene series of polyesters
J Am Chem Soc 612575-2580
[16] Kanamoto T Tanaka K (1971) Growth and morphology of single crystals of
linear aliphatic polyesters J Polym Sci Part A-2 92043-2060
[17] Ueda AS Chatani Y Tadokoro H (1971) Structural Studies of Polyesters IV
Molecular and Crystal Structures of Poly(ethylene succinate) and Poly(ethylene
oxalate) Polym J 2387-397
[18] Aylwin PA Boyd RH (1984) Aliphatic polyesters as models for relaxation
processes in crystalline polymers 1 Characterization Polymer 25323-329
[19] Liau WB Boyd RH (1990) Structure and packing in crystalline aliphatic
polyesters Macromolecules 231531-1539
[20] Brandrup J Immergut H (1989) Polymer Handbook New York Wiley
[21] Almontassir A Gestiacute S Franco L Puiggaliacute J (2004) Molecular Packing of
Polyesters Derived from 14-Butanediol and Even Aliphatic Dicarboxylic Acids
Macromolecules 375300-5309
[22] Gestiacute S Almontassir A Casas MT Puiggaliacute J (2004) Molecular packing and
crystalline morphologies of biodegradable poly(alkylene dicarboxylate)s derived
from 16-hexanediol Polymer 458845-8861
[23] Gestiacute S Almontassir A Casas MT Puiggaliacute J (2006) Crystalline Structure of
Poly(hexamethylene adipate) Study on the Morphology and the Enzymatic
Degradation of Single Crystals Biomacromolecules 7799-808
[24] Gestiacute S Casas MT Puiggaliacute J (2007) Crystalline structure of
poly(hexamethylene succinate) and single crystal degradation studies Polymer
485088-5097
[25] Lu J-S Chen M Lu S-F Chen C-H (2011) Nonisothermal crystallization
kinetics of novel biodegradable poly(butylene succinate-co-2-methyl-13-
propylene succinate)s J Polym Res 181527-1537
[26] Champetier G Monnerie L (1969) Introduction agrave la chimie macromoleacuteculaire
Paris Masson et Cie
[27] Allegra G Bassi IW(1969) Isomorphism in synthetic macromolecular systems
Adv Polym Sci 6549-574
25
[28] Mochizuki M Mukai K Yamada K Ichise N Murase S Iwaya Y (1997)
Structural Effects upon Enzymatic Hydrolysis of Poly(butylene succinate-co-
ethylene succinate)s Macromolecules 307403-7407
[29] George Z Papageorgiou Bikiaris Dimitrios N (2007) Synthesis
Cocrystallization and Enzymatic Degradation of Novel Poly(butylene-co-
propylene succinate) Copolymers Biomacromolecules 82437-2449
[30] Li X Hong Z Sun J Geng Y Huang Y An H et al (2009) Identifying the
Phase Behavior of Biodegradable Poly(hexamethylene succinate-co-
hexamethylene adipate) Copolymers with FTIR J Phys Chem 1132695-2704
[31] Li X Sun J Huang Y Geng Y Wang X Ma Z et al (2008) Inducing New
Crystal Structures through Random Copolymerization of Biodegradable
Aliphatic Polyester Macromolecules 413162-3168
[32] Liang Z Pan P Zhu B Dong T Hua L Inoue Y (2010) Crystalline Phase of
Isomorphic Poly(hexamethylene sebacate-co-hexamethylene adipate)
Copolyester Effects of Comonomer Composition and Crystallization
Temperature Macromolecules 432925-2932
[33] Liang Z Pan P Zhu B Inoue Y (2011) Isomorphic crystallization of aliphatic
copolyesters derived from 16-hexanediol Effect of the chemical structure of
comonomer units on the extent of cocrystallization Polymer 522667-2676
[34] Rueda DR Garciacutea-Gutieacuterrez MC Nogales A Capitaacuten MJ Ezquerra TA
Labrador A Fraga E Beltraacuten D Juanhuix J Herranz JF Bordas J (2006)
Versatile wide angle diffraction setup for simultaneous wide and small angle x-
ray scattering measurements with synchrotron radiation Rev Sci Instrum 77
Art No 033904
[35] Rajkumar G AL-Khayat HA Eakins F Knupp C Squire JM (2007) The
CCP13 FibreFix program suite semi-automated analysis of diffraction patterns
from non-crystalline materials J Appl Crystallogr 40 178ndash184
[36] Herrera R Franco L Rodriacuteguez-Galaacuten A Puiggaliacute J (2002) Characterization
and degradation behavior of poly(butylene adipate-co-terephthalate)s J Polym
Sci Part A Polym Chem 40 4141-4157
[37] Pamula E Blazewicz M Paluszkiewicz P Dobrzynski (2001) FTIR study of
degradation products of aliphatic polyestersndashcarbon fibres composites J Mol
Struct 596 69-75
[38] Avrami M (1939) Kinetics of Phase Change I General Theory J Chem Phys
71103-1120
[39] Avrami M (1940) Kinetics of Phase Change II Transformation‐Time
Relations for Random Distribution of Nuclei J Chem Phys 8212-224
26
[40] Hoffman JD Weeks JJ (1962) Rate of Spherulitic Crystallization with Chain
Folds in Polychlorotrifluoroethylene J Chem Phys 371723-1741
[41] Lauritzen JI Hoffman JD (1973) Extension of theory of growth of chain‐folded
polymer crystals to large undercooling J Appl Phys 444340-4352
[42] Strobl G (2000) From the melt via mesomorphic and granular crystalline layers
to lamellar crystallites A major route followed in polymer crystallization Eur
Phys J E 3165-183
[43] Muthukumar M (2000) Commentary on theories of polymer crystallization
Eur Phys J 3199-202
[44] Williams ML Landel RF Ferry JD (1955) The Temperature Dependence of
Relaxation Mechanisms in Amorphous Polymers and Other Glass-forming
Liquids J Am Chem Soc 773701-3707
[45] Suzuki T Kovacs A (1970) Temperature dependence of spherulitic growth rate
of isotactic polystyrene J Polym J 182-100
[46] Vonk CG Kortleve G (1967) X-ray small-angle scattering of bulk
polyethylene Kolloid Z Z Polym 22019-24
[47] Vonk CG (1975) A general computer program for the processing of small-
angle X-ray scattering data J Appl Cryst 8340-341
[48] Hsiao BS Gardner KH Wu DQ Chu B (1993) Time-resolved X-ray study of
poly(aryl ether ether ketone) crystallization and melting behaviour 1
Crystallization Polymer 343986-3995
[49] Ikada Y Jamshida K Tsuji H Hyoan SH (1987) Maltopentaose- and
maltoheptaose-carrying styrene macromers and their homopolymers
Macromolecules 20906-908
[50] Kruger KN Zachmann HG (1993) Investigation of the melting behavior of
poly(aryl ether ketones) by simultaneous measurements of SAXS and WAXS
employing synchrotron radiation Macromolecules 26 5202-5208
[51] Hsiao BS Wang Z Yeh F Yan G Sheth KC (1999) Time-resolved X-ray
studies of structure development in poly(butylene terephthalate) during
isothermal crystallization Polymer 403515-3523
27
FIGURE CAPTIONS
Figure 1 Synthesis of copoly(alkylene dicarboxylate)s from 19-nonanediol and
pimelic and azelaic acids
Figure 2 Transmitance FTIR spectra (1400-800 cm-1
) of amorphous (red profiles) and
semicrystalline (blue profiles) PES 97 (a) PES 979-050 (b) and PES 99 (c) samples
Boxes highlight characteristic crystalline bands in the spectrum of the copolymer that
can be related to each homopolymer (see arrows) Asterisk points to the splitting of the
1090-1070 cm-1
amorphous band for the PES 97 sample
Figure 3 DSC traces obtained with the COPES 979-050 copolymer during the
heating run (20 ordmCmin) of the as-synthesized sample (a) the cooling run (10 ordmCmin)
after keeping the sample in the melt state for three minutes (b) the heating run (20
ordmCmin) of the hot crystallized sample (c) and the heating run (20 ordmCmin) of a sample
previously cooled at the maximum rate allowed by the equipment from the melt state
(d) The inset shows a magnification where the glass transition is clearly observed
Figure 4 Variation of the melting temperature and enthalpy of poly(nonamethylene
azelate-co-pimelate)s with the molar percentage of azelate units Enthalpies are given as
kJmol considering the molecular weight of the repeat unit determined according to the
copolymer composition
Figure 5 a) Exothermic DSC peaks corresponding to the hot isothermal crystallizations
of COPES 979-050 at temperatures between 54 and 51 ordmC Inset shows the
development of relative crystallinity over time for the indicated isothermal
crystallizations b) Avrami plots corresponding to the isothermal crystallization of
28
COPES 979-050 c) Overall crystallization rates (full symbols and solid lines) and the
reciprocal of the crystallization half-times (empty symbols and dashed lines) determined
at different temperatures for PES 99 () PES 97 (∆) and COPES 979-050 ()
samples
Figure 6 a) DSC heating runs (20 ordmCmin) of COPES 979-050 samples isothermally
crystallized at temperatures ranging from 54 to 51 ordmC b) Hoffman-Weeks plot of
temperatures corresponding to endothermic melting peaks versus crystallization
temperature for several COPES 979-x samples For the sake of clarity experimental
data of some intermediate compositions are described by dashed lines Equilibrium
melting temperatures are explicitly indicated at the corresponding intersection points
Figure 7 Polarized optical micrographs of spherulites of PES 97 (a) COPES 979-
050 (b) and PES 99 (c) crystallized at temperatures of 53 ordmC 51 ordmC and 59 ordmC
respectively For the sake of completeness spherulites of a 50 molar mixture of PES
97 and PES 99 homopolymers and crystallized at 56 ordmC are shown in (d)
Figure 8 a) Plots of COPES 979-050 spherulite radii versus crystallization time for
isothermal hot crystallizations performed at temperatures between 506 and 53 ordmC b)
Temperature dependence of the crystal growth rate for PES 99 PES 97 and COPES
979-050 samples c) Change in the nucleation density of PES 99 PES 97 and
COPES 979-050 samples with isothermal crystallization temperature
Figure 9 Plot of ln G + U
R(Tc-T) versus 1 Tc (T) f to determine the Kg
nucleation parameter of PES 99 PES 97 and COPES 979-050 samples
Figure 10 Time-resolved SAXS (a) and WAXD (b) three-dimensional profiles of PES
97 during non-isothermal hot crystallization at 3 ordmCmin
29
Figure 11 WAXD (a) and SAXS (b) profiles of PES 99 PES 97 and COPES 979-
050 samples taken at room temperature The amorphous halo obtained by
deconvolution is explicitly shown for the copolymer sample
Figure 12 Correlation functions (a) for non-isothermal hot crystallization of PES 99
PES 97 and COPES 979-050 samples b) Temperature evolution of Ldiams lc () and
la () during non-isothermal hot crystallization performed at 3 ordmCmin with PES 99
(dashed lines) PES 97 (solid lines) and COPES 979-050 (dotted lines) samples
30
Table 1 Synthesis data of studied polyesters
Polymer Yield
()
fPa
Mnb
(gmol)
Mwb
(gmol)
PDIbc
PES 97 73 1 7900 19600 247
COPES 979-085 67 086 9400 21900 233
COPES 979-070 76 071 9800 23000 236
COPES 979-050 78 053 13500 32300 240
COPES 979-030 78 032 11700 29900 257
COPES 979-015 65 017 12700 31800 250
PES 99 73 0 13300 35900 270
aPimelate molar fraction determined from
13C NMR spectra
bFrom GPC
cPolydispersity index
31
Table 2 Main crystallization kinetic parameters determined by DSC for the two
homopolymers and the copolymer with the highest comonomer content
Sample T (ordmC) Z 106
(s-n
)
n K 103
(s-1
) 1 τ12 10
3
(s-1
)
(Zln2)1n
103
(s
-1)
PES 97
52 849 239 754 887 879
53 034 266 371 430 426
54 026 247 219 256 255
55 0063 248 127 148 148
56 221 10-03
263 051 058 058
57 855 10-05
288 032 035 035
COPES 979-050
51 815 226 558 659 656
52 299 225 353 415 415
525 013 251 179 209 208
53 0025 251 094 110 109
54 178 10-04
278 031 036 036
PES 99
56 1848 260 1523 1793 175
57 028 294 589 682 667
58 0077 281 292 331 332
59 280 10-03
279 086 097 099
32
FIGURE 1
Diacuteaz et al
33
FIGURE 2
Diacuteaz et al
Tra
ns
mit
tan
ce
(
)
Wavenumber (cm-1
)
838cm-1
a)
Tra
ns
mit
tan
ce
(
)
Wavenumber (cm-1
)
b)
Tra
ns
mit
tan
ce
(
)
Wavenumber (cm-1
)
c)
1242 cm-1
34
FIGURE 3
Diacuteaz et al
0 10 20 30 40 50 60 70 80
015
025
035
045
-80 -60 -40 -20
-501 ordmC
611 ordmC
1122 Jg
605 ordmC
969 Jg
959 Jg
460 ordmC
958 Jg
a)
b)
c)
d)
Temperature (ordmC)
En
do
35
FIGURE 4
Diacuteaz et al
60
62
64
66
68
0 20 40 60 80 100
Azelate Units ()
Melt
ing
Tem
pera
ture (
ordmC)
28
30
32
34
Melt
ing
En
tha
lpy
(k
Jm
ol)
(ordmC
)
(kJ
mo
l)
36
FIGURE 5
Diacuteaz et al
0 20 40 60 80 100 120 140
En
do
ther
m
Time (min)
51 ordmC
52 ordmC
525 ordmC
53 ordmC
54 ordmC
0
20
40
60
80
100
0 20 40 60 80 100
Cry
sta
llin
ity
(
)Time (min)
53 ordmC54 ordmC
51 ordmC52 ordmC
525 ordmC
-1
-08
-06
-04
-02
0
02
04
18 28 38
log
-ln
[1-χ
(t)]
log (t-t0) (s)
51 ordmC
52 ordmC
525 ordmC 53 ordmC
54 ordmC
0
5
10
15
20
0
5
10
15
20
50 52 54 56 58 60
1t
12
1
03
(s-1
)
k
10
3(s
-1)
Temperature (ordmC)
PE979-05
PE97
PE99
b)
c)
a)
COPES 979-05
PES 97
PES 99
37
FIGURE 6
Diacuteaz et al
45
50
55
60
65
70
75
80
85
45 50 55 60 65 70 75 80 85
Temperature (ordmC)
Tem
per
atu
re (
ordmC)
PE 99
PE 979-05PE 97
PE 979-015PE 979-085
Temperature (ordmC)
En
doth
erm
50 55 60 65 70 75
a) COPES 979-05
510 ordmC
520 ordmC
525 ordmC
530 ordmC
540 ordmC
792 ordmC
779 ordmC
750 ordmC
748 ordmC
728 ordmC
b)
(ordmC
)
PE 979-
015
PE 979-
085
COPES 979-085
COPES 979-015
PES 99
COPES 979-05
PES 97
38
FIGURE 7
Diacuteaz et al
50 m
PES 97 a)
50 m
PES 99 c)
50 m
COPES 979-05 b)
50 m
d) PES 97 + PES 99
39
0
20
40
60
80
100
120
140
47 52 57 62
Nu
clei
im
m2
Temperature (ordmC)
PES 97
PES 99
COPES 979-050
0
5
10
15
20
25
30
35
0 20 40 60 80
Time (min)
Sp
heru
lite
Rad
ius
( m
)
T = 53 ordmC
T = 52 ordmC
T = 515 ordmC
T = 51 ordmC
T = 506 ordmC
0
5
10
15
20
25
30
35
40
45 50 55 60
Gro
wth
Rate
(micro
mm
in)
Temperature (ordmC)
PES 99
PES 97
COPES 979-050
(microm
)
a)
b)
c)
FIGURE 8
Diacuteaz et al
40
FIGURE 9
Diacuteaz et al
PES 99
PES 97
COPES 979-050
41
FIGURE 10
Diacuteaz et al
FIGURE 12
Diacuteaz et al
42
0 02 04 06 08
I q
2(a
u)
q (nm-1)
PES 99
PES 97
COPES 979-05
0
200
400
600
800
108 128 148 168 188
I (a
u
)
q (nm-1)
PES 99
PES 97
COPES 979-05
a)
b)
0370 nm
0372 nm
0373 nm
0414-0413 nm
FIGURE 11
Diacuteaz et al
43
FIGURE 12
Diacuteaz et al
0
5
10
15
20
25
22283440465258
Temperature (ordmC)
Sp
acin
g (
nm
)
b) a)
PES 97
COPES 979-050
PES 99
Lγ
Lγ
Lγ
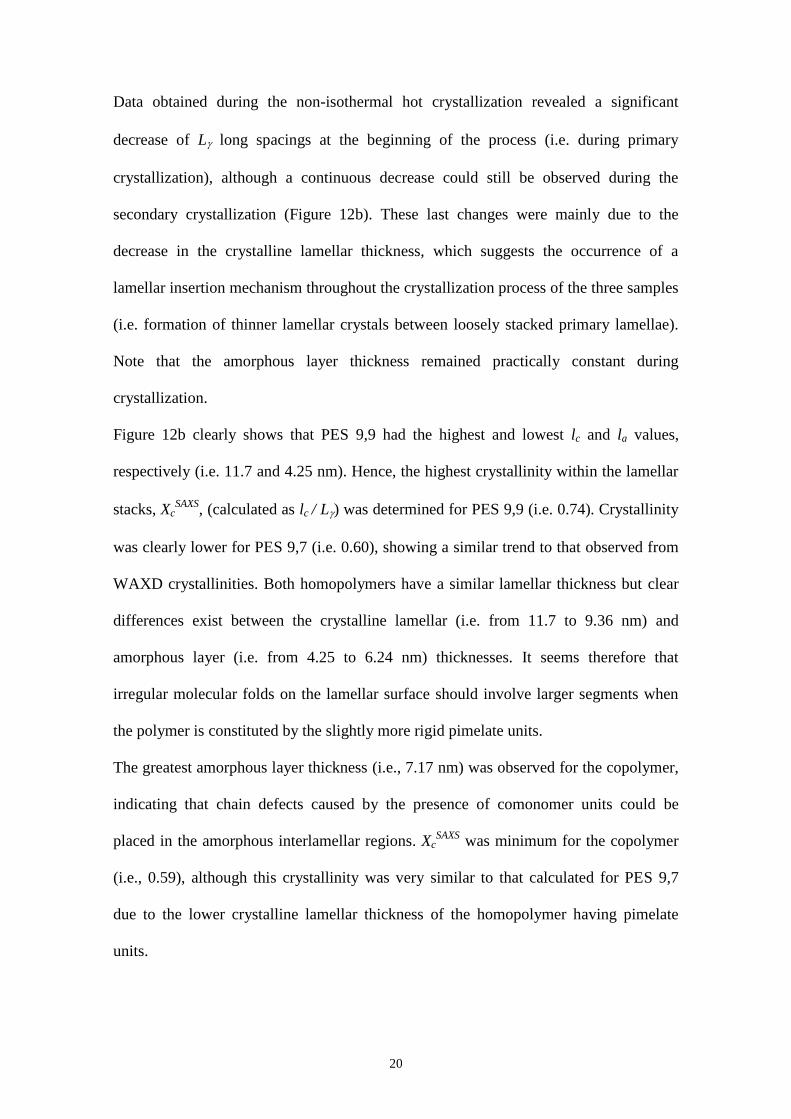
20
Data obtained during the non-isothermal hot crystallization revealed a significant
decrease of L long spacings at the beginning of the process (ie during primary
crystallization) although a continuous decrease could still be observed during the
secondary crystallization (Figure 12b) These last changes were mainly due to the
decrease in the crystalline lamellar thickness which suggests the occurrence of a
lamellar insertion mechanism throughout the crystallization process of the three samples
(ie formation of thinner lamellar crystals between loosely stacked primary lamellae)
Note that the amorphous layer thickness remained practically constant during
crystallization
Figure 12b clearly shows that PES 99 had the highest and lowest lc and la values
respectively (ie 117 and 425 nm) Hence the highest crystallinity within the lamellar
stacks XcSAXS
(calculated as lc L) was determined for PES 99 (ie 074) Crystallinity
was clearly lower for PES 97 (ie 060) showing a similar trend to that observed from
WAXD crystallinities Both homopolymers have a similar lamellar thickness but clear
differences exist between the crystalline lamellar (ie from 117 to 936 nm) and
amorphous layer (ie from 425 to 624 nm) thicknesses It seems therefore that
irregular molecular folds on the lamellar surface should involve larger segments when
the polymer is constituted by the slightly more rigid pimelate units
The greatest amorphous layer thickness (ie 717 nm) was observed for the copolymer
indicating that chain defects caused by the presence of comonomer units could be
placed in the amorphous interlamellar regions XcSAXS
was minimum for the copolymer
(ie 059) although this crystallinity was very similar to that calculated for PES 97
due to the lower crystalline lamellar thickness of the homopolymer having pimelate
units
21
Results point out that crystallization of COPES 979-05 should start by the
arrangement of azelate rich moieties according to the favoured crystallization of PES
99 respect to PES 97 a feature clearly supported by primary nucleation crystal growth
rate and overall crystallization rate data Pimelate units seem to be mainly incorporated
as defects into the interlamellar amorphous region giving rise to the observed increase
in the corresponding spacing In fact and as explained above FTIR spectra revealed
also that crystalline bands associated with PES 99 were predominant in the copolymer
sample
Combined SAXS and WAXD data were used to verify the assignment of la and lc
thicknesses which could not be distinguished from the analysis of the correlation
function [48-51] Thus the ratio between XcWAXD
and XcSAXS
is an estimate of the
volume-filling fraction of the lamellar stacks XS which should be lower than 1 for a
correct assignment For example ratios of 089 096 and 082 were determined for PES
99 PES 97 and COPES 979-05 respectively at the end of crystallization
CONCLUSIONS
Thermal polycondensation using titanium tetrabutoxyde as a catalyst was successfully
used to obtain copolyesters constituted by 19-nonanediol and different ratios of azelaic
and pimelic acid units Final copolymer compositions were always in good agreement
with the feed molar ratio and the attained molecular weights were typical of
polycondensation reactions involving monomers with different functionality
The copolymer with the intermediate composition (ie COPES 979-05) had lowest
melting temperature and melting enthalpy However the crystallinity of this sample was
still high It seemed possible to incorporate comonomer units into the crystalline
structure of each homopolymer
22
Homopolymers and copolymers crystallized according to a spherulitic growth and a
heterogeneous primary nucleation Significant differences were found between the
spherulitic textures (ie fibrilar or ringed) and even on the crystallization kinetics of
PES 97 and PES 99 homopolymers Specifically non-isothermal crystallization from
the melt was less favourable for the PES 97 sample and consequently the COPES
979-05 copolymer started to crystallize by the arrangement of azelate moieties
X-ray diffraction data indicated that crystallization always occurred according to a
lamellar insertion mechanism Significant differences were observed between crystal
lamellar and amorphous layer thicknesses of homopolymers and the copolymer with
intermediate composition Optical microscopy DSC SAXS and FTIR data suggested
that this copolymer crystallized giving rise to lamellar cores with a predominant PES
99 structure and that pimelate units were mainly located on the amorphous
interlamellar regions
Acknowledgements Authors are in debt to supports from MINECO and FEDER
(MAT2012-36205) and the Generalitat de Catalunya (2009SGR1208) Diffraction
experiments were performed at NCD beamline at ALBA Synchrotron with the
collaboration of ALBA staff
23
REFERENCES
[1] Lligadas G Ronda JC Galiagrave M Caacutediz V (2007) Poly(ether urethane) Networks
from Renewable Resources as Candidate Biomaterials Synthesis and
Characterization Biomacromolecules 8686-692
[2] Petrovic ZS (2008) Polyurethanes from Vegetable Oils Polym Rev 48109-155
[3] Hojabri L Kong X Narine SS (2010) Functional Thermoplastics from Linear
Diols and Diisocyanates Produced Entirely from Renewable Lipid Sources
Biomacromolecules 11 911-918
[4] Lligadas G Ronda JC Galiagrave M Caacutediz V (2010) Plant Oils as Platform
Chemicals for Polyurethane Synthesis Current State-of-the-Art
Biomacromolecules 112825-2835
[5] Doi Y Steinbuumlchel A (2002) Polyesters II ndash properties and chemical synthesis
New York Wiley-VCH
[6] Huang SJ (1985) Encyclopedia of polymer science and engineering vol 2 New
York Wiley-Interscience pp 20
[7] Vert M Li S M Spenlehauer G Guerin P (1992) Bioresorbability and
biocompatibility of aliphatic polyesters J Mater Sci Mater Med 3432-446
[8] Edlund E Albertsson AC (1999) Novel Drug Delivery Microspheres from
Poly(15-dioxepan-2-one-co-L-lactide) J Polym Sci Part A Polym Chem
371877-1884
[9] Kulkarni RK Moore EG Hegyeli AF Leonard F (1971) Biodegradable
poly(lactic acid) polymers J Biomed Mater Res 5169-181
[10] Kricheldorf HR Kreiser-Saunders I Juumlrgens C Wolter D (1996) Polylactides -
Synthesis Characterization and Medical Application Macromol Symp 10385-
102
[11] Thombre AG Cardinal JR (1990) Enciclopedia of Pharmaceutical Technology
2 New York Marcel Dekker pp 61
[12] Fujimaki T (1998) Processability and properties of aliphatic polyesters
lsquoBIONOLLErsquo synthesized by polycondensation reaction Polym Degrad Stab
59209-214
[13] Shih Y-F Wu T-M (2009) Enzymatic degradation kinetics of poly(butylene
succinate)nanocomposites J Polym Res 16109-115
24
[14] Lai SM Huang CK Shen HF (2005) Preparation and Properties of
Biodegradable Poly(butylene succinate)Starch Blends J Appl Polym Sci
97257-264
[15] Fuller CS (1939) X-ray investigation of the decamethylene series of polyesters
J Am Chem Soc 612575-2580
[16] Kanamoto T Tanaka K (1971) Growth and morphology of single crystals of
linear aliphatic polyesters J Polym Sci Part A-2 92043-2060
[17] Ueda AS Chatani Y Tadokoro H (1971) Structural Studies of Polyesters IV
Molecular and Crystal Structures of Poly(ethylene succinate) and Poly(ethylene
oxalate) Polym J 2387-397
[18] Aylwin PA Boyd RH (1984) Aliphatic polyesters as models for relaxation
processes in crystalline polymers 1 Characterization Polymer 25323-329
[19] Liau WB Boyd RH (1990) Structure and packing in crystalline aliphatic
polyesters Macromolecules 231531-1539
[20] Brandrup J Immergut H (1989) Polymer Handbook New York Wiley
[21] Almontassir A Gestiacute S Franco L Puiggaliacute J (2004) Molecular Packing of
Polyesters Derived from 14-Butanediol and Even Aliphatic Dicarboxylic Acids
Macromolecules 375300-5309
[22] Gestiacute S Almontassir A Casas MT Puiggaliacute J (2004) Molecular packing and
crystalline morphologies of biodegradable poly(alkylene dicarboxylate)s derived
from 16-hexanediol Polymer 458845-8861
[23] Gestiacute S Almontassir A Casas MT Puiggaliacute J (2006) Crystalline Structure of
Poly(hexamethylene adipate) Study on the Morphology and the Enzymatic
Degradation of Single Crystals Biomacromolecules 7799-808
[24] Gestiacute S Casas MT Puiggaliacute J (2007) Crystalline structure of
poly(hexamethylene succinate) and single crystal degradation studies Polymer
485088-5097
[25] Lu J-S Chen M Lu S-F Chen C-H (2011) Nonisothermal crystallization
kinetics of novel biodegradable poly(butylene succinate-co-2-methyl-13-
propylene succinate)s J Polym Res 181527-1537
[26] Champetier G Monnerie L (1969) Introduction agrave la chimie macromoleacuteculaire
Paris Masson et Cie
[27] Allegra G Bassi IW(1969) Isomorphism in synthetic macromolecular systems
Adv Polym Sci 6549-574
25
[28] Mochizuki M Mukai K Yamada K Ichise N Murase S Iwaya Y (1997)
Structural Effects upon Enzymatic Hydrolysis of Poly(butylene succinate-co-
ethylene succinate)s Macromolecules 307403-7407
[29] George Z Papageorgiou Bikiaris Dimitrios N (2007) Synthesis
Cocrystallization and Enzymatic Degradation of Novel Poly(butylene-co-
propylene succinate) Copolymers Biomacromolecules 82437-2449
[30] Li X Hong Z Sun J Geng Y Huang Y An H et al (2009) Identifying the
Phase Behavior of Biodegradable Poly(hexamethylene succinate-co-
hexamethylene adipate) Copolymers with FTIR J Phys Chem 1132695-2704
[31] Li X Sun J Huang Y Geng Y Wang X Ma Z et al (2008) Inducing New
Crystal Structures through Random Copolymerization of Biodegradable
Aliphatic Polyester Macromolecules 413162-3168
[32] Liang Z Pan P Zhu B Dong T Hua L Inoue Y (2010) Crystalline Phase of
Isomorphic Poly(hexamethylene sebacate-co-hexamethylene adipate)
Copolyester Effects of Comonomer Composition and Crystallization
Temperature Macromolecules 432925-2932
[33] Liang Z Pan P Zhu B Inoue Y (2011) Isomorphic crystallization of aliphatic
copolyesters derived from 16-hexanediol Effect of the chemical structure of
comonomer units on the extent of cocrystallization Polymer 522667-2676
[34] Rueda DR Garciacutea-Gutieacuterrez MC Nogales A Capitaacuten MJ Ezquerra TA
Labrador A Fraga E Beltraacuten D Juanhuix J Herranz JF Bordas J (2006)
Versatile wide angle diffraction setup for simultaneous wide and small angle x-
ray scattering measurements with synchrotron radiation Rev Sci Instrum 77
Art No 033904
[35] Rajkumar G AL-Khayat HA Eakins F Knupp C Squire JM (2007) The
CCP13 FibreFix program suite semi-automated analysis of diffraction patterns
from non-crystalline materials J Appl Crystallogr 40 178ndash184
[36] Herrera R Franco L Rodriacuteguez-Galaacuten A Puiggaliacute J (2002) Characterization
and degradation behavior of poly(butylene adipate-co-terephthalate)s J Polym
Sci Part A Polym Chem 40 4141-4157
[37] Pamula E Blazewicz M Paluszkiewicz P Dobrzynski (2001) FTIR study of
degradation products of aliphatic polyestersndashcarbon fibres composites J Mol
Struct 596 69-75
[38] Avrami M (1939) Kinetics of Phase Change I General Theory J Chem Phys
71103-1120
[39] Avrami M (1940) Kinetics of Phase Change II Transformation‐Time
Relations for Random Distribution of Nuclei J Chem Phys 8212-224
26
[40] Hoffman JD Weeks JJ (1962) Rate of Spherulitic Crystallization with Chain
Folds in Polychlorotrifluoroethylene J Chem Phys 371723-1741
[41] Lauritzen JI Hoffman JD (1973) Extension of theory of growth of chain‐folded
polymer crystals to large undercooling J Appl Phys 444340-4352
[42] Strobl G (2000) From the melt via mesomorphic and granular crystalline layers
to lamellar crystallites A major route followed in polymer crystallization Eur
Phys J E 3165-183
[43] Muthukumar M (2000) Commentary on theories of polymer crystallization
Eur Phys J 3199-202
[44] Williams ML Landel RF Ferry JD (1955) The Temperature Dependence of
Relaxation Mechanisms in Amorphous Polymers and Other Glass-forming
Liquids J Am Chem Soc 773701-3707
[45] Suzuki T Kovacs A (1970) Temperature dependence of spherulitic growth rate
of isotactic polystyrene J Polym J 182-100
[46] Vonk CG Kortleve G (1967) X-ray small-angle scattering of bulk
polyethylene Kolloid Z Z Polym 22019-24
[47] Vonk CG (1975) A general computer program for the processing of small-
angle X-ray scattering data J Appl Cryst 8340-341
[48] Hsiao BS Gardner KH Wu DQ Chu B (1993) Time-resolved X-ray study of
poly(aryl ether ether ketone) crystallization and melting behaviour 1
Crystallization Polymer 343986-3995
[49] Ikada Y Jamshida K Tsuji H Hyoan SH (1987) Maltopentaose- and
maltoheptaose-carrying styrene macromers and their homopolymers
Macromolecules 20906-908
[50] Kruger KN Zachmann HG (1993) Investigation of the melting behavior of
poly(aryl ether ketones) by simultaneous measurements of SAXS and WAXS
employing synchrotron radiation Macromolecules 26 5202-5208
[51] Hsiao BS Wang Z Yeh F Yan G Sheth KC (1999) Time-resolved X-ray
studies of structure development in poly(butylene terephthalate) during
isothermal crystallization Polymer 403515-3523
27
FIGURE CAPTIONS
Figure 1 Synthesis of copoly(alkylene dicarboxylate)s from 19-nonanediol and
pimelic and azelaic acids
Figure 2 Transmitance FTIR spectra (1400-800 cm-1
) of amorphous (red profiles) and
semicrystalline (blue profiles) PES 97 (a) PES 979-050 (b) and PES 99 (c) samples
Boxes highlight characteristic crystalline bands in the spectrum of the copolymer that
can be related to each homopolymer (see arrows) Asterisk points to the splitting of the
1090-1070 cm-1
amorphous band for the PES 97 sample
Figure 3 DSC traces obtained with the COPES 979-050 copolymer during the
heating run (20 ordmCmin) of the as-synthesized sample (a) the cooling run (10 ordmCmin)
after keeping the sample in the melt state for three minutes (b) the heating run (20
ordmCmin) of the hot crystallized sample (c) and the heating run (20 ordmCmin) of a sample
previously cooled at the maximum rate allowed by the equipment from the melt state
(d) The inset shows a magnification where the glass transition is clearly observed
Figure 4 Variation of the melting temperature and enthalpy of poly(nonamethylene
azelate-co-pimelate)s with the molar percentage of azelate units Enthalpies are given as
kJmol considering the molecular weight of the repeat unit determined according to the
copolymer composition
Figure 5 a) Exothermic DSC peaks corresponding to the hot isothermal crystallizations
of COPES 979-050 at temperatures between 54 and 51 ordmC Inset shows the
development of relative crystallinity over time for the indicated isothermal
crystallizations b) Avrami plots corresponding to the isothermal crystallization of
28
COPES 979-050 c) Overall crystallization rates (full symbols and solid lines) and the
reciprocal of the crystallization half-times (empty symbols and dashed lines) determined
at different temperatures for PES 99 () PES 97 (∆) and COPES 979-050 ()
samples
Figure 6 a) DSC heating runs (20 ordmCmin) of COPES 979-050 samples isothermally
crystallized at temperatures ranging from 54 to 51 ordmC b) Hoffman-Weeks plot of
temperatures corresponding to endothermic melting peaks versus crystallization
temperature for several COPES 979-x samples For the sake of clarity experimental
data of some intermediate compositions are described by dashed lines Equilibrium
melting temperatures are explicitly indicated at the corresponding intersection points
Figure 7 Polarized optical micrographs of spherulites of PES 97 (a) COPES 979-
050 (b) and PES 99 (c) crystallized at temperatures of 53 ordmC 51 ordmC and 59 ordmC
respectively For the sake of completeness spherulites of a 50 molar mixture of PES
97 and PES 99 homopolymers and crystallized at 56 ordmC are shown in (d)
Figure 8 a) Plots of COPES 979-050 spherulite radii versus crystallization time for
isothermal hot crystallizations performed at temperatures between 506 and 53 ordmC b)
Temperature dependence of the crystal growth rate for PES 99 PES 97 and COPES
979-050 samples c) Change in the nucleation density of PES 99 PES 97 and
COPES 979-050 samples with isothermal crystallization temperature
Figure 9 Plot of ln G + U
R(Tc-T) versus 1 Tc (T) f to determine the Kg
nucleation parameter of PES 99 PES 97 and COPES 979-050 samples
Figure 10 Time-resolved SAXS (a) and WAXD (b) three-dimensional profiles of PES
97 during non-isothermal hot crystallization at 3 ordmCmin
29
Figure 11 WAXD (a) and SAXS (b) profiles of PES 99 PES 97 and COPES 979-
050 samples taken at room temperature The amorphous halo obtained by
deconvolution is explicitly shown for the copolymer sample
Figure 12 Correlation functions (a) for non-isothermal hot crystallization of PES 99
PES 97 and COPES 979-050 samples b) Temperature evolution of Ldiams lc () and
la () during non-isothermal hot crystallization performed at 3 ordmCmin with PES 99
(dashed lines) PES 97 (solid lines) and COPES 979-050 (dotted lines) samples
30
Table 1 Synthesis data of studied polyesters
Polymer Yield
()
fPa
Mnb
(gmol)
Mwb
(gmol)
PDIbc
PES 97 73 1 7900 19600 247
COPES 979-085 67 086 9400 21900 233
COPES 979-070 76 071 9800 23000 236
COPES 979-050 78 053 13500 32300 240
COPES 979-030 78 032 11700 29900 257
COPES 979-015 65 017 12700 31800 250
PES 99 73 0 13300 35900 270
aPimelate molar fraction determined from
13C NMR spectra
bFrom GPC
cPolydispersity index
31
Table 2 Main crystallization kinetic parameters determined by DSC for the two
homopolymers and the copolymer with the highest comonomer content
Sample T (ordmC) Z 106
(s-n
)
n K 103
(s-1
) 1 τ12 10
3
(s-1
)
(Zln2)1n
103
(s
-1)
PES 97
52 849 239 754 887 879
53 034 266 371 430 426
54 026 247 219 256 255
55 0063 248 127 148 148
56 221 10-03
263 051 058 058
57 855 10-05
288 032 035 035
COPES 979-050
51 815 226 558 659 656
52 299 225 353 415 415
525 013 251 179 209 208
53 0025 251 094 110 109
54 178 10-04
278 031 036 036
PES 99
56 1848 260 1523 1793 175
57 028 294 589 682 667
58 0077 281 292 331 332
59 280 10-03
279 086 097 099
32
FIGURE 1
Diacuteaz et al
33
FIGURE 2
Diacuteaz et al
Tra
ns
mit
tan
ce
(
)
Wavenumber (cm-1
)
838cm-1
a)
Tra
ns
mit
tan
ce
(
)
Wavenumber (cm-1
)
b)
Tra
ns
mit
tan
ce
(
)
Wavenumber (cm-1
)
c)
1242 cm-1
34
FIGURE 3
Diacuteaz et al
0 10 20 30 40 50 60 70 80
015
025
035
045
-80 -60 -40 -20
-501 ordmC
611 ordmC
1122 Jg
605 ordmC
969 Jg
959 Jg
460 ordmC
958 Jg
a)
b)
c)
d)
Temperature (ordmC)
En
do
35
FIGURE 4
Diacuteaz et al
60
62
64
66
68
0 20 40 60 80 100
Azelate Units ()
Melt
ing
Tem
pera
ture (
ordmC)
28
30
32
34
Melt
ing
En
tha
lpy
(k
Jm
ol)
(ordmC
)
(kJ
mo
l)
36
FIGURE 5
Diacuteaz et al
0 20 40 60 80 100 120 140
En
do
ther
m
Time (min)
51 ordmC
52 ordmC
525 ordmC
53 ordmC
54 ordmC
0
20
40
60
80
100
0 20 40 60 80 100
Cry
sta
llin
ity
(
)Time (min)
53 ordmC54 ordmC
51 ordmC52 ordmC
525 ordmC
-1
-08
-06
-04
-02
0
02
04
18 28 38
log
-ln
[1-χ
(t)]
log (t-t0) (s)
51 ordmC
52 ordmC
525 ordmC 53 ordmC
54 ordmC
0
5
10
15
20
0
5
10
15
20
50 52 54 56 58 60
1t
12
1
03
(s-1
)
k
10
3(s
-1)
Temperature (ordmC)
PE979-05
PE97
PE99
b)
c)
a)
COPES 979-05
PES 97
PES 99
37
FIGURE 6
Diacuteaz et al
45
50
55
60
65
70
75
80
85
45 50 55 60 65 70 75 80 85
Temperature (ordmC)
Tem
per
atu
re (
ordmC)
PE 99
PE 979-05PE 97
PE 979-015PE 979-085
Temperature (ordmC)
En
doth
erm
50 55 60 65 70 75
a) COPES 979-05
510 ordmC
520 ordmC
525 ordmC
530 ordmC
540 ordmC
792 ordmC
779 ordmC
750 ordmC
748 ordmC
728 ordmC
b)
(ordmC
)
PE 979-
015
PE 979-
085
COPES 979-085
COPES 979-015
PES 99
COPES 979-05
PES 97
38
FIGURE 7
Diacuteaz et al
50 m
PES 97 a)
50 m
PES 99 c)
50 m
COPES 979-05 b)
50 m
d) PES 97 + PES 99
39
0
20
40
60
80
100
120
140
47 52 57 62
Nu
clei
im
m2
Temperature (ordmC)
PES 97
PES 99
COPES 979-050
0
5
10
15
20
25
30
35
0 20 40 60 80
Time (min)
Sp
heru
lite
Rad
ius
( m
)
T = 53 ordmC
T = 52 ordmC
T = 515 ordmC
T = 51 ordmC
T = 506 ordmC
0
5
10
15
20
25
30
35
40
45 50 55 60
Gro
wth
Rate
(micro
mm
in)
Temperature (ordmC)
PES 99
PES 97
COPES 979-050
(microm
)
a)
b)
c)
FIGURE 8
Diacuteaz et al
40
FIGURE 9
Diacuteaz et al
PES 99
PES 97
COPES 979-050
41
FIGURE 10
Diacuteaz et al
FIGURE 12
Diacuteaz et al
42
0 02 04 06 08
I q
2(a
u)
q (nm-1)
PES 99
PES 97
COPES 979-05
0
200
400
600
800
108 128 148 168 188
I (a
u
)
q (nm-1)
PES 99
PES 97
COPES 979-05
a)
b)
0370 nm
0372 nm
0373 nm
0414-0413 nm
FIGURE 11
Diacuteaz et al
43
FIGURE 12
Diacuteaz et al
0
5
10
15
20
25
22283440465258
Temperature (ordmC)
Sp
acin
g (
nm
)
b) a)
PES 97
COPES 979-050
PES 99
Lγ
Lγ
Lγ

25
[28] Mochizuki M Mukai K Yamada K Ichise N Murase S Iwaya Y (1997)
Structural Effects upon Enzymatic Hydrolysis of Poly(butylene succinate-co-
ethylene succinate)s Macromolecules 307403-7407
[29] George Z Papageorgiou Bikiaris Dimitrios N (2007) Synthesis
Cocrystallization and Enzymatic Degradation of Novel Poly(butylene-co-
propylene succinate) Copolymers Biomacromolecules 82437-2449
[30] Li X Hong Z Sun J Geng Y Huang Y An H et al (2009) Identifying the
Phase Behavior of Biodegradable Poly(hexamethylene succinate-co-
hexamethylene adipate) Copolymers with FTIR J Phys Chem 1132695-2704
[31] Li X Sun J Huang Y Geng Y Wang X Ma Z et al (2008) Inducing New
Crystal Structures through Random Copolymerization of Biodegradable
Aliphatic Polyester Macromolecules 413162-3168
[32] Liang Z Pan P Zhu B Dong T Hua L Inoue Y (2010) Crystalline Phase of
Isomorphic Poly(hexamethylene sebacate-co-hexamethylene adipate)
Copolyester Effects of Comonomer Composition and Crystallization
Temperature Macromolecules 432925-2932
[33] Liang Z Pan P Zhu B Inoue Y (2011) Isomorphic crystallization of aliphatic
copolyesters derived from 16-hexanediol Effect of the chemical structure of
comonomer units on the extent of cocrystallization Polymer 522667-2676
[34] Rueda DR Garciacutea-Gutieacuterrez MC Nogales A Capitaacuten MJ Ezquerra TA
Labrador A Fraga E Beltraacuten D Juanhuix J Herranz JF Bordas J (2006)
Versatile wide angle diffraction setup for simultaneous wide and small angle x-
ray scattering measurements with synchrotron radiation Rev Sci Instrum 77
Art No 033904
[35] Rajkumar G AL-Khayat HA Eakins F Knupp C Squire JM (2007) The
CCP13 FibreFix program suite semi-automated analysis of diffraction patterns
from non-crystalline materials J Appl Crystallogr 40 178ndash184
[36] Herrera R Franco L Rodriacuteguez-Galaacuten A Puiggaliacute J (2002) Characterization
and degradation behavior of poly(butylene adipate-co-terephthalate)s J Polym
Sci Part A Polym Chem 40 4141-4157
[37] Pamula E Blazewicz M Paluszkiewicz P Dobrzynski (2001) FTIR study of
degradation products of aliphatic polyestersndashcarbon fibres composites J Mol
Struct 596 69-75
[38] Avrami M (1939) Kinetics of Phase Change I General Theory J Chem Phys
71103-1120
[39] Avrami M (1940) Kinetics of Phase Change II Transformation‐Time
Relations for Random Distribution of Nuclei J Chem Phys 8212-224
26
[40] Hoffman JD Weeks JJ (1962) Rate of Spherulitic Crystallization with Chain
Folds in Polychlorotrifluoroethylene J Chem Phys 371723-1741
[41] Lauritzen JI Hoffman JD (1973) Extension of theory of growth of chain‐folded
polymer crystals to large undercooling J Appl Phys 444340-4352
[42] Strobl G (2000) From the melt via mesomorphic and granular crystalline layers
to lamellar crystallites A major route followed in polymer crystallization Eur
Phys J E 3165-183
[43] Muthukumar M (2000) Commentary on theories of polymer crystallization
Eur Phys J 3199-202
[44] Williams ML Landel RF Ferry JD (1955) The Temperature Dependence of
Relaxation Mechanisms in Amorphous Polymers and Other Glass-forming
Liquids J Am Chem Soc 773701-3707
[45] Suzuki T Kovacs A (1970) Temperature dependence of spherulitic growth rate
of isotactic polystyrene J Polym J 182-100
[46] Vonk CG Kortleve G (1967) X-ray small-angle scattering of bulk
polyethylene Kolloid Z Z Polym 22019-24
[47] Vonk CG (1975) A general computer program for the processing of small-
angle X-ray scattering data J Appl Cryst 8340-341
[48] Hsiao BS Gardner KH Wu DQ Chu B (1993) Time-resolved X-ray study of
poly(aryl ether ether ketone) crystallization and melting behaviour 1
Crystallization Polymer 343986-3995
[49] Ikada Y Jamshida K Tsuji H Hyoan SH (1987) Maltopentaose- and
maltoheptaose-carrying styrene macromers and their homopolymers
Macromolecules 20906-908
[50] Kruger KN Zachmann HG (1993) Investigation of the melting behavior of
poly(aryl ether ketones) by simultaneous measurements of SAXS and WAXS
employing synchrotron radiation Macromolecules 26 5202-5208
[51] Hsiao BS Wang Z Yeh F Yan G Sheth KC (1999) Time-resolved X-ray
studies of structure development in poly(butylene terephthalate) during
isothermal crystallization Polymer 403515-3523
27
FIGURE CAPTIONS
Figure 1 Synthesis of copoly(alkylene dicarboxylate)s from 19-nonanediol and
pimelic and azelaic acids
Figure 2 Transmitance FTIR spectra (1400-800 cm-1
) of amorphous (red profiles) and
semicrystalline (blue profiles) PES 97 (a) PES 979-050 (b) and PES 99 (c) samples
Boxes highlight characteristic crystalline bands in the spectrum of the copolymer that
can be related to each homopolymer (see arrows) Asterisk points to the splitting of the
1090-1070 cm-1
amorphous band for the PES 97 sample
Figure 3 DSC traces obtained with the COPES 979-050 copolymer during the
heating run (20 ordmCmin) of the as-synthesized sample (a) the cooling run (10 ordmCmin)
after keeping the sample in the melt state for three minutes (b) the heating run (20
ordmCmin) of the hot crystallized sample (c) and the heating run (20 ordmCmin) of a sample
previously cooled at the maximum rate allowed by the equipment from the melt state
(d) The inset shows a magnification where the glass transition is clearly observed
Figure 4 Variation of the melting temperature and enthalpy of poly(nonamethylene
azelate-co-pimelate)s with the molar percentage of azelate units Enthalpies are given as
kJmol considering the molecular weight of the repeat unit determined according to the
copolymer composition
Figure 5 a) Exothermic DSC peaks corresponding to the hot isothermal crystallizations
of COPES 979-050 at temperatures between 54 and 51 ordmC Inset shows the
development of relative crystallinity over time for the indicated isothermal
crystallizations b) Avrami plots corresponding to the isothermal crystallization of
28
COPES 979-050 c) Overall crystallization rates (full symbols and solid lines) and the
reciprocal of the crystallization half-times (empty symbols and dashed lines) determined
at different temperatures for PES 99 () PES 97 (∆) and COPES 979-050 ()
samples
Figure 6 a) DSC heating runs (20 ordmCmin) of COPES 979-050 samples isothermally
crystallized at temperatures ranging from 54 to 51 ordmC b) Hoffman-Weeks plot of
temperatures corresponding to endothermic melting peaks versus crystallization
temperature for several COPES 979-x samples For the sake of clarity experimental
data of some intermediate compositions are described by dashed lines Equilibrium
melting temperatures are explicitly indicated at the corresponding intersection points
Figure 7 Polarized optical micrographs of spherulites of PES 97 (a) COPES 979-
050 (b) and PES 99 (c) crystallized at temperatures of 53 ordmC 51 ordmC and 59 ordmC
respectively For the sake of completeness spherulites of a 50 molar mixture of PES
97 and PES 99 homopolymers and crystallized at 56 ordmC are shown in (d)
Figure 8 a) Plots of COPES 979-050 spherulite radii versus crystallization time for
isothermal hot crystallizations performed at temperatures between 506 and 53 ordmC b)
Temperature dependence of the crystal growth rate for PES 99 PES 97 and COPES
979-050 samples c) Change in the nucleation density of PES 99 PES 97 and
COPES 979-050 samples with isothermal crystallization temperature
Figure 9 Plot of ln G + U
R(Tc-T) versus 1 Tc (T) f to determine the Kg
nucleation parameter of PES 99 PES 97 and COPES 979-050 samples
Figure 10 Time-resolved SAXS (a) and WAXD (b) three-dimensional profiles of PES
97 during non-isothermal hot crystallization at 3 ordmCmin
29
Figure 11 WAXD (a) and SAXS (b) profiles of PES 99 PES 97 and COPES 979-
050 samples taken at room temperature The amorphous halo obtained by
deconvolution is explicitly shown for the copolymer sample
Figure 12 Correlation functions (a) for non-isothermal hot crystallization of PES 99
PES 97 and COPES 979-050 samples b) Temperature evolution of Ldiams lc () and
la () during non-isothermal hot crystallization performed at 3 ordmCmin with PES 99
(dashed lines) PES 97 (solid lines) and COPES 979-050 (dotted lines) samples
30
Table 1 Synthesis data of studied polyesters
Polymer Yield
()
fPa
Mnb
(gmol)
Mwb
(gmol)
PDIbc
PES 97 73 1 7900 19600 247
COPES 979-085 67 086 9400 21900 233
COPES 979-070 76 071 9800 23000 236
COPES 979-050 78 053 13500 32300 240
COPES 979-030 78 032 11700 29900 257
COPES 979-015 65 017 12700 31800 250
PES 99 73 0 13300 35900 270
aPimelate molar fraction determined from
13C NMR spectra
bFrom GPC
cPolydispersity index
31
Table 2 Main crystallization kinetic parameters determined by DSC for the two
homopolymers and the copolymer with the highest comonomer content
Sample T (ordmC) Z 106
(s-n
)
n K 103
(s-1
) 1 τ12 10
3
(s-1
)
(Zln2)1n
103
(s
-1)
PES 97
52 849 239 754 887 879
53 034 266 371 430 426
54 026 247 219 256 255
55 0063 248 127 148 148
56 221 10-03
263 051 058 058
57 855 10-05
288 032 035 035
COPES 979-050
51 815 226 558 659 656
52 299 225 353 415 415
525 013 251 179 209 208
53 0025 251 094 110 109
54 178 10-04
278 031 036 036
PES 99
56 1848 260 1523 1793 175
57 028 294 589 682 667
58 0077 281 292 331 332
59 280 10-03
279 086 097 099
32
FIGURE 1
Diacuteaz et al
33
FIGURE 2
Diacuteaz et al
Tra
ns
mit
tan
ce
(
)
Wavenumber (cm-1
)
838cm-1
a)
Tra
ns
mit
tan
ce
(
)
Wavenumber (cm-1
)
b)
Tra
ns
mit
tan
ce
(
)
Wavenumber (cm-1
)
c)
1242 cm-1
34
FIGURE 3
Diacuteaz et al
0 10 20 30 40 50 60 70 80
015
025
035
045
-80 -60 -40 -20
-501 ordmC
611 ordmC
1122 Jg
605 ordmC
969 Jg
959 Jg
460 ordmC
958 Jg
a)
b)
c)
d)
Temperature (ordmC)
En
do
35
FIGURE 4
Diacuteaz et al
60
62
64
66
68
0 20 40 60 80 100
Azelate Units ()
Melt
ing
Tem
pera
ture (
ordmC)
28
30
32
34
Melt
ing
En
tha
lpy
(k
Jm
ol)
(ordmC
)
(kJ
mo
l)
36
FIGURE 5
Diacuteaz et al
0 20 40 60 80 100 120 140
En
do
ther
m
Time (min)
51 ordmC
52 ordmC
525 ordmC
53 ordmC
54 ordmC
0
20
40
60
80
100
0 20 40 60 80 100
Cry
sta
llin
ity
(
)Time (min)
53 ordmC54 ordmC
51 ordmC52 ordmC
525 ordmC
-1
-08
-06
-04
-02
0
02
04
18 28 38
log
-ln
[1-χ
(t)]
log (t-t0) (s)
51 ordmC
52 ordmC
525 ordmC 53 ordmC
54 ordmC
0
5
10
15
20
0
5
10
15
20
50 52 54 56 58 60
1t
12
1
03
(s-1
)
k
10
3(s
-1)
Temperature (ordmC)
PE979-05
PE97
PE99
b)
c)
a)
COPES 979-05
PES 97
PES 99
37
FIGURE 6
Diacuteaz et al
45
50
55
60
65
70
75
80
85
45 50 55 60 65 70 75 80 85
Temperature (ordmC)
Tem
per
atu
re (
ordmC)
PE 99
PE 979-05PE 97
PE 979-015PE 979-085
Temperature (ordmC)
En
doth
erm
50 55 60 65 70 75
a) COPES 979-05
510 ordmC
520 ordmC
525 ordmC
530 ordmC
540 ordmC
792 ordmC
779 ordmC
750 ordmC
748 ordmC
728 ordmC
b)
(ordmC
)
PE 979-
015
PE 979-
085
COPES 979-085
COPES 979-015
PES 99
COPES 979-05
PES 97
38
FIGURE 7
Diacuteaz et al
50 m
PES 97 a)
50 m
PES 99 c)
50 m
COPES 979-05 b)
50 m
d) PES 97 + PES 99
39
0
20
40
60
80
100
120
140
47 52 57 62
Nu
clei
im
m2
Temperature (ordmC)
PES 97
PES 99
COPES 979-050
0
5
10
15
20
25
30
35
0 20 40 60 80
Time (min)
Sp
heru
lite
Rad
ius
( m
)
T = 53 ordmC
T = 52 ordmC
T = 515 ordmC
T = 51 ordmC
T = 506 ordmC
0
5
10
15
20
25
30
35
40
45 50 55 60
Gro
wth
Rate
(micro
mm
in)
Temperature (ordmC)
PES 99
PES 97
COPES 979-050
(microm
)
a)
b)
c)
FIGURE 8
Diacuteaz et al
40
FIGURE 9
Diacuteaz et al
PES 99
PES 97
COPES 979-050
41
FIGURE 10
Diacuteaz et al
FIGURE 12
Diacuteaz et al
42
0 02 04 06 08
I q
2(a
u)
q (nm-1)
PES 99
PES 97
COPES 979-05
0
200
400
600
800
108 128 148 168 188
I (a
u
)
q (nm-1)
PES 99
PES 97
COPES 979-05
a)
b)
0370 nm
0372 nm
0373 nm
0414-0413 nm
FIGURE 11
Diacuteaz et al
43
FIGURE 12
Diacuteaz et al
0
5
10
15
20
25
22283440465258
Temperature (ordmC)
Sp
acin
g (
nm
)
b) a)
PES 97
COPES 979-050
PES 99
Lγ
Lγ
Lγ
28
COPES 979-050 c) Overall crystallization rates (full symbols and solid lines) and the
reciprocal of the crystallization half-times (empty symbols and dashed lines) determined
at different temperatures for PES 99 () PES 97 (∆) and COPES 979-050 ()
samples
Figure 6 a) DSC heating runs (20 ordmCmin) of COPES 979-050 samples isothermally
crystallized at temperatures ranging from 54 to 51 ordmC b) Hoffman-Weeks plot of
temperatures corresponding to endothermic melting peaks versus crystallization
temperature for several COPES 979-x samples For the sake of clarity experimental
data of some intermediate compositions are described by dashed lines Equilibrium
melting temperatures are explicitly indicated at the corresponding intersection points
Figure 7 Polarized optical micrographs of spherulites of PES 97 (a) COPES 979-
050 (b) and PES 99 (c) crystallized at temperatures of 53 ordmC 51 ordmC and 59 ordmC
respectively For the sake of completeness spherulites of a 50 molar mixture of PES
97 and PES 99 homopolymers and crystallized at 56 ordmC are shown in (d)
Figure 8 a) Plots of COPES 979-050 spherulite radii versus crystallization time for
isothermal hot crystallizations performed at temperatures between 506 and 53 ordmC b)
Temperature dependence of the crystal growth rate for PES 99 PES 97 and COPES
979-050 samples c) Change in the nucleation density of PES 99 PES 97 and
COPES 979-050 samples with isothermal crystallization temperature
Figure 9 Plot of ln G + U
R(Tc-T) versus 1 Tc (T) f to determine the Kg
nucleation parameter of PES 99 PES 97 and COPES 979-050 samples
Figure 10 Time-resolved SAXS (a) and WAXD (b) three-dimensional profiles of PES
97 during non-isothermal hot crystallization at 3 ordmCmin
29
Figure 11 WAXD (a) and SAXS (b) profiles of PES 99 PES 97 and COPES 979-
050 samples taken at room temperature The amorphous halo obtained by
deconvolution is explicitly shown for the copolymer sample
Figure 12 Correlation functions (a) for non-isothermal hot crystallization of PES 99
PES 97 and COPES 979-050 samples b) Temperature evolution of Ldiams lc () and
la () during non-isothermal hot crystallization performed at 3 ordmCmin with PES 99
(dashed lines) PES 97 (solid lines) and COPES 979-050 (dotted lines) samples
30
Table 1 Synthesis data of studied polyesters
Polymer Yield
()
fPa
Mnb
(gmol)
Mwb
(gmol)
PDIbc
PES 97 73 1 7900 19600 247
COPES 979-085 67 086 9400 21900 233
COPES 979-070 76 071 9800 23000 236
COPES 979-050 78 053 13500 32300 240
COPES 979-030 78 032 11700 29900 257
COPES 979-015 65 017 12700 31800 250
PES 99 73 0 13300 35900 270
aPimelate molar fraction determined from
13C NMR spectra
bFrom GPC
cPolydispersity index
31
Table 2 Main crystallization kinetic parameters determined by DSC for the two
homopolymers and the copolymer with the highest comonomer content
Sample T (ordmC) Z 106
(s-n
)
n K 103
(s-1
) 1 τ12 10
3
(s-1
)
(Zln2)1n
103
(s
-1)
PES 97
52 849 239 754 887 879
53 034 266 371 430 426
54 026 247 219 256 255
55 0063 248 127 148 148
56 221 10-03
263 051 058 058
57 855 10-05
288 032 035 035
COPES 979-050
51 815 226 558 659 656
52 299 225 353 415 415
525 013 251 179 209 208
53 0025 251 094 110 109
54 178 10-04
278 031 036 036
PES 99
56 1848 260 1523 1793 175
57 028 294 589 682 667
58 0077 281 292 331 332
59 280 10-03
279 086 097 099
32
FIGURE 1
Diacuteaz et al
33
FIGURE 2
Diacuteaz et al
Tra
ns
mit
tan
ce
(
)
Wavenumber (cm-1
)
838cm-1
a)
Tra
ns
mit
tan
ce
(
)
Wavenumber (cm-1
)
b)
Tra
ns
mit
tan
ce
(
)
Wavenumber (cm-1
)
c)
1242 cm-1
34
FIGURE 3
Diacuteaz et al
0 10 20 30 40 50 60 70 80
015
025
035
045
-80 -60 -40 -20
-501 ordmC
611 ordmC
1122 Jg
605 ordmC
969 Jg
959 Jg
460 ordmC
958 Jg
a)
b)
c)
d)
Temperature (ordmC)
En
do
35
FIGURE 4
Diacuteaz et al
60
62
64
66
68
0 20 40 60 80 100
Azelate Units ()
Melt
ing
Tem
pera
ture (
ordmC)
28
30
32
34
Melt
ing
En
tha
lpy
(k
Jm
ol)
(ordmC
)
(kJ
mo
l)
36
FIGURE 5
Diacuteaz et al
0 20 40 60 80 100 120 140
En
do
ther
m
Time (min)
51 ordmC
52 ordmC
525 ordmC
53 ordmC
54 ordmC
0
20
40
60
80
100
0 20 40 60 80 100
Cry
sta
llin
ity
(
)Time (min)
53 ordmC54 ordmC
51 ordmC52 ordmC
525 ordmC
-1
-08
-06
-04
-02
0
02
04
18 28 38
log
-ln
[1-χ
(t)]
log (t-t0) (s)
51 ordmC
52 ordmC
525 ordmC 53 ordmC
54 ordmC
0
5
10
15
20
0
5
10
15
20
50 52 54 56 58 60
1t
12
1
03
(s-1
)
k
10
3(s
-1)
Temperature (ordmC)
PE979-05
PE97
PE99
b)
c)
a)
COPES 979-05
PES 97
PES 99
37
FIGURE 6
Diacuteaz et al
45
50
55
60
65
70
75
80
85
45 50 55 60 65 70 75 80 85
Temperature (ordmC)
Tem
per
atu
re (
ordmC)
PE 99
PE 979-05PE 97
PE 979-015PE 979-085
Temperature (ordmC)
En
doth
erm
50 55 60 65 70 75
a) COPES 979-05
510 ordmC
520 ordmC
525 ordmC
530 ordmC
540 ordmC
792 ordmC
779 ordmC
750 ordmC
748 ordmC
728 ordmC
b)
(ordmC
)
PE 979-
015
PE 979-
085
COPES 979-085
COPES 979-015
PES 99
COPES 979-05
PES 97
38
FIGURE 7
Diacuteaz et al
50 m
PES 97 a)
50 m
PES 99 c)
50 m
COPES 979-05 b)
50 m
d) PES 97 + PES 99
39
0
20
40
60
80
100
120
140
47 52 57 62
Nu
clei
im
m2
Temperature (ordmC)
PES 97
PES 99
COPES 979-050
0
5
10
15
20
25
30
35
0 20 40 60 80
Time (min)
Sp
heru
lite
Rad
ius
( m
)
T = 53 ordmC
T = 52 ordmC
T = 515 ordmC
T = 51 ordmC
T = 506 ordmC
0
5
10
15
20
25
30
35
40
45 50 55 60
Gro
wth
Rate
(micro
mm
in)
Temperature (ordmC)
PES 99
PES 97
COPES 979-050
(microm
)
a)
b)
c)
FIGURE 8
Diacuteaz et al
40
FIGURE 9
Diacuteaz et al
PES 99
PES 97
COPES 979-050
41
FIGURE 10
Diacuteaz et al
FIGURE 12
Diacuteaz et al
42
0 02 04 06 08
I q
2(a
u)
q (nm-1)
PES 99
PES 97
COPES 979-05
0
200
400
600
800
108 128 148 168 188
I (a
u
)
q (nm-1)
PES 99
PES 97
COPES 979-05
a)
b)
0370 nm
0372 nm
0373 nm
0414-0413 nm
FIGURE 11
Diacuteaz et al
43
FIGURE 12
Diacuteaz et al
0
5
10
15
20
25
22283440465258
Temperature (ordmC)
Sp
acin
g (
nm
)
b) a)
PES 97
COPES 979-050
PES 99
Lγ
Lγ
Lγ

30
Table 1 Synthesis data of studied polyesters
Polymer Yield
()
fPa
Mnb
(gmol)
Mwb
(gmol)
PDIbc
PES 97 73 1 7900 19600 247
COPES 979-085 67 086 9400 21900 233
COPES 979-070 76 071 9800 23000 236
COPES 979-050 78 053 13500 32300 240
COPES 979-030 78 032 11700 29900 257
COPES 979-015 65 017 12700 31800 250
PES 99 73 0 13300 35900 270
aPimelate molar fraction determined from
13C NMR spectra
bFrom GPC
cPolydispersity index
31
Table 2 Main crystallization kinetic parameters determined by DSC for the two
homopolymers and the copolymer with the highest comonomer content
Sample T (ordmC) Z 106
(s-n
)
n K 103
(s-1
) 1 τ12 10
3
(s-1
)
(Zln2)1n
103
(s
-1)
PES 97
52 849 239 754 887 879
53 034 266 371 430 426
54 026 247 219 256 255
55 0063 248 127 148 148
56 221 10-03
263 051 058 058
57 855 10-05
288 032 035 035
COPES 979-050
51 815 226 558 659 656
52 299 225 353 415 415
525 013 251 179 209 208
53 0025 251 094 110 109
54 178 10-04
278 031 036 036
PES 99
56 1848 260 1523 1793 175
57 028 294 589 682 667
58 0077 281 292 331 332
59 280 10-03
279 086 097 099
32
FIGURE 1
Diacuteaz et al
33
FIGURE 2
Diacuteaz et al
Tra
ns
mit
tan
ce
(
)
Wavenumber (cm-1
)
838cm-1
a)
Tra
ns
mit
tan
ce
(
)
Wavenumber (cm-1
)
b)
Tra
ns
mit
tan
ce
(
)
Wavenumber (cm-1
)
c)
1242 cm-1
34
FIGURE 3
Diacuteaz et al
0 10 20 30 40 50 60 70 80
015
025
035
045
-80 -60 -40 -20
-501 ordmC
611 ordmC
1122 Jg
605 ordmC
969 Jg
959 Jg
460 ordmC
958 Jg
a)
b)
c)
d)
Temperature (ordmC)
En
do
35
FIGURE 4
Diacuteaz et al
60
62
64
66
68
0 20 40 60 80 100
Azelate Units ()
Melt
ing
Tem
pera
ture (
ordmC)
28
30
32
34
Melt
ing
En
tha
lpy
(k
Jm
ol)
(ordmC
)
(kJ
mo
l)
36
FIGURE 5
Diacuteaz et al
0 20 40 60 80 100 120 140
En
do
ther
m
Time (min)
51 ordmC
52 ordmC
525 ordmC
53 ordmC
54 ordmC
0
20
40
60
80
100
0 20 40 60 80 100
Cry
sta
llin
ity
(
)Time (min)
53 ordmC54 ordmC
51 ordmC52 ordmC
525 ordmC
-1
-08
-06
-04
-02
0
02
04
18 28 38
log
-ln
[1-χ
(t)]
log (t-t0) (s)
51 ordmC
52 ordmC
525 ordmC 53 ordmC
54 ordmC
0
5
10
15
20
0
5
10
15
20
50 52 54 56 58 60
1t
12
1
03
(s-1
)
k
10
3(s
-1)
Temperature (ordmC)
PE979-05
PE97
PE99
b)
c)
a)
COPES 979-05
PES 97
PES 99
37
FIGURE 6
Diacuteaz et al
45
50
55
60
65
70
75
80
85
45 50 55 60 65 70 75 80 85
Temperature (ordmC)
Tem
per
atu
re (
ordmC)
PE 99
PE 979-05PE 97
PE 979-015PE 979-085
Temperature (ordmC)
En
doth
erm
50 55 60 65 70 75
a) COPES 979-05
510 ordmC
520 ordmC
525 ordmC
530 ordmC
540 ordmC
792 ordmC
779 ordmC
750 ordmC
748 ordmC
728 ordmC
b)
(ordmC
)
PE 979-
015
PE 979-
085
COPES 979-085
COPES 979-015
PES 99
COPES 979-05
PES 97
38
FIGURE 7
Diacuteaz et al
50 m
PES 97 a)
50 m
PES 99 c)
50 m
COPES 979-05 b)
50 m
d) PES 97 + PES 99
39
0
20
40
60
80
100
120
140
47 52 57 62
Nu
clei
im
m2
Temperature (ordmC)
PES 97
PES 99
COPES 979-050
0
5
10
15
20
25
30
35
0 20 40 60 80
Time (min)
Sp
heru
lite
Rad
ius
( m
)
T = 53 ordmC
T = 52 ordmC
T = 515 ordmC
T = 51 ordmC
T = 506 ordmC
0
5
10
15
20
25
30
35
40
45 50 55 60
Gro
wth
Rate
(micro
mm
in)
Temperature (ordmC)
PES 99
PES 97
COPES 979-050
(microm
)
a)
b)
c)
FIGURE 8
Diacuteaz et al
40
FIGURE 9
Diacuteaz et al
PES 99
PES 97
COPES 979-050
41
FIGURE 10
Diacuteaz et al
FIGURE 12
Diacuteaz et al
42
0 02 04 06 08
I q
2(a
u)
q (nm-1)
PES 99
PES 97
COPES 979-05
0
200
400
600
800
108 128 148 168 188
I (a
u
)
q (nm-1)
PES 99
PES 97
COPES 979-05
a)
b)
0370 nm
0372 nm
0373 nm
0414-0413 nm
FIGURE 11
Diacuteaz et al
43
FIGURE 12
Diacuteaz et al
0
5
10
15
20
25
22283440465258
Temperature (ordmC)
Sp
acin
g (
nm
)
b) a)
PES 97
COPES 979-050
PES 99
Lγ
Lγ
Lγ
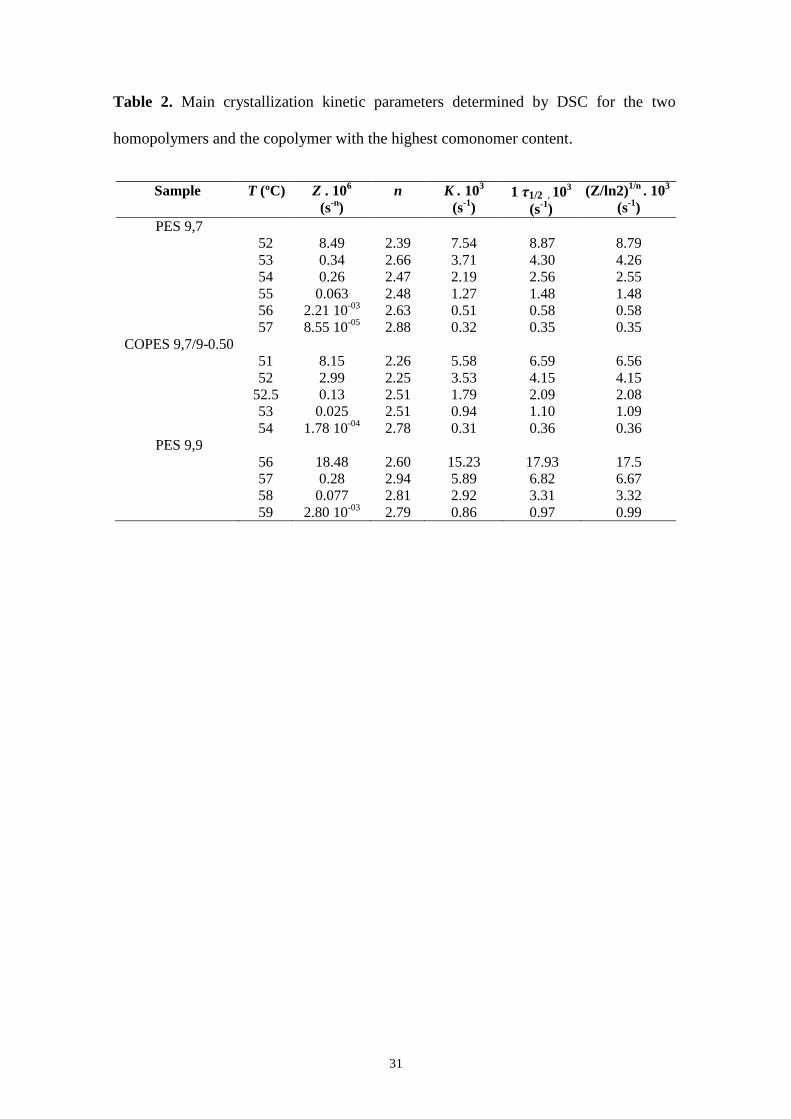

32
FIGURE 1
Diacuteaz et al
33
FIGURE 2
Diacuteaz et al
Tra
ns
mit
tan
ce
(
)
Wavenumber (cm-1
)
838cm-1
a)
Tra
ns
mit
tan
ce
(
)
Wavenumber (cm-1
)
b)
Tra
ns
mit
tan
ce
(
)
Wavenumber (cm-1
)
c)
1242 cm-1
34
FIGURE 3
Diacuteaz et al
0 10 20 30 40 50 60 70 80
015
025
035
045
-80 -60 -40 -20
-501 ordmC
611 ordmC
1122 Jg
605 ordmC
969 Jg
959 Jg
460 ordmC
958 Jg
a)
b)
c)
d)
Temperature (ordmC)
En
do
35
FIGURE 4
Diacuteaz et al
60
62
64
66
68
0 20 40 60 80 100
Azelate Units ()
Melt
ing
Tem
pera
ture (
ordmC)
28
30
32
34
Melt
ing
En
tha
lpy
(k
Jm
ol)
(ordmC
)
(kJ
mo
l)
36
FIGURE 5
Diacuteaz et al
0 20 40 60 80 100 120 140
En
do
ther
m
Time (min)
51 ordmC
52 ordmC
525 ordmC
53 ordmC
54 ordmC
0
20
40
60
80
100
0 20 40 60 80 100
Cry
sta
llin
ity
(
)Time (min)
53 ordmC54 ordmC
51 ordmC52 ordmC
525 ordmC
-1
-08
-06
-04
-02
0
02
04
18 28 38
log
-ln
[1-χ
(t)]
log (t-t0) (s)
51 ordmC
52 ordmC
525 ordmC 53 ordmC
54 ordmC
0
5
10
15
20
0
5
10
15
20
50 52 54 56 58 60
1t
12
1
03
(s-1
)
k
10
3(s
-1)
Temperature (ordmC)
PE979-05
PE97
PE99
b)
c)
a)
COPES 979-05
PES 97
PES 99
37
FIGURE 6
Diacuteaz et al
45
50
55
60
65
70
75
80
85
45 50 55 60 65 70 75 80 85
Temperature (ordmC)
Tem
per
atu
re (
ordmC)
PE 99
PE 979-05PE 97
PE 979-015PE 979-085
Temperature (ordmC)
En
doth
erm
50 55 60 65 70 75
a) COPES 979-05
510 ordmC
520 ordmC
525 ordmC
530 ordmC
540 ordmC
792 ordmC
779 ordmC
750 ordmC
748 ordmC
728 ordmC
b)
(ordmC
)
PE 979-
015
PE 979-
085
COPES 979-085
COPES 979-015
PES 99
COPES 979-05
PES 97
38
FIGURE 7
Diacuteaz et al
50 m
PES 97 a)
50 m
PES 99 c)
50 m
COPES 979-05 b)
50 m
d) PES 97 + PES 99
39
0
20
40
60
80
100
120
140
47 52 57 62
Nu
clei
im
m2
Temperature (ordmC)
PES 97
PES 99
COPES 979-050
0
5
10
15
20
25
30
35
0 20 40 60 80
Time (min)
Sp
heru
lite
Rad
ius
( m
)
T = 53 ordmC
T = 52 ordmC
T = 515 ordmC
T = 51 ordmC
T = 506 ordmC
0
5
10
15
20
25
30
35
40
45 50 55 60
Gro
wth
Rate
(micro
mm
in)
Temperature (ordmC)
PES 99
PES 97
COPES 979-050
(microm
)
a)
b)
c)
FIGURE 8
Diacuteaz et al
40
FIGURE 9
Diacuteaz et al
PES 99
PES 97
COPES 979-050
41
FIGURE 10
Diacuteaz et al
FIGURE 12
Diacuteaz et al
42
0 02 04 06 08
I q
2(a
u)
q (nm-1)
PES 99
PES 97
COPES 979-05
0
200
400
600
800
108 128 148 168 188
I (a
u
)
q (nm-1)
PES 99
PES 97
COPES 979-05
a)
b)
0370 nm
0372 nm
0373 nm
0414-0413 nm
FIGURE 11
Diacuteaz et al
43
FIGURE 12
Diacuteaz et al
0
5
10
15
20
25
22283440465258
Temperature (ordmC)
Sp
acin
g (
nm
)
b) a)
PES 97
COPES 979-050
PES 99
Lγ
Lγ
Lγ
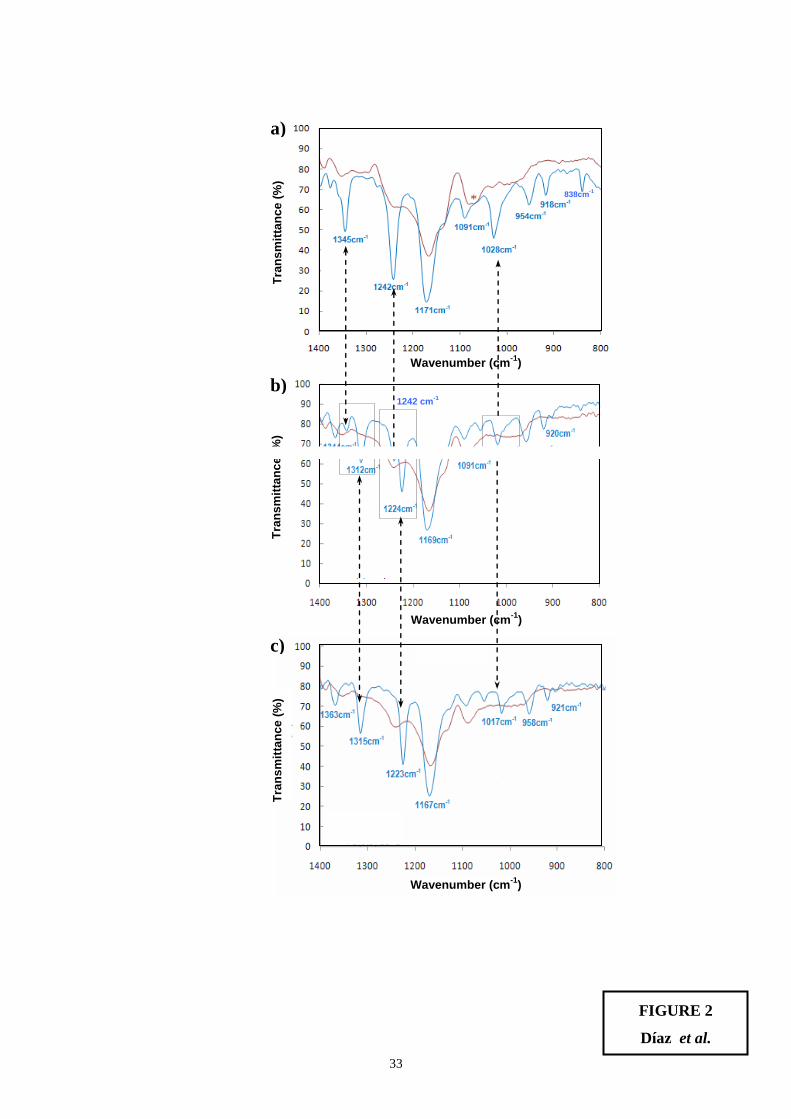

34
FIGURE 3
Diacuteaz et al
0 10 20 30 40 50 60 70 80
015
025
035
045
-80 -60 -40 -20
-501 ordmC
611 ordmC
1122 Jg
605 ordmC
969 Jg
959 Jg
460 ordmC
958 Jg
a)
b)
c)
d)
Temperature (ordmC)
En
do
35
FIGURE 4
Diacuteaz et al
60
62
64
66
68
0 20 40 60 80 100
Azelate Units ()
Melt
ing
Tem
pera
ture (
ordmC)
28
30
32
34
Melt
ing
En
tha
lpy
(k
Jm
ol)
(ordmC
)
(kJ
mo
l)
36
FIGURE 5
Diacuteaz et al
0 20 40 60 80 100 120 140
En
do
ther
m
Time (min)
51 ordmC
52 ordmC
525 ordmC
53 ordmC
54 ordmC
0
20
40
60
80
100
0 20 40 60 80 100
Cry
sta
llin
ity
(
)Time (min)
53 ordmC54 ordmC
51 ordmC52 ordmC
525 ordmC
-1
-08
-06
-04
-02
0
02
04
18 28 38
log
-ln
[1-χ
(t)]
log (t-t0) (s)
51 ordmC
52 ordmC
525 ordmC 53 ordmC
54 ordmC
0
5
10
15
20
0
5
10
15
20
50 52 54 56 58 60
1t
12
1
03
(s-1
)
k
10
3(s
-1)
Temperature (ordmC)
PE979-05
PE97
PE99
b)
c)
a)
COPES 979-05
PES 97
PES 99
37
FIGURE 6
Diacuteaz et al
45
50
55
60
65
70
75
80
85
45 50 55 60 65 70 75 80 85
Temperature (ordmC)
Tem
per
atu
re (
ordmC)
PE 99
PE 979-05PE 97
PE 979-015PE 979-085
Temperature (ordmC)
En
doth
erm
50 55 60 65 70 75
a) COPES 979-05
510 ordmC
520 ordmC
525 ordmC
530 ordmC
540 ordmC
792 ordmC
779 ordmC
750 ordmC
748 ordmC
728 ordmC
b)
(ordmC
)
PE 979-
015
PE 979-
085
COPES 979-085
COPES 979-015
PES 99
COPES 979-05
PES 97
38
FIGURE 7
Diacuteaz et al
50 m
PES 97 a)
50 m
PES 99 c)
50 m
COPES 979-05 b)
50 m
d) PES 97 + PES 99
39
0
20
40
60
80
100
120
140
47 52 57 62
Nu
clei
im
m2
Temperature (ordmC)
PES 97
PES 99
COPES 979-050
0
5
10
15
20
25
30
35
0 20 40 60 80
Time (min)
Sp
heru
lite
Rad
ius
( m
)
T = 53 ordmC
T = 52 ordmC
T = 515 ordmC
T = 51 ordmC
T = 506 ordmC
0
5
10
15
20
25
30
35
40
45 50 55 60
Gro
wth
Rate
(micro
mm
in)
Temperature (ordmC)
PES 99
PES 97
COPES 979-050
(microm
)
a)
b)
c)
FIGURE 8
Diacuteaz et al
40
FIGURE 9
Diacuteaz et al
PES 99
PES 97
COPES 979-050
41
FIGURE 10
Diacuteaz et al
FIGURE 12
Diacuteaz et al
42
0 02 04 06 08
I q
2(a
u)
q (nm-1)
PES 99
PES 97
COPES 979-05
0
200
400
600
800
108 128 148 168 188
I (a
u
)
q (nm-1)
PES 99
PES 97
COPES 979-05
a)
b)
0370 nm
0372 nm
0373 nm
0414-0413 nm
FIGURE 11
Diacuteaz et al
43
FIGURE 12
Diacuteaz et al
0
5
10
15
20
25
22283440465258
Temperature (ordmC)
Sp
acin
g (
nm
)
b) a)
PES 97
COPES 979-050
PES 99
Lγ
Lγ
Lγ

35
FIGURE 4
Diacuteaz et al
60
62
64
66
68
0 20 40 60 80 100
Azelate Units ()
Melt
ing
Tem
pera
ture (
ordmC)
28
30
32
34
Melt
ing
En
tha
lpy
(k
Jm
ol)
(ordmC
)
(kJ
mo
l)
36
FIGURE 5
Diacuteaz et al
0 20 40 60 80 100 120 140
En
do
ther
m
Time (min)
51 ordmC
52 ordmC
525 ordmC
53 ordmC
54 ordmC
0
20
40
60
80
100
0 20 40 60 80 100
Cry
sta
llin
ity
(
)Time (min)
53 ordmC54 ordmC
51 ordmC52 ordmC
525 ordmC
-1
-08
-06
-04
-02
0
02
04
18 28 38
log
-ln
[1-χ
(t)]
log (t-t0) (s)
51 ordmC
52 ordmC
525 ordmC 53 ordmC
54 ordmC
0
5
10
15
20
0
5
10
15
20
50 52 54 56 58 60
1t
12
1
03
(s-1
)
k
10
3(s
-1)
Temperature (ordmC)
PE979-05
PE97
PE99
b)
c)
a)
COPES 979-05
PES 97
PES 99
37
FIGURE 6
Diacuteaz et al
45
50
55
60
65
70
75
80
85
45 50 55 60 65 70 75 80 85
Temperature (ordmC)
Tem
per
atu
re (
ordmC)
PE 99
PE 979-05PE 97
PE 979-015PE 979-085
Temperature (ordmC)
En
doth
erm
50 55 60 65 70 75
a) COPES 979-05
510 ordmC
520 ordmC
525 ordmC
530 ordmC
540 ordmC
792 ordmC
779 ordmC
750 ordmC
748 ordmC
728 ordmC
b)
(ordmC
)
PE 979-
015
PE 979-
085
COPES 979-085
COPES 979-015
PES 99
COPES 979-05
PES 97
38
FIGURE 7
Diacuteaz et al
50 m
PES 97 a)
50 m
PES 99 c)
50 m
COPES 979-05 b)
50 m
d) PES 97 + PES 99
39
0
20
40
60
80
100
120
140
47 52 57 62
Nu
clei
im
m2
Temperature (ordmC)
PES 97
PES 99
COPES 979-050
0
5
10
15
20
25
30
35
0 20 40 60 80
Time (min)
Sp
heru
lite
Rad
ius
( m
)
T = 53 ordmC
T = 52 ordmC
T = 515 ordmC
T = 51 ordmC
T = 506 ordmC
0
5
10
15
20
25
30
35
40
45 50 55 60
Gro
wth
Rate
(micro
mm
in)
Temperature (ordmC)
PES 99
PES 97
COPES 979-050
(microm
)
a)
b)
c)
FIGURE 8
Diacuteaz et al
40
FIGURE 9
Diacuteaz et al
PES 99
PES 97
COPES 979-050
41
FIGURE 10
Diacuteaz et al
FIGURE 12
Diacuteaz et al
42
0 02 04 06 08
I q
2(a
u)
q (nm-1)
PES 99
PES 97
COPES 979-05
0
200
400
600
800
108 128 148 168 188
I (a
u
)
q (nm-1)
PES 99
PES 97
COPES 979-05
a)
b)
0370 nm
0372 nm
0373 nm
0414-0413 nm
FIGURE 11
Diacuteaz et al
43
FIGURE 12
Diacuteaz et al
0
5
10
15
20
25
22283440465258
Temperature (ordmC)
Sp
acin
g (
nm
)
b) a)
PES 97
COPES 979-050
PES 99
Lγ
Lγ
Lγ

43
FIGURE 12
Diacuteaz et al
0
5
10
15
20
25
22283440465258
Temperature (ordmC)
Sp
acin
g (
nm
)
b) a)
PES 97
COPES 979-050
PES 99
Lγ
Lγ
Lγ