reinventing maintenance lean maintenancelean...
TRANSCRIPT

8th8Reinventing Maintenance
Lean MaintenanceLean MaintenanceApril 27, 2011April 27, 2011
P t d bPresented by:
Kelton Chertow and Boyd IncKelton, Chertow and Boyd Inc.
KCB KELTON, CHERTOW & BOYD INC.KCB KELTON, CHERTOW & BOYD INC.
Agenda
Lean: What it is and what it is not
The case for Lean in Maintenance
The 8 forms of waste
Lean Principles
The Lean Improvement Cycle: 3 Key Behaviours
Lean Tools & Techniques
L R dLean Roadmap
Conclusion

What Lean Is
A th t d i i d l t th tA process that drives increased value to the customer
Lean simplifies work, eliminates waste, reduces costs & improves asset utilization
A way of holding ourselves accountable to the goals we have set out to achieve
PUT SIMPLY:
Lean is about focusing your efforts on what adds valueto the customer, by focusing your attention on eliminating , y g y gwhat does not.

What Lean is NOT
It’s NOT about reducing headcountIt s NOT about reducing headcount.
It’s NOT a flavour of the month or fad
It’s NOT an initiative or projectp j
It’s NOT a short term fix
If you’re going to adopt Lean as your operatingIf you re going to adopt Lean as your operating philosophy, you need to provide AMNESTY to your
people

The case for Lean in Maintenance
Capacity Assurance: Maintenance Excellence as a core competency
Competitive Advantage:
Increased throughput
Improved yields
Increased savings
Improved labor productivity
Reduced working capitalReduced working capital
Improved safety
Build the Business Case, Merchandise it, and MANAGE to itMANAGE to it

Lean Objectives
In most processes, a small percentage of total time spent is actually on what is perceived as value by a customer.
Time
RawMaterials
FinishedGoods
e
90-95% 5-10%
Value Add d Ti LEAN Activities
concentrate here
Traditionalimprovement activities
concentrate hereNon-Value Added Time
Added Time
Typically, companies concentrate on decreasing the 5-10% of “value added activity” by working harder, rather than attacking the 90% of “non-value added” (NVA) activity and working smarter.
Lean focuses on reducing/eliminating NVA
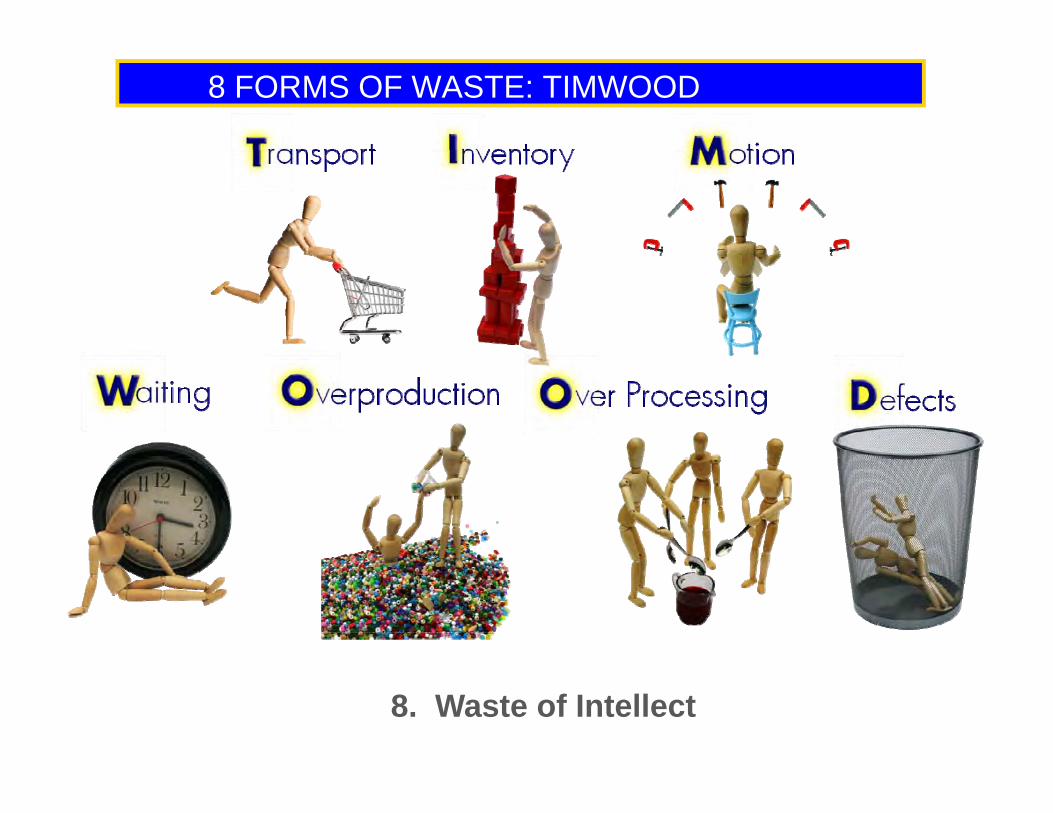
8 FORMS OF WASTE: TIMWOOD
8. Waste of Intellect

Is there waste in your backyard?
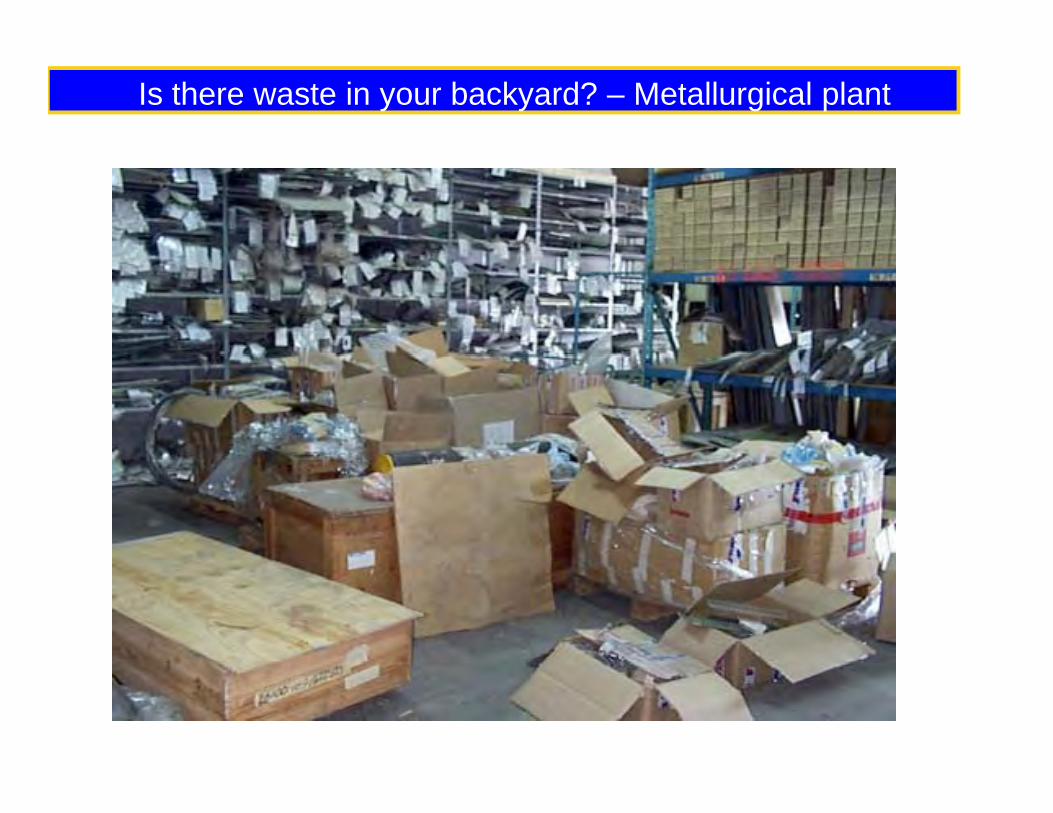
Is there waste in your backyard? – Metallurgical plant

Is There Waste in Your Backyard? A mine storehouse
Wing ReworkHand-off Statistics
T t l H d ff 62
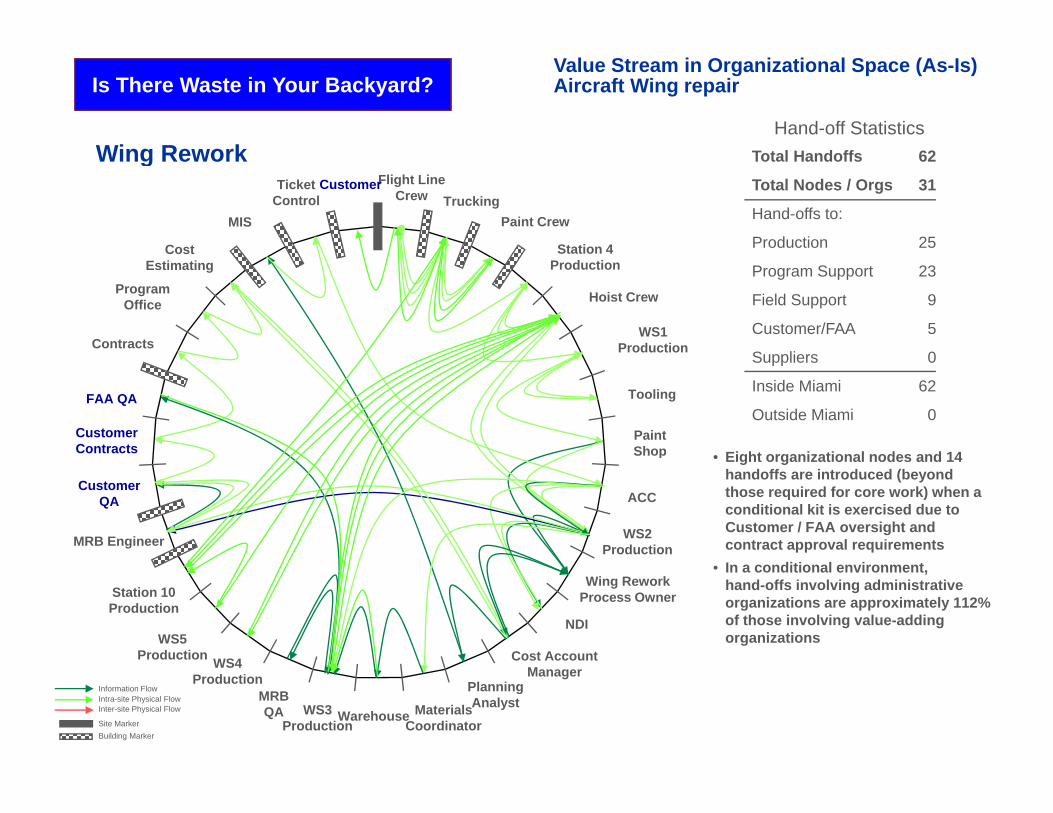
Value Stream in Organizational Space (As-Is)Aircraft Wing repairIs There Waste in Your Backyard?
Wing Rework Total Handoffs 62
Total Nodes / Orgs 31
Hand-offs to:
Production 25
Flight Line Crew Trucking
Paint Crew
Station 4
MIS
Ticket Control
Customer
CostProgram Support 23
Field Support 9
Customer/FAA 5
Suppliers 0
Station 4 Production
Hoist Crew
WS1 ProductionContracts
Program Office
Cost Estimating
• Eight organizational nodes and 14
Suppliers 0
Inside Miami 62
Outside Miami 0Tooling
Paint Shop
FAA QA
CustomerContracts • Eight organizational nodes and 14
handoffs are introduced (beyond those required for core work) when a conditional kit is exercised due to Customer / FAA oversight and contract approval requirements
p
ACC
MRB Engineer
Customer QA
WS2 Production
• In a conditional environment, hand-offs involving administrative organizations are approximately 112% of those involving value-adding organizations
Wing Rework Process Owner
NDI
Cost Account WS5
Production
Station 10 Production
WS4 ManagerPlanning AnalystMRB
QA Warehouse Materials Coordinator
WS3 Production
WS4 Production
Intra-site Physical FlowInformation Flow
Inter-site Physical Flow
Site MarkerBuilding Marker

Lean Principles, Tools & Techniques
LEAN WORK METHODS Tactical shop-floor policies used to implement Lean
• Product-orientedd ti
• U-shaped lines
PULLEverything produced at the rate of production of the final product -- “pull” production control
production• Standard work• Visual control• Good housekeeping/5S • Set-up time reduction• Total preventive maintenance
• Autonomation• Line stops and andons• Error proofing
• Just-In-Time production and delivery • Linked production at Takt time• Kanbans• Level scheduling• Machines available on demand
• Education and development
• Flat organizations• Decentralized
ORGANIZATION & CULTUREProgressive employee relations and change leadership
• Workplace safety • Multi-skilled, flexible
workforce• Worker job security
FLOWMaximizing value by producing only what is desired in the shortest time possible with the least resources
• Single piece flow• Physically and visually linked operations• Consolidated operations
management• Improvement incentives• Simplified and standardized processes
PURSUING PERFECTIONContinuous improvement attitude and empowerment
• Kaizen events and continuous improvement
SOURCING & SUPPLIER INTEGRATIONPartnership between supplier and producer
• Fewer better managed Kaizen events and continuous improvement • Self-inspected quality, not inspected in quality • Process ownership and responsibility• Advanced quality concepts and measures
– Hardware Variability Control (HVC)– Statistical Process Control (SPC)
Fewer, better managed suppliers
• Quality at the source• Shared destiny
relationships• Supplier development
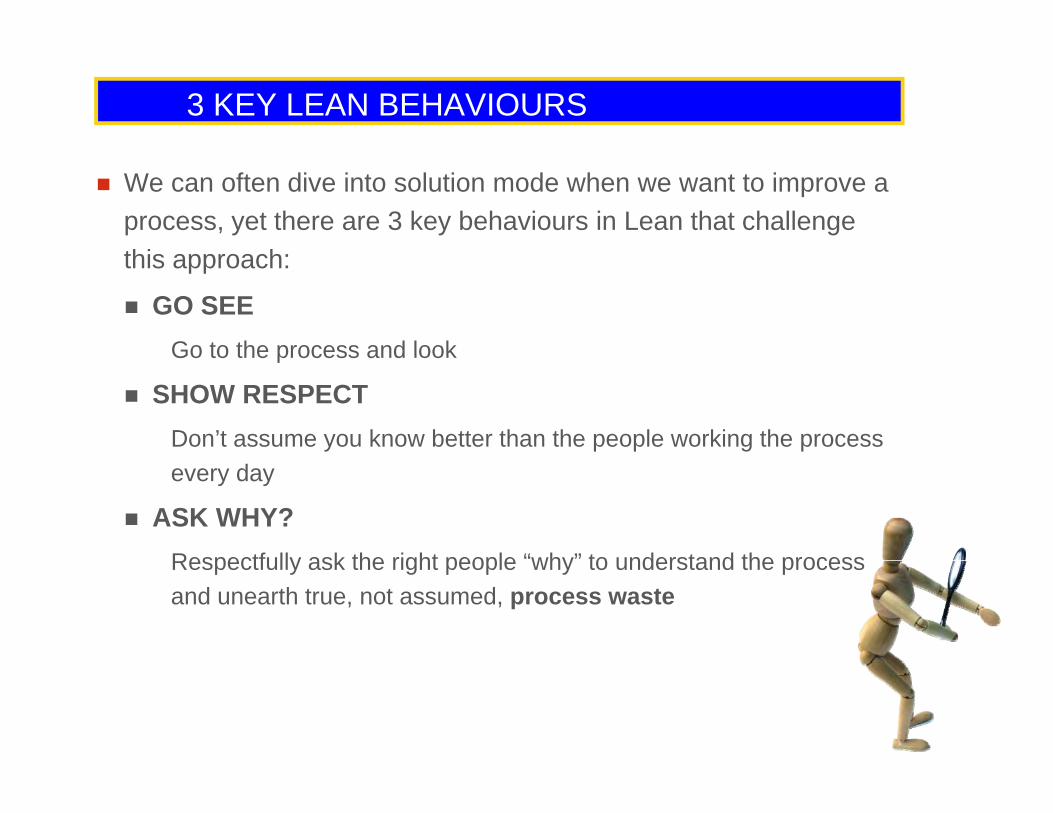
3 KEY LEAN BEHAVIOURS
We can often dive into solution mode when we want to improve a process, yet there are 3 key behaviours in Lean that challenge thi hthis approach:
GO SEEGo to the process and lookGo to the process and look
SHOW RESPECTDon’t assume you know better than the people working the process every day
ASK WHY?Respectfully ask the right people “why” to understand the processRespectfully ask the right people why to understand the process and unearth true, not assumed, process waste
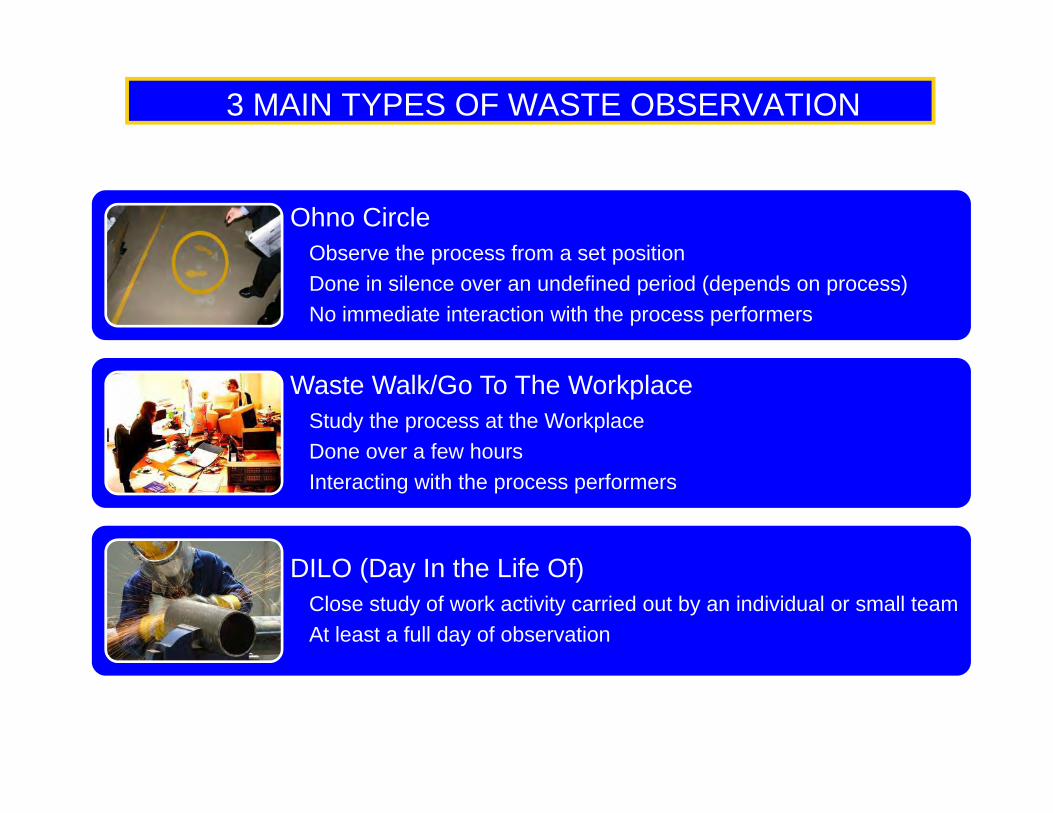
3 MAIN TYPES OF WASTE OBSERVATION
Ohno CircleObserve the process from a set positionObserve the process from a set positionDone in silence over an undefined period (depends on process)No immediate interaction with the process performers
Waste Walk/Go To The WorkplaceStudy the process at the WorkplaceDone over a few hoursDone over a few hoursInteracting with the process performers
DILO (D I th Lif Of)DILO (Day In the Life Of)Close study of work activity carried out by an individual or small teamAt least a full day of observation

GO TO GEMBA (Waste Walks)
THINK OF TIMWOOD
Forget the conference room, gather around Gemba. If the issue is core plug permeability, gather around the core! If the issue is
iti f t ti t IPSM d l t th t !waiting for computer time to run IPSM model, go to the computer! If the issue is on the Platform, go to the Platform!
The employees that are closest to the issue are at Gemba. U th i i d i d Th T MUST BUse their experience and wisdom. The Team MUST Be involved in business problem solving – and – Continuous Improvement. B i f lf t G b ill b tt d t dBy seeing for yourself at Gemba, you will better understand the process, arrive at the root cause and formulate a solution.
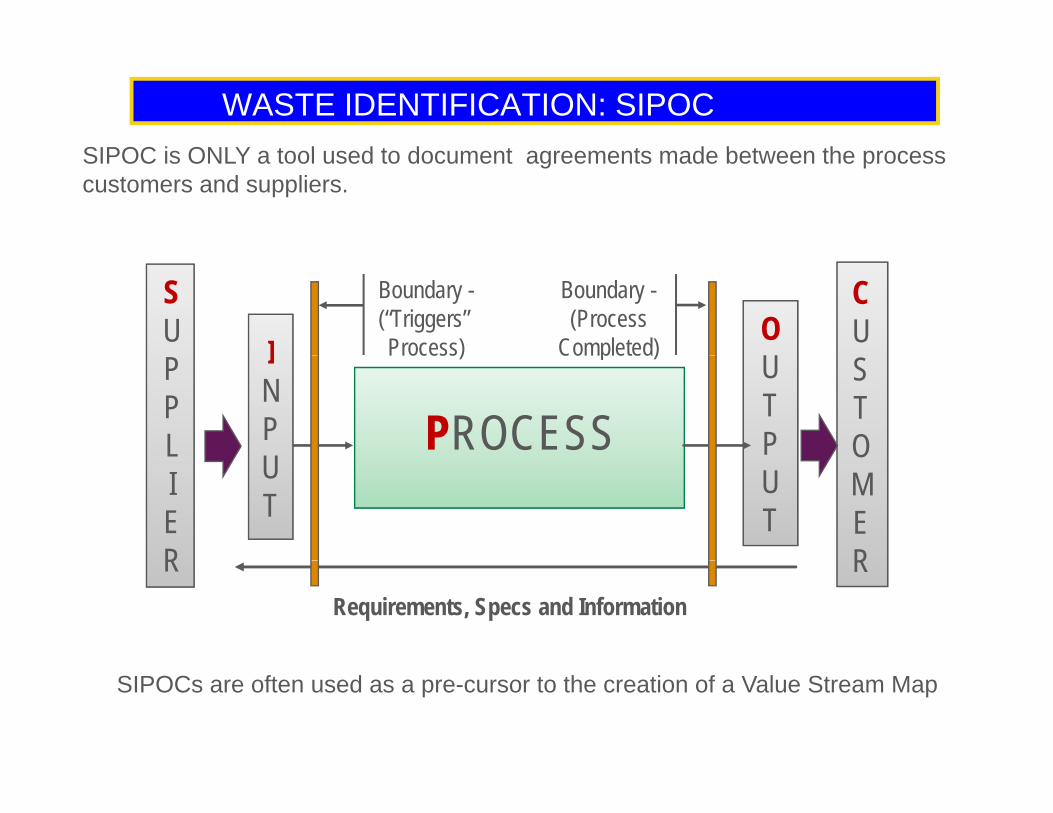
WASTE IDENTIFICATION: SIPOCSIPOC i ONLY t l d t d t t d b t thSIPOC is ONLY a tool used to document agreements made between the process customers and suppliers.
OU
CU
SU I
Boundary -(“Triggers” Process)
Boundary -(Process
Completed)UTPPROCESS
STO
PPL
INPU
Process) Completed)
UT
MER
IER
UT
RRequirements, Specs and Information
R
SIPOCs are often used as a pre-cursor to the creation of a Value Stream Map

VALUE STREAM MAPPING
A series of steps and processes including people, materials, information and equipment designed to bring a product or service to the customer.
In a Lean Organisation:The process steps are interconnected and not separated, all elements focus their part in the end-to-end process. Performance focus is on the end to end process. The customer creates the demand (pull).Improvement activity is looked at “end-to-end”.p y
CU
S STO
ME
RPicking
Order Processing Packing
PaymentsDespatch
UP
PLI
ER
S
Receiving
SS
U
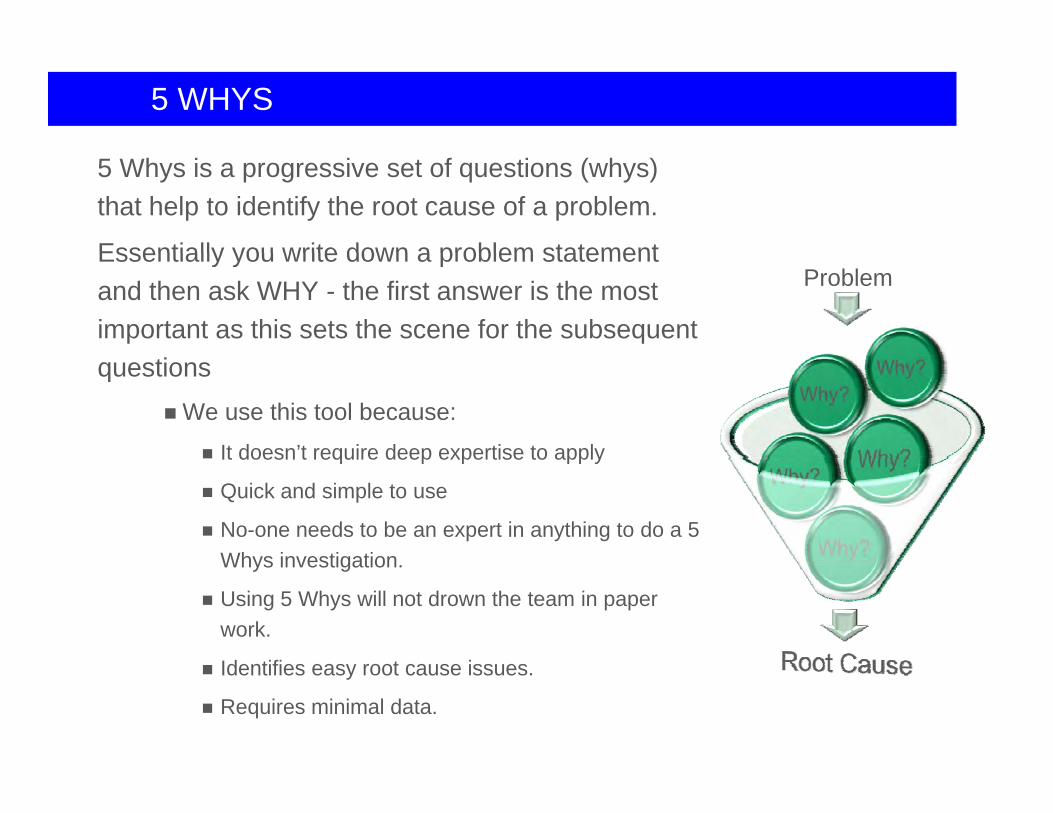
5 WHYS
5 Whys is a progressive set of questions (whys) that help to identify the root cause of a problem.
Essentially you write down a problem statementEssentially you write down a problem statement and then ask WHY - the first answer is the most important as this sets the scene for the subsequent
Problem
questionsWe use this tool because:
It doesn’t require deep expertise to applyIt doesn t require deep expertise to apply
Quick and simple to use
No-one needs to be an expert in anything to do a 5 Whys investigationWhys investigation.
Using 5 Whys will not drown the team in paper work.
Id tifi t iIdentifies easy root cause issues.
Requires minimal data.
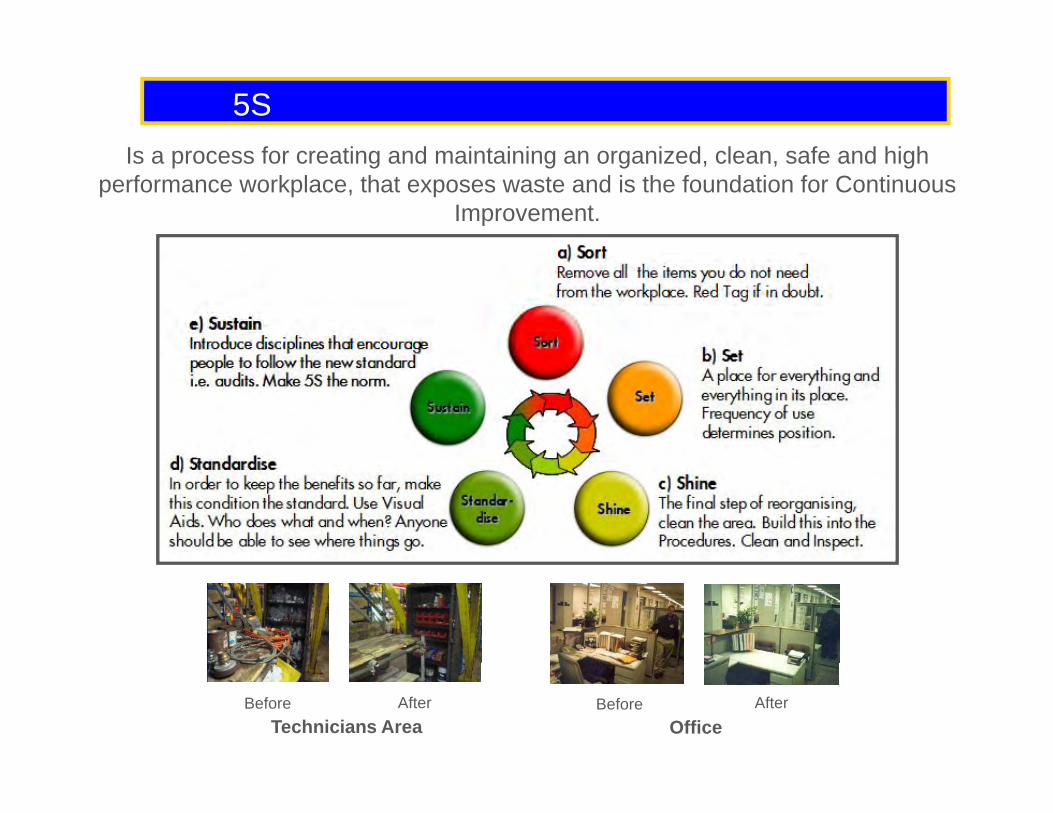
5SI f ti d i t i i i d l f d hi hIs a process for creating and maintaining an organized, clean, safe and high
performance workplace, that exposes waste and is the foundation for Continuous Improvement.
Technicians Area OfficeBefore After Before After

SPAGHETTI DIAGRAM
A i l i l t l t ti i l t d t ithi U d id l tA simple visual tool to optimise layouts and steps within a process: Used widely to identify two types of wastes: Transport and Motion.
Start Finish
Start Finish
Distance Walked = 45 metres Distance Walked = 12 metres
Miles Driven = 196 Miles Driven = 112Waiting Time = 23 Hrs Time at Site = 25hrs
Spaghetti Diagrams can be used anywhere, in an office, workshop or worksite.
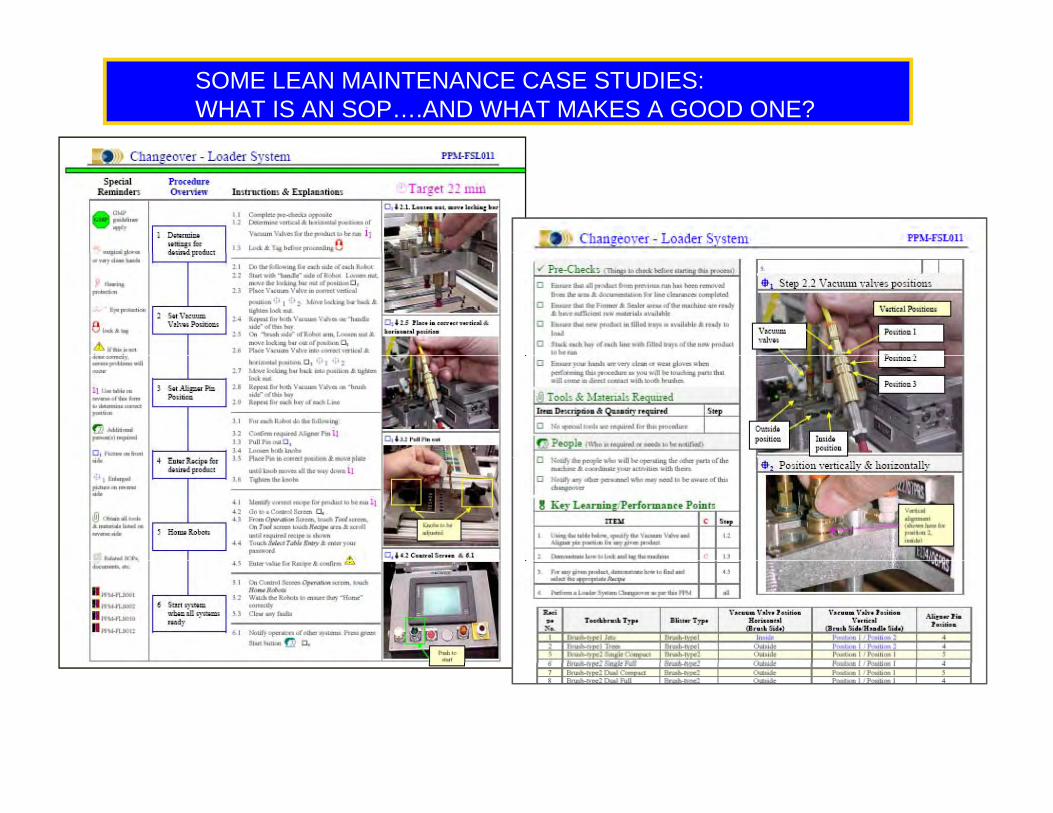
SOME LEAN MAINTENANCE CASE STUDIES:WHAT IS AN SOP….AND WHAT MAKES A GOOD ONE?
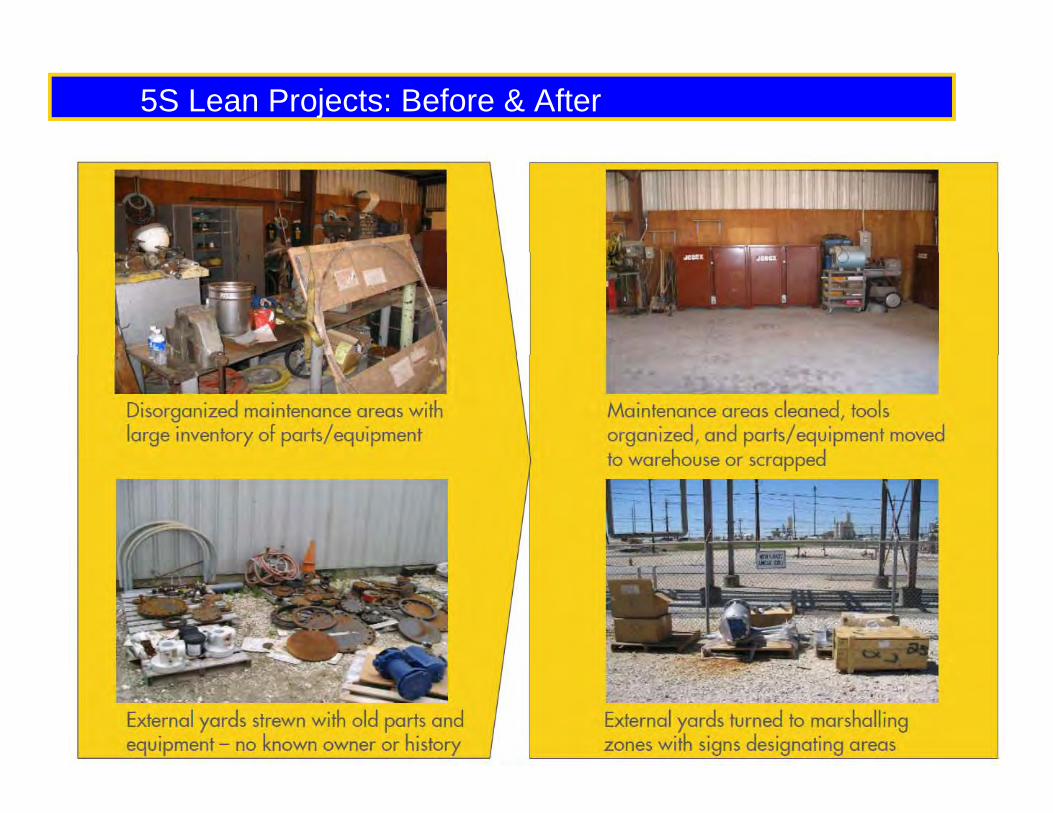
5S Lean Projects: Before & After
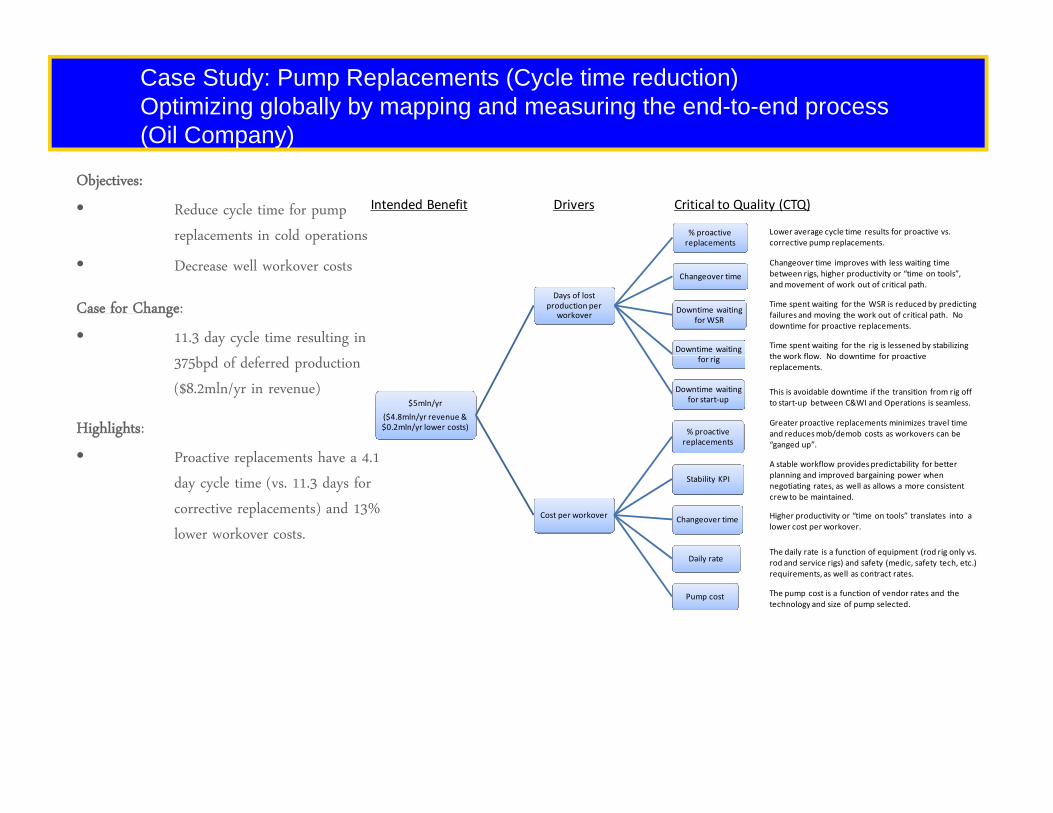
Case Study: Pump Replacements (Cycle time reduction)Optimizing globally by mapping and measuring the end-to-end process (Oil Company)
Objectives:
• Reduce cycle time for pump
replacements in cold operations % proactive replacements
Intended Benefit Drivers Critical to Quality (CTQ)
Lower average cycle time results for proactive vs. corrective pump replacements.
• Decrease well workover costs
Case for Change:
• 11.3 day cycle time resulting in
Days of lost production per
workover
Changeover time
Downtime waiting for WSR
Downtime waiting
Changeover time improves with less waiting time between rigs, higher productivity or “time on tools”, and movement of work out of critical path.
Time spent waiting for the rig is lessened by stabilizing the work flow No downtime for proactive
Time spent waiting for the WSR is reduced by predicting failures and moving the work out of critical path. No downtime for proactive replacements.
375bpd of deferred production
($8.2mln/yr in revenue)
Highlights:
• Proactive replacements have a 4 1
$5mln/yr
($4.8mln/yr revenue & $0.2mln/yr lower costs)
for rig
Downtime waiting for start‐up
% proactive replacements
This is avoidable downtime if the transition from rig off to start‐up between C&WI and Operations is seamless.
the work flow. No downtime for proactive replacements.
Greater proactive replacements minimizes travel time and reduces mob/demob costs as workovers can be “ganged up”.
Proactive replacements have a 4.1
day cycle time (vs. 11.3 days for
corrective replacements) and 13%
lower workover costs.Cost per workover
Stability KPI
Changeover time
Daily rate
A stable workflow provides predictability for better planning and improved bargaining power when negotiating rates, as well as allows a more consistent crew to be maintained.
Higher productivity or “time on tools” translates into a lower cost per workover.
The daily rate is a function of equipment (rod rig only vs. d d i i ) d f t ( di f t t h t )Daily rate
Pump cost The pump cost is a function of vendor rates and the technology and size of pump selected.
rod and service rigs) and safety (medic, safety tech, etc.) requirements, as well as contract rates.
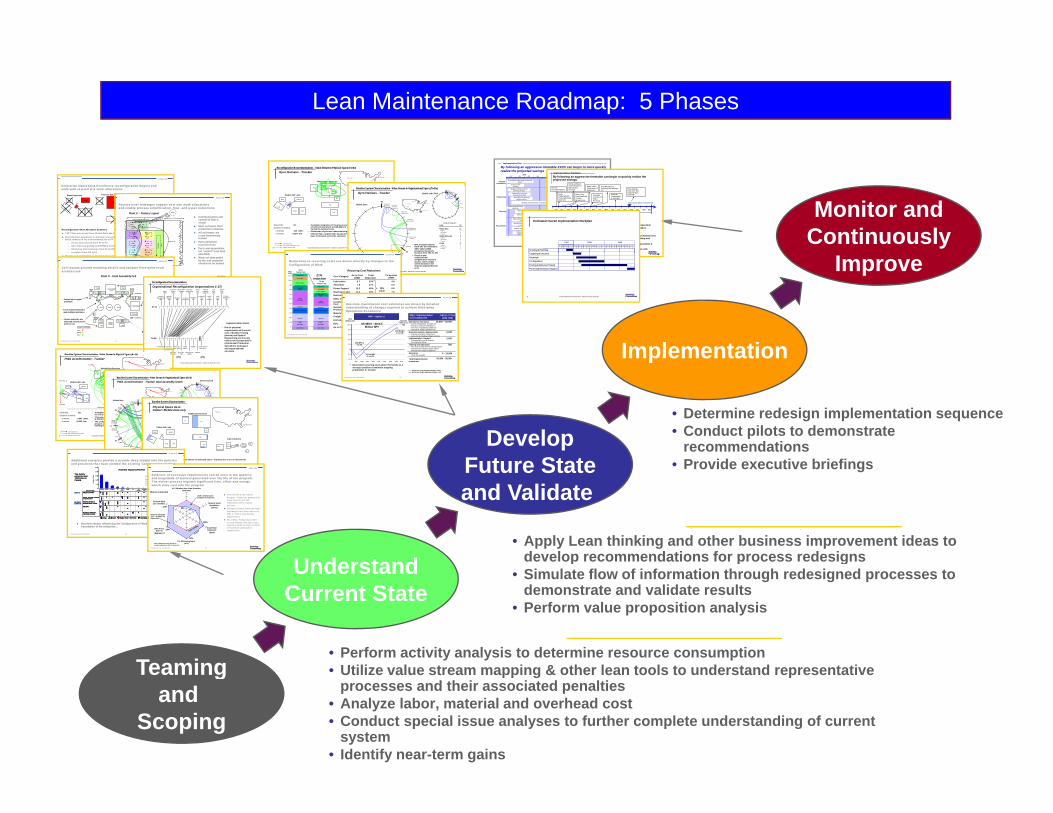
Lean Maintenance Roadmap: 5 Phases
Monitor andContinuously
4 June 01
Enterprise Operations Excellence reconfiguration begins and ends with revised site work allocations
First-tier Subcontractor
PF
PIPlant C
PD
PG
Alouez
INV
FXR
RVS
BLD
Customer
A2
A/FA1
Blockhouse
Site SupportSilo
Prime Contractor
PM
F AST Test was moved from Global Salt Lake to CCAS
All production operations in Garrison are located in PC except vibration testing which remains in the environmental lab at PF
– Hi-vac and leak test from PF to PC– Gyro Harness potting and DITMCO from PD to PC– Receiving and inspection from PI and PD to PC– Inventory from PG to PC
Reconfiguration Work Allocation Summary
4 June 01
Communication and control of flow is visualEach cell owns their production scheduleAll cell teams are cross-functionally trained Parts delivered to point of use Parts and assemblies are “pulled” from final
Factory level redesigns support new site work allocations and enable process simplification, flow, and asset reductions
POWER SUBASSY
OTHER SUBASSY
BOARD BOARD
BOARD COMPONENT
UPSC
REE
NING
MAJOR
2100 ft2 3500 ft2
3700 ft2 3700 ft2
3700 ft2 3700 ft2 12,0
00 ft
2
FINAL
200’
250”
200’
50’
SEPAR ATE FOUND ATION - RAISE D NYOOR200’
Vibration
EXISTING OFFICES
Plant C – Factory Layout
25 Fi ction al Informatio n for Demo On ly - Delo itte & T ouche Pr oprietary
Reconfiguration Recommendations - Value Stream in Physical Space (To-Be)
Hand Offs: 63Distance Traveled:
- Intersite: 210 miles- Intrasite: 6,655 feet
Gyro Harness - Tracker
• Complete integration of the process at one location (PC) eliminates 4,717 mi lesof intersite movement and 29,924 feet (5.6 miles) of physical intrasite movementduring the build process
• Elimination of process subcontracting removes 16+ days of cycle time• Cellular flow, coupled with visual pul l signals, result in addition of value at the
pace of demand, set by the customer
Mobile Data Garrison
PF
PCPC
PD
PG
Alouez
INV
Global Salt Lake
FXR
RVS
BLD
PM
Inter-Com pany P roduct fl owInformat ion f low
Intrasi te Product flow
Garrison Salt Lak e
LCape Canaveral
Cape Canaveral
A2
A/FA1
Blockhouse
Site S upportSilo
Baseline System Characterization - Value Stream in Organizational Space (To-Be)
Hand-off StatisticsTotal 20
Mobile Data 11 Support 4 Production 5 Test ing 2
Global Salt Lake 5 Support 5 Production 0 Test ing 0
CCAS 4 Support 2 Production 1 Test ing 1
Gyro Harness - Tracker
G arr is on
D a llas Salt Lak e
Ann A rbor
L
Sun ny v ale
Cape CanaveralLPens ac ola
L
Mobile Data
Global and CCAS
• 83% of organizationalhand-offs are eliminated,while value-addedproduction hand-offsincrease from 19% to 30%
PC
PF
Product ionP lanning Prod Ops -
Board &Component
Prod Ops -Maj or & Final
Confi gurat ionManagem ent
UpscreeningQuali ty
S hipping
D i
Prod Ops -SubAssembly
Prog ramMana gementConfiguration
ManagementSy s tem s
Engineering
Plannin g
Serv iceCenter
Tes ting
Insta l lation
3
By following an aggressive timetable XXXX can begin to more quickly realize the projected savings
Implementation Plan
Consolidate Upper Stage and Booster VSOs
Engage a sustain-oriented business strategy
Q2 Q3 Q4 Q1 Q3Q1 Q2 Q42002 2003
Implement a concurrent engineering strategy
Reconfigure engineering release process
Develop and implement an integrated information strategy
Implement IPT structure
Isolate schedule change decisions
Reduce production system sensitivity to schedule changes
Improve supplier interfaces
Initiate actions to reduce supplier contract costs
Simplify internal procurement processes
Align procurement organization and VSOs
Program Architecture
Engineering
Planning
Procurement
Reconfigure planning process
Plan, Build, Deploy Execute
Legend
DependenciesProgram Architecture
Engineering
Planning
Procurement
By following an aggressive timetable can begin to quickly realize the projected savings
Near-Term Activities• Define roles and responsibilities of
implementation management team• Perform detailed implementation planning• Define new organizational structure• Begin planning policy reconfiguration
recommendations• Train, educate, and communicate• Order long lead facility/equipment
requirements
Longer-Term Activities• Begin Building 5-2 facility preparation• Implement policy reconfiguration
recommendations• Re-deploy production • Establish Production Control mechanisms
within and between 717 Building and remaining monuments
• Reconfigure & relocate subassembly & assembly
• Relocate and align fabrication with subassemblies/assembly
Implementation Timetable
Oct Nov Dec Jan MarSep Feb Apr May Jun Jul Aug NovSep Oct Dec
2000 2001
Begin Facility Preparations of Building 5-2
Define and Begin Implementation of Management Structure
Order Long Lead Equipment / Facility Requirements
Receive Recommendations
Begin Implementation Planning/Develop Objectives
Complete Planning Of Policy Revisions
Relocate/Align Fabrication with Subassembly & AssemblyRelocate
Subassembly & Assembly
Start Relocation of Programs from Building 5-2
Approximate delivery of shipset 100
Estimated Overall Implementation Workplan
010203040506070809101112
1998
010203040506070809101112
1998
010203040506070809101112
1999
Scoping & Planning
T ti &Vi i i
1997
Implementation
Improve25Proprietary and Confidential
Inventory from PG to PCProcess sub-contracting is moved in-house to PC
25Proprietary and Confidential
assembly Work not demanded by the end customershould not be started
* flow shown for representative part
SMT
3700 ft2 3700 ft2
4600 ft2 SHIPPING
DOCK
MAGN
ETIC
SO
PTIC
S70
0 ft2
600
ft2
20’
20’
25Proprietary and Confidential
4 June 01
• Andon lights signal problems
•Equipment is dedicated to the cell production
•Cross train ed operators man multiple machines
• Vendor materials are delivered d irectly to the point of use
• Kanbans pull mater ials through assemb ly and drive shop floor scheduling
Vacuum ChamberEC-9 MEM
GCULRUTs
Thermal Chamber
IUS Center
Leak TestChamber
Bench
KanbanRack
Parts
Parts
Bench Oven
Parts
Bench
Bench Oven
PartsParts
Bench
Purge/Pressure
Purge/Pressure
INULRUTs
Stock Stock Stock
PartsKanban
Rack
Bench Oven Bench
Vibration(P6)
Asse ssm ent of d i ffi cu lty to move from current si tuat ion
Hard =
Medium =
Easy =
Plant C - Final Assembly Cell
Cell layouts provide enabling details and validate Enterprise-level architecture
Organizational Reconfiguration (organizations 1-17)Reconfiguration Recommendations
As-Is
Buyer(PD)
MaterialAnalysis
(PC)
ProductionControl
(PC)
Disp atch(PC)
Board Test(PC)
Wave Solder/ P otting
(PC)
P rocessS ubcon tract
S ub AssyS upervising
(PC)
Inspectio n(PC)
P roductionE ng(PC)
MaterialHandl in gCrib (P G)
DeviceTest
(PC,PF )
S ubAssy.(PC)
OpticalE ng.(PC)
FinalAssy.(PC)
To-Be
P rocurement
P roductionPlann ing
Prod. Op s. S MT
Config.Mg mt.
S uppl ier
S hippin g
• Due to physicalrequirements of the workarea, Vibration Testing(device) and OpticalEngineering are the onlynodes not incorporated inmainstream ProductionOperations workspaceand organizationalstructure
Implementation Notes
ContractManagement
(PC)
E nviro nmentalOper ations
P rod. Ops.Board &
Component
Prod. Op s.Sub Assy
Prod. Op s.Major & Final
Upscreening Qual ity
E nviro n.Oper ations
(PF)
26 Fiction al Informat io n for Demo On ly - Delo itte & T ouche Pr oprietary
Inter-Company Product fl owInformat ion f low
Intrasi te Product flow
increase from 19% to 30%• Physical and
organizationalsimplification results inshorter, more reliablecommunications andreduces opportunities forerror
DeviceTest
Courier
27Proprietary and Confidential
4 June 01
CostUS$M
0
20
10
30
40
50
60
70
80
90
100
110 Fabrication
Assembly
Direct Support
Overtime Pre miu m
Outside Pro ductio n
Material
Freight
Other Direct
Exchange
Other Direct
To-beYearly Cost
21% reduction
OtherOverhead
Material
Freight
Exchange
Reductions to recurring costs are driven directly by changes to the Configuration of Work
As-isYearly Cost
Recurring Cost Reductions
Cost Category As-is Cost US$M
To-be Cost
To-be Cost US$M
TotalReduction
6.7Fabrication 27% 4.97.9Assembly 27% 5.8
12.3Direct Support 45% 6.8
1.4Overtime Premium 48% .711.3Overhead Labor 30% 7.9
13.6Outside Production
4% 13.1
18.7Material 2% 18.31.1Freight 0% 1.1
(5.3)ODC --% (5.3)10.1Exchange --% 10.1
$ 113.6As-is Cost $ 89.2
31.7Other Overhead 25% 23.8Inventory Carrying Cost
4.0 50% 2.0
Outside Pro ductio n
OtherOverhead2
OverheadLabor
OverheadLabor
Overtime Pre miu mDirect Support
Assembly
Fabrication
InventoryInventory
34% Labor
2% Material &
Other
28% Non-labor Overhead
4 June 01
One-time investments cost estimates are driven by detailed understanding of changes required to achieve Enterprise Operations Excellence
Option 2 Cost(US$ ’000)
Operational Tran sition• Cost for modifications to D2/D3, line
relocation, tooling and equipment movement, wing buildup, production interruption, utilities connection, etc.
Business Systems Improvement• Estimate of systems infrastructure
improvement including software purchaseImplementation Support• Estimated labor cost for detailed
reconfiguration design Training and Education• This costs includes fees for training material
and instruction related to organizational redesign and change management
Severance• Costs due to layoffs
15,000 – 19,000
6,645
1,200
550
0 - 11,000
NPV – Option 2 Major Implementation Cost Categories
NPVMillion US$
-20
0
20
40
60
80
100
-$11.1M NPV
$89.5M NPV at set 485
US $89.5 – $104.6 Million NPV
$104.6M NPV at set
485
$4M NPV at set 200
27
32 Fictional Informatio n for Demo On ly - Delo itte & T ouche Pr oprietary
Targeting & Visioning
Redesign
Configuration
Testing & Delivery, Phased
Post Implementation Support
Baseline System Characterization - Value Stream in Physical Space (As-Is)
• Determine redesign implementation sequence• Conduct pilots to demonstrate
recommendations
Implementation
DevelopF t St t
27 Fiction al Informatio n for Demo On ly - Delo itte & T ouche Pr oprietary
(PC) (PF)
32Proprietary and Confidential
Costs due to layoffs
Total ImplementationInvestment
Decreased recurring costs place the facility in a stronger position to maintain ongoing production in Toronto
23,395 - 38,3952001 2002 2003 2004 20072005 2006 2008 2009
-40
at set 200
Assumes low implementation c ostAssumes hi gh i mple mentati on c ost
9 Fiction al Informatio n for Demo On ly - Delo itte & T ouche Pr oprietary
Hand Offs: 131Distance Traveled:
- Intersite: 3,993 miles- Intrasite: 19,539 feet
24 23 22 21 20 19 18 17 16 15 14 13 12 11 10 9 8 7 6 5 4 3 2 1 Months to Ready
PWA Accelerometer - Trackery y p ( )
• At Mobile Data, the PWA travels 17,380 feet through five buildings, and travels tothe crib 2 times
• “Process-vil lage” production at all build levels results in 110 physical hand-offsat Mobile Data
• The configuration of work leads to friction in the system - long cycle time, largeamounts of WIP, substantial resources to serve the configuration, complicatedtracking and scheduling, and disrupted flow
Mobile Data Garrison
PF
PIPC
PD
PG
Alouez
INV
Global Salt Lake
FXR
RVS
BLD
PM
To CCAS
From MD - G
Inter-Com pany P roduct FlowInformat ion F low
Intrasi te Product Flow
CapeOps
GP SS alt L akeMo bile Data
Cape Canaveral
A2
A/FA1
Blockhouse
Site S upportSilo
To GPS Garrison
Salt Lake
LCape Canaveral
11 Fi ction al Informatio n for Demo On ly - Delo itte & T ouche Pr opri etary
Baseline System Characterization - Value Stream in Organizational Space (As-Is)
I nter-Com pany Produc t FlowI nformat ion F low
I ntrasi te Produc t Flow
Prog ramMa nag e me nt
Con fi gur ati o nMa na ge me nt
Sy s tem s Eng inee rin g
Plan nin g
Prod uc ti o nEn gin ee ring
Prog ram Pla n ner
Buy Part Pla n ner
Buy e r
Te s tin gO pe rati o ns
Tra n sp o rta ti on
M iss ionSu c ce s s &
Prod u ctAs s ur anc e
Softwa reTe s tin g
Te sti n gQ ua l i ty
Tes t Co n du ctor
Se rv iceCe n ter
Re ce ivin g
Disp atc h
Elec tr ica lLe a d
In spe c tio n
Sys temEng inee r
Elec tr ica lTe c hn ic ian s
Co urie r
PWA Accelerometer - Tracker total assembly levels
Hand-off Statistics
Total 109
Mobile Data - Garrison 71 Support 32 Produc tion 14 Testing 25Global - Salt Lake 27 Support 16 Produc tion 2 Testing 9CCAS 11 Support 8 Produc tion 3
GPS and CCAS
ContractManagement
MaterialAnalysis
ProductionControl
Dispatch
Inspection
Final Assembly
GPS Quality DeviceTest
Produc tionEngineering
Opt icalEngineering
Shipping
Buyer
MaterialHandling
MaterialHandlingReceiving
Traffic
MaterialHandling
Crib
EnvironmentalOperation
Sub Assembly
BoardTes t
PC
PD
PI
PG
PF
Mobile Data
DeviceTes t
• Hand-offs by supportorganizationsdominate for allorganizationsinvolved in theTracker value stream
• Duplicatefunctionali ty isrequired in multiplelocations becauseproduction activitiesare physically andorganizationallyseparate
G arri son
Sa lt L ak e
L Cap e Ca n ave ra l
Physical Space As-IsGlobal / Mobile Data only
Baseline System Characterization
= indicates utilization of space by Tracker
Garrison
Salt Lake
L
L
Cape Canaveral
Mobile Data Garrison
PF
INV
Global Salt Lake
RVS
BLD
PM
Cape Canaveral
A2
Blockhouse
S ite S upportSilo
Alouez
FXR
PI
PD
PG
PC
A/FA1
4 June 01
• Provide executive briefings
• Apply Lean thinking and other business improvement ideas to develop recommendations for process redesignsU d t d
Future Stateand Validate
8 Fiction al Informatio n for Demo On ly - Delo itte & T ouche Pr oprietary
• For production operations, Tracker has almost no dedicated space - all production occurs in functionallyoriented process villages
• As measured by “building activity” on the Garrison campus, Tracker uses an estimated 50,000 square feet forreceiving, inventory, production and testing
• From component receiving at Mobile Data to launch at CCAS, the Tracker travels through nine physicallyseparate buildings in three different cities
24Proprietary and Confidential
This facility generates over 10,000 jobs in Canada
0
2 ,000
4 ,000
6 ,000
8 ,000
10 ,000
Nu
mbe
r of J
obs
6, 16 4
3, 02 0
1, 06 216 224 3
3 9 1 1 1 0 0 0 0
Economic Impact by Province
* Minister of Foreign Affairs
** Minister of International Trade
*** Mini ster of Industry
**** Minister of Nati onal Defence
HO USE O F COMM O NS
FOR EI GN AFFAIRS & INTERNATIONAL TRADE
INDU STRY
NA TION AL DE FEN CE & V ET ER ANS A FFAIRS
ONTARIO QUEBEC M ANI TOBA BC NOVASCOTI A
ALBERTA PEI NEW BRUNS WI CK
NE WFOUND-LAND
SASKATCH-EWAN
NW TERRITORI ES
NUN AVUT YUKO N TE RRITORY
SENATE FOREIGN AFFAIRS
SOCIAL AFFAI RS, SCIENCE & TECHN OLOGY
*
COMMITTEES
Chair Minister Deputy-Chair / Vice-Chair Committee Member
**
***
****
This facility generates over 10,000 jobs in Canada
0
2 ,000
4 ,000
6 ,000
8 ,000
10 ,000
0
2 ,000
4 ,000
6 ,000
8 ,000
10 ,000
Nu
mbe
r of J
obs
6, 16 4
3, 02 0
1, 06 216 224 3
3 9 1 1 1 0 0 0 0
Economic Impact by Province
* Minister of Foreign Affairs
** Minister of International Trade
*** Mini ster of Industry
**** Minister of Nati onal Defence
HO USE O F COMM O NS
FOR EI GN AFFAIRS & INTERNATIONAL TRADE
INDU STRY
NA TION AL DE FEN CE & V ET ER ANS A FFAIRS
ONTARIO QUEBEC M ANI TOBA BC NOVASCOTI A
ALBERTA PEI NEW BRUNS WI CK
NE WFOUND-LAND
SASKATCH-EWAN
NW TERRITORI ES
NUN AVUT YUKO N TE RRITORY
SENATE FOREIGN AFFAIRS
SOCIAL AFFAI RS, SCIENCE & TECHN OLOGY
*
COMMITTEES
Chair Minister Deputy-Chair / Vice-Chair Committee Member
**
***
****
HO USE O F COMM O NS
FOR EI GN AFFAIRS & INTERNATIONAL TRADE
INDU STRY
NA TION AL DE FEN CE & V ET ER ANS A FFAIRS
ONTARIO QUEBEC M ANI TOBA BC NOVASCOTI A
ALBERTA PEI NEW BRUNS WI CK
NE WFOUND-LAND
SASKATCH-EWAN
NW TERRITORI ES
NUN AVUT YUKO N TE RRITORY
ONTARIO QUEBEC M ANI TOBA BC NOVASCOTI A
ALBERTA PEI NEW BRUNS WI CK
NE WFOUND-LAND
SASKATCH-EWAN
NW TERRITORI ES
NUN AVUT YUKO N TE RRITORY
SENATE FOREIGN AFFAIRS
SOCIAL AFFAI RS, SCIENCE & TECHN OLOGY
*
COMMITTEES
Chair Minister Deputy-Chair / Vice-Chair Committee MemberChair Minister Deputy-Chair / Vice-Chair Committee Member
**
***
****
Additional analyses provide a provide deep insight into the policies and practices that have yielded the existing Configuration of Work
Business issues influencing the Configuration of Work from beyond the boundaries of the enterprise…
38Proprietary and Confidential
4 June 01
IAT Vibration Nav Data Duration(minutes)
Terminal Input Impedance
(ohms)
Accel Bias/Hysterisis
(ppm)
Ch. 32 Analog Input(mV)
Gate Array Burn-In
(degrees C)
Attitude Shift(arc seconds)
125%
152%
139%
133%70%
60%
Evidence of excessive requirements can be seen in the quantity and magnitude of waivers generated over the life of the program.The waiver process requires significant time, effort and energy which drive cost into the program
Ov er the lif e of the Tracker Program, Global has granted 124 major waiv ers and has maintained 100% mission successVibration Duration Data and Input Impedance hav e been waiv ed at 60% to 70% of specif ication requirementsAccel Bias, Analog Input, Burn-ins and Attitude Shift hav e been waiv ed at lev els as high as 152% of maximum specif ication requirements
Waivers Granted
Note: Categories only shown for waivers impacting >5% of total units
Under minimum spec -available for reduction
Exceeds maximum spec - available for expansion
Spec (100%)
Actual
develop recommendations for process redesigns • Simulate flow of information through redesigned processes to
demonstrate and validate results• Perform value proposition analysis
• Perform activity analysis to determine resource consumption
UnderstandCurrent State
Teaming • Utilize value stream mapping & other lean tools to understand representative processes and their associated penalties
• Analyze labor, material and overhead cost• Conduct special issue analyses to further complete understanding of current
system• Identify near-term gains
Teamingand
Scoping
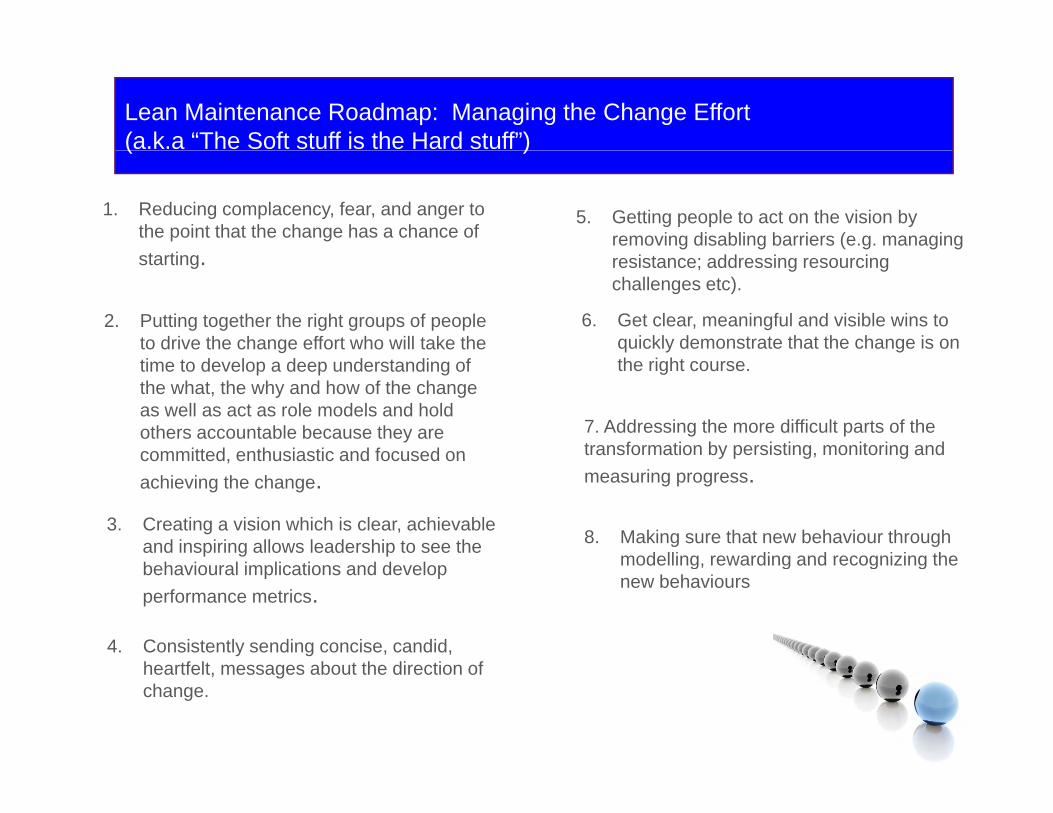
Lean Maintenance Roadmap: Managing the Change Effort(a.k.a “The Soft stuff is the Hard stuff”)
5. Enabling People to Act on the Vision and Strategies1. Creating Sufficient Urgency
1. Reducing complacency, fear, and anger to the point that the change has a chance of t ti
5. Getting people to act on the vision by removing disabling barriers (e.g. managing
( )
2. Developing Powerful Guiding Teams 6. Creating Short Term Wins
starting.
2. Putting together the right groups of people to drive the change effort who will take the
resistance; addressing resourcing challenges etc).
6. Get clear, meaningful and visible wins to quickly demonstrate that the change is on
7. Not letting up
time to develop a deep understanding of the what, the why and how of the change as well as act as role models and hold others accountable because they are committed enthusiastic and focused on
the right course.
7. Addressing the more difficult parts of the transformation by persisting, monitoring and
3. Setting the Right Direction8. Making the behaviour stick
committed, enthusiastic and focused on achieving the change.
3. Creating a vision which is clear, achievable and inspiring allows leadership to see the
y p g gmeasuring progress.
8. Making sure that new behaviour through modelling rewarding and recognizing the
4. Broadly Communicating Visions and Strategies
behavioural implications and develop performance metrics.
4. Consistently sending concise, candid, h tf lt b t th di ti f
modelling, rewarding and recognizing the new behaviours
s o s a d St ateg esheartfelt, messages about the direction of change.

Conclusion
Maintenance isn’t sexy. But for capital-intensive organizations, transforming the traditional function of maintenance into an integrated, strategic and fully supported process can spell the difference betweenstrategic and fully-supported process can spell the difference between a company that attracts new business and provides a competitive advantage, versus one doesn’t.
Without question, adopting Lean as your Maintenance Operating Philosophy will deliver significant benefits:
Increased throughput (revenue)Increased throughput (revenue)
Improvements in equipment availability & on-line time
Significantly lower operating costsSignificantly lower operating costs
Reduced working capital
Fewer safety incidents
…… and your people will have fun doing it!